2018 Second Quarter Results. August 3, 2018
|
|
|
- Christal Morrison
- 5 years ago
- Views:
Transcription

1 2018 Second Quarter Results August 3,


2 Disclaimer This presentation contains forward-looking statements within the meaning of the Private Securities Litigation Reform Act of 1995 (Reform Act). Forward-looking statements are based on our beliefs and assumptions and on information currently available to us, and include, without limitation, statements regarding our business, financial condition, strategy, results of operations, certain of our plans, objectives, assumptions, expectations, prospects and beliefs and statements regarding other future events or prospects. Forward-looking statements include all statements that are not historical facts and can be identified by the use of forward-looking terminology such as the words believe, expect, plan, intend, seek, anticipate, estimate, predict, potential, assume, continue, may, will, should, could, shall, risk or the negative of these terms or similar expressions that are predictions of or indicate future events and future trends. By their nature, forward-looking statements involve risks and uncertainties because they relate to events and depend on circumstances that may or may not occur in the future. We caution you that forward-looking statements are not guarantees of future performance and that our actual results of operations, financial condition and liquidity, the development of the industry in which we operate and the effect of acquisitions on us may differ materially from those made in or suggested by the forward looking statements contained in this presentation. In addition, even if our results of operations, financial condition and liquidity, the development of the industry in which we operate and the effect of acquisitions on us are consistent with the forward-looking statements contained in this presentation, those results or developments may not be indicative of results or developments in subsequent periods. Forward-looking statements speak only as of the date they are made, and we do not undertake any obligation to update them in light of new information or future developments or to release publicly any revisions to these statements in order to reflect later events or circumstances or to reflect the occurrence of unanticipated events. Factors that may cause our actual results to differ materially from those expressed or implied by the forward-looking statements in this presentation, or that may impact our business and results more generally, include, but are not limited to, the risks described under Item 3. Key Information D. Risk factors of our Annual Report on Form 20-F for the year ended December 31, 2017 which may be accessed through the SEC s website at You should read these risk factors before making an investment in our shares. This presentation contains a discussion of Adjusted EBITDA, a non-ifrs financial measure. We define Adjusted EBITDA as net earnings adjusted for certain items, as set forth in the reconciliation to the most directly comparable IFRS measure in the Appendix. Adjusted EBITDA is not a substitute for IFRS measures in assessing our overall financial performance. Because Adjusted EBITDA is not determined in accordance with IFRS, and is susceptible to varying calculations, Adjusted EBITDA may not be comparable to other similarly titled measures presented by other companies. Adjusted EBITDA is included in this presentation because it is a measure of our operating performance and we believe that Adjusted EBITDA is useful to investors because it is frequently used by securities analysts, investors and other interested parties in their evaluation of the operating performance of companies in industries similar to ours. Adjusted EBITDA has limitations as an analytical tool, and you should not consider it in isolation, or as a substitute for an analysis of our results as reported under IFRS as issued by IASB 2


3 Introduction PRESENTERS Joseph DiDomizio President & CEO Adrian Bartella Chief Financial Officer 3

4 On Today s Call: Driving Strong Organic Net Sales Growth Pursuing Ongoing Initiatives in Food & Beverage Expanding Our Footprint Optimizing Space and Productivity Capitalizing on the Whitespace Opportunity 4
5 1 SECOND QUARTER HIGHLIGHTS 5
6 Q Highlights Strong organic net sales growth of 8.2% 1 Like-for-like net sales growth of 4.5% (3.8% CC) Net new business and expansions in Ft. Lauderdale, Seattle, JFK, Vancouver, & Des Moines Gross profit margin expanded 170 bps 2 to 63.9% Successful vendor negotiations Ongoing positive sales mix shift Adjusted EBITDA growth of 51.4% (24.1% assuming reduced franchise fee in effect in 2Q17) Driven by higher gross profit and cost management Hudson s business model is unique We manage each of our terminals as one large store Strive to maximize passenger exposure and optimize penetration This ultimately drives organic net sales growth our key measure of success Lack of significant seasonality Note: All figures compared to Q See slide 21 for a description of organic net sales growth 2 70 bps attributable to Q as change in vendor terms retroactive to Jan 1,


7 7
8 2 OPERATIONAL UPDATE 8
9 Sales Breakdown by product category 2017 Q Q2 Watches, Jewelry, Accessories 7% Wine & Spirits 4% Electronics 5% Tobacco 3% Food & Beverage 36% 1 Watches, Jewelry, Accessories 6% Electronics 5% Wine & Spirits 4% Tobacco 3% Food & Beverage 38% 1 Other 8% Other 7% Literature 10% Literature 9% Fashion 13% Perfume & Cosmetics 14% Fashion 13% Perfume & Cosmetics 15% (1) The Food and Beverage category includes packaged snacks and candy, beverages and grab & go options, as well as sales from our quick service concepts 9


10 Expanding Food & Beverage F&B Sales Strong Overall F&B sales up 14% YoY Our grab and go segment up 53% Our proprietary Traveler s Best product line up 79% - beating our previous estimates F&B Initiatives Major Driver of Growth Expansion of our island coolers and grab & go offerings is increasing traffic and penetration in our stores Expanding open island cooler strategy We are seeing 3x higher grab & go food sales in stores with open island coolers 26 locations at the end of Q2 On track to have 45 installed by end of


11 Digital Development Milestones Expanding mobile payment options ApplePay, GooglePay and SamsungPay now available in all U.S. Duty Free stores Enabling multi-currency payments Customers can now pay in their home currency Streamlined payment systems Converted all our duty free stores to one point of sale system, removing previous legacy systems Making payments more efficient and getting our customers on their way faster 11
12 2018 YTD Wins and Extensions New Wins Extensions (1) + Expansions New Market Existing Market Existing Market Billy Bishop Toronto January 2018 Seattle-Tacoma Int l Airport March 2018 Clinton National Airport January 2018 Greater Rochester Int l Airport April 2018 Phoenix Sky Harbor Int l Airport March 2018 Pittsburgh Int l Airport March 2018 Burlington Int l Airport June 2018 Boston Logan Int l Airport April 2018 JFK Terminal 7 March 2018 Baltimore/Washington Int l Thurgood Marshall Airport June 2018 Orlando Int l Airport April 2018 LaGuardia Airport Terminal B June 2018 Denotes Q (1) An extension is defined as a continuation in the same market whether the Company won through an RFP process or extended an existing contract. 12


13 Store Openings Q2 2018: Los Angeles International Airport Pier No. 7 13

14 Store Openings Q2 2018: Spotlight on McCarran International Airport Rotunda - Before 14

15 Store Openings Q2 2018: Spotlight on McCarran International Airport Rotunda - After Future Store 15


16 Store Openings Q2 2018: Spotlight on McCarran International Airport Rotunda - After ATL LAS ATL FLL LAS LAS DF 16


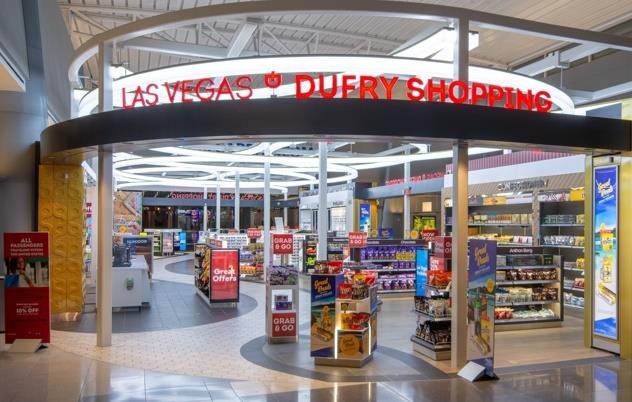


17 Store Openings Q2 2018: Spotlight on McCarran International Airport Duty Free Before After ATL LAS After ATL FLL LAS 17


18 After Before Store Openings Q2 2018: Spotlight on Hartsfield Jackson Atlanta International Airport FLL LAS 18
19 Strong Market Share with Room to Grow While we are in 24 of the top 25 airports, we are not in every terminal Top 25 airports represent ~59% of total N.A. travel retail market 1 We have significant room to grow sales, not only in travel retail but also in food & beverage, a category that is a natural extension of our business 100% 90% 80% 70% 60% 50% 40% 30% 20% 10% Top 25 Airports by Enplanements: Total Retail Square Footage 100% 90% 80% 70% 60% 50% 40% 30% 20% 10% Top 25 Airports by Enplanements: Total Retail + F&B square footage 0% % Hudson Whitespace Hudson Whitespace For illustrative purposes only. Revenue opportunities in particular airports may be limited by airport policies (1) Based on square feet available for retail and food & beverage operations Source: ARN, company data and N.A. airport data 19
20 3 FINANCIAL RESULTS 20
21 Financial Highlights Q Strong turnover growth 7.4% and 8.2% organic net sales growth 1 Turnover $ bps gross margin improvement 2 $ Q17 2Q18 Adjusted EBITDA growth QoQ of 51.4% (24.1% assuming lower franchise fee structure was in place in 2Q17) Adjusted EBITDA margin of 14.5% and 420 bps Adjusted EBITDA margin improvement (200 bps improvement pro forma) Adjusted EBITDA 3 $58.2 $10.5 $72.2 $47.7 2Q17 2Q18 Reported Margin 10.3% 14.5% Pro Forma Margin 12.5% (1) See reconciliation to Turnover in Appendix. Organic net sales growth represents the combination of growth from (i) like-for-like net sales growth and (ii) net new stores and expansions. Organic net sales growth excludes growth attributable to (i) acquired stores until such stores have been part of our business for at least 12 months and (ii) eight stores acquired in the 2014 acquisition of Nuance and 46 stores acquired in the 2015 acquisition of World Duty Free Group that management expected, at the time of the applicable acquisition, to wind down. (2) Includes 70 bps attributable to Q as change in vendor terms retroactive to Jan (3) For a reconciliation of adjusted EBITDA to net earnings for the periods presented see Appendix. 21
22 Net Sales Growth Components 2018 Growth components Quarterly evolution Net Sales growth components Q2'18 / Q2'17 Like for constant FX 3.8% Like for Like FX effect 0.7% Like for reported rates 4.5% Net new business 3.7% Organic reported rates 8.2% Acquired wind down stores -0.2% Reported Growth 8.0% Q2 18 Solid like for like results driven by healthy results in the US and continued growth in Canada, despite the Easter shift. Net new business includes new shops in Ft Lauderdale, Seattle, JFK, Vancouver, & Des Moines 9.1% 8.4% 9.4% 9.4% 8.2% 3.7% 0.2% 4.8% 4.7% 3.8% 3.9% 3.7% 8.2% 8.0% 4.5% 4.3% 3.7% 5.6% 5.5% 4.5% Like for Like Net new business Organic Growth Acquired wind down stores Reported Growth Q2'17 Q3'17 Q4'17 Q1'18 Q2'18 Like for Like Net new business (1) Percentages reflect the amount of sales growth attributable to like for like growth and net new business relative to the same period in the prior year (2) Acquired wind down stores consist of eight stores acquired in the 2014 acquisition of Nuance and 46 stores acquired stores in the 2015 acquisition of World Duty Free Group that management expected, at the time of the applicable acquisition, to wind down. 22
23 Gross Margin Components nic Attributable to Q1 as improved terms were retro to Jan Better vendor pricing 63.9% Vendor support now comes as a reduction of COGS rather than advertising income 0.7% Shift from lower to higher margin categories 0.4% 0.3% 62.2% 0.3% Q Q2 sales mix shift Q2 "geography" change Q2 pricing Q1 portion Q
24 Quarterly Summary (in millions USD) Turnover $ % Gross Profit $ % Selling Expenses $ % Personnel expenses $ % General and administrative expenses $ % Share result of associates $(0.1) - Adjusted EBITDA $ % Depreciation & Amortization $ % Other Operational Result $ % Operating Profit (EBIT) $ % Q % of turnover Q % of turnover $ % $ % $ % $ % $ % $(0.1) - $ % $ % $ % $ % % Change 7.4% 10.5% 6.4% 9.4% (23.2%) NM 51.4% 16.3% (46.7%) 132.0% 24
25 (USD millions) Balance Sheet and Cash Flow Net Debt and Leverage 1 Evolution Cash Flow Statement 1.6x 2.2x 2.7x 2.0x 1.6x 1.8x 1.5x Quarter Ended IN MILLIONS OF USD 6/30/2018 6/30/2017 Net cash flows from operating activities $71.4 $58.4 Net cash flows used in investing activities (19.8) (34.3) Jun-17 Sep-17 Dec-17 Mar-18 Jun-18 Net Debt Net Debt to Adj EBITDA Pro-forma Net Debt to Adj EBITDA Net cash flows (used in) / from financing activities (22.7) 8.6 Increase in net debt in Q3 17 linked to pre-ipo restructuring in Canada and new $195m CAD financing in Canada Currency translation on cash 4.8 (2.6) (Decrease) / increase in cash and cash equivalents Increase in net-debt in Q4 17 driven by payment of $100m outstanding Franchise fees to Dufry Reduction in Q1 18 net debt due to receipt of $60m pre- IPO restructuring proceeds from sales of non-hudson US assets to Dufry International Pro Forma leverage based on Adjusted EBITDA, which reflects reduced franchise fee to Dufry Cash and cash equivalents at the beginning of the period end of the period (1) Net debt leverage represents total debt less cash at the end of the period presented divided by Adj. EBITDA for the last 12 mo. For a reconciliation to the nearest IFRS measure, see Appendix. 25
26 Components of Target Revenue Growth and Long-Term Financial Framework Like-for-like net sales growth Growth in aggregate monthly net sales in the applicable period at stores that have been operating for at least 12 months + Net new business Conversions + New Concessions Lost Concessions & Closed Stores Total organic net sales growth High single digit Adj. EBITDA growth Operational initiatives, scale and operating leverage benefits Low double digit Net income growth High teens 26
27 4 APPENDIX 27
28 Turnover to Organic Net Sales Growth Reconciliation Organic Acquired Wind Down Stores Reported Growth Like for Like 4.5% 0.0% 4.5% Net New Business 3.7% (0.3%) 3.4% Organic Net Sales Growth 8.2% (0.3%) 7.9% Advertising Income (0.5%) Total Turnover Growth 7.4% 28
29 Adjusted EBITDA Reconciliation QUARTER ENDED QUARTER ENDED SIX MONTHS ENDED SIX MONTHS ENDED IN MILLIONS OF USD 6/30/2018 6/30/2017 6/30/2018 6/30/2017 Net earnings Income tax expense (3.0) Earnings before taxes (EBT) (1.3) Foreign exchange gain / (loss) 0.1 (0.2) 0.5 (0.4) Interest income (0.6) (0.5) (1.1) (1.0) Interest expenses Operating Profit (EBIT) Depreciation, amortization and impairment Other operational result (1) Adjusted EBITDA (1) For the quarter ended June 30, 2018, other operational result consisted of $1.0 million of litigation reserve, $0.4 million of IPO transaction costs, $0.2 million of restructuring expenses and $0.8 million of the non-recurring items. For the quarter ended June 30, 2017, other operational result included $2.3 million of restructuring expenses, $1.5 million of asset write-offs related to conversions and store closings and $0.7 million of other non-recurring items. For the six months ended June 30, 2018, other operational result consisted of $1.0 million of litigation reserve, $0.8 million of asset write-offs related to conversions and store closings, $0.7 million of IPO transaction costs, $0.7 million of uncollected receivables, $0.6 million of restructuring and $1.2 million of other non-recurring items. For the six months ended June 30, 2017, other operational results included $3.3 million of restructuring expenses, $1.5 million of asset write-offs and $1.5 million of other non-recurring items. 29
30 Pro Forma Net Debt Reconciliation QUARTER ENDED MILLIONS OF USD 6/30/18 Financial debt 583 Less: Cash and cash equivalents (239) Net debt 344 Adj. EBITDA (Trailing 12 mo) 210 Add: reduction in franchise fees to Dufry 19 Pro forma Adj EBITDA (Trailing 12 mo) 229 Pro forma net debt / Adj. EBITDA ratio
31 Sales Breakdown By Sector - QTD Net Sales By Sector Duty Free 23% Q Q Duty Free 23% Duty Paid 77% Duty Paid 77% Turnover By Country Q Canada 17% Q Canada 18% USA 83% USA 82% 31 31
32 Q & A 32
2017 Year-End Results. March 15 th, 2018
 2017 Year-End Results March 15 th, 2018 Disclaimer This presentation contains forward-looking statements within the meaning of the Private Securities Litigation Reform Act of 1995 (Reform Act). Forward-looking
SECURITIES & EXCHANGE COMMISSION EDGAR FILING. Hudson Ltd. Form: 6-K. Date Filed:
 SECURITIES & EXCHANGE COMMISSION EDGAR FILING Hudson Ltd. Form: 6-K Date Filed: 2019-03-14 Corporate Issuer CIK: 1714368 Copyright 2019, Issuer Direct Corporation. All Right Reserved. Distribution of this
INTERIM REPORT JUNE
 INTERIM REPORT JUNE 2018 1 HUDSON GROUP INTERIM REPORT JUNE 2018 CONTENT MANAGEMENT S DISCUSSION AND ANALYSIS OF FINANCIAL CONDITION AND RESULTS OF OPERATIONS JUNE 30, 2018 3 INTERIM CONSOLIDATED FINANCIAL
9M 2017 Results. Ongoing strong growth and acceleration of cash flow generation. October 31, 2017
 9M 2017 Results Ongoing strong growth and acceleration of cash flow generation October 31, 2017 Legal Disclaimer Information in this presentation may involve guidance, expectations, beliefs, plans, intentions
HY 2017 Results. Strong growth and cash generation. July 31, 2017
 HY 2017 Results Strong growth and cash generation July 31, 2017 Legal Disclaimer Information in this presentation may involve guidance, expectations, beliefs, plans, intentions or strategies regarding
HY 2018 Results. Record EBITDA & free cash flow generation. August 3, 2018
 HY 2018 Results Record EBITDA & free cash flow generation August 3, 2018 Legal Disclaimer Information in this presentation may involve guidance, expectations, beliefs, plans, intentions or strategies regarding
Q Results. Organic growth accelerates further. May 2, 2017
 Q1 2017 Results Organic growth accelerates further May 2, 2017 Legal Disclaimer Information in this presentation may involve guidance, expectations, beliefs, plans, intentions or strategies regarding the
Board of Directors Zurich, 24 March, 2009 Dufry Presentation - Full Year 2009 Results
 Dufry Presentation - Full Year 2009 Results March 2010 1 Legal Disclaimer Information in this presentation may involve guidance, expectations, beliefs, plans, intentions or strategies regarding the future.
Full Year Results 2014
 Legal disclaimer Information in this presentation may involve guidance, expectations, beliefs, plans, intentions or strategies regarding the future. These forward-looking statements involve risks and uncertainties.
163,28,22 230,203,96 191,191,191 0,51,153 26,173, ,219, ,64, ,160,98
 1 Legal Disclaimer Information in this presentation may involve guidance, expectations, beliefs, plans, intentions or strategies regarding the future. These forward-looking statements involve risks and
Agenda. 1. Highlights FY 2013 Results. 2. Financials. 3. Conclusion
 1 March 2014 Legal Disclaimer Information in this presentation may involve guidance, expectations, beliefs, plans, intentions or strategies regarding the future. These forward-looking statements involve
Agenda. 1. Highlights FY 2012 Results. 2. Operational Performance Priorities for Financials. 5. Conclusion
 1MARCH 2013 Legal Disclaimer Information in this presentation may involve guidance, expectations, beliefs, plans, intentions or strategies regarding the future. These forward-looking statements involve
Agenda. 1. Highlights 9M 2013 Results. 2. Financials. 3. Conclusion
 1November 2013 Legal Disclaimer Information in this presentation may involve guidance, expectations, beliefs, plans, intentions or strategies regarding the future. These forward-looking statements involve
Board of Directors Zurich, 24 March, 2009 Dufry Presentation 1Q10 Results
 Dufry Presentation 1Q10 Results May 2010 1 Legal Disclaimer Information in this presentation may involve guidance, expectations, beliefs, plans, intentions or strategies regarding the future. These forward-looking
FY 2017 Results. Delivering organic growth. March 15, 2018
 FY 2017 Results Delivering organic growth March 15, 2018 Legal Disclaimer Information in this presentation may involve guidance, expectations, beliefs, plans, intentions or strategies regarding the future.
Roadshow Presentation
 Roadshow Presentation Ongoing strong growth and acceleration of cash flow generation January, 2018 Legal Disclaimer Information in this presentation may involve guidance, expectations, beliefs, plans,
2018 FOURTH QUARTER EARNINGS CALL
 NORTH AMERICA S LEADING BUILDING MATERIALS DISTRIBUTOR RESIDENTIAL COMMERCIAL INTERIOR SOLAR 2018 FOURTH QUARTER EARNINGS CALL Forward Looking Statements / Non-GAAP Measures This presentation contains
SIX MONTHS REPORT 2018
 SIX MONTHS REPORT 2018 DUFRY AT A GLANCE TURNOVER GROSS PROFIT MARGIN 9,000 8,000 7,000 6,000 5,000 4,000 3,000 2,000 1,000 0 2014 2015 2016 2017 6M 2017 6M 2018 4,500 4,000 3,500 3,000 2,500 2,000 1,500
Ardagh Group S.A. Citi 2017 Basic Materials Conference. November 29, 2017
 Ardagh Group S.A. Citi 2017 Basic Materials Conference November 29, 2017 1 Disclaimer Forward-Looking Statements This presentation may contain "forward-looking" statements within the meaning of Section
Financial results & business update. Quarter and year ended 31 December February 2016
 Financial results & business update Quarter and year ended 31 December 2015 11 February 2016 Disclaimer 3 Any remarks that we may make about future expectations, plans and prospects for the company constitute
2018 First Quarter Earnings Call. February 8, 2018
 2018 First Quarter Earnings Call February 8, 2018 Forward Looking Statements / Non-GAAP Measures This presentation contains information about management's view of the Company's future expectations, plans
Q Results. Strong start in May 3, 2016
 Q1 2016 Results Strong start in 2016 May 3, 2016 Legal Disclaimer Information in this presentation may involve guidance, expectations, beliefs, plans, intentions or strategies regarding the future. These
GROSS PROFIT 4,500 4,000 3,500 3,000 2,500 2,000 1,500 1,000 6M 2017 FY 2013 IN MILLIONS OF CHF FY M 2017
 SIX MONTHS REPORT 2017 DUFRY AT A GLANCE TURNOVER GROSS PROFIT MARGIN 9,000 8,000 7,000 6,000 5,000 4,000 3,000 2,000 1,000 0 2013 2014 2015 2017 4,500 4,000 3,500 3,000 2,500 2,000 1,500 1,000 500 0 2013
Jacky Lo Chief Finance Officer, Yum China
 Jacky Lo Chief Finance Officer, Yum China Cautionary Language Regarding Forward-Looking Statements Forward-Looking Statements. Our presentation may contain forward-looking statements within the meaning
August provenperformance
 August 2011 provenperformance Forward Looking Statement Certain information set forth in this supplemental package contains forward-looking statements within the meaning of the federal securities laws.
2018 Second Quarter August 8, 2018
 2018 Second Quarter August 8, 2018 Safe Harbor Disclaimer Cautionary Statement Regarding Forward-Looking Statements We have made statements in this document that are forward-looking statements within the
Investor Presentation
 Investor Presentation September 2018 Disclaimer This presentation contains forward-looking statements. You can generally identify forward-looking statements by our use of forward-looking terminology such
Veritiv Corporation Fourth Quarter and Fiscal Year 2017 Financial Results March 1, 2018
 Veritiv Corporation Fourth Quarter and Fiscal Year 2017 Financial Results March 1, 2018 Tom Morabito Director of Investor Relations 2 Safe Harbor Provision Certain statements contained in this presentation
GROSS PROFIT 4,500 4,000 3,500 3,000 2,500 2,000 1,500 1,000 9M 2017 FY 2013 IN MILLIONS OF CHF FY M 2017
 NINE MONTHS REPORT SEPTEMBER 2017 DUFRY AT A GLANCE TURNOVER GROSS PROFIT MARGIN 9,000 8,000 7,000 6,000 5,000 4,000 3,000 2,000 1,000 0 2013 2014 2015 2017 4,500 4,000 3,500 3,000 2,500 2,000 1,500 1,000
Investor Presentation
 Investor Presentation June 2018 Safe Harbor Statement This presentation contains forward-looking statements. You can generally identify forward-looking statements by our use of forward-looking terminology
4Q 2018 Highlights and Operating Results. Products. Technology. Services. Delivered Globally.
 4Q 2018 Highlights and Operating Results Products. Technology. Services. Delivered Globally. Table of Contents Page 3 Safe Harbor Statement and Non-GAAP Financial Measures 4 Sales Overview 9 Overview of
August 8, Conduent Q Earnings Results
 August 8, 2018 Conduent Q2 2018 Earnings Results Cautionary Statements Forward-Looking Statements This report contains forward-looking statements, as defined in the Private Securities Litigation Reform
Veritiv Corporation Third Quarter 2017 Financial Results November 7, 2017
 Veritiv Corporation Third Quarter 2017 Financial Results November 7, 2017 Tom Morabito Director of Investor Relations 2 Safe Harbor Provision Certain statements contained in this presentation regarding
2018 First Quarter May 2, 2018
 2018 First Quarter May 2, 2018 Safe Harbor Disclaimer Cautionary Statement Regarding Forward-Looking Statements We have made statements in this document that are forward-looking statements within the meaning
MYERS INDUSTRIES, INC. MARCH 9, 2017 FOURTH QUARTER & FULL YEAR EARNINGS PRESENTATION
 MYERS INDUSTRIES, INC. MARCH 9, 2017 FOURTH QUARTER & FULL YEAR EARNINGS PRESENTATION SAFE HARBOR STATEMENT Statements in this presentation concerning the Company s goals, strategies, and expectations
Veritiv Corporation First Quarter 2018 Financial Results May 8, 2018
 Veritiv Corporation First Quarter 2018 Financial Results May 8, 2018 Tom Morabito Director of Investor Relations 2 Safe Harbor Provision Certain statements contained in this presentation regarding Veritiv
2015 Fourth-Quarter and Fiscal Year Performance
 205 Fourth-Quarter and Fiscal Year Performance Financial Results and Company Highlights March 5, 206 Disclaimers Forward-Looking Statements This presentation includes forward-looking statements within
Gross profit IN MILLIONS IN CHF 3'000 2'500 2'000 1'500 1'000 FY M Net earnings / (loss) 6M FY 2011
 6M FY 2011") Key figures Turnover IN MILLIONS OF CHF Gross profit IN MILLIONS IN CHF Margin 4'500 4'000 3'500 3'000 2'500 2'000 1'500 1'000 500 0 2011 2012 2013 2015 3'000 2'500 2'000 1'500 1'000 500 0 2011 2012 2013
Key figures Turnover IN MILLIONS OF CHF Gross profit IN MILLIONS IN CHF Margin 4'500 4'000 3'500 3'000 2'500 2'000 1'500 1'000 500 0 2011 2012 2013 2015 3'000 2'500 2'000 1'500 1'000 500 0 2011 2012 2013
2Q 2017 Highlights and Operating Results
 2Q 2017 Highlights and Operating Results July 25, 2017 1 2Q 2017 Highlights and Operating Results Table of Contents Page(s) 1 Sales Overview and Highlights 4-5 2 NSS Overview 6-7 3 EES Overview 8-9 4 UPS
Third-Quarter 2012 Earnings Presentation
 Third-Quarter 2012 Earnings Presentation Ursula Burns Chairman & CEO Luca Maestri Chief Financial Officer October 23, 2012 Forward-Looking Statements This presentation contains "forward-looking statements"
WDF S.P.A. H RESULTS PRESENTATION
 WDF S.P.A. H1 2015 RESULTS PRESENTATION 30 th July 2015 WORLD DUTY FREE GROUP AFRICA AMERICAS ASIA EUROPE Forward looking statements This presentation is of a purely informative nature and does not constitute
1Q 2018 Highlights and Operating Results
 1Q 2018 Highlights and Operating Results April 26, 2018 1 Table of Contents Page(s) 4 Announced Agreements to Acquire Australia and New Zealand Security Businesses 5-9 Sales Overview 10-17 Financial Performance
H Interim Results 4 September 2018
 H1 2018 Interim Results 4 September 2018 Disclaimer The following presentation is being made only to, and is only directed at, persons to whom such presentation may lawfully be communicated ( relevant
2018 Second Quarter Earnings Call. May 8, 2018
 2018 Second Quarter Earnings Call May 8, 2018 Forward Looking Statements / Non-GAAP Measures This presentation contains information about management's view of the Company's future expectations, plans and
Veritiv Corporation Fourth Quarter and Full Year 2018 Financial Results February 28, 2019
 Veritiv Corporation Fourth Quarter and Full Year 2018 Financial Results February 28, 2019 Tom Morabito Director of Investor Relations 2 Safe Harbor Provision Certain statements contained in this presentation
NLSN 4Q and FY 2011 Investor Presentation
 NLSN 4Q and FY 2011 Investor Presentation Forward Looking Statements The following discussion contains forward-looking statements, including those about Nielsen s outlook and prospects, in the meaning
Board of Directors Zurich, 24 March, Dufry Presentation 9M 2011 Results
 Dufry Presentation 9M 2011 Results November 2011 1 Legal Disclaimer Information in this presentation may involve guidance, expectations, beliefs, plans, intentions or strategies regarding the future. These
First Quarter Fiscal 2016 Earnings Conference Call
 First Quarter Fiscal 2016 Earnings Conference Call May 4, 2016 Forward-Looking Statements This presentation includes forward-looking statements, within the meaning of Section 27A of the Securities Act
Ardagh Group S.A. Fourth Quarter and Full Year 2017 Results
 A Ardagh Group S.A. Fourth Quarter and Full Year 2017 Results Ardagh Group S.A. (NYSE: ARD) today announced its financial results for the fourth quarter and year ended December 31, 2017. Highlights December
Investor Presentation. Second Quarter 2018 NASDAQ: BECN BECN
 Investor Presentation Second Quarter 2018 BECN 1 Disclosures Forward Looking Statements and Non-GAAP Measures This presentation contains forward-looking statements within the meaning of the Private Securities
Veritiv Corporation Second Quarter 2016 Financial Results August 9, 2016
 Veritiv Corporation Second Quarter 2016 Financial Results August 9, 2016 Tom Morabito Director of Investor Relations 2 Safe Harbor Provision Certain statements contained in this presentation regarding
Third Quarter 2018 Earnings Thursday, November 8, 2018
 Third Quarter 2018 Earnings Thursday, November 8, 2018 1 Forward-Looking Statements This presentation may contain "forward-looking statements" as defined in the Private Securities Litigation Reform Act
Rent-A-Center today is
 INVESTOR PRESENTATION FIRST QUARTER 2014 Safe Harbor This presentation contains forward-looking statements that involve risks and uncertainties. Such forward-looking statements generally can be identified
Daseke, Inc. Consolidating North America s Flatbed & Specialized Logistics Market
 Daseke, Inc. Consolidating North America s Flatbed & Specialized Logistics Market Investor Presentation September 2017 Important Disclaimers Non-GAAP Financial Measures This presentation includes non-gaap
Investor Presentation
 Feb Investor Presentation 2018 Lee D. Rudow President and CEO Michael J. Tschiderer Chief Financial Officer NASDAQ: TRNS 1 Safe Harbor Statement This presentation contains forward looking statements within
FOURTH QUARTER 2018 REVIEW FEBRUARY 7, 2019
 FOURTH QUARTER 2018 REVIEW FEBRUARY 7, 2019 REGARDING FORWARD LOOKING STATEMENTS Statements contained in this press release that are not historical facts are forward looking statements. Forward looking
Third-Quarter 2013 Earnings Presentation
 Third-Quarter 2013 Earnings Presentation Ursula Burns Chairman & CEO Kathy Mikells Chief Financial Officer October 24, 2013 Forward-Looking Statements This presentation contains "forward-looking statements"
Horizon Global Third Quarter 2017 Earnings Presentation
 Horizon Global Third Quarter 2017 Earnings Presentation October 31, 2017 Q1 2016 Earnings 1 Safe Harbor Statement Forward-Looking Statements This presentation may contain "forward-looking statements" as
INTERIM PRESENTATION Q October 2018
 INTERIM PRESENTATION 25 October JUAN VARGUES, PRESIDENT & CEO HIGHLIGTHS Organic growth Good organic growth in EMEA Flat organic growth in Americas despite -7% RV OEM APAC down due to softer market in
1Q 2018 Results Presentation
 1Q 2018 Results Presentation EXECUTIVE SUMMARY EUROCASH GROUP ORGANIC WHOLESALE SEGMENT GROWTH BETTER THAN MARKET BACK ON GROWTH TRACK GROSS MARGIN BACK ON TRACK AFTER WEAK 4Q 2017 HO COSTS OPTIMIZATION
2015 Fourth Quarter February 25, 2016
 2015 Fourth Quarter February 25, 2016 Safe Harbor Disclaimer Forward-Looking Statements We have made statements in this document that are forward-looking statements within the meaning of the federal securities
Business Combination of Skyline Corporation and Champion Homes Creating the Nation s Largest Publicly Traded Factory-Built Housing Company
 Business Combination of Skyline Corporation and Champion Homes Creating the Nation s Largest Publicly Traded Factory-Built Housing Company January 25, 2018 Disclaimer Forward-Looking Statements Statements
Financial results & business update. Quarter and year ended 31 December February 2017
 Financial results & business update Quarter and year ended 31 December 2016 14 February 2017 Disclaimer 3 Any remarks that we may make about future expectations, plans and prospects for the company constitute
BlueLinx Third Quarter 2018 Earnings Webcast
 BlueLinx Third Quarter 2018 Earnings Webcast Notes To Investors Forward-Looking Statements. This presentation includes forward-looking statements within the meaning of the Private Securities Litigation
Q Results presentation
 Q1 2016 Results presentation 12 May 2016 1 Disclaimer This presentation (the "Presentation") has been prepared and is issued by, and is the sole responsibility of Telepizza Group, S.A. ( Telepizza" or
Fourth Quarter & Full Year 2016 Earnings Call
 Fourth Quarter & Full Year 2016 Earnings Call February 23, 2017 Rob Wagman President & Chief Executive Officer Nick Zarcone Executive Vice President & Chief Financial Officer Joe Boutross Director, Investor
THIRD QUARTER 2017 EARNINGS
 MGM Resorts International THIRD QUARTER 2017 EARNINGS Investor Presentation November 8, 2017 Forward-Looking Statements Statements in this presentation that are not historical facts are forward-looking
SECOND QUARTER FISCAL YEAR 2019 FINANCIAL RESULTS. October 31, 2018
 SECOND QUARTER FISCAL YEAR 2019 FINANCIAL RESULTS October 31, 2018 CAUTIONARY STATEMENT UNDER THE PRIVATE SECURITIES LITIGATION REFORM ACT This presentation and discussion contains certain forward-looking
FINANCIAL RESULTS AND COMPANY OVERVIEW Second-Quarter Performance
 FINANCIAL RESULTS AND COMPANY OVERVIEW 08 Second-Quarter Performance September 5 th, 08 Disclaimer Forward-Looking Statements and Preliminary Results This presentation includes forward-looking statements
Earnings Call Presentation
 Earnings Call Presentation Zayo Group Holdings, Inc. Fiscal Year 2017 Q1 NYSE: ZAYO @ZayoGroup Safe Harbor Information contained in this presentation that is not historical by nature constitutes forward-looking
2016 Fourth-Quarter and Fiscal Year Performance
 206 Fourth-Quarter and Fiscal Year Performance Financial Results and Company Highlights March 4, 207 Disclaimers Forward-Looking Statements and Preliminary Results This presentation includes forward-looking
Q3 Fiscal Year 2018 Investor Presentation Financial Results Conference Call
 February Sept 6, 2018 2017 Q3 Fiscal Year 2018 Investor Presentation Financial Results Conference Call Mark D. Morelli President and Chief Executive Officer Gregory P. Rustowicz Vice President Finance
H1019-JPMorgan-2/09 1
 H1019-JPMorgan-2/09 1 1 Forward-Looking Statements Certain statements contained in this presentation are forward-looking statements within the meaning of the Private Securities Litigation Reform Act of
Second Quarter 2013 Results. July 25, 2013
 Second Quarter 2013 Results July 25, 2013 Disclaimer This presentation may contain forward-looking statements with respect to the financial condition, results of operation, plans, objectives, future performance
Singular Best of the Uncovered 12 th Annual Conference 2017
 Dec 4, 2017 Singular Best of the Uncovered 12 th Annual Conference 2017 Michael J. Tschiderer Chief Financial Officer NASDAQ: TRNS 1 Safe Harbor Statement This presentation contains forward-looking statements
3Q 2018 Highlights and Operating Results. Products. Technology. Services. Delivered Globally.
 3Q 2018 Highlights and Operating Results Products. Technology. Services. Delivered Globally. Table of Contents Page 3 Safe Harbor Statement and Non-GAAP Financial Measures 4 Sales Overview 9 Overview of
FOURTH QUARTER 2017 EARNINGS PRESENTATION FEBRUARY 8, 2018
 FOURTH QUARTER 2017 EARNINGS PRESENTATION FEBRUARY 8, 2018 REGARDING FORWARD-LOOKING STATEMENTS Statements contained in this press release that are not historical facts are forward-looking statements.
2017 Second Quarter August 3, 2017
 2017 Second Quarter August 3, 2017 Safe Harbor Disclaimer Cautionary Statement Regarding Forward-Looking Statements We have made statements in this document that are forward-looking statements within the
Fiscal Year 1Q 2014 Supplemental Earnings Information. FY 1Q 2014 Supplemental Earnings Information 1
 Fiscal Year 1Q 2014 Supplemental Earnings Information 1 Forward-Looking Statements Information contained in this supplemental presentation that is not historical by nature constitutes forward-looking statements
Horizon Global First Quarter 2016 Earnings Presentation
 Horizon Global First Quarter 2016 Earnings Presentation May 3, 2016 1 Safe Harbor Statement Forward-Looking Statements This presentation may contain "forward-looking statements" as defined in the Private
3Q18 Results November 8th, 2018
 Results November 8th, 2018 1 Disclaimer The information contained in this presentation is only a summary and does not purport to be complete. This presentation has been prepared solely for informational
2017 Jefferies Consumer Conference
 207 Jefferies Consumer Conference June 20, 207 Tom Taylor Chief Executive Officer Forward-Looking Statements This presentation and the associated webcast contain forward-looking statements, including with
Agenda. 1. Transaction summary and highlights. 2. Overview of Nuance. 3. Business Combination (Dufry + Nuance)
") 14 June 2014 Legal disclaimer Information in this presentation may involve guidance, expectations, beliefs, plans, intentions or strategies regarding the future. These forward-looking statements involve
14 June 2014 Legal disclaimer Information in this presentation may involve guidance, expectations, beliefs, plans, intentions or strategies regarding the future. These forward-looking statements involve
Zayo Group Holdings, Inc. (Exact Name of Registrant as Specified in Its Charter)
") UNITED STATES SECURITIES AND EXCHANGE COMMISSION Washington, D.C. 20549 FORM 8-K CURRENT REPORT PURSUANT TO SECTION 13 OR 15(d) OF THE SECURITIES EXCHANGE ACT OF 1934 Date of report (Date of earliest event
UNITED STATES SECURITIES AND EXCHANGE COMMISSION Washington, D.C. 20549 FORM 8-K CURRENT REPORT PURSUANT TO SECTION 13 OR 15(d) OF THE SECURITIES EXCHANGE ACT OF 1934 Date of report (Date of earliest event
During the year, the Company achieved a number of milestones in executing its growth strategy:
 Party City Announces Fourth Quarter and Full Year 2015 Results Revenue increase of 4% 1 on a constant currency basis to a record $2.29 billion for fiscal year 2015 Adjusted Net Income increase of 32% in
2015 Investor Day. November 12, 2015
 2015 Investor Day November 12, 2015 Forward-Looking Statements This presentation includes certain forward-looking statements within the meaning of the Private Securities Litigation Reform Act of 1995,
Q2 FY17 Results April 26, 2017
 Q2 FY17 Results April 26, 2017 Steve Voorhees Chief Executive Officer Ward Dickson Chief Financial Officer Jim Porter President, Business Development and Latin America Jeff Chalovich President, Corrugated
Folli Follie Group Financial Results 9M November 27, 2008
 Folli Follie Group Financial Results 9M 2008 November 27, 2008 FF Group 9M Financials Amounts in million Total Sales 678,4 % of sales EBITDA 151,3 22,3% EBIT 136,8 20,2% EBT 107,6 15,9% EAT after min.
3Q18 Earnings Presentation. October 24, 2018
 3Q18 Earnings Presentation October 24, 2018 NASDAQ 3Q18 HIGHLIGHTS Driving Accelerating Growth, Creating Sustainable Value Nasdaq Net Revenues 3Q18 Revenue Growth 1 : +5% Organic Y-o-Y Non-Trading Segments
9M 2018 Results. Resilient results in challenging market conditions. November 5, 2018
 9M 2018 Results Resilient results in challenging market conditions November 5, 2018 Legal Disclaimer Information in this presentation may involve guidance, expectations, beliefs, plans, intentions or strategies
CL King s Annual Best Ideas Conference
 WELCOME TO AMERICA S DINER CL King s Annual Best Ideas Conference September 10, 2015 Forward Looking Statements and Non-GAAP Financial Measures Denny s Corporation urges caution in considering its current
NASDAQ: MLHR. Herman Miller, Inc. Investor Presentation Second Quarter FY2013
 NASDAQ: MLHR Herman Miller, Inc. Investor Presentation Second Quarter FY2013 Forward Looking Statements This information contains forward-looking statements within the meaning of Section 27A of the Securities
4 TH QUARTER AND FULL YEAR 2015 RESULTS FEBRUARY 11, :00AM ET NYSE: NLSN
 4 TH QUARTER AND FULL YEAR 2015 RESULTS FEBRUARY 11, 2016 8:00AM ET NYSE: NLSN SAFE HARBOR FOR FORWARD-LOOKING STATEMENTS The following discussion contains forward-looking statements, including those about
FULL YEAR 2011 RESULTS
 FULL YEAR 2011 RESULTS February 28 th 2012 1 28 February 2011 This document does not constitute a purchase, sales or exchange offer, nor is it an invitation to draw up a purchase, sales or exchange offer,
An Exciting New Growth Platform
 Legal Disclaimer This presentation may contain written and oral statements that constitute forward-looking statements within the meaning of the Private Securities Litigation Reform Act of 1995, as amended.
DOLLARAMA REPORTS THIRD QUARTER RESULTS
 For immediate distribution DOLLARAMA REPORTS THIRD QUARTER RESULTS MONTREAL, Québec, December 8, 2010 Dollarama Inc. ( Dollarama or the Corporation ) (TSX: DOL) reported significant increases in sales
Core-Mark Holding Company Jefferies 2017 Consumer Conference. June 21 st 2017
 Core-Mark Holding Company Jefferies 2017 Consumer Conference June 21 st 2017 2 Safe Harbor & SEC Regulation G Safe Harbor Statements made in the course of this presentation that state the company s or
Albemarle Corporation Second Quarter 2018 Earnings and Non-GAAP Reconciliations Conference Call/Webcast Wednesday, August 8 th, :00am ET
 Albemarle Corporation Second Quarter 2018 Earnings and Non-GAAP Reconciliations Conference Call/Webcast Wednesday, August 8 th, 2018 9:00am ET Forward-Looking Statements Some of the information presented
SUPPLEMENTAL EARNINGS INFORMATION. Fiscal Year 2018 Q3 NYSE:
 SUPPLEMENTAL EARNINGS INFORMATION Fiscal Year 2018 Q3 NYSE: ZAYO @ZayoGroup Forward-Looking Statements Information contained in this supplemental presentation that is not historical by nature constitutes
Second Quarter Fiscal Year 2018 Results May 2, 2018 Bradley H. Feldmann Chairman, President and Chief Executive Officer Anshooman Aga Executive Vice
 Second Quarter Fiscal Year 2018 Results May 2, 2018 Bradley H. Feldmann Chairman, President and Chief Executive Officer Anshooman Aga Executive Vice President and Chief Financial Officer Safe Harbor &