Radius Build Better Portfolios BMO Tactical Dividend ETF Fund Portfolio Manager: Larry Berman, ETF Capital Management
|
|
|
- John Adams
- 6 years ago
- Views:
Transcription


1 Radius Build Better Portfolios BMO Tactical Dividend ETF Fund Portfolio Manager: Larry Berman, ETF Capital Management
. Our investment philosophy is simple we adjust portfolios opportunistically between asset classes, industry sectors, and countries.")

2 About The Manager Firm Profile ETF Capital Management (ETFCM) was founded in 2006 by Larry Berman and partners as a boutique portfolio management firm, specializing in active management using ETFs (Exchange Traded Funds). Our investment philosophy is simple we adjust portfolios opportunistically between asset classes, industry sectors, and countries. Our aim is to keep portfolios optimal from a risk/reward standpoint, stacking the odds in our favour through the use of technical analysis overlaid with a fundamental analysis of the global macro picture. Weuse ETFs because they are efficient for active investing,and because theydo a good job of replicating the performance of the assets we want exposure to in a cost effective way. Today ETFCM manages more than $120 Million in assets for over 250 high-net-worth client households. Did you know: Larry Berman was one of the first analysts in Canada to cover ETFs. He s been developing ETF strategies since his tenure as Chief Technical Strategist for CIBC World Markets where his US-based institutional clients began using ETFs in the early 2000 s. ETFCM was among the very first portfolio managers in Canada to manage high net worth client portfolios with an ETF focus. 1
3 Lead Portfolio Manager Larry M. Berman is a Co-Founder of ETF Capital Management ( and the Independent Investor Institute ( and brings nearly twenty five years of industry experience to the role of Chief Investment Officer. As Chief Technical Strategist at CIBC World Markets, Larry was institutionally ranked as a Top 3 Analyst in Canadian fixed-income strategy and equity technical analysis and in the US ranked by 7 of the top 10 firms in institutional equity surveys. Larry began his career as a Toronto based investment advisor in 1989 and completed a technical internship in New York with the Market Technicians Association ( in 1994, where he studied the techniques of many top Wall Street technicians. Prior to founding ETFCM (2006) and I3 (2011), he was Chief Technical Strategist and Managing Director for CIBC World Markets since Larry was a senior technical analyst for Thomson Reuters (formerly Technical Data) in Boston and senior technical analyst and trader for Marleau, Lemire Futures in Toronto. Larry is a Chartered Market Technician (CMT), a Chartered Financial Analyst (CFA) charter holder, and is a US registered Commodity Trading Advisor (CTA). Larry graduated from York University with a BA in Economics and lectures on behavioural finance and technical analysis around the world. Larry is the primary author of the textbook for the technical analysis course offered by the Canadian Securities Institute (CSI), which is the primary source of education for technical analysis in Canada. Larry is past President of the Canadian Society of Technical Analysts ( past Vice-Chairman (Americas) of the International Federation of Technical Analysts ( and past President of the Market Technicians Association ( he currently sits on the board of advisors to the educational foundation ( Larry s opinions frequently appear in the media, and he is featured weekly on BNN s Berman s Call ( Call.aspx) 2
4 Fund Overview A strategy made for today s ever-changing markets. The BMO Tactical Dividend ETF Fund (Fund) focuses on active rotation between asset classes within Canadian and Global sectors, with emphasis on dividend and yield paying ETFs when the portfolio manager s outlook is defensive, and growth opportunities when their outlook is bullish. Managed by industry leading technical strategist and host of BNN s Berman s Call, Larry Berman CFA, CMT, CTA. Investment Objective: Provide long-term capital growth and current income by investing primarily in a diversified portfolio of exchange traded funds (ETFs) that invest in income producing securities. Fund Details: Management Fee: 1.55%* Fixed Admin Fee: 0.15%* Distributions: Monthly Manager: Larry Berman, ETF Capital Management * As this is a new fund the total MER is estimated at 1.85% 3
5 Investment Guidelines Target yield 4%+ yield on average, and 1% higher than benchmark; Minimum 8 ETFs at all times to ensure proper diversification; Variable Monthly distributions; Global Macroeconomic overlay: Geopolitical/fundamental/foreign exchange risk. Trade triggers based upon technical analysis factors; Use of BMO and non-bmo ETFs Turnover estimated at around % average annually; Asset classes: Rotation between large/small cap, commodities, alternatives, bonds; Sector rotation: Dividend focus banks/energy/industrials/utilities/reits/consumer, etc; Fixed-income: Max 20% (high yield, corporate, government, Canada, U.S., emerging markets, EAFE); Cash: Currency: Max 10% cash for liquidity and defense; Max 75% U.S. dollar exposure; Enhanced yield: Call/Put ETFs when lower beta with higher yield desired; Benchmark: 62.5% TSX Dividend composite total return. 37.5% MSCI World Index. 4
; Core benchmark is a 62.5% TSX dividend composite.")
6 Investment Process The core and explore strategy starts with the model s benchmark as the core; We capitalize on opportunities by shifting portfolio holdings - reducing core exposure and adding allocations to assets that have the greatest potential for return(or to preserve capital during adverse market environments); Core benchmark is a 62.5% TSX dividend composite. Explore/growth component of benchmark is 37.5% of the MSCI World Index. Core Strategy Explore Strategy Shift 5 Core Exposure Shift 1 Shift 2 Core Exposure Shift 4 Shift 3 5
, as opposed to simply rebalancing back to the same asset allocation targets annually or quarterly.")
 compared to just holding the core exposure alone.")
7 Investment Process Our Opportunistic Approach to Shifting Tactical Asset Allocation Rather than rebalancing portfolios on a periodic fixed schedule, we favour tactical rebalancing of portfolios when assets are expensive or attractive on a relative basis (see chart at right), as opposed to simply rebalancing back to the same asset allocation targets annually or quarterly. Our portfolio management team keeps a constant watch on the markets. We re looking for opportunities every day, and act in real-time when we spot them. By shiftingexposure when it makes the most sense, we aim to enhance returns(over several market cycles) compared to just holding the core exposure alone. As with any active strategy, the outcome cannot be known in advance, and therefore asset class and style diversification are important components of our longer-term strategy. Sometimes it makes sense to focus on capital protection, and at other times the focus is on capturing growth. Our mean reversion model considers asset correlation and volatility to determine the most opportunistic asset allocation shifts. Shifting portfolio beta when markets are relatively expensive or relatively attractive is the best long-term technique to generate portfolio alpha. Buy low, sell high is the guiding principle in our asset allocation strategies. Return The Risk/Return Tradeoff Lower Risk Lower Return Higher Risk High Potential Return Risk (aka Volatility or Standard Deviation) 6


8 Investment Process Strategy Overview The Fund utilizes four main components of active management to help enhance returns and manage risk: Reducing/Increasing Portfolio Beta Relative To Benchmark Diversification Geographically, By Sector, By Country, And By Asset Class Interest Rate And Credit Anticipation Currency Overlay 7
9 Investment Process Asset Class Diversification While 50% of the strategy is targeted towards the Canadian market on average, at times the global market offers significantly better return opportunities. Canada represents just 4% of global capital markets and due to the makeup of the S&P/TSX Composite Index, sector concentration can be an issue even in a diversified portfolio. This is especially so during periods where commodities are underperforming. To avoid this, the strategy will skew toward global opportunities at times and will aim to hold Canadian assets whenever it makes sense to do so. The Fund will hold a minimum of 8 ETFs at all times across asset classes to help create diversification. Interest Rate and Credit Anticipation Indefensive marketsforequities,thefundcanholdupto20%fixed-income and10%cash. We monitor spreads in the entire corporate spectrum - from short duration government bonds to high yield, longer duration corporates. Currency Management One of the most interesting aspects of investing globally is the opportunity for currency to add additional diversification and lower overall portfolio volatility. Wecanholdexposuretomanyglobalmarketswithacurrency hedgeorwithout. Attribution of the MSCI World Index returns over the past decade show the two most important considerations are sector and currency exposures. 8

10 The Game Plan Active Beta Management with A Global Macro Overlay

11 BMO Tactical Dividend ETF Fund ETFs: Capitalize On BMO Asset Management s Strengths Global diversification Tax & Cost Efficient Dividends: Lower Volatility And The Income To Match The Goals Of Today s Investors Historically, over 40% of total returns have come from dividends Growth: Capital Gains Focus While Still Emphasizing Cash Flow From Dividends Growth rotation when outlook more favorable Tactical: Asset Allocation Is The Primary Source Of Alpha Traded efficiently with ETFs Benefit from sector/country diversification Source: Standard & Poor s, Ibbotson, J.P. Morgan Asset Management. 10
12 Technical Trigger - Example: Dividends Common vs. Preferred In this example we are considering an asset allocation shift from common dividends in ZDV (blue) and preferred dividends ZPR (white). The ratio in percentage terms (green) show the relative price performance between the two asset choices. The dotted red lines are annual and quarterly standard regression channels and they help identify when one asset is relative expensive or cheap compared to another. The historical correlation and variance between the asset classes identify the magnitude of the opportunity. Since inception of ZPR in November 2012, the ZDV has out performed by about 12% and is currently relatively expensive. Considering that equity markets tend to be their weakest in Q3, August might be a good time to shift from common dividends to a slightly higher preferred dividend and reduce beta during the expectation of overall market weakness in Q3. 11
13 Technical Trigger - Example: Canadian Banks - Directional vs. Covered Call It is well known that a covered call strategy enhances yield and typically lowers volatility, but can underperform in a strong trending bull market. Comparing the equally weighted bank ZEB (blue) with the covered call version ZWB (white) on a price return basis only, we see that it has outperformed over the past year where the market was generally higher for the Canadian banks. However, during periods where the banks fell in price (Jan.-June), the price spread stayed about the same (green), but the dividends paid out over this period was about 100 bps higher for ZWB than ZEB. Our relative strength model first showed price was on the expensive side in late January and then attractive again in mid June. 12
14 Technical Trigger - Example: Adjusting Currency Exposure In this example we are considering an asset allocation shift from holding the S&P 500 with a currency hedge ZUE (Blue) and the S&P 500 in U.S. dollars ZSP.U (white). The ratio in percentage terms (green) show the relative price performance between the two asset choices. In this case, it represents the foreign exchange (FX) rate of the Canadian dollar versus the U.S. dollar. The dotted red lines are annual and quarterly standard regression channels and they help identify when one asset is relative expensive or cheap compared to another. In this example, an asset allocation shift does not change the market risk of the holding since they both give the return of the S&P 500. It is clear that as the Canadian dollar has weakened over the past year, holding the S&P 500 at times in U.S. dollars can add a few percent of alpha versus holding the same exposure on a hedged basis. The regression channels help us identify places to shift currency exposure. Over the past year, there was enough volatility in the FX cross to make 4 shifts in currency exposure. 13
15 Technical Trigger - Example: Dividends or Growth? In this example we are considering an asset allocation shift from Canadian dividends in ZDV (white) and global growth exposure to emerging markets ZEM (blue). The ratio in percentage terms (green) show the relative price performance between the two asset choices. The dotted red lines are annual and quarterly standard regression channels and they help identify when one asset is relatively expensive or cheap compared to another on multiple time frames. Once an asset allocation opportunity is identified, we consider relative currency risks as well as the potential for a macro catalyst to move the trend in our favor. In the case of ZDV, which is an ETF that closely tracks our benchmark, the default decision is biased towards holding benchmark assets if there is no potential catalyst. In March, when we had a high global macro confidence factor that China and most of the emerging economies were slowing, a relative trade back to ZDV is very attractive. Recently, China is relatively attractive again. 14


16 Portfolio October 15,


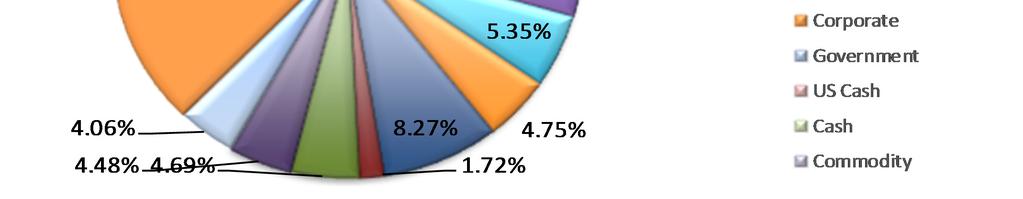
17 Portfolio October 15,


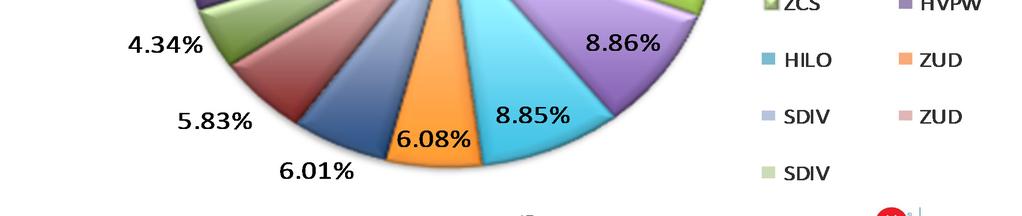
18 Portfolio October 15,
19 Portfolio October 15, 2013 Factor Fund Benchmark O/U Change FX (USD) 54% 35% +19% -6% Beta 50% 100% -50% 0% Yield 3.67% 2.54% +1.13% +0.12% 18
20 About The Manager Firm Profile ETF Capital Management (ETFCM) was founded in 2006 by Larry Berman and partners as a boutique portfolio management firm, specializing in active management using ETFs (Exchange Traded Funds). Our investment philosophy is simple we adjust portfolios opportunistically between asset classes, industry sectors, and countries. Our aim is to keep portfolios optimal from a risk/reward standpoint, stacking the odds in our favour through the use of technical analysis overlaid with a fundamental analysis of the global macro picture. Weuse ETFs because they are efficient for active investing,and because theydo a good job of replicating the performance of the assets we want exposure to in a cost effective way. Today ETFCM manages more than $120 Million in assets for over 250 high-net-worth client households. Did you know: Larry Berman was one of the first analysts in Canada to cover ETFs. He s been developing ETF strategies since his tenure as Chief Technical Strategist for CIBC World Markets where his US-based institutional clients began using ETFs in the early 2000 s. ETFCM was among the very first portfolio managers in Canada to manage high net worth client portfolios with an ETF focus. 19
21 Lead Portfolio Manager Larry M. Berman is a Co-Founder of ETF Capital Management ( and the Independent Investor Institute ( and brings nearly twenty five years of industry experience to the role of Chief Investment Officer. As Chief Technical Strategist at CIBC World Markets, Larry was institutionally ranked as a Top 3 Analyst in Canadian fixed-income strategy and equity technical analysis and in the US ranked by 7 of the top 10 firms in institutional equity surveys. Larry began his career as a Toronto based investment advisor in 1989 and completed a technical internship in New York with the Market Technicians Association ( in 1994, where he studied the techniques of many top Wall Street technicians. Prior to founding ETFCM (2006) and I3 (2011), he was Chief Technical Strategist and Managing Director for CIBC World Markets since Larry was a senior technical analyst for Thomson Reuters (formerly Technical Data) in Boston and senior technical analyst and trader for Marleau, Lemire Futures in Toronto. Larry is a Chartered Market Technician (CMT), a Chartered Financial Analyst (CFA) charter holder, and is a US registered Commodity Trading Advisor (CTA). Larry graduated from York University with a BA in Economics and lectures on behavioural finance and technical analysis around the world. Larry is the primary author of the textbook for the technical analysis course offered by the Canadian Securities Institute (CSI), which is the primary source of education for technical analysis in Canada. Larry is past President of the Canadian Society of Technical Analysts ( past Vice-Chairman (Americas) of the International Federation of Technical Analysts ( and past President of the Market Technicians Association ( he currently sits on the board of advisors to the educational foundation ( Larry s opinions frequently appear in the media, and he is featured weekly on BNN s Berman s Call ( Call.aspx) 20
22 Disclaimer This presentation was prepared by ETF Capital Management in its capacity as the portfolio manager of BMO Tactical Dividend ETF Fund for informational purposes only. The content of this presentation should not be construed as, investment and/or tax advice to any individual. Particular investments and/or trading strategies should be evaluated relative to each individual s circumstances. Individuals should see the advice of professionals, as appropriate, regarding any particular investment. BMO Mutual Funds refers to certain mutual funds and/or series of mutual funds offered by BMO investments Inc., a financial services firm and separate legal entity from Bank of Montreal. Commissions, trailing commissions, management fees and expenses all may be associated with mutual fund investments. Please read the prospectus of the mutual fund before investing. Mutual funds are not guaranteed, their values change frequently and past performance may not be repeated. BMO (M-bar roundel) is a registered trade-mark of Bank of Montreal, used under licence. 21
Innovative Solutions to Navigate the Market
 BMO Global Asset Management Innovative Solutions to Navigate the Market BMO ETF Based Mutual Funds ETFs are extremely efficient tools that provide great flexibility to our Asset Allocation Team in quickly
ETF Strategies for Rising Interest Rates
 ETF solutions for every investor TM ETF Strategies for Rising Interest Rates October 2013 Nicolas Normandeau, CFA, M.Sc. Vice President and Portfolio Manager, Fixed Income Disclaimer The views expressed
BMO Value ETFs Enhanced Access to the Value Factor
 BMO Exchange Traded Funds BMO Value ETFs Enhanced Access to the Value Factor BMO Value Index ETF (ZVC) BMO MSCI USA Value Index ETF (ZVU) Defining the Value Factor Value factor investing- the pursuit of
Additional series available. Morningstar TM Rating. Funds in category 363. Fixed income % of fixed income allocation
 Sun Life BlackRock Canadian Balanced Fund Investment objective Series A $12.4584 Net asset value per security (NAVPS) as of August 20, 2018 $0.0128 0.10% Benchmark Blended benchmark Fund category Canadian
BMO Global Asset Management. Mutual Funds. Long-Term Investing. Stay invested and realize your goals
 BMO Global Asset Management Mutual Funds Long-Term Investing Stay invested and realize your goals Focus on the BIG picture choosing the right investments Investors have different investment goals. Whatever
BROAD COMMODITY INDEX
 BROAD COMMODITY INDEX COMMENTARY + STRATEGY FACTS JANUARY 2018 100.00% 80.00% 60.00% 40.00% 20.00% 0.00% -20.00% -40.00% -60.00% CUMULATIVE PERFORMANCE ( SINCE JANUARY 2007* ) -80.00% ABCERI S&P GSCI ER
Additional series available. Morningstar TM Rating. Funds in category. Equity style Market cap %
 Sun Life BlackRock Canadian Equity Fund Series A $13.5549 Net asset value per security (NAVPS) as of January 04, 2018 $0.0452 0.33% Benchmark S&P/TSX Capped Composite Index Fund category Canadian Focused
BROAD COMMODITY INDEX
 BROAD COMMODITY INDEX COMMENTARY + STRATEGY FACTS JUNE 2017 80.00% CUMULATIVE PERFORMANCE ( SINCE JANUARY 2007* ) 60.00% 40.00% 20.00% 0.00% -20.00% -40.00% -60.00% -80.00% ABCERI S&P GSCI ER BCOMM ER
Additional series available. Morningstar TM Rating. Funds in category. Fixed income %
 Sun Life Granite Growth Portfolio Series A $13.8069 Net asset value per security (NAVPS) as of March 06, 2018 $0.0088 0.06% Benchmark Blended benchmark Fund category Global Equity Balanced Additional series
Get the Alternative Advantage
 Get the Alternative Advantage Alternative Investments Manage Risk and Potentially Enhance Performance Innovation is our capital. Make it yours. As an asset class, alternative investments have demonstrated
Additional series available. Morningstar TM Rating. Funds in category 797. Fixed income % of fixed income allocation
 Sun Life Granite Growth Portfolio Investment objective Series A $14.1960 CAD Net asset value per security (NAVPS) as of September 14, 2018 $0.0440 0.31% Benchmark Blended benchmark Fund category Global
Additional series available. Morningstar TM Rating. Funds in category 321. Fixed income % of fixed income allocation
 Sun Life Granite Conservative Portfolio Investment objective Series A $11.4092 Net asset value per security (NAVPS) as of August 21, 2018 $-0.0023-0.02% Benchmark Blended benchmark Fund category Global
Additional series available. Morningstar TM Rating. Funds in category. Equity style Market cap %
 Sun Life BlackRock Canadian Composite Equity Class Series A $11.6889 CAD Net asset value per security (NAVPS) as of August 31, 2018 $-0.0752-0.64% Benchmark S&P/TSX Capped Composite Index Fund category
Trailing PE 9.2. Forward PE 8.5. Hold 15 Analysts. 1-Year Return: -10.8% 5-Year Return: 20.4%
 CADIAN IMPERIAL BANK (-T) Last Close 107.09 (CAD) Avg Daily Vol 1.9M 52-Week High 125.21 Trailing PE 9.2 Annual Div 5.44 ROE 17.0% LTG Forecast 4.8% 1-Mo -6.5% December 13 TORONTO Exchange Market Cap 47.6B
Additional series available. Morningstar TM Rating. Funds in category. Fixed income % of fixed income allocation
 Sun Life Granite Balanced Portfolio Series A $13.1649 Net asset value per security (NAVPS) as of November 27, 2017 $-0.0102-0.08% Benchmark Blended benchmark Fund category Global Neutral Balanced Additional
Additional series available. Morningstar TM Rating. Funds in category. Fixed income %
 Sun Life Granite Conservative Portfolio Series A $11.2161 Net asset value per security (NAVPS) as of April 04, 2018 $0.0083 0.07% Benchmark Blended benchmark Fund category Global Fixed Income Balanced
Portfolio Review xxx Quarter 20xx. Evolution 40i60e Model Portfolio Portfolio Review First Quarter 2018
 Portfolio Review xxx Quarter 20xx Evolution 40i60e Model Portfolio Portfolio Review First Quarter 2018 Q1 Overview Diversified portfolios capture gains from asset classes and security types that are performing
Additional series available. Morningstar TM Rating. Funds in category. Equity style Fixed inc style. of fixed income allocation
 Sun Life Granite Conservative Class Series A Additional series available NOTE: This Fund is a class of mutual fund shares of Sun Life Global Investments Corporate Class Inc. $11.5381 Net asset value per
Comparing Exchange Traded Funds to Mutual Funds and Stocks and Bonds
 ETFs 101 Comparing Exchange Traded Funds to Mutual Funds and Stocks and Bonds In an era when investment options may appear endless, the growing popularity of Exchange Traded Funds (ETFs) has taken the
Technical Seasonalities
 Equity Clock: Seasonality Analysis August 25, 2015 Technical Seasonalities eresearch Corporation is pleased to provide technical opinions on the market from a seasonality standpoint, courtesy of Equity
Additional series available. Morningstar TM Rating. Funds in category 960. Fixed income % of fixed income allocation
 Sun Life Granite Moderate Portfolio Investment objective Series A $12.6002 Net asset value per security (NAVPS) as of April 20, 2018 $-0.0024-0.02% Benchmark Blended benchmark Fund category Global Neutral
Select 40i60e Managed Portfolio. Portfolio Review First Quarter 2018
 Select 40i60e Managed Portfolio Portfolio Review First Quarter 2018 Q1 Portfolio Review First Quarter 2018 as at March 31, 2018 Portfolio Performance (Class F) 1 Month 3 Months 6 Months 1 Year 3 Years
Portfolio Review xxx Quarter 20xx. Evolution 100i Model Portfolio Portfolio Review First Quarter 2018
 Portfolio Review xxx Quarter 20xx Evolution 100i Model Portfolio Portfolio Review First Quarter 2018 Q1 Evolution 100i Model Portfolio Standard geographic asset allocation and blend of investment styles
BROAD COMMODITY INDEX
 BROAD COMMODITY INDEX COMMENTARY + STRATEGY FACTS APRIL 2017 80.00% CUMULATIVE PERFORMANCE ( SINCE JANUARY 2007* ) 60.00% 40.00% 20.00% 0.00% -20.00% -40.00% -60.00% -80.00% ABCERI S&P GSCI ER BCOMM ER
Discover the power. of ETFs. Not FDIC Insured May May Lose Lose Value Value No No Bank Bank Guarantee
 Discover the power of ETFs Not FDIC Insured May May Lose Lose Value Value No No Bank Bank Guarantee Discover exchange-traded funds (ETFs) Financial television programs and publications continue to give
Portfolio Review xxx Quarter 20xx. Evolution 50i50e Model Portfolio Portfolio Review Third Quarter 2018
 Portfolio Review xxx Quarter 20xx Evolution 50i50e Model Portfolio Portfolio Review Third Quarter 2018 Q3 Overview Diversified portfolios capture gains from asset classes and security types that are performing
Additional series available. Morningstar TM Rating. Funds in category
 Sun Life Milestone 2035 Fund Series A $14.8651 Net asset value per security (NAVPS) as of February 12, 2018 $0.1080 0.73% Benchmark Blended benchmark Fund category 2035 Target Date Portfolio Additional
Franklin Bissett Canadian Equity Fund
 Product Profile Product Details 1 Fund Assets $3,388,790,133.22 Fund Inception Date 03/01/1983 Base Currency Morningstar Category Distribution Frequency Fund Codes 2 Series Series F Series F ADM Series
Additional series available. Morningstar TM Rating. Funds in category 964. Fixed income % of fixed income allocation
 Sun Life Granite Balanced Portfolio Investment objective Series A $13.0649 CAD Net asset value per security (NAVPS) as of September 06, 2018 $-0.0100-0.08% Benchmark Blended benchmark Fund category Global
CI Portfolios. Portfolio Review First Quarter 2018 ivari CI Growth Portfolio
 CI Portfolios Portfolio Review First Quarter 2018 ivari CI Growth Portfolio Portfolio Performance ivari CI Portfolios are available as Guaranteed Investment Portfolios within select ivari segregated funds
52-Week High Trailing PE Week Low Forward PE Hold 14 Analysts. 1-Year Return: 8.7% 5-Year Return: 43.
 CADIAN IMPERIAL BANK (-T) Last Close 114.56 (CAD) Avg Daily Vol 868,326 52-Week High 120.83 Trailing PE 10.4 Annual Div 5.20 ROE 18.0% LTG Forecast 4.6% 1-Mo 1.7% November 23 TORONTO Exchange Market Cap
Global Multi Asset Global Tactical Asset Alloc $346.8 billion
 Columbia (Model Portfolio Provider) 225 Franklin Street Boston, Massachusetts 02110 Style: Sub-Style: Firm AUM: Firm Strategy AUM: Global Multi Asset Global Tactical Asset Alloc $346.8 billion Year Founded:
BROAD COMMODITY INDEX
 BROAD COMMODITY INDEX COMMENTARY + STRATEGY FACTS AUGUST 2018 120.00% 100.00% 80.00% 60.00% 40.00% 20.00% 0.00% -20.00% -40.00% -60.00% CUMULATIVE PERFORMANCE ( SINCE JANUARY 2007* ) -80.00% ABCERI S&P
ETF Strategies for Rising Interest Rates
 ETF Strategies for Rising Interest Rates Nicolas Normandeau, CFA, M.Sc. Vice President and Portfolio Manager, Fixed Income ETF solutions for every investor May 2013 Disclaimer The views expressed herein
Additional series available. Morningstar TM Rating. Funds in category Fixed income % of fixed income allocation
 Sun Life Granite Moderate Portfolio Series A $12.2384 CAD Net asset value per security (NAVPS) as of December 20, 2018 $-0.0639-0.52% Benchmark Blended benchmark Fund category Global Neutral Balanced Additional
Franklin Bissett Canadian Equity Fund
 Product Profile Product Details Fund Assets $3,388,790,133.22 Fund Inception Date 03/01/1983 Base Currency Morningstar Category Distribution Frequency CAD Canadian Equity Annually Series Inception Date
Additional series available. Morningstar TM Rating. Funds in category 437. Fixed income % of fixed income allocation
 Sun Life Granite Conservative Portfolio Investment objective Series A $11.3234 CAD Net asset value per security (NAVPS) as of April 18, 2019 $0.0289 0.26% Benchmark Blended benchmark Fund category Global
Compounded Returns for Periods Ended March 31, 2018 (%) Franklin Bissett Canadian Short Term
 Franklin Bissett Canadian Short Term") Franklin Bissett Canadian Short Term Bond Fund Series F Product Profile First Quarter 2018 FUND CHARACTERISTICS (AS OF 3/31/18) Fund Inception Date 12/22/03 Distributions Monthly Morningstar Category Canadian
Franklin Bissett Canadian Short Term Bond Fund Series F Product Profile First Quarter 2018 FUND CHARACTERISTICS (AS OF 3/31/18) Fund Inception Date 12/22/03 Distributions Monthly Morningstar Category Canadian
BROAD COMMODITY INDEX
 BROAD COMMODITY INDEX COMMENTARY + STRATEGY FACTS JULY 2018 100.00% 80.00% 60.00% 40.00% 20.00% 0.00% -20.00% -40.00% -60.00% CUMULATIVE PERFORMANCE ( SINCE JANUARY 2007* ) -80.00% ABCERI S&P GSCI ER BCOMM
Franklin Bissett Canadian Equity Fund
 Product Profile Product Details Fund Assets $3,329,185,070.09 Fund Inception Date 03/01/1983 Base Currency Morningstar Category Distribution Frequency Risk Classification 1 Low Low to Medium Medium Medium
Additional series available. Morningstar TM Rating - Funds in category - Equity style Market cap %
 Sun Life MFS Low Volatility International Equity Fund Investment objective Series A $8.7749 Net asset value per security (NAVPS) as of April 1, 2018 $0.0005 0.01% Benchmark MSCI EAFE C$ Index Fund category
2017 Annual Management Report of Fund Performance
 (the Fund ) For the 12-month period ended September 30, 2017 (the Period ) Manager: BMO Investments Inc. (the Manager or BMOII ) Portfolio manager: BMO Asset Management Inc., Toronto, Ontario (the portfolio
Discover the power. of ETFs. Not FDIC Insured May May Lose Lose Value Value No No Bank Bank Guarantee
 Discover the power of ETFs Not FDIC Insured May May Lose Lose Value Value No No Bank Bank Guarantee Discover exchange-traded funds (ETFs) Financial television programs and publications continue to give
2018 Annual Management Report of Fund Performance
 (the Fund ) For the 12-month period ended September 30, 2018 (the Period ) Manager: BMO Investments Inc. (the Manager or BMOII ) Portfolio manager: BMO Asset Management Inc., Toronto, Ontario (the portfolio
2018 Semi-Annual Management Report of Fund Performance
 (the Fund ) For the six-month period ended March 31, 2018 (the Period ) Manager: BMO Investments Inc. (the Manager or BMOII ) Portfolio manager: BMO Asset Management Inc., Toronto, Ontario (the portfolio
Additional series available. Morningstar TM Rating. Funds in category. Equity style Market cap %
 Sun Life MFS Dividend Income Fund Series A $13.3108 Net asset value per security (NAVPS) as of December 22, 2017 $-0.0115-0.09% Benchmark S&P/TSX Capped Composite Index Fund category Canadian Dividend
Additional series available. Morningstar TM Rating. Funds in category Fixed income % of fixed income allocation
 Sun Life Granite Moderate Portfolio Series A $12.0677 CAD Net asset value per security (NAVPS) as of January 15, 2019 $0.0353 0.29% Benchmark Blended benchmark Fund category Global Neutral Balanced Additional
Views expressed at the July Face to Face with Fidelity in Boston
 Daniel Dupont and Hugo Lavallée s Perspectives on Canadian Equities Dan Dupont manages a number of Fidelity Funds, including Fidelity Concentrated Value Private Pool. The Pool typically has between 20
Why Tactical Portfolio Management?
 Why Tactical Portfolio Management? A long-term perspective of the Dow Jones Industrial Average since 1896 reveals the reality that there are extended periods of time in which the US equity market will
Additional series available. Morningstar TM Rating. Funds in category 431. Credit quality %
 Sun Life MFS Dividend Income Fund Investment objective Series A $12.9438 CAD Net asset value per security (NAVPS) as of October 05, 2018 $-0.0365-0.28% Benchmark S&P/TSX Capped Composite Index Fund category
BMO S&P/TSX Equal Weight Banks Index ETF (ZEB) (the ETF )
 (the ETF )") SEMI-ANNUAL MANAGEMENT REPORT OF FUND PERFORMANCE BMO S&P/TSX Equal Weight Banks Index ETF (ZEB) (the ETF ) For the six-month period ended June 30, 2017 (the Period ) Manager: BMO Asset Management Inc.
SEMI-ANNUAL MANAGEMENT REPORT OF FUND PERFORMANCE BMO S&P/TSX Equal Weight Banks Index ETF (ZEB) (the ETF ) For the six-month period ended June 30, 2017 (the Period ) Manager: BMO Asset Management Inc.
ScotiaFunds. Simplified Prospectus. January 18, Series I units of
 ScotiaFunds Simplified Prospectus January 18, 2018 Series I units of 1832 AM Canadian Dividend LP 1832 AM Canadian Growth LP 1832 AM Canadian Preferred Share LP 1832 AM Global Completion LP 1832 AM North
Building Better Portfolios Principles of Successful Investing
 Building Better Portfolios Principles of Successful Investing The benefits of diversification MANAGE RISK AND SMOOTH OUT POTENTIAL RETURNS MARKETS WILL ALWAYS GO UP AND DOWN, BUT NO ONE LIKES TO SEE THEIR
Calamos Phineus Long/Short Fund
 Calamos Phineus Long/Short Fund Performance Update SEPTEMBER 18 FOR INVESTMENT PROFESSIONAL USE ONLY Why Calamos Phineus Long/Short Equity-Like Returns with Superior Risk Profile Over Full Market Cycle
Emerging markets: Issuance frenzy and complacency about growing risks
 By Naman Agarwal November 3, 2017 Low interest rates have propelled a search for yield and rotation into higher-yielding emerging market (EM) debt, resulting in record inflows into the asset class. As
Get active with Vanguard factor ETFs
 Get active with Vanguard factor ETFs Factor investing has gained attention in recent years, in part because of the rise of alternatively weighted indexes and smart-beta products. Yet factor investing has
Additional series available. Morningstar TM Rating. Funds in category. Equity style Market cap %
 Sun Life MFS Canadian Equity Growth Fund Series A $48.7284 Net asset value per security (NAVPS) as of February 12, 2018 $0.6295 1.31% Benchmark Blended benchmark Fund category Canadian Focused Equity Additional
MANAGED FUTURES INDEX
 MANAGED FUTURES INDEX COMMENTARY + STRATEGY FACTS SEPTEMBER 2018 CUMULATIVE PERFORMANCE ( SINCE JANUARY 2007* ) 140.00% 120.00% 100.00% 80.00% 60.00% 40.00% 20.00% 0.00% AMFERI BARCLAY BTOP50 CTA INDEX
FIRM OVERVIEW PRESENTATION
 FIRM OVERVIEW PRESENTATION AS OF MARCH 31 Q1 2016 Portfolio Managers: Robert Stein, John Eckstein, & Bryan Novak ABOUT WHO WE ARE Astor Investment Management LLC ( Astor ) is a Chicago-based, registered
Additional series available. Morningstar TM Rating. Funds in category Equity style Market cap %
 Sun Life MFS Global Growth Fund Investment objective Series A $20.3181 CAD Net asset value per security (NAVPS) as of September 14, 2018 $0.0919 0.45% Benchmark MSCI AC World C$ Index Fund category Global
Investing Handbook. Portfolio, Action & Research Team. Understanding the Three Major Asset Classes: Cash, Bonds and Stocks
 2013 Portfolio, Action & Research Team Investing Handbook Understanding the Three Major Asset Classes: Cash, Bonds and Stocks Stéphane Rochon, CFA, Equity Strategist Natalie Robinson, Data Research and
Portfolio Review xxx Quarter 20xx. Evolution 70i30e Model Portfolio Portfolio Review Third Quarter 2018
 Portfolio Review xxx Quarter 20xx Evolution 70i30e Model Portfolio Portfolio Review Third Quarter 2018 Q3 Evolution 70i30e Model Portfolio Standard geographic asset allocation and blend of investment styles
Why and How to Pick Tactical for Your Portfolio
 Why and How to Pick Tactical for Your Portfolio A TACTICAL PRIMER Markets and economies have exhibited characteristics over the past two decades dissimilar to the years which came before. We have experienced
Additional series available. Morningstar TM Rating. Funds in category. Equity style Market cap %
 Sun Life Excel Emerging Markets Fund Series A $11.1198 Net asset value per security (NAVPS) as of June 22, 18 $0.0811 0.73% Benchmark MSCI Emerging Markets C$ Index Fund category Emerging Markets Equity
TARGET EXCESS YIELD SUITE
 TARGET EXCESS YIELD SUITE MARCH 2015 Newfound Case ID: 3377056 1 THE NEWFOUND MISSION Newfound Research s product suite has been designed to balance the desire to pursue growth with the need to avoid large
Portfolio Series Balanced Fund. Portfolio Review Fourth Quarter 2017
 Portfolio Review Fourth Quarter 2017 Q4 Portfolio Performance (Class F) 1 Month 3 Months 6 Months 1 Year 3 Years 5 Years 10 Years Since Inception (November 1988) -0.6% 2.8% 3.3% 7.5% 6.2% 9.2% 6.0% 5.9%
Trailing PE Forward PE Buy 11 Analysts. 1-Year Return: 3.0% 5-Year Return: -19.7%
 ENCANA CORP (-T) Last Close 14.70 (CAD) Avg Daily Vol 3.3M 52-Week High 18.54 Trailing PE 188.1 Annual Div 0.08 ROE 0.7% LTG Forecast 36.4% 1-Mo -7.8% October 12 TORONTO Exchange Market Cap 14.0B 52-Week
AlphaSolutions Sector Rotation Model
 AlphaSolutions Sector Rotation Model An investment model based on trending and momentum strategies Portfolio Goals Primary: Seeks long term growth of capital by investing in highranked U.S. Equity Sectors
1607 GROUP AT MORGAN STANLEY
 W E A L T H M A N A G E M E N T I. Overview TABLE OF CONTENTS: II. 1607 Portfolio III. 1607 Income Growth Portfolio IV. Investment Team WEALTH MANAGEMENT WEALTH MANAGEMENT O V E R V I E W Our Business:
Understanding Exchange-Traded Funds (ETFs) A guide to TD Asset Management Inc. s (TDAM) ETF solutions
 A guide to TD Asset Management Inc. s (TDAM) ETF solutions") Understanding Exchange-Traded Funds (ETFs) A guide to TD Asset Management Inc. s (TDAM) ETF solutions Understanding ETFs Investment in exchange-traded funds (ETFs) has boomed in recent years, with the
Understanding Exchange-Traded Funds (ETFs) A guide to TD Asset Management Inc. s (TDAM) ETF solutions Understanding ETFs Investment in exchange-traded funds (ETFs) has boomed in recent years, with the
Additional series available. Morningstar TM Rating. Funds in category 345. Equity style Market cap %
 Sun Life MFS International Growth Fund Investment objective Series A $16.3429 Net asset value per security (NAVPS) as of April 03, 2018 $-0.2047-1.24% Benchmark MSCI EAFE C$ Index Fund category International
Annual Management Report of Fund Performance
 The Lonsdale Tactical Balanced Portfolio For the Period Ended This interim management report of fund performance contains financial highlights but does not contain either interim or annual financial statements
MANAGED FUTURES INDEX
 MANAGED FUTURES INDEX COMMENTARY + STRATEGY FACTS JUNE 2018 CUMULATIVE PERFORMANCE ( SINCE JANUARY 2007* ) 120.00% 100.00% 80.00% 60.00% 40.00% 20.00% 0.00% AMFERI BARCLAY BTOP50 CTA INDEX S&P 500 S&P
Columbus Asset Allocation Report For Portfolio Rebalancing on
 Columbus Asset Allocation Report For Portfolio Rebalancing on 2017-08-31 Strategy Overview Columbus is a global asset allocation strategy designed to adapt to prevailing market conditions. It dynamically
Portfolio Series Conservative Balanced Fund. Portfolio Review Fourth Quarter 2017
 Portfolio Review Fourth Quarter 2017 Q4 Portfolio Review Fourth Quarter 2017 as at December 31, 2017 Portfolio Performance (Class F) 1 Month 3 Months 6 Months 1 Year 3 Years 5 Years 10 Years Since Inception
52-Week High Trailing PE Week Low Forward PE -- NA 0 Analysts. 1-Year Return: -1.8% 5-Year Return: 3.6%
 CANOE EIT INCOME FUND (-T) Last Close 11.85 (CAD) Avg Daily Vol 129,767 52-Week High 12.08 Trailing PE 17.6 Annual Div 1.20 ROE 5.5% LTG Forecast 1-Mo 1.8% 2018 June 06 TORONTO Exchange Market Cap (Consol)
MANAGED FUTURES INDEX
 MANAGED FUTURES INDEX COMMENTARY + STRATEGY FACTS JULY 2018 CUMULATIVE PERFORMANCE ( SINCE JANUARY 2007* ) 120.00% 100.00% 80.00% 60.00% 40.00% 20.00% 0.00% AMFERI BARCLAY BTOP50 CTA INDEX S&P 500 S&P
Additional series available. Morningstar TM Rating. Funds in category 529. Equity style Market cap % Micro 11.7
 Sun Life Sentry Value Fund Investment objective Series A $13.5020 CAD Net asset value per security (NAVPS) as of November 09, 2018 $-0.0924-0.68% Benchmark S&P/TSX Composite Index Fund category Canadian
MANAGED FUTURES INDEX
 MANAGED FUTURES INDEX COMMENTARY + STRATEGY FACTS JULY 2017 CUMULATIVE PERFORMANCE ( SINCE JANUARY 2007* ) 120.00% 100.00% 80.00% 60.00% 40.00% 20.00% 0.00% AMFERI BARCLAY BTOP50 CTA INDEX S&P 500 S&P
Trailing PE Forward PE Buy 13 Analysts. 1-Year Return: 5.0% 5-Year Return: 115.5%
 ALGONQUIN POWER & UTILITIES (-T) Last Close 13.75 (CAD) Avg Daily Vol 950,518 52-Week High 14.40 Trailing PE 25.9 Annual Div 0.67 ROE 7.0% LTG Forecast 6.1% 1-Mo 3.3% September 21 TORONTO Exchange Market
Additional series available. Morningstar TM Rating. Funds in category 447. Equity style Market cap %
 Sun Life MFS International Growth Fund Investment objective Series A $15.6992 CAD Net asset value per security (NAVPS) as of April 05, 2019 $0.0574 0.37% Benchmark MSCI EAFE C$ Index Fund category International
A NEW ALTERNATIVE FOR TODAY S INVESTOR. Franklin K2 Multi-Strategy Alternatives Fund
 A NEW ALTERNATIVE FOR TODAY S INVESTOR Franklin K2 Multi-Strategy Alternatives Fund MOVING BEYOND THE TRADITIONAL Concerns about the low growth environment, geopolitical instability and interest rate uncertainty
December 31, June 30,
 A long-term perspective of the Dow Jones Industrial Average since 1896 reveals the reality that there are extended periods of time in which the US equity market will trend generally upwards, and also lengthy
Additional series available. Morningstar TM Rating. Funds in category. Equity style Market cap %
 Sun Life Dynamic American Fund Series A Additional series available Note: Effective February 10, 2017, Sun Life Dynamic American Value Fund was renamed Sun Life Dynamic American Fund. $13.5130 Net asset
SPDR MSCI Canada StrategicFactors SM ETF
 SPDR MSCI Canada StrategicFactors SM ETF Summary Prospectus-January 31, 2016 (as revised July 15, 2016) QCAN (NYSE Ticker) Before you invest in the SPDR MSCI Canada StrategicFactors SM ETF (the Fund ),
Catalyst Hedged Commodity Strategy Fund
 Catalyst Hedged Commodity Strategy Fund CFHAX, CFHCX & CFHIX 2017 Q4 About Catalyst Funds Intelligent Alternatives We strive to provide innovative strategies to support financial advisors and their clients
Smart Beta Dashboard. Thoughts at a Glance. June By the SPDR Americas Research Team
 By the SPDR Americas Research Team Thoughts at a Glance Factor performance diverged across regions in Q2. In the US, all factors with the exception of underperformed broad US equities. As volatility in
Franklin Bissett Small Cap Fund
 Product Profile Product Details 1,2 Fund Assets $504,844,321.76 Fund Inception Date 08/30/1993 Number of Issuers 42 Base Currency CAD Morningstar Category - Distribution Frequency Annually Inception Date
q merrill edge guided investing strategy profile CIO Moderately Conservative ETF Core Tax Aware
 Overview This Strategy seeks to provide diversified exposure among three major asset classes for a client's account with a moderately conservative target asset allocation. In normal market conditions,
Portfolio Construction Including ETFs: Impressive Opportunities and Clear Benefits
 Portfolio Construction Including ETFs: Impressive Opportunities and Clear Benefits Rohit Mehta Executive Vice-President, Distribution & Strategy First Asset Investment Management, Inc. ETF AUM over the
Select 60i40e Managed Portfolio. Portfolio Review Fourth Quarter 2017
 Select 60i40e Managed Portfolio Portfolio Review Fourth Quarter 2017 Q4 Portfolio Review Fourth Quarter 2017 as at December 31, 2017 Portfolio Performance (Class F) 1 Month 3 Months 6 Months 1 Year 3 Years
Additional series available. Morningstar TM Rating. Funds in category 192. Equity style Market cap %
 Sun Life Sionna Canadian Small Cap Equity Class Series A Additional series available Note: Sun Life Sionna Canadian Small Cap Equity Class will be closed effective November 16, 2018. View press release.
MANAGED FUTURES INDEX
 MANAGED FUTURES INDEX COMMENTARY + STRATEGY FACTS JANUARY 2019 CUMULATIVE PERFORMANCE ( SINCE JANUARY 2007* ) 140.00% 120.00% 100.00% 80.00% 60.00% 40.00% 20.00% 0.00% AMFERI BARCLAY BTOP50 CTA INDEX S&P
MFS Investment Management 500 Boyleston Street Boston, Massachusetts 02116
 Investment Management 500 Boyleston Street Boston, Massachusetts 02116 MANAGER'S INVESTMENT PROCESS RISK CONSIDERATIONS Bottom-up idea generation within a sector-neutral framework, managed by a team of
Additional series available. Morningstar TM Rating. Funds in category 987. Fixed inc style Credit quality %
 Sun Life Dynamic Strategic Yield Fund Investment objective Series A $9.5706 CAD Net asset value per security (NAVPS) as of November 15, 2018 $0.0144 0.15% Benchmark Blended benchmark Fund category Global
Spotlight on: 130/30 strategies. Combining long positions with limited shorting. Exhibit 1: Expanding opportunity. Initial opportunity set
 INVESTMENT INSIGHTS Spotlight on: 130/30 strategies Monetizing positive and negative stock views Managers of 130/30 portfolios seek to capture potential returns in two ways: Buying long to purchase a stock
2017 Annual Management Report of Fund Performance
 (the Fund ) For the 12-month period ended September 30, (the Period ) Manager: BMO Investments Inc. (the Manager or BMOII ) Portfolio manager: BMO Asset Management Inc., Toronto, Ontario (the portfolio
Advisor Guide FOR ADVISOR USE ONLY NOT FOR DISTRIBUTION TO CLIENTS
 Advisor Guide FOR ADVISOR USE ONLY NOT FOR DISTRIBUTION TO CLIENTS Managed solutions can provide many benefits to your practice. Their convenience allows you to shift your time from portfolio construction
Trailing PE 8.9. Forward PE 8.0. Hold 7 Analysts. 1-Year Return: -17.0% 5-Year Return: -13.9%
 ER CORPORATION OF CANADA (-T) Last Close 27.12 (CAD) Avg Daily Vol 905,847 52-Week High 33.21 Trailing PE 8.9 Annual Div 1.53 ROE 9.9% LTG Forecast 6.3% 1-Mo 0.9% November 15 TORONTO Exchange Market Cap
We are Different. So what has changed that caused our strategy to need to be different?
 BMO Nesbitt Burns Our priority in working with our clients is to assist them in achieving the fullness of life and to improve their condition including that of their families, heirs and charitable legacies.