Leveraged Loan Investor Monthly
|
|
|
- Edith Mason
- 6 years ago
- Views:
Transcription

1 Leveraged Loan Investor Monthly Thomson Reuters LPC July 2012 Colm Doherty Director of Analytics Hugo Pereira Senior Market Analyst
2 Leveraged Loan Investor Monthly Key Sections Investor Overview slides 3 to 7. CLO Market Analysis - slides 8 to 29 Loan Mutual Fund Flows & Returns slides 30 to 37 Leveraged Loan Market Overview slides 38 to 50 Default Probability Analysis slides 51 to 53 CDS Market Snapshot slides 54 to 56 2


3 Investor Overview
4 Sep-11 Oct-11 Nov-11 Dec-11 Jan-12 Feb-12 Mar-12 Apr-12 May-12 Jun-12 CLO Aggregate Principal Balance ($Bils.) Loan Fund Total Assets ($Bils.) U.S. CLO and loan mutual fund assets under management Assets under management CLOs* Loan Mutual Funds U.S. CLO assets under management* now at $249 billion versus $80 billion for loan mutual funds. *Based on a universe of 613 U.S. CLOs Source: Thomson Reuters LPC Collateral, Lipper, Thomson Reuters LPC 4


5 Investor share of leveraged loan outstandings Share of U.S. leveraged loan market outstandings CLOs*, 43.4% Other, 42.1% Loan mutual funds, 14.5% CLOs hold 43% of leveraged loan outstandings, while loan mutual funds currently account for 14.5%. *Based on a universe of 613 U.S. CLOs Source: Thomson Reuters LPC 5
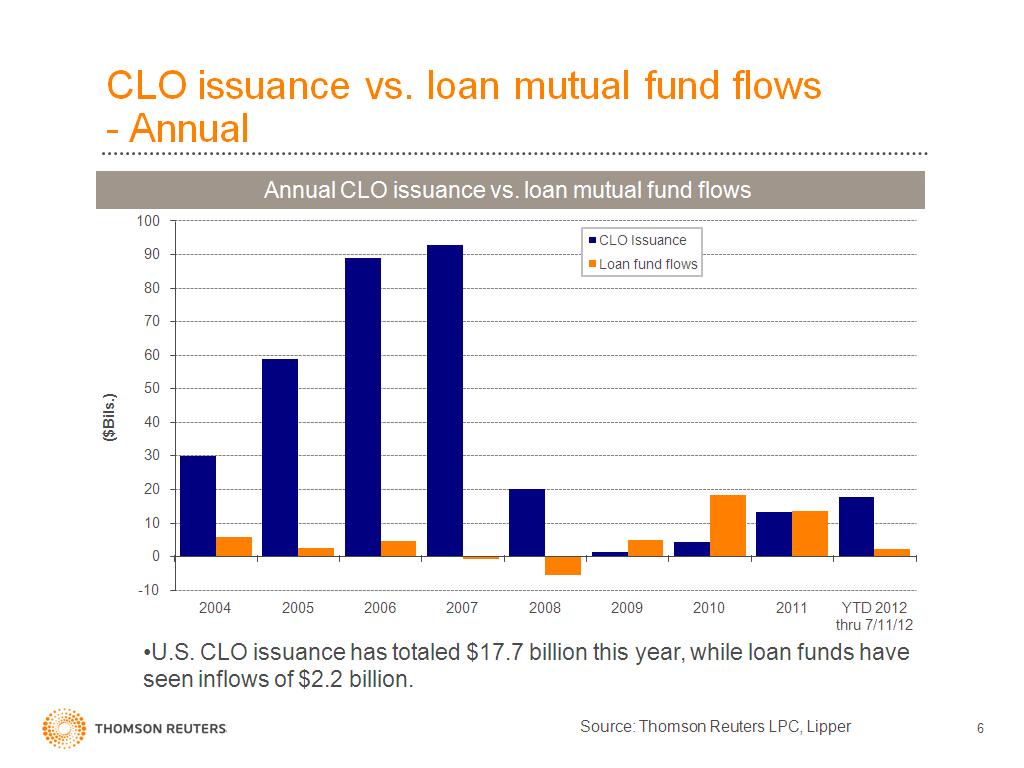
6 6
7 7
8 CLO Market Analysis
9 Oct-11 Nov-11 Dec-11 Jan-12 Feb-12 Mar-12 Apr-12 May-12 Jun-12 CLO aggregate principal balance (USD Bils.) CLO aggregate principal balance (EUR Bils.) CLO aggregate principal balance CLO aggregate balance: U.S & Europe U.S. Europe U.S. CLOs aggregate balance is now at $249 billion, European CLOs are at 75 billion euros. Source: Thomson Reuters LPC Collateral 9
10 Sep-11 Oct-11 Nov-11 Dec-11 Jan-12 Feb-12 Mar-12 Apr-12 May-12 Jun-12 U.S. middle market CLO aggregate principal balance (USD$ Bils.) Middle market CLO aggregate principal balance 22 U.S. middle market CLO APB The U.S. middle market CLO aggregate balance now stands at $19.5 billion. Source: Thomson Reuters LPC Collateral 10
11 Loan share of CLO assets Loan share of CLO assets Loan share of U.S. CLO assets 100% 95% Dollar weighted Average 90% 85% 80% 75% <= CLO vintage Newer vintage CLOs have a higher share of loan assets. Source: Thomson Reuters LPC Collateral 11
12 Avg. second-lien loan share of CLO assets Second-lien loan share of CLO assets 3.5% Average second-lien loan share of U.S. CLO assets 3.0% 2.5% 2.0% 1.5% 1.0% 0.5% 0.0% <= CLO vintage Newer vintage CLOs hold a lower share of second-lien loans. Source: Thomson Reuters LPC Collateral 12
13 >=Baa3 Ba1 Ba2 Ba3 B1 B2 B3 Caa1 Caa2 <=Caa3 NR Share of CLO loan holdings (%) Distribution of CLO loan holdings by rating 30% U.S. CLO loan holdings distribution by rating 25% 20% 15% 10% 5% 0% Over half (54%) of underlying CLO loans are rated B1 or B2. Ba1/Ba2/Ba3 rated loans account for 21% of CLO loan holdings. Source: Thomson Reuters LPC Collateral 13
14 >=2019 Share of maturing loan volume Distribution of CLO loan holdings by maturity 25% Distribution of U.S. CLO loan maturities 20% 15% 10% 5% 0% Loan Maturity Nearly two-thirds (65%) of loans held by CLOs mature in the time period. 17% of loans mature in Source: Thomson Reuters LPC Collateral 14
15 <= Share of CLO loan holdings (%) CLO holdings by loan vintage 45% 40% U.S. CLO loan holdings by vintage 35% 30% 25% 20% 15% 10% 5% 0% Loan vintage Three-quarters of loans held by CLOs have been issued since Source: Thomson Reuters LPC Collateral 15
16 <80 80 to <90 90 to <91 91 to <92 92 to <93 93 to <94 94 to <95 95 to <96 96 to <97 97 to <98 98 to <99 99 to <100 Share of CLOs (%) Distribution of CLO weighted average loan bids 30% U.S. CLO weighted average loan bid distribution 25% 20% 15% 10% 5% 0% CLO weighted avg. loan bid Nearly half (49%) of CLOs have a weighted average loan bid in the 96 to 98 price range. Source: Thomson Reuters LPC Collateral 16
17 Sep-11 Sep-11 Oct-11 Nov-11 Dec-11 Jan-12 Feb-12 Mar-12 Apr-12 May-12 Jul-12 CLO weighted avg. CLO loan bid (% of par) CLO weighted average loan bids CLO weighted average loan bids: U.S. vs. Europe U.S. CLOs Europe CLOs The weighted average U.S. CLO loan bid is now at For European CLOs it s Source: Thomson Reuters LPC Collateral 17
18 Sep-11 Sep-11 Oct-11 Nov-11 Dec-11 Jan-12 Feb-12 Mar-12 Apr-12 May-12 Jul-12 CLO weighted avg. loan bid (% of par) CLO weighted average loan bids by vintage U.S. CLO weighted average loan bids < >=2009 Overall Newer vintage U.S. CLOs hold a greater share of higher bid loans than older vintage CLOs. Source: Thomson Reuters LPC Collateral 18
19 Weighted avg. loan bid (% of par) CLO loan bid by end of reinvestment period 100 U.S. CLO loan bid by end of reinvestment period <=1H12 2H >=2015 End of Reinvestment Period CLOs past their reinvestment date (which tend to be older vintage CLOs) are holding a higher share of lower bid loans. Source: Thomson Reuters LPC Collateral 19
20 Weighted avg. loan bid (% of par) CLO loan bid by vintage including and excluding CLOs past their reinvestment date U.S. CLO loan bid by CLO vintage excluding CLOs past reinvestment date 98 All CLOs Excluding CLOs past reinvestment date < >=2009 CLO vintage Excluding CLOs past their reinvestment date pushes weighted average bids higher particularly in older vintage CLOs. Source: Thomson Reuters LPC Collateral 20
21 >=Baa3 Ba1 Ba2 Ba3 B1 B2 B3 Caa1 Caa2 <=Caa3 NR Share of CLO loan holdings (%) Rating distribution by CLO vintage U.S. CLO loan holdings ratings distribution by vintage 35% 30% 25% <= >= % 15% Rated Ba1/Ba2/Ba3: Pre-2006 = 22% 2006 to 2008 = 21% >=2009 = 18% Rated B3 and below: Pre-2006 = 23% 2006 to 2008 = 18% >=2009 = 15% 10% 5% 0% Older vintage CLOs have a higher share of lower rated and higher rated loans. Newer vintage CLOs have a greater loan concentration in the B1/B2 rating categories. Source: Thomson Reuters LPC Collateral 21
22 <= Share of CLO loan holdings (%) CLO holdings by loan vintage 55% 50% U.S. CLO holdings by loan vintage 45% 40% 35% Pre-2009 vintage CLOs >=2009 vintage CLOs 30% 25% 20% 15% 10% 5% 0% Loan vintage Newer vintage CLOs have a higher share of loans issued since 2011 in their portfolios. Source: Thomson Reuters LPC Collateral 22
23 <= Share of CLO loans with Libor floors (%) Share of CLO loans with Libor floors Share of U.S. CLO loans with Libor floors 100% 90% 80% 70% 60% 50% 40% 30% 20% 10% Share loans with LIBOR floors Avg. LIBOR Floor Avg. LIBOR spread Avg. libor spread / libor floor (bps) 0% 0 CLO vintage Newer vintage CLOs hold a higher share of loans that have Libor floors and have higher spreads. Source: Thomson Reuters LPC Collateral 23
24 <= Cash balance as percent of CLO assets (%) Share of CLO oustanding balance (%) Cash balance by CLO vintage Cash balance by U.S. CLO vintage Cash Share of CLO outstandings CLO vintage Older vintage CLOs have a relatively higher share of their assets in cash. Source: Thomson Reuters LPC Collateral 24
25 Cash balance as percent of CLO assets Cash balance by end of reinvestment period 6% Cash balances by end of CLO reinvestment period 5% 4% 3% 2% 1% 0% <=1h12 2H End of CLO Reinvestment Period Consistent with older vintage CLOs having more cash, CLOs whose reinvestment period has ended have a higher share of their assets in cash. Source: Thomson Reuters LPC Collateral 25
26 Univision Comm. Communit y Health TXU TLB Charter Comm. Biomet TLB Del Monte TLB Clarke America HCA Inc. TLB3 Carestrea m Reynolds Group Asurion TL Service Master First Data TL SunGard Data Las Vegas Sands Royalty Pharma Cablevisio n Sys Univar NV TLB Freescale Semi TLB Aramark TLB Sum of U.S. CLO loan holdings ($Bils.) Number of CLOs Top CLO loan holdings Top U.S. CLO loan holdings Sum of CLO Holdings ($ Bils.) Count (# of CLOs) Univision, Community Health, and TXU s term loan B s are the top tranche holdings in CLOs. Source: Thomson Reuters LPC Collateral 26
27 Univision Comm. Communit y Health TXU TLB Charter Comm. Biomet TLB Del Monte TLB Clarke America HCA Inc. TLB3 Carestrea m Reynolds Group Asurion TL Service Master First Data TL SunGard Data Las Vegas Sands Royalty Pharma Cablevisio n Sys Univar NV TLB Freescale Semi TLB Aramark TLB Sum of U.S. CLO loan holdings ($Bils.) Loan avg. bid (% of par) Top CLO loan holdings & current secondary loan price Top U.S. CLO loan holdings & their current secondary loan price 2.5 Sum of CLO Holdings ($ Bils.) Avg. Bid Notably some of the top tranches are the highly levered LBOs of the precrisis period. Source: Thomson Reuters LPC Collateral 27
28 Univision Comm. TLB Community Health TLB TXU TLB Charter Comm. TLC Biomet TLB Del Monte TLB Clarke American HCA Inc. TLB3 Carestream Health TLB Reynolds Group TLE Asurion TL Service Master TLB First Data TL SunGard Data Sys Las Vegas Sands TLB Royalty Pharma TL Cablevision Sys TLB3 Univar NV TLB Freescale Semi TLB Aramark TLB Sum of U.S. CLO loan holdings ($Bils.) Share of loan size (%) Top CLO loan holdings & their share of loan size Top U.S. CLO loan holdings & their share of loan size Sum of CLO Holdings ($ Bils.) Share of loan size Source: Thomson Reuters LPC Collateral 28
29 Health, Ed & Childcare Broadcastin g and Ent. Electronics Diversified/ Cong. Srvce Telecom Retail Stores Chem., Plastics & Rubber Finance Auto Personal, Food & Misc Srvce Bev, Food & Tobacco Utilities Share of CLO loan holdings Avg. loan bid (% of par) CLO loan holdings by top industries U.S. CLO loan holdings by industry 14% Share of CLO loan holdings Avg Bid % 98 10% 96 8% 94 6% 4% 92 2% 90 0% 88 The top sector holding is Health, Education, and Childcare (12.2%), followed by Broadcasting & Entertainment (7.8%). Source: Thomson Reuters LPC Collateral 29
30 Loan Mutual Fund Flows & Returns
31 31
32 32
33 Jan-11 Feb-11 Mar-11 Apr-11 May-11 Jun-11 Jul-11 Aug-11 Sep-11 Oct-11 Nov-11 Dec-11 Jan-12 Feb-12 Mar-12 Apr-12 May-12 Jun-12 Returns (%) Loan mutual funds vs. loan index Monthly returns Monthly fund vs. index returns Open-end Loan Mutual Funds* S&P/LSTA Leveraged Loan Index Open-end loan funds returned 0.76% in June, compared to a 0.68% gain for the S&P/LSTA loan index. *Based on a straight average of all open-end loan mutual fund returns. Source: Lipper, Thomson Reuters LPC, S&P/LSTA Leveraged Loan Index 33
34 H12 Returns (%) Loan mutual funds vs. loan index - Annual returns Annual fund vs. index returns Open-end Loan Mutual Funds* S&P/LSTA Leveraged Loan Index Open-end loan funds have returned 4.33% through June, versus 4.54% for the S&P/LSTA loan index. *Based on a straight average of all open-end loan mutual fund returns. Source: Lipper, Thomson Reuters LPC, S&P/LSTA Leveraged Loan Index 34
35 Jan-11 Feb-11 Mar-11 Apr-11 May-11 Jun-11 Jul-11 Aug-11 Sep-11 Oct-11 Nov-11 Dec-11 Jan-12 Feb-12 Mar-12 Apr-12 May-12 Jun-12 Returns (%) Open-end vs. closed-end* loan mutual funds Monthly returns Open-end vs. closed-end fund returns Open-end Funds* Closed-end Funds* Closed-end loan funds returned 1.07% in June, compared to a 0.76% gain for open-end loan funds. *Based on a straight average of all loan mutual fund returns. *Closed-end fund returns based on NAV. Source: Lipper, Thomson Reuters LPC 35
36 Jan-11 Feb-11 Mar-11 Apr-11 May-11 Jun-11 Jul-11 Aug-11 Sep-11 Oct-11 Nov-11 Dec-11 Jan-12 Feb-12 Mar-12 Apr-12 May-12 Jun-12 Returns (%) Loan vs. HY bond mutual funds Monthly returns Monthly fund returns Open-end Loan Mutual Funds* Open-end HY Bond Mutual Funds* Open-end HY bond funds gained1.85% in June, compared to a return 0.76% for loan funds. *Based on a straight average of all open-end mutual fund returns. Source: Lipper, Thomson Reuters LPC 36
37 H12 Returns (%) Loan vs. HY bond mutual funds Annual returns Annual fund returns Open-end Loan Mutual Funds Open-end HY Bond Mutual Funds Open-end HY bond funds gained 6.63% in the first half of 2012 compared to a return of 4.33% for open-end loan funds. *Based on a straight average of all open-end mutual fund returns. Source: Lipper, Thomson Reuters LPC 37
38 Leveraged Loan Market Overview
39 Jan-10 Feb-10 Mar-10 Apr-10 May- Jun-10 Jul-10 Aug-10 Sep-10 Oct-10 Nov-10 Dec-10 Jan-11 Feb-11 Mar-11 Apr-11 May- Jun-11 Jul-11 Aug-11 Sep-11 Oct-11 Nov-11 Dec-11 Jan-12 Feb-12 Mar-12 Apr-12 May- Jun-12 Issuance ($ Bils.) Institutional loan and HY Bond issuance - monthly 60 Monthly issuance HY Bonds Inst. Loans Institutional loan issuance totaled $17.7 billion in June, HY bond issuance reached $8.1 billion. Source: Thomson Reuters LPC 39
40 1Q05 2Q05 3Q05 4Q05 1Q06 2Q06 3Q06 4Q06 1Q07 2Q07 3Q07 4Q07 1Q08 2Q08 3Q08 4Q08 1Q09 2Q09 3Q09 4Q09 1Q10 2Q10 3Q10 4Q10 1Q11 2Q11 3Q11 4Q11 1Q12 2Q12 Issuance ($ Bils.) Institutional loan and HY Bond issuance - quarterly Quarterly issuance HY Bonds Inst. Loans Institutional loan issuance totaled $68.4 billion in 2Q12 versus $47.9 billion for HY bonds. Source: Thomson Reuters LPC 40
41 Jan-09 Feb-09 Mar-09 Apr-09 May-09 Jun-09 Jul-09 Aug-09 Sep-09 Oct-109 Nov-09 Dec-09 Jan-10 Feb-10 Mar-10 Apr-10 May-10 Jun-10 Jul-10 Aug-10 Sep-10 Oct-10 Nov-10 Dec-10 Jan-11 Feb-11 Mar-11 Apr-11 May-11 Jun-11 Jul-11 Aug-11 Sep-11 Oct-11 Nov-11 Dec-11 Jan-12 Feb-12 Mar-12 Apr-12 May-12 Jun-12 Issuance ($ Bils.) HY bond for loan takeouts 16 HY bond for loan takeouts HY bond for loan takeouts slipped to $1.7 billion in June. Year-to-date totals $45 billion. Source: Thomson Reuters LPC 41
42 1Q04 3Q04 1Q05 3Q05 1Q06 3Q06 1Q07 3Q07 1Q08 3Q08 1Q09 3Q09 1Q10 3Q10 1Q11 3Q11 1Q12 Issuance ($ Bils.) Sponsored loan issuance Sponsored loan issuance LBO Non-LBO Sponsored lending activity is below last years levels. LBO activity remains subdued so far in Source: Thomson Reuters LPC 42
43 Jan Feb Mar Apr May Jun Jul Aug Sep Oct Dec Institutional loan pipeline Institutional Pipeline ($ in Bils.) Institutional loan pipeline is now at $14.6 billion, below the $25.6 billion seen at this time last year. Source: Thomson Reuters LPC 43
44 Jan-10 Feb-10 Mar-10 Apr-10 May-10 Jun-10 Jul-10 Aug-10 Sep-10 Oct-10 Nov-10 Dec-10 Jan-11 Feb-11 Mar-11 Apr-11 May-11 Jun-11 Jul-11 Aug-11 Sep-11 Oct-11 Nov-11 Dec-11 Jan-12 Feb-12 Mar-12 Apr-12 May-12 Jun-12 Average yield (%) Institutional loan primary market yields 10% Average primary market institutional loan yield 9% 8% 7% 6% 5% 4% * Assuming three year life Institutional loan yields in the primary market increased to 7.35% in June, up from 6.63% in May, 6.53% in April, and 6.13% in March Source: Thomson Reuters LPC 44
45 January '11 February '11 March '11 April '11 May '11 June '11 July '11 August '11 September '11 October '11 November '11 December '11 January '12 February '12 March '12 April '12 May '12 June '12 Flexed Facility Volume ($ Bils.) Price flex Institutional loan price flex Up Down Upward flexes dominated in 2Q12, totaling $17.2 billion versus reverse flexes of $4.2 billion Source: Thomson Reuters LPC 45
46 03-Jan Feb Mar May Jun Aug Sep Nov Dec Feb Mar Apr Jun-2012 Avg. Bid (% of par) Secondary market bid levels Secondary market average bid SMi100 Multi-quote inst. loans Eurozone crisis and worries about the U.S. economy pushed flow loan bids 72 bps lower in 2Q12, but still finished 1H12 up 133 bps, while the broader market increased 277 bps. Source: LSTA/LPC MTM Pricing, Thomson Reuters LPC 48
47 3-Jan Mar-11 6/10/ Aug Nov Feb- 26-Apr-12 Average Bid (% of par) Secondary market bid levels: covenant-lite & second-liens 105 Cov-lites and second lien loan bids Cov-lite 2nd Lien TL SMi Covenant-lite loans are currently bid at Second-liens are at an average of Source: LSTA/Thomson Reuters LPC MTM Pricing 47
48 Jul-11 Aug-11 Oct-11 Nov-11 Dec-11 Feb-12 Mar-12 May-12 Jun-12 Average yield (%) Secondary market yields 7 SMi100 secondary market yields Flow names are now yielding an average of 5.23%. * Assuming three year life Source: Thomson Reuters LPC 48
49 31-Dec Feb Apr May Jun Aug Sep Nov Dec Feb Mar May Jun Jul Sep Oct Dec Jan Mar Apr May-2012 Share of loan bids >=100 Par-plus market share Par-plus share: SMi100 & multi-quote institutional term loans 40% 30% SMi 100 Multi-quote inst loans 20% 10% 0% 15% of multi-quote institutional loans are bid above par, while the corresponding number for flow name is 13%. While this is an increase from the early June levels, they still are still significantly below the levels seen in early May. Source: LSTA/Thomson Reuters LPC MTM Pricing 49
50 <70 70 to <80 80 to <85 85 to <90 90 to <95 95 to <98 98 to <100 >=100 Share of loan bids >=100 Institutional Loan Bid Distribution Bid distribution: Multi-quote institutional loans 60% 50% 40% 30-Dec Jul-12 30% 20% 10% 0% 71% of institutional loans are bid above 98, up from 43% at the start of the year Source: LSTA/Thomson Reuters LPC MTM Pricing 50
51 Default Probability Analysis
52 Starmine default probability comparison for select names - implied ratings are above credit agency ratings Company Name S&P Corporate Credit Rating StarMine Structural DP Model 1year default probability Structural Model Implied Rating StarMine SmartRatios DP Model 1year default probability SmartRatios Model Implied Rating Source: Thomson Reuters Starmine TLB Avg. Bid Lender Processing Services BB % BB 2.288% B Constellation Brands Inc BB % BB 1.455% B DigitalGlobe Inc BB 0.598% B % BB Colfax Corporation BB 0.316% BB % B Terex Corporation BB % B 1.907% B Goodyear Tire & Rubber Co BB % B 2.304% B Georgia Gulf Corporation BB % B % B Sinclair Broadcast Group Inc BB % B % CCC 99.5 Ducommun Inc B % B 2.377% B 99 Kindred Healthcare Inc B % B 2.650% B Manitowoc Company Inc B % B % B SuperValu Inc B % CC 5.230% CCC Vanguard Health Systems Inc B 1.611% B % B Gray Television Inc B 1.743% B % CCC Gentiva Health Services Inc B % CCC % CCC
53 Starmine default probability comparison for select names - implied ratings are below credit agency ratings Company Name StarMine Structural DP Model StarMine SmartRatios DP Model 1year Structural 1year SmartRatios S&P Corporate default Model Implied default Model Implied Credit Rating probability Rating probability Rating TLB Avg. Bid Flextronics International Ltd BB % BBB % BBB- 99 Great Canadian Gaming Corp. BB % BBB % BBB Acxiom Corporation BB 0.080% BBB % BBB- 99 PolyOne Corporation BB % BB 0.984% BB 100 Armstrong World Industries BB % BBB % BB Nuance Communications BB % BBB % BBB Helix Energy Solutions Group B % BB 0.909% BB CNO Financial Group Inc B % BB 0.821% BB 99.5 Metropolitan Health Networks B % BB % BB- 96 Iconix Brand Group Inc B % BB % BB Smart Balance Inc B % BB % BB Verint Systems Inc B % BBB % BB- 99 NCI Building Systems Inc B 0.206% BB 1.137% BB- 99 High Liner Foods Inc B 0.043% BBB % BB 100 Ocwen Financial Corporation B 0.039% BBB % BB US Airways Group Inc B % B % B Rite Aid Corporation B % B % B Source: Thomson Reuters Starmine 53
54 CDS Market Snapshot
55 3/25/08 6/25/08 9/25/08 12/25/08 3/25/09 6/25/09 9/25/09 12/25/09 3/25/10 6/25/10 9/25/10 12/25/10 3/25/11 6/25/11 9/25/11 12/25/11 3/25/12 6/25/12 12/4/09 3/4/10 6/4/10 9/4/10 12/4/10 3/4/11 6/4/11 9/4/11 12/4/11 3/4/12 6/4/12 Spread (bps) Price (% of par) Spread (bps) CDS index spreads CDX.NA.IG spread CDX.NA.HY price / spread Price Spread CDS spreads have tightened in recent weeks after widening noticeably in May amidst growing fears around the Eurozone crisis and weaker growth in the U.S Source: Thomson Reuters CreditViews 55
56 12/14/07 2/12/08 4/12/08 6/11/08 8/10/08 10/9/08 12/8/08 2/6/09 4/7/09 6/6/09 8/5/09 10/4/09 12/3/09 2/1/10 4/2/10 6/1/10 7/31/10 9/29/10 11/28/10 1/27/11 3/28/11 5/27/11 7/26/11 9/24/11 11/23/11 1/22/12 3/22/12 5/21/12 Spread (bps) Thomson Reuters Counterparty Default Index Counterparty Default Index Bank CDS have widened significantly since earlier in the year. The CDI index now stands at 237 bps, up from 178 bps in March. The index tracks counterparty risk as reflected by average spreads of 5 year CDS for the top CDS dealers that operate in the CDS market. Source: Thomson Reuters CreditViews 56
LEVERAGED LOAN MONTHLY
 LEVERAGED LOAN MONTHLY THOMSON REUTERS LPC AUGUST 2013 Colm Doherty Director of Analytics colm.doherty@thomsonreuters.com 646-223-6821 Hugo Pereira Senior Market Analyst hugo.pereira@thomsonreuters.com
LOAN MARKET DATA AND ANALYTICS BY THOMSON REUTERS LPC
 LOAN MARKET DATA AND ANALYTICS BY THOMSON REUTERS LPC GLOBAL LOAN MARKET DATA AND ANALYTICS BY THOMSON REUTERS LPC Secondary Market Bid Levels: Europe Slide 2 European CLO New Issue Volume Monthly Slide
U.S. OIL & GAS SNAPSHOT
 U.S. THOMSON REUTERS LPC FEBRUARY 2016 Colm (C.J.) Doherty Director of Analysis colm.doherty@thomsonreuters.com 646-223-6821 U.S. Key Points Slides 3-4 Oil & Gas Institutional Loan Defaults Slide 5 Oil
Morgan Stanley Credit Partners L.P. Weekly Market Update August 13, 2012
 L.P. Weekly Market Update August 13, 2012 High Yield: YTD Issuance: $213Bn Fund Flows: +$809MM Index Yield: 6.75% Leveraged Loans: YTD Issuance (1) :$245Bn Fund Flows: +$159MM Index Yield: 6.60% Leveraged
STATE OF THE MARKET TODAY AND WHAT TO EXPECT TOMORROW
 STATE OF THE MARKET TODAY AND WHAT TO EXPECT TOMORROW Thomson Reuters LPC s Second Annual Middle Market Loan Conference Ioana Barza Director of Analysis ioana.barza@thomsonreuters.com OVERVIEW From 40,000
The U.S. Secondary Loan Market Ted Basta, LSTA Americo Cascella, Ares Andrew Gordon, Octagon Chris Remington, Eaton Vance Gunther Stein, Symphony
 The U.S. Secondary Loan Market Ted Basta, LSTA Americo Cascella, Ares Andrew Gordon, Octagon Chris Remington, Eaton Vance Gunther Stein, Symphony Hong Kong June 8, 2017 A Historical Overview In 1997, S&P
CLOs Today and Tomorrow
 CLOs Today and Tomorrow Moderator: Meredith Coffey, LSTA Speakers: Wynne Comer, Bank of America Merrill Lynch Loris Nazarian, Morgan Stanley Kei Okuyama, MUFG Clayton Perry, KKR Adnan Zuberi, BNP Paribas
The Corporate Loan Market in a Global Context
 The Corporate Loan Market in a Global Context Moderator: Panelists: Bram Smith, LSTA Fred Haddad GoldenTree Paul Hatfield, Alcentra David Lerner, Shenkman Dan McMullen, GSO Hong Kong June 8, 2017 Agenda
Breaking Down the Wall of Debt: The Leveraged Loan Market
 7/14/21 Breaking Down the Wall of Debt: The Leveraged Loan Market Meredith Coffey, EVP LSTA mcoffey@lsta.org www.lsta.org 1 Panel topics Brief review of where we have been Behind the rally (and retrenchment):
CDO Market Overview & Outlook. CDOs in the Heartland. Lang Gibson Director of Structured Credit Research March 25, 2004
 CDO Market Overview & Outlook CDOs in the Heartland Lang Gibson Director of Structured Credit Research March 25, 24 23 featured record volumes despite diminishing arbitrage Global CDO Growth: 1995-23 $
CLOs Today. Moderator: Meredith Coffey, LSTA
 CLOs Today Moderator: Meredith Coffey, LSTA Panelists: Wynne Comer, Bank of America Merrill Lynch Mary Katherine DuBose, Wells Fargo Tricia Hazelwood, Mitsubishi UFJ Jane Lee, Blackstone GSO Josh Terry,
Oklahoma Independent Petroleum Association 2007 Capital and Technology Conference. October 30, 2005
 Oklahoma Independent Petroleum Association 2007 Capital and Technology Conference October 30, 2005 Market Backdrop Bulge bracket investment banks have been poor performers in 2007 STOCK PRICE PERFORMANCE
Seeking Alpha: Opportunities vs. Risk in the US Loan Market Today
 Seeking Alpha: Opportunities vs. Risk in the US Loan Market Today Moderator: Bram Smith. LSTA Speakers: Americo Cascella, Ares Stephen Casey, Neuberger Kevin Petrovcik, Invesco Mark Senkpiel, Babson THE
DEBT CAPITAL MARKETS EXECUTIVE SUMMARY MIDDLE MARKET LOANS
 MARKET INSIGHTS 1Q 2019 DEBT CAPITAL MARKETS EXECUTIVE SUMMARY Last year was a strong year for the corporate loan markets, including middle market and ABL, leveraged loans, and investment grade. Strong
Financing ESOP Transactions- Lenders Perspective
 Financing ESOP Transactions- Lenders Perspective 2015 California/Western States Chapter Conference Denver, Colorado September 24, 2015 Kurt Mair SVP and Western Regional ESOP Director Wells Fargo & Co.
The Leveraged Loan Market 2017 Review and 2018 Preview. Meredith Coffey, LSTA
 The Leveraged Loan Market 217 Review and 218 Preview Meredith Coffey, LSTA 1 On Deck for Today The 217 technical picture What it meant for T&Cs Where 218 may go Public sector plans, private sector impacts?
Morgan Stanley Credit Partners L.P. Weekly Market Update November 5, 2012
 L.P. Weekly Market Update November 5, 2012 High Yield: YTD Issuance: $308.8Bn, 26% above YTD 2011 Index Yield: 6.35% Leveraged Loans: YTD Issuance (1) :$392.5Bn, 18% above YTD 2011 Leveraged Finance Market
Current State of the Leveraged Loan Market
 Current State of the Leveraged Loan Market Ted Basta, LSTA William Lemberg, Alcentra Michael Schechter, CITI Gil Tollinchi, Crescent Capital Brian Yorke, Halcyon May 3, 2016 Presentation Overview 1. Macro
DEBT CAPITAL MARKETS EXECUTIVE SUMMARY MIDDLE MARKET
 MARKET INSIGHTS 4Q 2017 DEBT CAPITAL MARKETS EXECUTIVE SUMMARY In the middle market, bank loan capital is available at attractive levels. For leveraged middle market companies, non-bank lenders are driving
Morgan Stanley Credit Partners L.P. Weekly Market Update September 10, 2012
 L.P. Weekly Market Update September 10, 2012 High Yield: YTD Issuance: $234Bn, 3% above YTD 2011 Fund Flows: +$201MM Index Yield: 5.50% Leveraged Loans: YTD Issuance (1) :$257Bn, 12% below YTD 2011 Fund
American College of Investment Counsel New York, NY. Michael J. Reilly Bingham McCutchen LLP (Moderator) Dewey Imhoff FTI Consulting, Inc.
 Dewey Imhoff FTI Consulting, Inc.") 211 ANNUAL MEETING AND EDUCATION CONFERENCE American College of Investment Counsel New York, NY Weeping Woman - Pablo Picasso 1937 Restructuring Trends in a Recessionary Environment: Lessons Learned and
211 ANNUAL MEETING AND EDUCATION CONFERENCE American College of Investment Counsel New York, NY Weeping Woman - Pablo Picasso 1937 Restructuring Trends in a Recessionary Environment: Lessons Learned and
State of the Middle Market M&A Private Equity Financing
 State of the Middle Market M&A Private Equity Financing January 2012 DEBT ADVISORY GROUP The Capital Markets Desk for the Middle Market Results From Lincoln s 2012 Financing Market Survey Do you believe
CLO PORTFOLIO TRADING SNAPSHOT
 CLO PORTFOLIO TRADING SNAPSHOT THOMSON REUTERS LPC MAY 2017 Colm (C.J.) Doherty Director of Analysis colm.doherty@tr.com 646-223-6821 CLO PORTFOLIO TRADING SNAPSHOT Key Points Slides 3-5 U.S. CLO Trading
TRADING THROUGH THE VOLATILITY
 Connect to WiFi WiFi: Hilton Meeting Room Password: LSTAOPS19 Open Your Web Browser TRADING THROUGH THE VOLATILITY # LSTAOPS19 Go to slido.com Ted Basta, Executive Vice President Market Analytics & Investor
Angel Oak Capital Advisors, LLC
 Angel Oak Capital Advisors, LLC Angel Oak Flexible Income Fund Quarterly Review March 31, 2018 Quarter in Review Risk assets were weaker in the first quarter driven primarily by rising rates, expectations
THOMSON REUTERS LPC S FIFTH ANNUAL MIDDLE MARKET LOANS CONFERENCE
 REUTERS / Jean-Paul Pelissier REUTERS / Firstname Lastname THOMSON REUTERS LPC S FIFTH ANNUAL MIDDLE MARKET LOANS CONFERENCE Ioana Barza Director of Analysis 646-223-6822 ioana.barza@tr.com REUTERS / Samrang
COLLATERALIZED LOAN OBLIGATIONS (CLO) Dr. Janne Gustafsson
 Dr. Janne Gustafsson") COLLATERALIZED LOAN OBLIGATIONS (CLO) 4.12.2017 Dr. Janne Gustafsson OUTLINE 1. Structured Credit 2. Collateralized Loan Obligations (CLOs) 3. Pricing of CLO tranches 2 3 Structured Credit WHAT IS STRUCTURED
COLLATERALIZED LOAN OBLIGATIONS (CLO) 4.12.2017 Dr. Janne Gustafsson OUTLINE 1. Structured Credit 2. Collateralized Loan Obligations (CLOs) 3. Pricing of CLO tranches 2 3 Structured Credit WHAT IS STRUCTURED
Raising Capital in the Bond Markets
 Raising Capital in the Bond Markets John Ong, Head of Capital Markets Sunrise Securities Corp. Capital Link Greek Shipping Forum February 23, 2010 1 Market has enjoyed low rates High Yield Index Yield
Angel Oak Capital Advisors, LLC
 Angel Oak Capital Advisors, LLC Angel Oak Multi-Strategy Income Fund Quarterly Review March 31, 2018 Quarter in Review Risk assets were weaker in the first quarter driven primarily by rising rates, expectations
DEBT CAPITAL MARKETS EXECUTIVE SUMMARY MIDDLE MARKET LOANS
 MARKET INSIGHTS 3Q 2018 DEBT CAPITAL MARKETS EXECUTIVE SUMMARY Middle market investors continue to compete on price and less restrictive documentation, prompted by a sentiment change in leveraged lending
Strategic Mortgage Income Fund 3Q 2015 Presentation
 Strategic Mortgage Income Fund 3Q 2015 Presentation October 22 nd, 2015 Nothing presented herein is intended to constitute investment advice and no investment decision should be made based on any information
PIPER JAFFRAY DEBT CAPITAL MARKETS UPDATE Page 1. New Leveraged Loans In the Market
 Issue Issue No. No. 276: 276: September September 16, 16, PIPER JAFFRAY DEBT CAPITAL MARKETS UPDATE Page 1 The Piper Jaffray Debt Capital Markets Update is published weekly and provides a summary and analysis
Bentham Wholesale Syndicated Loan Fund
 Bentham Wholesale Syndicated Loan Fund Quarterly Commentary December 2010 Investment Manager Bentham Asset Management ABN 92 140 833 64 AFSL 356199 Responsible Entity Challenger Investment Services Limited
Private Equity Investing in the Current Credit Environment. The Blackstone Group. January Vik Sawhney
 Credit Environment January 2009 Vik Sawhney Introduction The unprecedented credit-related turmoil that began in the summer of 2007 continues: Collapse in residential mortgage market Unwinding of structured
Canadian and United States Syndicated Lending Bridget Marsh, EVP & Deputy General Counsel, LSTA Martin Racicot, Partner, Fasken Martineau
 Canadian and United States Syndicated Lending Bridget Marsh, EVP & Deputy General Counsel, LSTA Martin Racicot, Partner, Fasken Martineau Ontario Bar Association Institute Tuesday, February 7, 2017 Presentation
Capital Structure: Recent Evolutions and Trends. Milan, 30 th June 2016
 Capital Structure: Recent Evolutions and Trends Milan, 30 th June 016 Observations Overview of the Current Market 1 1 The stabilization of the Italian macro/political environment has translated into a
14:45 16:00 - STREAM 1- Marly. Are Euro Debt Capital Markets a Sustainable Option to Fulfill Funding Requirements in the Current Financial Crisis?
 14:45 16:00 - STREAM 1- Marly 1 Are Euro Debt Capital Markets a Sustainable Option to Fulfill Funding Requirements in the Current Financial Crisis? 2 Are Euro Debt Capital Markets a Sustainable Option
Understanding Investments in Collateralized Loan Obligations ( CLOs )
") Understanding Investments in Collateralized Loan Obligations ( CLOs ) Disclaimer This document contains the current, good faith opinions of Ares Management Corporation ( Ares ). The document is meant for
Understanding Investments in Collateralized Loan Obligations ( CLOs ) Disclaimer This document contains the current, good faith opinions of Ares Management Corporation ( Ares ). The document is meant for
2013 Leveraged Finance Outlook and 2012 Annual Review
 Fixed Income Research http://www.credit-suisse.com/researchandanalytics 2013 Leveraged Finance Outlook and 2012 Annual Review Research Analysts Jonathan Blau 212 538 3533 jonathan.blau@credit-suisse.com
Madison Capital Funding Market Overview
 Communicate. Commit. Deliver. Third Quarter 2014 Table of Contents Loan Volume 2 CLO Issuance, Investors 3 Madison Capital Funding Market Overview Yields, Debt and Equity Multiples 4 Madison Capital Overview
Third Quarter, European emerging market bonds were introduced as a separate category in this report in the second quarter of 2008.
 Third Quarter, 9 The AFME / EHYA, formerly the European High Yield Association (EHYA), is pleased to present the eleventh quarterly issue of the European High Yield and Leveraged Loan Report. The report
Please scroll to find the 2018 and 2019 global fund holiday calendars.
 Please scroll to find the 2018 and 2019 global fund holiday calendars. 2018 Exchange-Traded fund holiday Vanguard Ireland-domiciled ETFs Jan Feb Mar Apr May Jun 1 2 5 12 15 25 9 12 14 15 16 19 28 20 29
VXF Vanguard Extended Market ETF
 Vanguard Extended Market ETF ETF.com segment: Equity: U.S. - Extended Market Competing ETFs: PRFZ, SPMD, ISMD, SMMD, SDVY Related ETF Channels: North America, U.S., Extended Market, Broad-based, Vanilla,
The US Institutional Corporate Loan Market and an Overview of Ways to Invest
 The US Institutional Corporate Loan Market and an Overview of Ways to Invest Moderator: Elliot Ganz, LSTA Panelists: Gretchen Bergstresser, CVC David Mechlin, CSAM Dan Norman, Voya Tel Aviv, November 14,
Private Equity Overview
 Private Equity Overview June 10, 2010 State Universities Retirement System Rob Parkinson, Associate Agenda Asset Class Overview Market Update SURS Private Equity Portfolio Asset Class Overview Benefits
XHE SPDR S&P Health Care Equipment ETF
 SPDR S&P Health Care Equipment ETF ETF.com segment: Equity: U.S. Health Care Equipment & Supplies Competing ETFs: IHI Related ETF Channels: Sectors, U.S., Smart-Beta ETFs, Equity, Equal-Weighted, Healthcare,
EUROPEAN LEVERAGED LOAN MARKET IMPACT OF THE CREDIT CRISIS
 AVOCA CAPITAL LEVERAGED LOANS EUROPEAN LEVERAGED LOAN MARKET IMPACT OF THE CREDIT CRISIS OUTLOOK 1 AVOCA CAPITAL INTRODUCTION Avoca is a large and long established European leveraged loan manager Top 5
ENY Invesco Canadian Energy Income ETF
 ENY Invesco Canadian Energy Income ETF ETF.com segment: Equity: Canada Exploration & Production Competing ETFs: Related ETF Channels: North America, Smart-Beta ETFs, Canada, Energy, Dividend, Dividends,
Asset Liability Management Report 4 Q 2018
 Asset Liability Management Report 4 Q 2018 Performance Indicators and Key Measures Cash, Investment and Debt Balances Book Value ($M) Restricted Cash and Investments 529.8 Unrestricted Cash and Investments
Conseco, Inc. Second Quarter 2008 Financial and Operating Results Presentation
 Conseco, Inc. selected slides from our Second Quarter 2008 Financial and Operating Results Presentation (as filed in our Current Report on Form 8-K dated August 12, 2008) Key Debt Covenants CNO ($ millions)
Executive Summary. July 17, 2015
 Executive Summary July 17, 2015 The Revenue Estimating Conference adopted interest rates for use in the state budgeting process. The adopted interest rates take into consideration current benchmark rates
New Issue Market Developments. Jarrod Kaplan Director High Yield Capital Markets Credit Agricole CIB
 New Issue Market Deelopments Jarrod Kaplan Director High Yield Capital Markets Credit Agricole CIB Key Topics / Trends Lower high yield new issue olume Continued strength of leeraged loan market Return
FIN 684 Fixed-Income Analysis Corporate Debt Securities
 FIN 684 Fixed-Income Analysis Corporate Debt Securities Professor Robert B.H. Hauswald Kogod School of Business, AU Corporate Debt Securities Financial obligations of a corporation that have priority over
FAIR OAKS INCOME LIMITED. (formerly Fair Oaks Income Fund Limited) INTERIM REPORT AND UNAUDITED CONDENSED FINANCIAL STATEMENTS
 INTERIM REPORT AND UNAUDITED CONDENSED FINANCIAL STATEMENTS") FAIR OAKS INCOME LIMITED (formerly Fair Oaks Income Fund Limited) INTERIM REPORT AND UNAUDITED CONDENSED FINANCIAL STATEMENTS FOR THE SIX MONTH PERIOD ENDED 30 JUNE 2017 Contents Highlights Summary Information
FAIR OAKS INCOME LIMITED (formerly Fair Oaks Income Fund Limited) INTERIM REPORT AND UNAUDITED CONDENSED FINANCIAL STATEMENTS FOR THE SIX MONTH PERIOD ENDED 30 JUNE 2017 Contents Highlights Summary Information
Credit Markets Update
 KPMG CORPORATE FINANCE Credit Markets Update 4 th Quarter 2012 CAPITAL ADVISORY Credit Markets Summary Leveraged loan activity flourished in the fourth quarter amid a largely stable macro environment and
Allianz Group Fiscal Year 2012
 Allianz Group Fiscal Year 2012 Michael Diekmann CEO Allianz SE Financial press conference February 21, 2013 Based on preliminary figures Overview 2012 EUR 106.4bn Total revenues EUR 9.5bn Operating profit
Finding Opportunities in Restructuring in the Year Ahead
 Finding Opportunities in Restructuring in the Year Ahead Wednesday, April 28, 2010; 11:00 AM - 12:15 PM Moderator: Irwin Gold, Co-Chairman; Co-Head, Financial Restructuring Group, Houlihan Lokey Speakers:
Investment Banking and Capital Markets Update: Week Ended 11/28/2014
 Investment Banking and Capital Markets Update: Week Ended 11/28/2014 CRT Investment Banking Justin Vorwerk Head of Investment Banking 203.548.8001 jvorwerk@crtllc.com John Calcagnini Managing Director
MIDDLE MARKET PANEL DISCUSSION LSTA S 18 TH ANNUAL CONFERENCE. Ioana Barza Director of Analytics
 MIDDLE MARKET PANEL DISCUSSION LSTA S 18 TH ANNUAL CONFERENCE Ioana Barza Director of Analytics ioana.barza@thomsonreuters.com 1999 2000 2001 2002 2003 2004 2005 2006 2007 2008 2009 2010 2011 2012 2013
A Compelling Case for Leveraged Loans
 A Compelling Case for Leveraged Loans EXECUTIVE SUMMARY In the current market environment, there are a number of compelling reasons to invest in leveraged loans. In a situation where most assets are trading
Investor Presentation JUNE 2018
 Investor Presentation JUNE 2018 Forward Looking Statements & Other Disclosure Matters Forward-Looking Statements - This presentation contains forward-looking statements within the meaning of the federal
Common stock prices 1. New York Stock Exchange indexes (Dec. 31,1965=50)2. Transportation. Utility 3. Finance
2. Transportation. Utility 3. Finance") Digitized for FRASER http://fraser.stlouisfed.org/ Federal Reserve Bank of St. Louis 000 97 98 99 I90 9 9 9 9 9 9 97 98 99 970 97 97 ""..".'..'.."... 97 97 97 97 977 978 979 980 98 98 98 98 98 98 987 988
Digitized for FRASER http://fraser.stlouisfed.org/ Federal Reserve Bank of St. Louis 000 97 98 99 I90 9 9 9 9 9 9 97 98 99 970 97 97 ""..".'..'.."... 97 97 97 97 977 978 979 980 98 98 98 98 98 98 987 988
U.S. Corporate Issuers: Rising Corporate Funding Costs And Market Volatility Could Not Deter Upgrades In 1Q2018
 U.S. Corporate Issuers: Rising Corporate Funding Costs And Market Volatility Could Not Deter Upgrades In 1Q2018 S&P Global Fixed Income Research April 2018 U.S. Corporate Credit Market: Rating Actions
CreditMark. Corporate Loan Transparency: Transitioning From Accrual Accounting To Mark-To-Market Valuation
 CreditMark Corporate Loan Transparency: Transitioning From Accrual Accounting To Mark-To-Market Valuation February 2004 The Traditional Approach To Bank Lending Accrual accounting Loans valued at par until
T2 INCOME FUND LTD. Update September The Road to Recovery
 T2 INCOME FUND LTD Update September 2009 Important Information These presentation slides contain forward-looking statements and forecasts with respect to the financial condition and the results of T2 Income
OQAL Oppenheimer Russell 1000 Quality Factor ETF
 Oppenheimer Russell 1000 Quality Factor ETF ETF.com segment: Equity: U.S. - Large Cap Competing ETFs: PRF, FNDX, SPHQ, FTCS, RWL Related ETF Channels: North America, Smart-Beta ETFs, Large Cap, U.S., Broad-based,
Madison Capital Funding Market Overview
 Communicate. Commit. Deliver. Third Quarter 2013 Table of Contents Loan Volume 2 Yields and Debt and Equity Multiples 3 Madison Capital Funding Market Overview Investors, CLO Issuance and 4 Default Rate
MDY SPDR S&P Midcap 400 ETF Trust
 SPDR S&P Midcap 400 ETF Trust ETF.com segment: Equity: U.S. - Mid Cap Competing ETFs: IJH, IVOO, VO, IWR, SCHM Related ETF Channels: North America, U.S., Broad-based, Vanilla, S&P Mid Cap 400, Midcap,
URTH ishares MSCI World ETF
 ishares MSCI World ETF ETF.com segment: Equity: Developed Markets - Total Market Competing ETFs: BOTZ, SNSR, RFDI, FDRR, JPGE Related ETF Channels: Total Market, Broad-based, Vanilla, Equity, Size and
5-yr Investment Grade Corporate CDS Markit (bps) 500
 500") Treasury Yield Curve (percent) 2-yr/1-yr Treasury Spread (bps) % 7. 35 6. 3 25 5. 2 4. 15 3. 2. 1. Treasury Curve 'A' Composite 1 5-5. 1-yr 5-yr 1-yr 3-yr The Treasury yield curve is derived from available
Treasury Yield Curve (percent) 2-yr/1-yr Treasury Spread (bps) % 7. 35 6. 3 25 5. 2 4. 15 3. 2. 1. Treasury Curve 'A' Composite 1 5-5. 1-yr 5-yr 1-yr 3-yr The Treasury yield curve is derived from available
SPYV SPDR Portfolio S&P 500 Value ETF
 SPDR Portfolio S&P 500 Value ETF ETF.com segment: Equity: U.S. - Large Cap Value Competing ETFs: IVE, VOOV, RPV, DVP, FVAL Related ETF Channels: North America, Smart-Beta ETFs, Large Cap, U.S., S&P 500
WIP SPDR FTSE International Government Inflation- Protected Bond ETF
 WIP SPDR FTSE International Government Inflation- Protected Bond ETF ETF.com segment: Fixed Income: Global Ex-U.S. - Sovereign Inflation-Protected Competing ETFs: Related ETF Channels: Fixed Income, Sovereign,
U.S. Corporate Issuers: Lending Surges Amid A Decline In Credit Risk In 1Q17
 U.S. Corporate Issuers: Lending Surges Amid A Decline In Credit Risk In 1Q17 S&P Global Fixed Income Research Apr. 2017 Permission to reprint or distribute any content from this presentation requires the
Looking to the medium term
 Looking to the medium term Issued: 4 September 2013 Legal notice This presentation has been prepared to inform investors and prospective investors in the secondary markets about the Group and does not
Effective Investment Policy and Strategies
 Agenda for Today Effective Policy and Strategies For Today s Economic Environment Objectives and Goals Decisions Policy Permissible s Strategy Implementation Case Studies 2 Objectives & Goals Making Informed
EWC ishares MSCI Canada ETF
 ishares MSCI Canada ETF ETF.com segment: Equity: Canada - Total Market Competing ETFs: QCAN, H, FCAN, FLCA Related ETF Channels: North America, Canada, Single Country, Total Market, Vanilla, Equity, Size
EMQQ Emerging Markets Internet & Ecommerce ETF
 Emerging Markets Internet & Ecommerce ETF ETF.com segment: Equity: Emerging Markets Internet Competing ETFs: N/A Related ETF Channels: Technology, Internet, Vanilla, Emerging Markets, Equity, Sectors Find
IBUY Amplify Online Retail
 Amplify Online Retail ETF.com segment: Equity: Global Retail Competing ETFs: RTH Related ETF Channels: Equal-Weighted, Smart-Beta ETFs, Global, Equity, Sectors, Consumer Discretionary, Consumer Cyclicals,
General Electric Company Financial Services Funding Policy
 General Electric Company Financial Services Funding Policy How we minimize interest rate and currency risk "This document contains "forward-looking statements" within the meaning of the Private Securities
A Guide to Investing In Corporate Bonds
 A Guide to Investing In Corporate Bonds Access the corporate debt income portfolio TABLE OF CONTENTS What are Corporate Bonds?... 4 Corporate Bond Issuers... 4 Investment Benefits... 5 Credit Quality and
PSK SPDR Wells Fargo Preferred Stock ETF
 PSK SPDR Wells Fargo Preferred Stock ETF ETF.com segment: Fixed Income: U.S. - Corporate, Preferred Competing ETFs: PFF, PGX, PGF, PFXF, PFFD Related ETF Channels: North America, U.S., Fixed Income, Bond,
SDY SPDR S&P Dividend ETF
 SPDR S&P Dividend ETF ETF.com segment: Equity: U.S. - High Dividend Yield Competing ETFs: VYM, DVY, FVD, DHS, PEY Related ETF Channels: North America, Smart-Beta ETFs, Dividend, U.S., Broad-based, Dividends,
AND FINANCIAL MARKETS ASSOCIATION
 Third Quarter, 8 The European High Yield Association (EHYA), an affiliate of the Securities Industry and Financial Markets Association, is pleased to present the seventh quarterly issue of the European
XES SPDR S&P Oil & Gas Equipment & Services ETF
 SPDR S&P Oil & Gas Equipment & Services ETF ETF.com segment: Equity: U.S. Oil & Gas Equipment & Services Competing ETFs: IEZ, PXJ Related ETF Channels: U.S., Smart-Beta ETFs, Sectors, Energy, Equal-Weighted,
DIA SPDR Dow Jones Industrial Average ETF Trust
 SPDR Dow Jones Industrial Average ETF Trust ETF.com segment: Equity: U.S. - Large Cap Competing ETFs: SPY, IVV, VOO, IWB, SCHX Related ETF Channels: North America, Large Cap, U.S., Broad-based, DJ Industrial
Key Regulatory Issues Affecting Leveraged Loan Market. Meredith Coffey, LSTA
 Key Regulatory Issues Affecting Leveraged Loan Market Meredith Coffey, LSTA mcoffey@lsta.org 212-880-3019 1 On The Agenda Today. Key Leveraged Loan Market Segments and How They re Affected by Regulation
FTXR First Trust Nasdaq Transportation ETF
 First Trust Nasdaq Transportation ETF ETF.com segment: Equity: U.S. Transportation Competing ETFs: IYT, XTN, XKST Related ETF Channels: North America, Smart-Beta ETFs, Multi-factor, Transportation, U.S.,
KEMQ KraneShares Emerging Markets Consumer Technology Index ETF
 KEMQ KraneShares Emerging Markets Consumer Technology Index ETF ETF.com segment: Equity: Emerging Markets Technology Competing ETFs: Related ETF Channels: Technology, Equal-Weighted, Smart-Beta ETFs, Broad-based,
SCZ ishares MSCI EAFE Small-Cap ETF
 ishares MSCI EAFE Small-Cap ETF ETF.com segment: Equity: Developed Markets Ex-U.S. - Small Cap Competing ETFs: SCHC, GWX, H, FNDC, DLS Related ETF Channels: Developed Markets Ex-U.S., Broad-based, Vanilla,
DEBT CAPITAL MARKETS EXECUTIVE SUMMARY MIDDLE MARKET
 MARKET INSIGHTS 1Q 2018 DEBT CAPITAL MARKETS EXECUTIVE SUMMARY Borrowers are seeing increased liquidity and strong competition among lenders in the middle market and in asset-based lending, making it an
MAGA Point Bridge GOP Stock Tracker ETF
 Point Bridge GOP Stock Tracker ETF ETF.com segment: Equity: U.S. - Large Cap Competing ETFs: SHE, JUST, CATH, ACSI, BIBL Related ETF Channels: U.S., Smart-Beta ETFs, Large Cap, Socially Responsible, Equity,
IXG ishares Global Financials ETF
 ishares Global Financials ETF ETF.com segment: Equity: Global Financials Competing ETFs: DFNL Related ETF Channels: Broad-based, Vanilla, Global, Equity, Financials, Sectors Find more ETFs with our ETF
RFFC RiverFront Dynamic U.S. Flex-Cap ETF
 RiverFront Dynamic U.S. Flex-Cap ETF ETF.com segment: Equity: U.S. - Total Market Competing ETFs: AIEQ, RFDA, HUSE, TTFS, TTAC Related ETF Channels: North America, No Underlying Index, U.S., Broad-based,
Theta Capital Management. Distressed Investing - Deep value opportunities through the cycle
 Theta Capital Management Distressed Investing - Deep value opportunities through the cycle VBA Wouter ten Brinke 19 May 2010 2 Theta Capital Management Products Product Investment style Target return Target
LVL Invesco S&P Global Dividend Opportunities Index ETF
 Invesco S&P Global Dividend Opportunities Index ETF ETF.com segment: Equity: Global - High Dividend Yield Competing ETFs: FGD, SDIV, DEW, WDIV, FDVV Related ETF Channels: Smart-Beta ETFs, Broad-based,
2015 Leveraged Finance Outlook and 2014 Annual Review
 Fixed Income Research http://www.credit-suisse.com/researchandanalytics 2015 Leveraged Finance Outlook and 2014 Annual Review Research Analysts Jonathan Blau 212 538 3533 jonathan.blau@credit-suisse.com
UFS. Fixed Income. John Rosenthal Senior Managing Director MetLife
 UFS Fixed Income John Rosenthal Senior Managing Director MetLife Safe Harbor Statement These materials contain statements which constitute forward-looking statements within the meaning of the Private Securities
Financial Highlights
 November 3, 21 Financial Highlights Federal Reserve Balance Sheet 1 European Debt Bond Spreads 2 CDS Spreads 2 Securitization Markets CMBS Yields and Issuance 3 ABX and CMBX 4 Mortgage Rates 5 Broad Financial
PSET Principal Price Setters Index ETF
 Principal Price Setters Index ETF ETF.com segment: Equity: U.S. - Large Cap Competing ETFs: GSLC, SPHD, FEX, JKD, CFO Related ETF Channels: North America, Smart-Beta ETFs, Multi-factor, Large Cap, U.S.,
GS Global ECS Credit Strategy Research. March 31, Alberto Gallo, CFA Goldman, Sachs & Co
 The Goldman Sachs Group, Inc. Goldman Sachs Research The CLO market shows signs of life GS Global ECS Credit Strategy Research March 31, 11 Alberto Gallo, CFA Goldman, Sachs & Co. 1-917-33-31 alberto.gallo@gs.com