Frasers Commercial Trust Non-deal roadshow in Singapore. January 2018
|
|
|
- Oscar Banks
- 6 years ago
- Views:
Transcription


1 Frasers Commercial Trust Non-deal roadshow in Singapore January 2018
2 Important Notice 2 Certain statements in this Presentation constitute forward-looking statements. Such forward-looking statement involve known and unknown risks, uncertainties and other factors which may cause the actual results, performance or achievements of Frasers Commercial Trust ( FCOT ) or Frasers Centrepoint Asset Management (Commercial) Ltd., as manager of FCOT (the Manager ), or industry results, to be materially different from any future results, performance or achievements expressed or implied by such forward looking statements. Such forward-looking statements are based on numerous assumptions regarding the Manager s present and future business strategies and the environment in which FCOT or the Manager will operate in the future. Because these statements reflect the Manager s current views concerning future events, these statements necessarily involve risks, uncertainties and assumptions and you are cautioned not to place undue reliance on these forward-looking statements. Actual future performance could differ materially from these forward-looking statements. The Manager expressly disclaims any obligation or undertaking to release publicly any updates or revisions to any forward-looking statement contained in this Presentation to reflect any change in the Manager s expectations with regard thereto or any change in events, conditions or circumstances on which any such statement or information is based, subject to compliance with all applicable laws and regulations and/or the rules of Singapore Exchange Securities Trading Limited (the SGX-ST ) and/or any other regulatory or supervisory body or agency. The value of FCOT units ( Units ) and the income derived from them, if any, may fall or rise. Units are not obligations of, deposits in, or guaranteed by, the Manager or any of its affiliates. An investment in Units is subject to investment risks, including the possible loss of the principal amount invested. Investors should note that they have no right to request the Manager to redeem their Units while the Units are listed. It is intended that Unitholders may only deal in their Units through trading on the SGX-ST. Listing of the Units on the SGX-ST does not guarantee a liquid market for the Units. This Presentation is for information only and does not constitute an invitation or offer to acquire, purchase or subscribe for the Units. The past performance of FCOT and the Manager is not necessarily indicative of the future performance of FCOT and the Manager. This Presentation contains certain information with respect to the trade sectors of the tenants. The Manager has determined the trade sectors in which the tenants are primarily involved based on the Manager s general understanding of the business activities conducted by such tenants. The Manager s knowledge of the business activities of the tenants is necessarily limited and such tenants may conduct business activities that are in addition to, or different from, those shown herein. This Presentation includes market and industry data and forecast that have been obtained from internal survey, reports and studies, where appropriate, as well as market research, publicly available information and industry publications. Industry publications, surveys and forecasts generally state that the information they contain has been obtained from sources believed to be reliable, but there can be no assurance as to the accuracy or completeness of such included information. While the Manager has taken reasonable steps to ensure that the information is extracted accurately and in its proper context, the Manager has not independently verified any of the data from third party sources or ascertained the underlying economic assumptions relied upon therein. No representation or warranty expressed or implied is made as to, and no reliance should be placed on, the fairness, accuracy, completeness or correctness of the information or opinions contained in this Presentation.
3 Contents 3 FCOT Overview 4 Farnborough Business Park 14 Appendix 35

4 FCOT Overview

5 Frasers Commercial Trust ( FCOT ) Overview 5 FCOT is a REIT sponsored by Frasers Centrepoint Limited ( FCL ) Focuses on office and business space properties in Singapore and Australia which are key markets for FCL Sponsor of 4 S-REITs 1 Market capitalisation: S$6.1 billion (listed on SGX-ST) Total assets: S$27 billion Presence: 26 countries, 82 cities FY17 PBIT by geographical segment Listed on SGX- ST: Market capitalisation: Total assets: Free float: Presence: March 2006 (Stock code: Frasers Com Tr)^ S$1.2 billion S$2.2 billion 73% (27% held by FCL and its subsidiaries) Currently 6 office and business space properties (total 2.6 mil sf) in Singapore and Australia # (retail properties) As at 29 Dec Sources: Bloomberg, FCL 2017 Results Presentation. * Includes Indonesia, Japan, Malaysia, New Zealand, the Philippines, Thailand and Vietnam. ^ Formerly known as Allco REIT, the Trust was renamed to Frasers Commercial Trust after FCL acquired a stake in the Trust in August # Announced the joint venture with FCL to acquire 175 million Farnborough Business Park in the UK on 14 December 2017.

6 FCOT Overview Asset values 6 Diversified portfolio with no single property accounting for more than 27% of portfolio value Singapore Perth Canberra Melbourne Asset values as at 30 September 2017 Singapore $ 1,212.0 mil 59% Australia $ mil 41% Total $ 2,070.9 mil 100% *Reflects FCOT s 50.0% interest in Central Park


 1 There was no such category for REITs and")
7 FCOT Overview - Accolades 7 FCOT has won various awards for good corporate governance, investor relations practices and sustainability reporting Runner-up 2013, 2014 and 2015 in the Singapore Corporate Governance Award (REITs and Business Trusts Category) at the SIAS Investors Choice Award 1 Inaugural Sustainability Report in 2015 was a finalist for Asia s Best First Time Sustainability Report at the Asia Sustainability Reporting Awards 2016 Gold, Best Governed and Most Transparent Company Gold, Best Corporate Communications and Investor Relations Gold, Best Annual Report 2017 in the Singapore Corporate Awards (REITS and Business Trusts Category) 1 There was no such category for REITs and Business Trust in 2016.


8 Record Annual Distribution Income in FY marked the 11 th anniversary since FCOT was listed on 30 March 2006 FCOT (formerly Allco Reit) became part of FCL Group in Aug 2008 FY17 distribution income was the highest since listing FCOT s 5-year total return of 49.0% exceeded the FTSE Straits Times Index s total return of 28.4% 1 Distribution income to Unitholders (S$m) 2 Highest for the decade 2 30 March 2006 No. of properties: 2 Portfolio value: S$0.7 billion 4 DPU (Cents) 2 Stable DPU 30 September 2017 No. of properties: 6 Portfolio value: S$2.1 billion 3 2,3 3 1 Assumes dividends are reinvested. Source: Bloomberg. 2 On 26 August 2009, Frasers Commercial Trust changed its financial year end from 31 December to 30 September. As a result, FY09 comprised a 9-month period from 1 January to 30 September Adjusted for Unit consolidation. 4 As set out in the prospectus dated 23 March 2006.

9 Stable and Sustainable DPU 9 DPU for FY17 in-line with FY16 and held steady QoQ, with 7.5% management fee taken in Units 1 DPU (Cents) 9.82 cents 9.82 cents Management fee in Units 23% 40% 10% Nil Nil Nil 12.0% 18.0% 1 In FY16, 18.2% of the Manager s management fees were taken in Units.
 Foreign unitholders (non-individual) Taxable dividends received** Gross Gross, but income tax payable at own")
10 Attractive Yield 10 FCOT offers an attractive yield and currently trades around 460 basis points above the 10-year Singapore government bond Yield (%) # Preferential tax rates for investors Individuals Qualifying unitholders (Singapore incorporated and tax-resident companies) Foreign unitholders (non-individual) Taxable dividends received** Gross Gross, but income tax payable at own applicable tax rates Net of 10.0% withholding tax * Based on FCOT s closing price of $1.490 per Unit as at 29 Dec 2017 and FY17 DPU of 9.82 cents. ^ Based on the respective closing prices as at 29 Dec 2017 and the dividends in Source: Bloomberg. ^^ Based on closing prices as at 29 Dec 2017 and annualised DPU. Source: Bloomberg. Weighted average (based on market capitalisation) and comprised Frasers Commercial Trust, Keppel REIT, CapitaLand Commercial Trust and Suntec REIT. # Based on the interest rate paid on the Central Provident Fund (CPF) Ordinary Account from Oct 2017 to Dec Source: ~ As at Dec Source: ** Subject to declaration of tax status, and advice by investors own tax advisors.

11 Discount to NAV 11 Trading premium/discount to NAV per Unit (%) Office SREITs^ Overall SREITs^ Office SREITS^ Overall SREITS^^ FCOT* Trading discount from NAV per Unit Trading premium from NAV per Unit *Based on FCOT s closing price of $1.490 per Unit as at 29 Dec 2017 ^Based on closing prices as at 29 Dec Source: Bloomberg. Weighted average (based on market capitalisation) and comprised Frasers Commercial Trust, Keppel REIT, CapitaLand Commercial Trust and Suntec REIT. ^^Based on closing prices as at 29 Dec Source: Bloomberg. Weighted average figures (based on market capitalisation) for all Singapore REITs and real estate trusts.
 2,158,942 Gross Borrowings (S$ 000)")
12 S$ million 12 Capital Management Debt statistics 12 Healthy gearing of 34.7% Healthy interest coverage ratio of 4.1 times Borrowings in AUD provide natural hedge for the Australian properties Statistics Borrowings and assets by currency As at 30 Sept 2017 Total Assets (S$ 000) 2,158,942 Gross Borrowings (S$ 000) 749,956 Units on Issue and Issuable 805,815,367 NAV per Unit (ex-dpu) (S$) Gearing % Interest coverage ratio (times) Average borrowing rate % - Weighted average SGD debt rate 2.71% - Weighted average AUD debt rate 3.87% FCOT Issuer rating by Moody s 5 Baa2 1 Based on issued Units for the financial quarter ended 30 September Gross borrowing asa percentage of total assets. 3 Net income before changes in fair values of investment properties, interest, other investments and derivative instruments, income tax and distribution, and adding back certain non-recurring items/cash finance costs for the quarter ended 30 September See accompanying 4QFY17 Financial Statements announcement for details. 4 For quarter ended 30 September Moody s affirmed FCOT s Baa2 ratings and changed outlook from stable to negative on 29 September 2017 (refer to the announcement dated 29 September 2017).


13 13 Well-Spread Debt Expiry Profile 13 Well-spread debt maturity profile, with not more than S$183 million due in any financial year No debt maturing until August % of gross borrowings on fixed rate All assets are unencumbered Debt maturity Debt composition floating vs. fixed interest rates Total facilities: S$750 million Weighted average term to maturity: 2.5 years 1 Data as at 30 September 2017.

14 Joint Venture with FCL to Acquire 175 million Farnborough Business Park, UK
15 Summary of Proposed Joint Acquisition 15 FCOT to expand investment mandate to Europe, with initial focus on the United Kingdom ( UK ) 50:50 joint venture between FCOT and Frasers Centrepoint Limited ( FCL ) to acquire Farnborough Business Park for million (1) Description Farnborough Business Park: High quality business park of 14 commercial buildings located in the UK (2) Purchase consideration Property Valuation (1) million (S$314.8 million) based on adjusted NAV of target company, on a debt-free basis million (3) FCOT s funding Funding structure will be optimised to comprise a combination of debt and equity For purpose of completion, bridging loan facility will be arranged to fund FCOT s share of purchase consideration of 87.3 million (S$157.4 million), to be drawn down if required FCOT s share FCL s share Completion date Expected end-january 2018 Investment mandate expansion Expansion of investment mandate to include commercial real estate assets (primarily office, business space and/or business parks) in Europe including the UK FCOT intends to focus initially on the UK Exchange rate applied of 1 : S$ where applicable as at 11 December (1) Estimated net asset value of HEREF Farnborough Limited, which holds Farnborough Business Park, based on an agreed property value of million and working capital in the company. The estimated net asset value is subject to post-completion adjustment and the actual amount of purchase consideration would only be determined after the completion date. (2) Includes a car showroom to be built, which is pre-let and expected to be completed by January Farnborough Business Park also includes five freehold reversions subject to long leaseholds and four listed buildings relating to British aviation history. (3) Based on the valuation report by BNP Paribas Real Estate Advisory & Property Management UK Limited dated 11 December 2017.


 tenant retention (3)")


 (1) By gross rental")


 is")


 As at 30 September 2017 and")
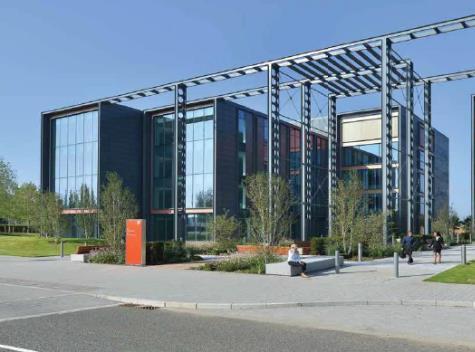
16 Overview of Farnborough Business Park hectares freehold land ~555k sq ft NLA 8.3 years 98.1% 89% 36 long WALE (1) occupancy rate (2) tenant retention (3) quality tenants (4) Thames Valley London Award-winning and well-located business park with 14 high quality buildings that offer an integrated live-work-play proposition (5) (1) By gross rental income as at 30 September 2017 after taking into account certain rent guarantees and reimbursement of rent free incentives from the vendor for existing leases and potential lease breaks/lease expirations in The weighted average lease to termination ( WALT ) (after accounting for rights to break) is 5.9 years. Please refer to FCOT s announcement dated 14 December 2017 for further details. (2) As at 30 September 2017 and after adjusting for leases for which the tenants have exercised their rights to break. (3) Since (4) As at 30 September 2017 and after taking into account committed pre-leases to two new tenants. (5) Farnborough Business Park also includes five freehold reversions subject to long leaseholds and four listed buildings relating to British aviation history.


17 Overview of Farnborough Business Park (cont d) 17 Single-ownership business park with a site area of 46.5 hectares 34 min train ride to Waterloo Station Connected to key motorway junctions 4 and 4a of M3 40 km to Heathrow Airport 1.6 km to Farnborough Town Centre Adjacent to TAG Farnborough Airport and Farnborough International Exhibition & Conference Centre Farnborough Business Park site area Note: Boundary shown is illustrative only and includes certain lots sold on long leaseholds


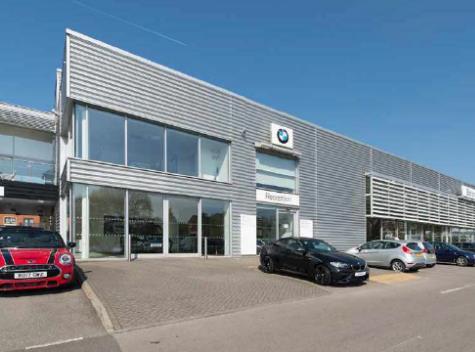


18 Overview of Farnborough Business Park (cont d) Selected developments within and adjacent to the property (1) TAG Farnborough Airport (2) (1) Includes certain lots sold as long leaseholds. (2) Adjacent to, and is not part of, Farnborough Business Park
19 Expansion of FCOT s investment mandate synergistic alignment to Sponsor Synergistic alignment to Sponsor s top 3 geographical markets Enhanced diversification from broadened mandate Alignment with Sponsor s top 3 geographical markets New FCOT market FCL s asset by geography UK (1 asset) New FCOT market Singapore (3 assets) Existing FCOT markets Australia (3 assets) Existing FCOT markets Data as at 30 September 2017.
20 Joint venture structure synergistic approach 20 Synergistic joint venture structure to leverage on FCL s network and platform strengths in the UK 3 ROFR FCOT FCL (a) 1 50:50 joint acquisition with Sponsor 50% 1 50% Singapore Jersey and UK 100% 2 HEREF Farnborough Limited Network effect with FCL s platform Farnborough Business Park 100% 100% 2 FCL s existing business parks 3 ROFR for future growth (a) Through Frasers Property International Pte. Ltd.
21 Key transaction rationale 21 1 High-quality and strategically located business park 2 Strategic diversification into the UK business park market 3 DPU-accretive acquisition and strengthens FCOT s portfolio 4 Consistent with the Manager s strategy to achieve long-term growth for FCOT

22 1 High-quality and strategically located business park Excellent connectivity and strategic network effect from FCL Group s cluster of business parks FCL Group s Thames Valley network Excellent transport connectivity Network Unique effect: Synergistic network effect between FCL s existing business parks and Farnborough Business Park positioning: premium business park located adjacent to TAG Farnborough Airport and Farnborough International Exhibition & Conference Centre Bristol Oxford Direct train connection to London Cambridge 1 Farnborough Business Park 2 Winnersh Triangle 3 Chineham Park 5 km to M3 29 km to M km to M4 J10 26 km to M25 J48 5 km to M3 J6 45 km to M25 J2 34 min to London Waterloo Stn 8 min to Reading Stn 30 min to Paddington Stn 16 min to Reading Stn 40 km to Heathrow 1.6 km to TAG Farnborough Airport 37 km to Heathrow 64 km to Heathrow Southampton 4 Watchmoor Park 1 km to M3 J4 8 km to M25 J2 34 min to London Waterloo Stn 29 km to Heathrow Thames Valley Blackwater Valley 5 Maxis (1) 8 km to M4 J10 63 km to Central London 54 min (2) to Paddington Stn 62 min to London Waterloo Stn 32 km to Heathrow FCOT / FCL FCL (1) Acquisition of Maxis by FCL is subject to certain conditions precedent. (2) Via Reading.


23 1 High-quality and strategically located business park (cont d) 23 Differentiated business park integrating lifestyle and community with a live-work-play focus Integrated communities with high quality amenities Gym Green spaces Retail Nursery F&B Communities Hotel Air show Integrated business community with high quality amenities focused on delivering a stimulating and enriching business campus environment Attractive Cluster Modern Healthy business campus: Mixeduse business environment in Thames Valley that has attracted blue-chip companies to relocate their corporate headquarters, such as Fluor Limited effect: Concentration of skilled talent pool from key business clusters including manufacturing, financial & business services and hi-tech sectors amenities: Provision of on-site amenities with >300,000 sq ft of modern retail and other facilities tenant retention: Has proven appeal to occupiers with healthy tenant retention ratio of 89% since 2012 Award-winning business park: Won BCO award for excellent office space, Green Flag award for well-managed green space and BALI landscape award Note: Data as at 30 September 2017.
 High occupancy rate of 98.1% (3) Healthy tenant retention rate of 89% (4) Data as at 30 September 2017.")
24 1 High-quality and strategically located business park (cont d) Strong defensive attributes Lease expiry profile by gross rental income (1) More than 84% of leases expiring in FY2022 and beyond provide income defensiveness Long WALE of 8.3 years (2) High occupancy rate of 98.1% (3) Healthy tenant retention rate of 89% (4) Data as at 30 September Excluding lease incentives and retail turnover rent, if any. (1) After taking into account certain rent guarantees and reimbursement of rent free incentives from the vendor for existing leases and potential lease breaks/expirations in (2) By gross rental income after taking into account rent guarantees and reimbursement of rent free incentives from vendor for existing leases and potential lease breaks / lease expirations in The weighted average lease to termination ( WALT ) (after accounting for rights to break) is 5.9 years. (3) After adjusting for leases for which the tenants have exercised their rights to break. (4) Since 2012.
25 1 High-quality and strategically located business park (cont d) 25 Strong and diversified tenant base Diversified trade sector mix (1) High quality tenant base (1) # Top ten tenants by rental income Sector % Gross rental income Credit rating 1 Fluor Limited Engineering 35.6% A3 / A- 2 INC Research UK Ltd Medical / Pharmaceuticals 10.8% Ba2 / BB- 3 Time Inc (UK) Ltd Publisher 6.5% B1 / B 4 Bolling Investments Limited Automobile 6.3% n/a 5 Aetna Global Benefits (UK) Ltd Insurance 5.9% Baa2 / A 6 Barons Farnborough Limited Automobile 4.7% n/a 7 Red Hat UK Limited IT 4.2% BBB 8 CapQuest Debt Recovery Ltd Financial services 3.3% n/a 9 A unit of Regus Service office 3.2% n/a Primarily focused on engineering, medical, pharmaceuticals and automobile sectors 10 Corporate Media Partners Limited Consultancy 1.8% n/a Data as at 30 September Excluding lease incentives and retail turnover rent, if any. (1) Taking into account certain rent guarantees and reimbursement of rent free incentives from the vendor for existing leases and potential lease breaks / lease expirations in 2018 and committed pre-lease to Bolling Investments Limited to occupy a car showroom (construction to commence in 1Q 2018 and expected to be completed by January 2019)
26 2 Strategic diversification into the UK business park market 26 Access to the 5th largest economy globally with resilient economic performance post-brexit vote UK GDP Index Global Financial Crisis Resilient GDP growth supported by resilient services and manufacturing sectors Brexit vote Services GDP Manufacturing Source: OECD, Office for National Statistics.


 Brexit vote FDI")


27 2 Strategic diversification into the UK business park market (cont d) 27 Robust FDI inflows and robust domestic business performance Resilient FDI inflows Domestic profits picking up (US$ billions) +1,044% YoY +338% sequentially (1) Brexit vote Average change in profits (%) Brexit vote FDI supported by large global institutions Source: OECD, Office for National Statistics, Bloomberg LP, Institute of Chartered Accountants in England and Wales. (1) Refers to growth in FDI inflows from 2H 2015 to 1H 2016


 Occupancy rate Brexit vote Source: Based on the valuation report")
 As at 30 September 2017 and after adjusting for leases which tenants have exercised their")
28 2 Strategic diversification into the UK business park market (cont d) 28 Resilient UK business park market supported by cost efficient positioning and favourable demand-supply dynamics Cost-efficient alternative to CBD and London locations Total occupier cost ( psf pa) Resilient rental trends despite Brexit vote Top rents psf pa Brexit vote Relocation to low cost alternative Office occupancy rates in Blackwater Valley Demand and supply trends driving healthy occupancy rates (1) Occupancy rate Brexit vote Source: Based on the valuation report by BNP Paribas Real Estate Advisory & Property Management UK Limited dated 11 December (1) As at 30 September 2017 and after adjusting for leases which tenants have exercised their rights to break.
 29 Well located in the Blackwater Valley with strong")


29 2 Strategic diversification into the UK business park market (cont d) 29 Well located in the Blackwater Valley with strong economic and demographic fundamentals Strong micro-market fundamentals Selected blue-chip tenants located in Blackwater Valley Presence Availability of key business clusters: Manufacturing Financial & business services Hi-tech, TMT Aerospace of quality workforce: Large workforce: 85% working age population Quality workforce: >60% office-based workforce Availability of quality talent pool: Access to over 340k university students from universities in South East UK Source: Higher Education Statistics Agency, valuation report by BNP Paribas Real Estate Advisory & Property Management UK Limited dated 11 September 2017.
30 3 DPU-accretive acquisition and strengthens FCOT s portfolio (cont d) 30 DPU-accretive transaction Key metrics Before the proposed acquisition (1) After the proposed acquisition (2) % change Net property income (S$ million) (3) 8.7% Distributable income (S$ million) % DPU (Singapore cents) (4) 1.6% Gearing (5) 34.7% 35.8% Note: Exchange rate applied for 1 :S$ as at 11 December (1) Based on financials for the year ended 30 September 2017 (FY2017). (2) FY2017 proforma assumes the full year impact of the transaction occurred on 1 October (3) Based on FCOT s 50% share of the NPI of Farnborough Business Park, which is based on headline rent of 12.1m p.a. (inclusive of reimbursement of rent free incentive and rent guarantees from the vendor), adjusted for the estimated net operating expenses of the property. (4) Assumes 58.0 million new units issued from Equity Fund Raising and remaining amount financed by debt.; and management fee (in connection with the acquisition of Farnborough Business Park) taken in units. (5) Computed as gross borrowings over total assets.
 Farnborough Business Park Singapore Australia UK Exchange rate applied of 1 : S$1.")

31 3 DPU-accretive acquisition and strengthens FCOT s portfolio 31 Enhanced portfolio diversification Pro forma portfolio asset value as at 30 September 2017 Pro forma NPI for FY2017 Farnborough Business Park S$113.8m S$123.8m (1) Farnborough Business Park Singapore Australia UK Exchange rate applied of 1 : S$ where applicable as at 11 December (1) Based on FCOT s 50% share of the NPI of the property, which is based on headline rent of 12.1m p.a. (inclusive of reimbursement of rent free incentive and rent guarantees from the vendor), adjusted for the estimated net operating expenses of Farnborough Business Park.
 3.8 years (3) Data as at 30 September 2017.")

 Adjusted for, among others, space committed by an entity of Rio Tinto Limited at Central Park on a new 12-year lease commencing in FY2018 and leases constituting 6.")
32 3 DPU-accretive acquisition and strengthens FCOT s portfolio (cont d) 32 Improved lease expiry profile for enlarged portfolio Portfolio lease expiry profile by gross rental income (1) Current WALE Pro forma WALE 3.4 years (2) 3.8 years (3) Data as at 30 September Excluding lease incentives and turnover rent, if any (1) Lease expiries in FY2018 has taken into account the space committed by an entity of Rio Tinto Limited for 12 years at Central Park commencing in FY2018 of 5.5%. Inclusive of the premises at Alexandra Technopark which were not renewed by Hewlett- Packard Enterprise and Hewlett-Packard Singapore upon lease expirations on 30 November 2017 (totalling3.1%). (2) Adjusted for, among others, space committed by an entity of Rio Tinto Limited at Central Park on a new 12-year lease commencing in FY2018 and leases constituting 6.8% portfolio GRI which were not renewed by Hewlett-Packard Enterprise Singapore Pte Ltd at Alexandra Technopark upon lease expirations on 30 September 2017 and 30 November 2017 (refer to FCOT s announcement dated 22 September 2017 for further details). On 3 November 2017, FCOT announced that premises constituting a further 1.5% of portfolio GRI would not be renewed by Hewlett-Packard Singapore PteLtd at Alexandra Technoparkupon lease expiration on 30 November 2017 (refer to FCOT s announcement dated 3 November 2017 for details). (3) Based on committed gross rental income and excluding lease incentives and turnover rent, if any, and taking into account rent guarantees and reimbursement of rent free incentives from the vendor for existing leases and potential lease breaks / lease expirations in The WALT (after accounting for rights to break) is 3.6 years


33 4 Consistent with the Manager s investment strategy to achieve long term growth for FCOT 33 The acquisition and expansion of investment mandate are in line with the Manager s strategies Entry Increases Prudent into an attractive and institutionalised market via strategic partnership with Sponsor Diversification beyond Singapore and Australia ROFR pipeline High-quality and defensive asset capital structure Manager s strategies Build a balanced and diversified portfolio of quality commercial properties Achieve long-term growth and deliver stable distributions to unitholders


")
 (50%) Source:")


34 Strong growth visibility from a ROFR pipeline of more than S$4bn 34 Selected Singapore assets owned by FCL Selected Australia assets owned by FCL Selected UK assets owned by FCL Frasers Tower (1) 1B Homebush Bay Drive Winnersh Triangle Alexandra Point 2 Southbank Boulevard Chineham Park 51 Cuppage Road 1D Homebush Bay Drive Watchmoor Park Valley Point Rhodes Corporate Park (Bldg F) Farnborough Business Park (2) (50%) Source: FCL 2016 annual report and announcements. (1) Currently under development. (2) Not owned by FCL as at date of announcement.

35 Appendix
* 90.0%^ 76.2%^# WALE 1.6 years 1.8 years 1.")


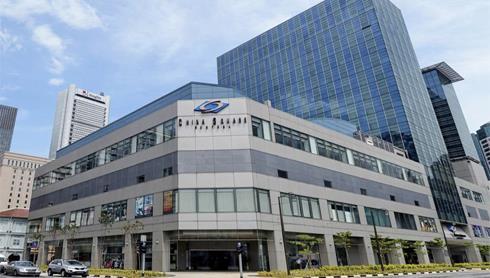
36 Existing portfolio review Singapore assets update 36 China Square Central stable occupancy for office tower 55 Market Street stable occupancy Alexandra Technopark rejuvenation and repositioning underway Occupancy 79.8% ^(office tower: 92.8%)* 90.0%^ 76.2%^# WALE 1.6 years 1.8 years 1.1 years # New leases, committed and renewals Sushi Tei Pte Ltd, Elitaire Law LLP Job Studio Pte Ltd, Corporate Serviced Offices Pte Ltd Smardt Chillers Pte Ltd, Nokia Solutions and Networks Singapore Pte Ltd, The Orange Tree Preschool, Cloudpay Asia Pte Ltd Tenants Central Park, Perth Data as at 30 September ^ Committed occupancy as at 30 September * Occupancy of retail units affected by planned vacancies arising from Hotel and Commercial Project. Refer to the Circular to Unitholders dated 3 June 2015 for details. # Adjusted to reflect 17.1% which will not be renewed by Hewlett-Packard Enterprise Singapore Pte Ltd upon lease expirations on 30 September 2017 and 30 November 2017 (refer to announcement dated 22 September 2017 for further details). Actual occupancy as at 30 September 2017 was 90.8%.

 7.8 years 3.")
 Nil fully occupied Data as at 30 September 2017.")
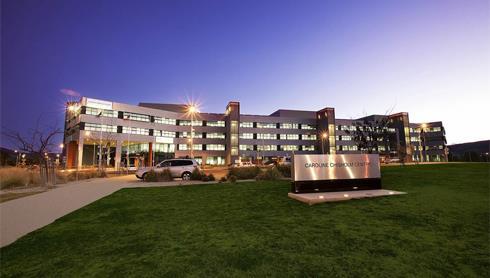
37 Existing portfolio review Australia asset 37 Central Park long WALE of 5.5 years * Caroline Chisholm Centre full occupancy with long WALE of 7.8 years 357 Collins Street full occupancy in a strong market Occupancy 88.9%* 100.0% 100.0% WALE 1.4 years (5.5 years with new leases * ) 7.8 years 3.6 years New leases, committed and renewals Tenants Marubeni Australia Limited, Liberty Mutual Insurance Company Property occupied until July 2025 by a single tenant, the Commonwealth of Australia (Aaa rated^) Nil fully occupied Data as at 30 September * Committed up to January 2018, taking into account space committed by an entity of Rio Tinto Limited on a new 12-year lease commencing in FY18, among others. Actual occupancy on 30 September 2017 was 69.6%. ^ Based on Moody s rating in August 2017.
.")
38 1 Data as at 30 September Excludes turnover rent (if any). 2 Hewlett-Packard Singapore Pte Ltd has informed that lease constituting 1.4% of portfolio GRI as at 30 September 2017 will not be renewed upon lease expiration on 30 November (refer to the announcement dated 3 November 2017 for details). 3 Hewlett-Packard Enterprise Singapore Pte Ltd has informed that leases constituting 6.6% of portfolio GRI as at 30 September 2017 will not be renewed upon lease expirations on 30 September 2017 and 30 November 2017 (refer to the announcement dated 22 September 2017 for further details). 4 Based on the space committed by an entity of Rio Tinto Limited on a new 12-year lease at Central Park commencing in FY18. Existing portfolio review Top 10 tenants 38 Top 10 tenants: MNCs, government department and public listed companies Established names and well diversified across various sectors Contribute 60% of portfolio gross rental income and have a WALE of 4.2 years as at 30 September 2017 Top 10 tenants by gross rental income Tenant Property Sector Lease Expiry % (Gross Rental Income) 1 Commonwealth of Australia Caroline Chisholm Centre Government Jul % Hewlett-Packard Singapore Alexandra Technopark IT Products & Services Nov % Pte Ltd 2 Hewlett-Packard Enterprise Alexandra Technopark IT Products & Services Sept-17/ Nov % Singapore Pte Ltd 3 Rio Tinto Limited 4 Central Park Mining/ resources Jun-18/ Jun % Commonwealth Bank of 357 Collins Street Banking, insurance & Dec % Australia financial services GroupM Singapore Pte Ltd China Square Central Consultancy/ business Mar % services Service Stream Ltd 357 Collins Street Multimedia & Dec % Telecommunications Microsoft Operations Pte Ltd Alexandra Technopark IT Products & Services Jan % Suntory Beverage & Food China Square Central Food & beverage May % Asia Pte Ltd BHP Billiton Iron Ore Pty Ltd Central Park Mining/ resources July-17 to Oct % Total 59.9%
 upon lease expirations on 30 September 2017 and 30 November 2017 (refer to the announcement dated 22")
 coupled with")
39 1 Excluding retail turnover rents. 2 Committed up to January 2018, taking into account, among others, space committed by an entity of Rio Tinto Limited on a new 12-year lease commencing in FY18 and 6.8% space which will not be renewed by Hewlett-Packard Enterprise Singapore Pte Ltd ( HPE ) upon lease expirations on 30 September 2017 and 30 November 2017 (refer to the announcement dated 22 September 2017 for further details). 3 Planned vacancies at China Square Central due to on-going construction works for the Hotel and Commercial Project (refer to the Circular to Unitholders dated 3 June 2015 for details) coupled with the HPE lease expirations contributed to lower average occupancy for the Singapore portfolio. Existing portfolio review Occupancy Rates & WALE 39 Average committed occupancy rate of 85.9% WALE of 3.4 years 1,2 Key portfolio statistics As at 30 Sept 2017 Committed occupancy 2 Geographical occupancy and % NPI contribution Ave Occupancy 89.1% 85.9% Portfolio WALE by gross rental income years 3.4 years 3

40 Existing portfolio review Lease expiry profile 40 Well-spread lease expiry profile provides income defensiveness Portfolio lease expiry by gross rental income Lease expiries in FY18 reduced by 5.5% mainly due to the space committed by an entity of Rio Tinto Limited for 12 years at Central Park*. Inclusive of the spaces which were not be renewed by Hewlett-Packard Enterprise upon lease expiry in November 2017 at Alexandra Technopark (totaling 3.1%)^ Lease expiry in FY22 and beyond increased to 35.8% mainly due to the space committed by Rio Tinto at Central Park* Portfolio lease expiry by gross rental income~ Number of leases expiring # NLA (sq ft) expiring 749, , ,497 46, ,005 Expiries as % total NLA 28.6% 11.8% 10.1% 1.8% 31.4% Expiries as % total Gross Rental Income 33.8% 15.2% 12.5% 2.6% 35.8% Data as at 30 September Excludes retail turnover rent. * Based on the space committed by an entity of Rio Tinto Limited on a new 12-year lease at Central Park commencing in FY18. ^ Refer to the announcements dated 22 September 2017 and 3 November 2017 for further details. ~ Inclusive of space committed by an entity of Rio Tinto Limited and space which will not be renewed by Hewlett-Packard Enterprise upon lease expiry in November 2017, among others. # Pending confirmation of the actual number of leases to be executed in respect of the overall space committed by an entity of Rio Tinto Limited under a Heads of Agreement.

 17 4 (office) 1 (retail) 6 (office) 5 (retail) Average passing rents for expiring leases~ $7.62 (office) $4.85 (retail) $7.33 (office) $6.71 (retail) $4.")
41 Existing portfolio review Lease expiry profile 41 Proactive management of leases Property Lease Expiries in FY18 as a proportion of Portfolio Gross Rental Income Inclusive of spaces which were not be renewed by Hewlett-Packard Enterprise and Hewlett-Packard Singapore at Alexandra Technopark following their lease expirations in November 2017* Lease expiry reduced by half after 5.5% of leases by income expiring in FY18 have been committed by an entity of Rio Tinto Limited for 12 years As at 30 September 2017 Number of leases expiring^ 16 (office) 36 (retail) 5(office) 2 (retail) 17 4 (office) 1 (retail) 6 (office) 5 (retail) Average passing rents for expiring leases~ $7.62 (office) $4.85 (retail) $7.33 (office) $6.71 (retail) $4.07 A$642 (office) A$2,627 (retail) A$554 (office) A$2,073 (retail) * Refer to the announcements dated 22 September 2017 and 3 November 2017 for further details. ^ Inclusive of the space committed by an entity of Rio Tinto Limited, among others. ~ Excludes turnover rent. Figures for Singapore properties are on a gross rent per square foot per month basis, while figures for Australian properties are based on net face rent per square metre per annum basis.


42 Existing portfolio review Mid-term rent reviews % of FY18 leases have built-in step-up rents FY Portfolio fixed % reviews Property China Square Central Leases Average step-up rent GROSS RENTAL INCOME 1 Property Total Portfolio 9 1.8% 41.3% 7.2% 55 Market Street 1 0.7% 7.6% 0.3% Alexandra Technopark Caroline Chisholm Centre % 1.4% 0.4% 1 3.0% 100.0% 16.1% Central Park % 29.2% 4.7% 357 Collins Street % 50.0% 8.0% FY18 - Other mid-term lease rent reviews Property Leases Review mechanism GROSS RENTAL INCOME 1 Property Total Portfolio Central Park 1 Market 5.5% 0.9% Central Park 3 CPI 1.6% 0.3% 357 Collins Street 4 Market 39.7% 6.3% Weighted average fixed step-ups 2.9% 2.8% 2.3% 2.0% 1 Excludes turnover rent (if any).

43 Developments at China Square Central 43 In August 2015, FCOT monetized the hotel development rights at China Square Central to FCL Gains of S$44.1 million available as capital distribution to supplement loss of income during construction period Construction works for the development of the 16-storey Hotel and Commercial Project 1 commenced in January 2016 and are expected to be completed by mid-2019 The Hotel and Commercial Project will bring in increased activity and rejuvenate China Square Central Hotel New retail and commercial spaces with better frontage and visibility will be created 2 Potential higher income from enhanced footfall More efficient use of retail and commercial space China Square Central Artist s impression of the Hotel Proposed Hotel Data as at 30 September Undertaken by an entity of Frasers Centrepoint Limited. Refer to the Circular to Unitholders dated 3 June 2015 for details. 2 New spaces to be created from relocated spaces from part of the existing basement at 18 Cross Street and a section of 22 Cross Street. Refer to the Circular to Unitholders dated 3 June 2015 for details.


44 AEI at China Square Central retail podium 44 Written Permission obtained for rejuvenation and repositioning of retail podium at 18 Cross Street S$38 million 1 project expected to commence in 1Q 2018 and complete by mid NLA to potentially increase to c.75,000 sf 1 from c.64,000 sf currently Improved tenant mix focusing on F&B, wellness and services To benefit from uplift in human traffic from Capri by Fraser opening in 2019 Before Artist s impression of the retail podium for illustration only 1. Based on provisional scheme which may be subject to change.

45 AEI at China Square Central retail podium 45 Exciting new tenant mix, wider food and beverage, wellness and services options Artist s impression for illustration only Artist s impression for illustration only Current provisional scheme is being refined and further details will be released in due course.

 NEW ENTRANCE GATEWAY Diagram is for illustration only and is subject to changes.")
46 AEI at Alexandra Technopark ( ATP ) 46 ATP will be revamped at a cost of $45 million to create a new campus-like environment Transformation into a vibrant, green, enriching and well-balanced work location Marketability and long-term competitiveness will be enhanced AEI works have commenced and are expected to complete around mid-2018 NEW COMMUNITY GARDEN LINK TO HORT PARK NEW FUTSAL COURT ALEXANDRA TECHNOPARK BLOCK A NEW LANDSCAPE GARDEN NEW COVERED LINK TO ALEXANDRA POINT NEW AMENITY HUB ALEXANDRA TECHNOPARK BLOCK B NEW FUTSAL COURT NEW END-OF-TRIP FACILITIES (BASEMENT) NEW ENTRANCE GATEWAY Diagram is for illustration only and is subject to changes. BICYCLE & PEDESTRIAN PATH


47 AEI at Alexandra Technopark 47 Wide range of amenities and facilities will be introduced for an enriching and stimulating environment Tenants can look forward to a generous offering of wellness, lifestyle, social and other amenities Artist s impression of Central Plaza, a new amenity hub Artist s impression of upgraded lift lobby New amenities include: Amenity hub Futsal courts Extensively landscaped garden environment End-of-trip facilities Farming plots for tenants to grow their own greens Bicycle and pedestrian paths Barbeque pits Exercise areas Artist s impression of new bicycle racks Artist s impression of new shower facilities and lockers

48 Singapore Office Rents 48 Singapore office - Grade B rents are relatively more stable and defensive than Grade A rents Singapore Grade A and Grade B office rents 1 Grade A CBD Core Grade B CBD Core Grade B Islandwide 1.7% qoq to S$9.10 psf 0.7% qoq to S$7.30 psf Stable qoq to S$6.85 psf Source: CBRE Research 1 CBRE, Singapore Market View, Q3 2017


49 Singapore Office Demand, Supply and Occupancy Rates 49 Office supply-demand dynamics 1 Market is turning positive on the back of stronger economic fundamentals and generally more positive market sentiment Most leasing transactions in 3Q 2017 were of medium sizes and mostly relocations by banking and finance, oil and gas, and engineering related companies Office Vacancy Rates 1 New and expansionary demand mainly from co-working and technology sectors, while fintech and online payment firms have also been very active CBRE expects modest rental growth over the near term as the market absorbs remaining space from new supply over the last two years Source: CBRE Research 1 CBRE, Singapore Market View, Q3 2017
 rents 1 Source: CBRE Research 1 CBRE, Singapore Market View, Q3")
50 Singapore Business Park Rents 50 Singapore business parks City fringe business park rents remained stable in Q Singapore Business Park (city fringe) rents 1 Source: CBRE Research 1 CBRE, Singapore Market View, Q3 2017


51 Singapore Business Park Demand, Supply and Occupancy Rates 51 Business Park supply-demand dynamics 1 As at end Q3 2017, island-wide vacancy rose slightly by 0.2 %-points to 12.1% mainly due to weaker demand in suburban business parks Business parks are still in demand by tenants seeking longer term rent stability, including those in the incubators, technology and fintech sectors Business Park future pipeline 1 City fringe business parks remain the de-facto choice for most tenants looking for space due to higher quality and better location Notable leasing transactions for 3Q 2017 were concentrated in the Alexandra precinct and involved media, finance-related and technology firms CBRE expects rental growth for city fringe business parks given the limited stock and also the fact that business parks may benefit from the strengthening of office rents Source: CBRE Research 1 CBRE, Singapore Market View, Q3 2017


52 Perth CBD Office Market 52 Premium Grade net face rents range between A$600 to A$725 per sqm per annum as at December 2016, with incentives averaging around 47.5% As at end-december 2016, market vacancy increased marginally to 22.5%, indicating stabilization Prevailing attractive rent level entices non-cbd tenants to relocate to CBD Demand for CBD office space expected to be largely led by consumer and business services sectors Major supply over the next two years is limited to the new headquarters of Woodside at Capital Square Perth CBD office supply, net absorption and vacancy rate Perth CBD average net face rents Source: Colliers Edge/PCA Source: Colliers Edge Source: Colliers International, Research and Forecast Report, CBD Office First Half 2017 and Savills Research, Perth CBD Office, January 2017
53 Melbourne CBD Office Market 53 Vacancy fell from 7.8% to 6.4% in the 12 months to January 2017, its lowest level in four years Melbourne CBD office has the second lowest vacancy rate in Australia behind Sydney As at January 2017, average prime net face rent for Melbourne CBD office space was between A$490 to A$580 per sqm per annum, with incentive levels around 25% to 30% Prime net face rent is forecast to record average growth of 5.0% per annum over the next two years Melbourne CBD is ranked in the top 5 cities globally for forecast rental growth over the next 3 years Melbourne CBD office vacancy rate (%) Melbourne office CBD net absorption per six-month period ( 000 sqm) Source: Knight Frank Research/ PCA Source: Knight Frank Research/ PCA Source: Knight Frank Research, Melbourne CBD Office Market Overview March 2017.
54 Thank you Frasers Centrepoint Asset Management (Commercial) Limited 438 Alexandra Road #21-00 Alexandra Point Singapore Tel: Fax: www. fraserscommercialtrust.com
Frasers Commercial Trust 1QFY18 Financial Results. 22 January 2018
 Frasers Commercial Trust 1QFY18 Financial Results 22 January 2018 Important notice Certain statements in this Presentation constitute forward-looking statements, including forward-looking financial information.
Frasers Commercial Trust
 Frasers Commercial Trust Frasers Day Seoul 4 April 2018 Important notice Certain statements in this Presentation constitute forward-looking statements, including forward-looking financial information.
Frasers Commercial Trust
 Frasers Commercial Trust dbaccess Asia Conference 2018 in Singapore 14 May 2018 Important notice Certain statements in this Presentation constitute forward-looking statements, including forward-looking
FCOT announces 1QFY18 results and expects to complete Farnborough Business Park acquisition by end-january 2018
 PRESS RELEASE For Immediate Release FCOT announces 1QFY18 results and expects to complete Farnborough Business Park acquisition by end-january 2018 Enhancement of FCOT s long-term growth potential and
Frasers Commercial Trust Citi Asia Pacific Property Conference in Hong Kong. 22 June 2017
 Frasers Commercial Trust Citi Asia Pacific Property Conference in Hong Kong 22 June 2017 Important Notice Certain statements in this Presentation constitute forward-looking statements, including forward-looking
Frasers Commercial Trust
 Frasers Commercial Trust 3QFY18 Financial Results 25 July 2018 Important notice Certain statements in this Presentation constitute forward-looking statements, including forward-looking financial information.
Frasers Commercial Trust
 Frasers Commercial Trust DBS The Pulse of Asia Conference in Singapore 8 January 2019 Important notice Certain statements in this Presentation constitute forward-looking statements, including forward-looking
Frasers Commercial Trust 3QFY13 Financial Results. 24 July 2013
 Frasers Commercial Trust 3QFY13 Financial Results 24 July 2013 Important notice Certain statements in this Presentation constitute forward-looking statements, including forward-looking financial information.
Frasers Commercial Trust
 Frasers Commercial Trust 4QFY18 and FY18 Financial Results 19 October 2018 Important notice Certain statements in this Presentation constitute forward-looking statements, including forward-looking financial
FCOT declares stable DPU of 2.40 cents for 4QFY18, contributing to fullyear DPU of 9.60 cents
 FCOT declares stable DPU of 2.40 cents for 4QFY18, contributing to fullyear DPU of 9.60 cents Completed divestment of 55 Market Street on 31 August 2018 and recognised an estimated net gain of approximately
FRASERS COMMERCIAL TRUST FINANCIAL STATEMENTS ANNOUNCEMENT FOR THE YEAR ENDED 30 SEPTEMBER 2017
 ("FCOT" or the "Trust") is a real estate investment trust established under a Trust Deed dated 12 September 2005 (as restated, amended and supplemented) entered into between Frasers Centrepoint Asset Management
The portfolio of FCOT as at 30 September 2018 consists of direct and indirect interests in six properties as follows:-
 ("FCOT" or the "Trust") is a real estate investment trust established under a Trust Deed dated 12 September 2005 (as restated, amended and supplemented) entered into between Frasers Commercial Asset Management
The portfolio of FCOT as at 30 June 2018 consists of direct and indirect interests in seven properties as follows:-
 FRASERS COMMERCIAL TRUST ("FCOT" or the "Trust") is a real estate investment trust established under a Trust Deed dated 12 September 2005 (as restated, amended and supplemented) entered into between Frasers
Investor Presentation for Tokyo Non-Deal Roadshow. 25 August 2016
 Investor Presentation for Tokyo Non-Deal Roadshow 25 August 2016 Important Notice This presentation shall be read in conjunction with OUE Commercial REIT s Financial Results announcement for 1Q 2016 dated
Keppel REIT. Second Quarter and First Half 2017 Financial Results. 18 July 2017
 Keppel REIT Second Quarter and First Half 2017 Financial Results 18 July 2017 Outline Key Highlights for 1H 2017 3 Financial Performance & Capital Management 6 Portfolio Performance 10 Market Updates 14
Frasers Commercial Trust Bank of America Merrill Lynch Asian Stars Conference May 2011
 Frasers Commercial Trust Bank of America Merrill Lynch Asian Stars Conference 2011 18 May 2011 Important notice Certain statements in this Presentation constitute forward-looking statements, including
Keppel REIT Annual General Meeting 20 April 2018
 Keppel REIT Annual General Meeting 20 April 2018 Outline Overview 3 Performance Update for FY 2017 6 Key Highlights for 1Q 2018 14 IMPORTANT NOTICE: The past performance of Keppel REIT is not necessarily
SGX - DBS Vickers - REITAS SREITS Corporate Day Investor Presentation
 SGX - DBS Vickers - REITAS SREITS Corporate Day Investor Presentation 27 Feb 1 Mar 2018 Important Notice This presentation shall be read in conjunction with OUE Commercial REIT s Financial Results announcement
Financial Results for 4 th Quarter 2017 and Year Ended 31 December 2017
 Financial Results for 4 th Quarter 2017 and Year Ended 31 December 2017 31 January 2018 Important Notice This presentation shall be read in conjunction with OUE Commercial REIT s Financial Results announcement
The Directors of Keppel REIT Management Limited, as Manager of Keppel REIT, are pleased to announce
 MEDIA RELEASE Unaudited Results of Keppel REIT for the First Quarter Ended 31 March 2016 14 April 2016 The Directors of Keppel REIT Management Limited, as Manager of Keppel REIT, are pleased to announce
First Quarter 2017 Financial Results 19 April Q 2017 Financial Results 19 April 2017
 First Quarter 2017 Financial Results 19 April 2017 1Q 2017 Financial Results 19 April 2017 Outline Key Highlights for 1Q 2017 3 Financial Highlights & Capital Management 4 Portfolio Performance 10 Market
Macquarie ASEAN Conference. 26 Aug 2014
 Macquarie ASEAN Conference 26 Aug 2014 Important Notice Standard Chartered Securities (Singapore) Pte. Limited, CIMB Bank Berhad, Singapore Branch and Oversea-Chinese Banking Corporation Limited were the
Financial Results for 3 rd Quarter 2016
 Financial Results for 3 rd Quarter 2016 1 November 2016 Important Notice This presentation shall be read in conjunction with OUE Commercial REIT s Financial Results announcement for 3Q 2016 dated 1 November
Investor Presentation March 2016
 Investor Presentation March 2016 Important Notice This presentation shall be read in conjunction with Mapletree Industrial Trust s ( MIT ) financial results for Third Quarter Financial Year 2015/2016 in
Investor Presentation November 2015
 Investor Presentation November 2015 Important Notice This presentation shall be read in conjunction with Mapletree Industrial Trust s ( MIT ) financial results for Second Quarter Financial Year 2015/2016
FINANCIAL RESULTS For First Quarter ended 31 March 2015
 FINANCIAL RESULTS For First Quarter ended 31 March 2015 AGENDA Q1 Highlights Financial Performance Portfolio Performance AEI Updates Looking Ahead Unit Performance 2 Q1 HIGHLIGHTS Q1 HIGHLIGHTS FINANCIAL
K-REIT Asia s Distributable Income for First Half 2012 (1H 2012) Grew by 94.6% Year-on-Year
 Grew by 94.6% Year-on-Year") PRESS RELEASE K-REIT Asia Unaudited Results for the Second Quarter and Half Year Ended 30 June 2012 16 July 2012 The Directors of K-REIT Asia Management Limited, as manager of K-REIT Asia, announce the
PRESS RELEASE K-REIT Asia Unaudited Results for the Second Quarter and Half Year Ended 30 June 2012 16 July 2012 The Directors of K-REIT Asia Management Limited, as manager of K-REIT Asia, announce the
Financial Results for 3 rd Quarter November 2017
 Financial Results for 3 rd Quarter 2017 2 November 2017 Important Notice This presentation shall be read in conjunction with OUE Commercial REIT s Financial Results announcement for 3Q 2017 dated 2 November
Financial Results for 4 th Quarter and Year Ended 31 December January 2019
 Financial Results for 4 th Quarter and Year Ended 31 December 2018 30 January 2019 Important Notice This presentation should be read in conjunction with the announcements released by OUE Commercial REIT
Unaudited Results of Keppel REIT for the Second Quarter and Half Year Ended 30 June 2013
 MEDIA RELEASE Unaudited Results of Keppel REIT for the Second Quarter and Half Year Ended 30 June 2013 15 July 2013 The Directors of Keppel REIT Management Limited, as manager of Keppel REIT, are pleased
The Directors of Keppel REIT Management Limited, as manager of Keppel REIT, are pleased to announce the
 MEDIA RELEASE Unaudited Results of Keppel REIT for the Quarter Ended 31 March 2013 15 April 2013 The Directors of Keppel REIT Management Limited, as manager of Keppel REIT, are pleased to announce the
Citi-REITAS-SGX C-Suite Singapore REITs and Sponsors Forum
 Citi-REITAS-SGX C-Suite Singapore REITs and Sponsors Forum 23 August 2018 Important Notice This presentation shall be read in conjunction with OUE Commercial REIT s Financial Results announcement for 2Q
1H 2009 FINANCIAL RESULTS. 20 Jul 2009
 1H 2009 FINANCIAL RESULTS 20 Jul 2009 1 Contents Operations Review Portfolio Analysis Capital Management Market Review & Outlook Going Forward 2 Highlights 1H 2009 distributable income 29.6% y-o-y Net
REITs Symposium May 2018
 REITs Symposium 2018 19 May 2018 Important Notice This presentation shall be read in conjunction with OUE Commercial REIT s Financial Results announcement for 1Q 2018 dated 10 May 2018. This presentation
CapitaLand Commercial Trust Singapore s First Commercial REIT Proposed Acquisition of 60.0% of units in MSO Trust which holds CapitaGreen
 CapitaLand Commercial Trust Singapore s First Commercial REIT Proposed Acquisition of 60.0% of units in MSO Trust which holds CapitaGreen 1 Tuesday, 21 June 2016 Disclaimer The past performance of CCT
Investor Presentation for Citi ASEAN Investor Conference. 12 June 2014
 Investor Presentation for Citi ASEAN Investor Conference 2 June 204 Important Notice Standard Chartered Securities (Singapore) Pte. Limited, CIMB Bank Berhad, Singapore Branch and Oversea-Chinese Banking
Presentation for REITs Symposium 2017
 Presentation for REITs Symposium 2017 27 May 2017 Important Notice This presentation shall be read in conjunction with OUE Commercial REIT s Financial Results announcement for 1Q 2017 dated 5 May 2017.
CapitaCommercial Trust Investing in Singapore's largest office REIT (by market cap) Singapore Investment Week 2014
 Singapore Investment Week 2014") CapitaCommercial Trust Investing in Singapore's largest office REIT (by market cap) Singapore Investment Week 2014 24 May 2014 1 Important Notice This presentation shall be read in conjunction with CCT
CapitaCommercial Trust Investing in Singapore's largest office REIT (by market cap) Singapore Investment Week 2014 24 May 2014 1 Important Notice This presentation shall be read in conjunction with CCT
2Q2014 Financial Results 24 July Creating Value & Delivering Growth
 2Q2014 Financial Results 24 July 2014 1 Creating Value & Delivering Growth Important Notice This material shall be read in conjunction with CIT s financial statements for the financial period ended 30
3Q 2012 Presentation Slides. 1 Nov 2012
 3Q 2012 Presentation Slides 1 Nov 2012 2 Important Notice This material shall be read in conjunction with CIT s financial statements for the financial period ended 30 Sep 2012. The value of units in CIT
ACQUISITION OF 50% INTEREST IN 275 GEORGE STREET, BRISBANE, AUSTRALIA
 (Constituted in the Republic of Singapore pursuant to a trust deed dated 28 November 2005 (as amended)) ACQUISITION OF 50% INTEREST IN 275 GEORGE STREET, BRISBANE, AUSTRALIA 1. INTRODUCTION The Board of
CapitaLand Commercial Trust Singapore s First and Largest Commercial REIT Annual General Meeting
 CapitaLand Commercial Trust Singapore s First and Largest Commercial REIT Annual General Meeting 1 19 April 2018 Important Notice This presentation shall be read in conjunction with CCT s FY 2017 Financial
AIMS AMP CAPITAL INDUSTRIAL REIT
 AIMS AMP CAPITAL INDUSTRIAL REIT FY2019: First Quarter Financial Results Ended 30 June 2018 Results Presentation 26 July 2018 1 Important notice Disclaimer This Presentation is focused on comparing actual
FY2014 Financial Results Presentation
 FY2014 Financial Results Presentation 16 January 2015 16 International Business Park Important Notice This material shall be read in conjunction with CIT s results announcements for the financial period
FY2018 Results Presentation. 22 Jan 2019
 FY2018 Results Presentation 22 Jan 2019 Disclaimer This presentation may contain forward-looking statements that involve assumptions, risks and uncertainties. Actual future performance, outcomes and results
Presentation by Frasers Centrepoint Trust at the REITs Symposium May 2018, Suntec Singapore
 Presentation by Frasers Centrepoint Trust at the REITs Symposium 2018 19 May 2018, Suntec Singapore Important notice Forward-looking statements Certain statements in this Presentation constitute forward-looking
AIMS AMP CAPITAL INDUSTRIAL REIT
 AIMS AMP CAPITAL INDUSTRIAL REIT FY2013: 2 nd Quarter Ended 30 September 2012 Results Presentation 24 October 2012 Important Notice Disclaimer This Presentation is focused on comparing actual results for
Notice of Annual General Meeting
 7 th Annual General Meeting 18 July 2017 Important Notice This presentation shall be read in conjunction with Mapletree Industrial Trust s ( MIT ) financial statements for the financial year ended 31 March
27 January ARA-CWT Trust Management (Cache) Limited
 Limited") 4Q 2010 Financial Results 27 January 2011 ARA-CWT Trust Management (Cache) Limited Agenda 4Q 2010 Financial Results Portfolio Update Going Forward 2 Highlights 4Q 2010 Results Net Property Income of S$14.4m
4Q 2010 Financial Results 27 January 2011 ARA-CWT Trust Management (Cache) Limited Agenda 4Q 2010 Financial Results Portfolio Update Going Forward 2 Highlights 4Q 2010 Results Net Property Income of S$14.4m
AIMS AMP CAPITAL INDUSTRIAL REIT
 AIMS AMP CAPITAL INDUSTRIAL REIT FY2014: Third Quarter ended 31 December 2013 Results Presentation 29 January 2014 Important notice Disclaimer This Presentation is focused on comparing actual results for
Investor Presentation August 2017
 Investor Presentation August 2017 Important Notice This presentation shall be read in conjunction with Mapletree Industrial Trust s ( MIT ) financial results for First Quarter Financial Year 2017/2018
Investor Presentation. May 2013
 Investor Presentation May 2013 DISCLAIMER This presentation is for information only and does not constitute an offer or solicitation of an offer to subscribe for, acquire, purchase, dispose of or sell
AIMS AMP CAPITAL INDUSTRIAL REIT
 AIMS AMP CAPITAL INDUSTRIAL REIT FY2016: First Quarter Financial Results Ended 30 June 2015 Results Presentation 29 July 2015 Important notice Disclaimer This Presentation is focused on comparing actual
OUE C-REIT Achieved Distribution of S$17.8 million in 3Q 2017, 3.2% Higher YoY
 PRESS RELEASE For Immediate Release OUE C-REIT Achieved Distribution of S$17.8 million in 3Q 2017, 3.2% Higher YoY Key Highlights: 3Q 2017 amount available for distribution of S$17.8 million increased
SGX REIT & BT SEMINAR Tokyo, 30 June Pioneer Crescent
 SGX REIT & BT SEMINAR Tokyo, 30 June 3016 25 Pioneer Crescent Singapore Industrial REITs (S-REITs) 3 Key Features Bond-like listed security ( Dividend Play ) that provides steady income distribution stream
AIMS AMP CAPITAL INDUSTRIAL REIT
 AIMS AMP CAPITAL INDUSTRIAL REIT FY2016: Second Quarter Financial Results Ended 30 September 2015 Results Presentation 29 October 2015 Important notice Disclaimer This Presentation is focused on comparing
CapitaLand Commercial Trust Singapore s First Commercial REIT Proposed Acquisition of CapitaGreen Acquiring 60.0% interest in MSO Trust units
 CapitaLand Commercial Trust Singapore s First Commercial REIT Proposed Acquisition of CapitaGreen Acquiring 60.0% interest in MSO Trust units 1 Monday, 23 May 2016 Disclaimer The past performance of CCT
24 January Singapore Malaysia China Australia Japan
 Potential acquisition of the Plaza Arcade in Perth Singapore Malaysia China Australia Japan 1 Investment highlights Attractive yield and DPU accretive Prime location Expands SG REIT s existing footprint
Mapletree Commercial Trust Results Announcement. For the period 27 April 2011 to 30 June 2011
 Mapletree Commercial Trust Results Announcement For the period 27 April 2011 to 30 June 2011 Disclaimer This presentation is for information only and does not constitute an invitation or offer to acquire,
Singapore Investor Roadshow
 Singapore Investor Roadshow 11 May 2015 16 International Business Park Important Notice This material shall be read in conjunction with CIT s results announcements for the financial period ended 31 December
Section 1 K REIT Asia Overview
 Investor Presentation October 2010 Important notice The past performance of K REIT Asia is not necessarily indicative of its future performance. Certain statements made in this presentation may not be
Financial Results for the Quarter / Year Ended 31 Mar April 2012
 Financial Results for the Quarter / Year Ended 31 Mar 2012 19 April 2012 Disclaimer This Presentation is focused on comparing results for the three months ended 31 Mar 2012 versus results achieved in the
Rights Issue and Financing Plan for Proposed Acquisition of an Indirect Interest in One Raffles Place. 29 June 2015
 Rights Issue and Financing Plan for Proposed Acquisition of an Indirect Interest in One Raffles Place 29 June 2015 Disclaimer This presentation should be read in conjunction with the announcements released
REITS Symposium Presentation 19 May 2018
 REITS Symposium Presentation 19 May 2018 Important Notice This presentation is for information purposes only and does not constitute or form part of an offer, invitation or solicitation of any offer to
OUE C-REIT Achieved Higher YoY Distribution of S$17.8 million in 2Q 2017
 PRESS RELEASE For Immediate Release OUE C-REIT Achieved Higher YoY Distribution of S$17.8 million in 2Q 2017 Key Highlights: 2Q 2017 amount available for distribution of S$17.8 million increased 0.6% year-on-year
1Q FY2009/10 Financial Results Presentation 17 July 2009
 1Q FY2009/10 Financial Results Presentation 17 July 2009 Disclaimers This Presentation is focused on comparing results for the three months ended 30 June 2009 versus actual results year-on-year ( yoy ).
AIMS AMP Capital Industrial REIT announces DPU of 2.50 cents in 1Q FY2019
 AIMS AMP CAPITAL INDUSTRIAL REIT MANAGEMENT LIMITED As Manager of AIMS AMP Capital Industrial REIT One George Street, #23-03 Singapore 049145 Media Release AIMS AMP Capital Industrial REIT announces DPU
Agenda. About IREIT Global. Key Highlights. Portfolio Summary. European Market Overview. Looking Ahead. Appendix : Overview of Tikehau Capital
 2Q2018 Results Presentation 8 August 2018 Agenda About IREIT Global Key Highlights Portfolio Summary European Market Overview Looking Ahead Appendix : Overview of Tikehau Capital 2 About IREIT Global About
Agenda. Key Highlights. Financial Highlights. Portfolio Summary. Economy & Real Estate Review. Looking Ahead
 1Q 2017 Results Presentation May 2017 Agenda Key Highlights Financial Highlights Portfolio Summary Economy & Real Estate Review Looking Ahead 2 Key Highlights 1Q 2017 Key Highlights Gross revenue held
FY2017 Annual General Meeting 19 April 2018
 FY2017 Annual General Meeting 19 April 2018 Agenda Key Highlights About Tikehau Capital European Market Review Portfolio Overview Financial Highlights Conclusion 2 Key Highlights FY2017 Key Highlights
BUILDING ON OUR STRENGTHS BHG RETAIL REIT FINANCIAL RESULTS FOR THE 2 ND QUARTER AND HALF YEAR ENDED 30 JUNE AUGUST 2018
 BUILDING ON OUR STRENGTHS BHG RETAIL REIT FINANCIAL RESULTS FOR THE 2 ND QUARTER AND HALF YEAR ENDED 30 JUNE 2018 8 AUGUST 2018 Disclaimer Certain statements made in this presentation may not be based
(Constituted in the Republic of Singapore pursuant to a trust deed dated 28 November 2005 (as amended)
") (Constituted in the Republic of Singapore pursuant to a trust deed dated 28 November 2005 (as amended) ACQUISITION OF 50.0% INTEREST IN 8 EXHIBITION STREET, MELBOURNE, AUSTRALIA 1. INTRODUCTION The Board
(Constituted in the Republic of Singapore pursuant to a trust deed dated 28 November 2005 (as amended) ACQUISITION OF 50.0% INTEREST IN 8 EXHIBITION STREET, MELBOURNE, AUSTRALIA 1. INTRODUCTION The Board
OSK DMG ASEAN & Hong Kong Corporate Day June 2012
 OSK DMG ASEAN & Hong Kong Corporate Day 26-28 June 2012 2 Important Notice This material shall be read in conjunction with CIT s financial statements for the financial period ended 31 March 2012. The value
CAPITALAND MALL TRUST Singapore s First & Largest Retail REIT. First Quarter 2017 Financial Results
 CAPITALAND MALL TRUST Singapore s First & Largest Retail REIT First Quarter 2017 Financial Results 20 April 2017 Disclaimer This presentation may contain forward-looking statements that involve assumptions,
OUE C-REIT s FY2015 Distribution 22.2% Higher YoY, 4Q 2015 DPU Exceeded Circular Forecast by 20.4%
 PRESS RELEASE For Immediate Release OUE C-REIT s FY2015 Distribution 22.2% Higher YoY, 4Q 2015 DPU Exceeded Circular Forecast by 20.4% Key Highlights: 4Q 2015 distribution per unit ( DPU ) exceeded Circular
Mapletree Commercial Trust
 Mapletree Commercial Trust 3Q FY17/18 Financial Results 24 January 2018 1 Important Notice This presentation is for information only and does not constitute an offer or solicitation of an offer to sell
FY2015 Financial Results Presentation
 FY2015 Financial Results Presentation 14 January 2016 16 International Business Park 2 Content Executive Summary Financial Summary Real Estate Highlights Financial & Capital Management Highlights Appendix
FY2012 Financial Results Presentation
 FY2012 Financial Results Presentation 21 January 2013 Knowing. Believing. Delivering ARA-CWT Trust Management (Cache) Limited Agenda Overview & FY12 Key Highlights 4QFY12 & FY12 Full Year Financial Performance
MEDIA RELEASE. Unaudited Results of Keppel REIT for the First Quarter Ended 31 March April 2015
 MEDIA RELEASE Unaudited Results of Keppel REIT for the First Quarter Ended 31 March 2015 13 April 2015 The Directors of Keppel REIT Management Limited, as Manager of Keppel REIT, are pleased to announce
4QFY2013 and 2HFY2013 Results Presentation. January 2014
 4QFY2013 and 2HFY2013 Results Presentation January 2014 1 Disclaimer This presentation should be read in conjunction with the financial statements of Soilbuild Business Space REIT for the period from 1
The Manager is pleased to declare a DPU of 1.40 cents for 3Q 2017, bringing total DPU for 9M 2017 to 4.27 cents.
 MEDIA RELEASE Unaudited Results of Keppel REIT for the Third Quarter and Nine Months Ended 30 September 2017 17 October 2017 The Directors of Keppel REIT Management Limited, as Manager of Keppel REIT,
6 th Annual General Meeting 24 April International Business Park
 6 th Annual General Meeting 24 April 2015 16 International Business Park Important Notice This material shall be read in conjunction with CIT s results announcements for the financial period ended 31 December
2016 FINANCIAL YEAR RESULTS PRESENTATION
 2016 FINANCIAL YEAR RESULTS PRESENTATION 22 August 2016 www.industriareit.com.au ASX CODE: IDR Agenda 01 Highlights and Investment Proposition 02 Financial results 03 Portfolio performance 04 Capital management
For personal use only
 GROWTHPOINT PROPERTIES AUSTRALIA TRUST ARSN 120 121 002 GROWTHPOINT PROPERTIES AUSTRALIA LIMITED ABN 33 124 093 901 AFSL 316409 ASX ANNOUNCEMENT GROWTHPOINT PROPERTIES AUSTRALIA (ASX Code: GOZ) RESULTS
Cambridge Industrial Trust Presentation on 3Q2007 Results. 30 Oct 2007
 Cambridge Industrial Trust Presentation on 3Q2007 Results 30 Oct 2007 References in this presentation Unless otherwise stated, all capitalised terms used shall have the same meaning as in the prospectus
CAPITAMALLS MALAYSIA TRUST (CMMT)
") CAPITAMALLS MALAYSIA TRUST (CMMT) Malaysia s Largest Pure-Play Shopping Mall REIT Asian Investment Conference & Exhibition, Singapore AICE 23 2011 July *23 July 2011 2011* Disclaimer The information in
CAPITAMALLS MALAYSIA TRUST (CMMT) Malaysia s Largest Pure-Play Shopping Mall REIT Asian Investment Conference & Exhibition, Singapore AICE 23 2011 July *23 July 2011 2011* Disclaimer The information in
AIMS AMP CAPITAL INDUSTRIAL REIT
 AIMS AMP CAPITAL INDUSTRIAL REIT FY2018: Second Quarter Financial Results Ended 30 September 2017 Results Presentation 26 October 2017 1 Important notice Disclaimer This Presentation is focused on comparing
Frasers Centrepoint Trust
 Frasers Centrepoint Trust 1 st Quarter FY11 results 24 January 2011 Important notice 2 Certain statements in this Presentation constitute forwardlooking statements, including forwardlooking financial information.
Investor Presentation
 Investor Presentation 15 September 2011 Knowing. Believing. Delivering ARA-CWT Trust Management (Cache) Limited Agenda REIT Overview Management Strategy 2Q 2011 Financial Results Portfolio Update Going
Cache Logistics Trust launches IPO
 ARA-CWT Trust Management (Cache) Limited (as manager of Cache Logistics Trust) 6 Temasek Boulevard #16-02 Suntec Tower Four Singapore 038986 Tel: (65) 6835 9232 Fax: (65) 6835 9672 www.cache-reit.com PRESS
Presentation for DBS Pulse of Asia Conference. January 2016
 Presentation for DBS Pulse of Asia Conference January 2016 Important Notice Standard Chartered Securities (Singapore) Pte. Limited, CIMB Bank Berhad, Singapore Branch and Oversea-Chinese Banking Corporation
AIMS AMP CAPITAL INDUSTRIAL REIT
 AIMS AMP CAPITAL INDUSTRIAL REIT 8 th ANNUAL GENERAL MEETING PRESENTATION 27 July 2017 1 Important notice Disclaimer This Presentation is focused on comparing actual results for the financial period from
Agenda. About IREIT Global. Key Highlights. Portfolio Summary. European Market Review. Looking Ahead. Appendix : Overview of Tikehau Capital
 4Q2018 and FY2018 Results Presentation 20 February 2019 Agenda About IREIT Global Key Highlights Portfolio Summary European Market Review Looking Ahead Appendix : Overview of Tikehau Capital 2 About IREIT
Introduction to Cache Logistics Trust
 Introduction to Cache Logistics Trust 30 May 2013 Tampines Regional Library Knowing. Believing. Delivering ARA-CWT Trust Management (Cache) Limited Agenda About Cache Logistics Trust 1QFY2013 Financial
CapitaCommercial Trust Annual General Meeting
 CapitaCommercial Trust Annual General Meeting 16 April 2013 1 Important Notice This presentation shall be read in conjunction with CCT s 2012 Full Year Unaudited Financial Statement Announcement. The past
Agenda. About IREIT Global. Key Highlights. Portfolio Summary. Economy & Real Estate Review. Looking Ahead. Appendix : Overview of Tikehau Capital
 4Q 2017 and FY 2017 Results Presentation 14 February 2018 Agenda About IREIT Global Key Highlights Portfolio Summary Economy & Real Estate Review Looking Ahead Appendix : Overview of Tikehau Capital 2
The materials are also available at and
 MEDIA RELEASE Unaudited Results of Keppel REIT for the First Quarter Ended 31 March 2018 18 April 2018 The Directors of Keppel REIT Management Limited, as Manager of Keppel REIT, are pleased to announce
Cambridge Industrial Trust. 29 Jan 2008
 Cambridge Industrial Trust Full Year 2007 Results 29 Jan 2008 FY2007 Results Presentation Outline FY 2007 Milestones 4Q2007 Financial Results Capital Management Strategy Acquisition Highlights Portfolio
Citi ASEAN Conference 12 June Tai Seng Street
 Citi ASEAN Conference 12 June 2014 1 16 Tai Seng Street Important Notice This material shall be read in conjunction with CIT s financial statements for the financial period ended 31 Mar 2014. The value
Mapletree Commercial Trust
 Mapletree Commercial Trust 3Q FY16/17 Financial Results 25 January 2017 1 Important Notice This presentation is for information only and does not constitute an offer or solicitation of an offer to sell