Trend Report 12/2017
|
|
|
- Ethelbert Kelly
- 5 years ago
- Views:
Transcription
1 Trend Report 12/2017

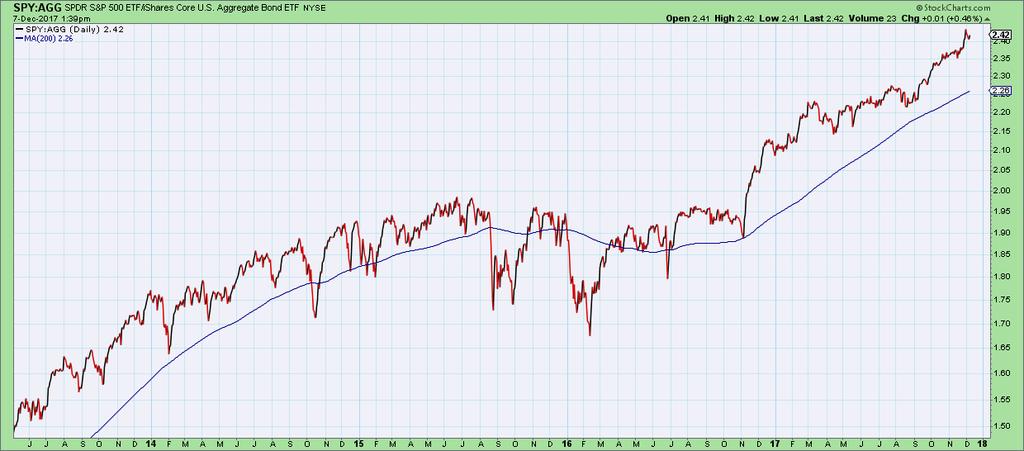
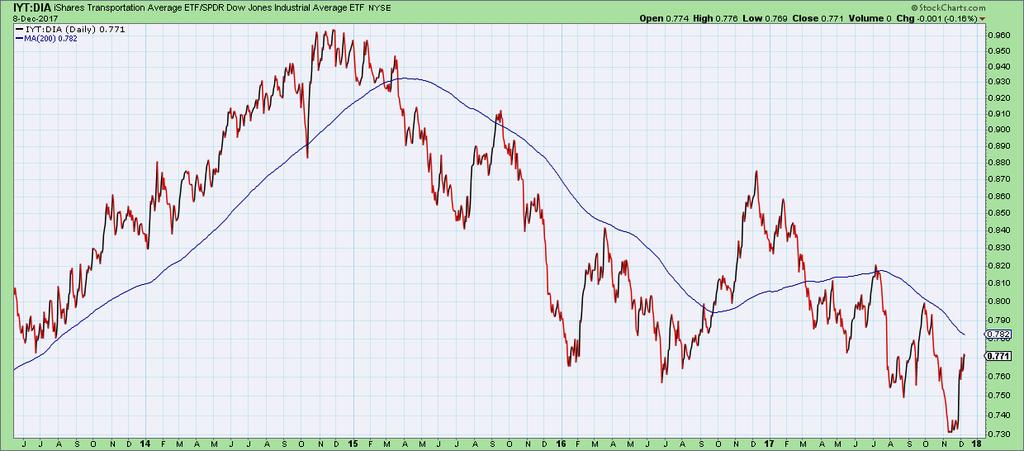
2 Table of Contents Business Cycle ISM Manufacturing: Growing ECRI Leading Economic Indicators: Growing Market Trends Stocks vs. Bonds: Stocks Stocks vs. Gold: Stocks High Yield vs. Treasuries: Treasuries TIPs vs. Treasuries: Treasuries International vs. US stocks: US Stocks Dow Transports vs. Dow Industrials: Industrials Nasdaq vs. S&P 500: Nasdaq Small Cap Stocks vs. Large Cap Stocks: Large Cap Stocks Value vs. Growth: Growth Emerging vs. International: Emerging markets Valuations: Overvalued Asset Class Relative Strength Chart of the Month: Bitcoin
3 Summary The Good Economic growth remains in a positive trend as suggested by the ISM manufacturing index and ECRI leading index. The broad stock markets remain in positive trends globally. Inflation is muted and defensive asset classes remain weak. The Bad High Yield bonds have weakened considerably against Treasury bonds. The Nasdaq is threatening to turn negative relative to the broad market. The Ugly Transports and small capitalization stocks are weak relative to the broad equity market. International stocks have broken their positive trends relative to US stocks. Valuations are at outrageous levels suggesting low future returns. What Should We Do?.. Look at asset classes that typically are negatively correlated with stocks during down markets (i.e. Managed Futures). Do not buy and hold. This may be one of the worst periods ever to buy and hold the overall US stock market. Follow the trend and make sure you always have an exit strategy.even in Bitcoin.
4 /1/1982 8/1/1982 3/1/ /1/1983 5/1/ /1/1984 7/1/1985 2/1/1986 9/1/1986 4/1/ /1/1987 6/1/1988 1/1/1989 8/1/1989 3/1/ /1/1990 5/1/ /1/1991 7/1/1992 2/1/1993 9/1/1993 4/1/ /1/1994 6/1/1995 1/1/1996 8/1/1996 3/1/ /1/1997 5/1/ /1/1998 7/1/1999 2/1/2000 9/1/2000 4/1/ /1/2001 6/1/2002 1/1/2003 8/1/2003 3/1/ /1/2004 5/1/ /1/2005 7/1/2006 2/1/2007 9/1/2007 4/1/ /1/2008 6/1/2009 1/1/2010 8/1/2010 3/1/ /1/2011 5/1/ /1/2012 7/1/2013 2/1/2014 9/1/2014 4/1/ /1/2015 6/1/2016 1/1/2017 8/1/2017 ISM PMI
5
6

7

8

9

10
11

12

13

14

15

16
17 Asset Class-Relative Strength Symbol Description Ranking DBC Commodities 1 VV Large-Cap US stocks 2 VTI Total US Stock Market 3 VWO Emerging markets 4 VT Total World Stock Market 5 VB Small-Cap Stocks 6 VO Mid-Cap Stocks 7 VEA International Developed 8 LQD Corporate Bonds 9 HYG High Yield Bonds 10 TIP Inflation-protected bonds 11 IEF 7-10 year US Treasury Bonds 12 GLD Gold 13
18
19 Disclosure WealthShield (WS) is a registered investment adviser with the SEC. Registration does not constitute an endorsement of the firm nor does it indicate that the adviser has attained a particular level of skill or ability. WS provides nondiscretionary advisory services to other registered investment advisers and investment adviser representatives and does not provide advice to underlying clients of the firms and representatives to which it provides advisory services. The model portfolios are designed by WS unless otherwise noted. Information presented herein is for educational purposes only and does not intend to make an offer or solicitation for the sale or purchase of any specific securities, investments, or investment strategies. Investments involve risk and are not guaranteed. This information does not address individual situations and should not be construed or viewed as any type of individual or group recommendation. Be sure to first consult with a qualified financial adviser, legal and/or tax professional before implementing any securities, investment or investment strategies discussed herein. Model Performance Disclosure: Any Model performance shown for the relevant time periods is based upon hypothetical results of a WS model portfolio. Model portfolio performance is the result of the application of the WS investment process. It does not reflect any investor s actual experience with owning, trading or managing an actual investment account. Model portfolio performance only reflects the deduction of expenses charged by the underlying funds. Model portfolio performance does not reflect the deduction of other fees or expenses, including but not limited to advisory fees, trading costs, brokerage fees, custodial fees or expenses charged by other investment companies. Performance results are shown in US Dollars and include the reinvestment of dividends, capital gains and interest on cash balances where applicable. Cash balances are assumed to earn no interest. The data used to calculate the model performance was obtained from sources deemed reliable and then organized and presented by WS. Back-tested performance is purely hypothetical, does not reflect actual trading in clients' accounts and may not reflect the effect that material economic and market factors may have had on the adviser s decision-making had the adviser actually managed client fundsduringthe periods presented. The performance calculations have not been audited by any third party. Actual performance of client portfolios may differ materially due to the timing related to changes in investment strategies, contributions or withdrawals and the actual deployment and investment of a client portfolio, the reinvestment of dividends, the length of time various positions are held, the client s objectives and restrictions, and fees and expenses incurred by any specific individual portfolio. The hypothetical results do not reflect the fact that individually managed accounts may not be as broadly diversified as the benchmark. The portfolio results do not reflect the results of actual trading but are achieved by means of the retroactive application, certain aspects of which may have been designed with the benefit of hindsight. Hypothetical past performance is no assurance of future results. There is no guarantee that a strategy s objectives will be realized. Different types of investments involve varying degrees of risk and there can be no assurance that any specific investment will either be suitable or profitable for a client s investment portfolio. Economic factors, market conditions and investment strategies will affect the performance of any portfolio, and there are no assurances that it will match or outperform any benchmark. Investing in non-traditional and international investments involves additional risks that are not generally associated with investing in domestic equities. Benchmarks: The index / indices used by WS have not been selected to represent an appropriate benchmark to compare an investor s performance, but rather are disclosed to allow for comparison of the investor s performance to that of certain well-known and widely recognized indices. Indices are not available for direct investment, are unmanaged and do not incur fees or expenses. Rebalancing is done using closing prices as of the second Friday of the calendar month ( target implementation day ) or closest market day. Target implementation dates for new allocations are provided with each rebalancing allocation. Rebalancing does not always result in a change. It should not be assumed that recommendations made in the future will be profitable or will equal the performance of securities in this list or past hypothetical performance. PAST PERFORMANCE IS NO GUARANTEE OF FUTURE RESULTS. Not FDIC insured. All investment strategies have the potential for profit or loss. Historical data may use proxies to represent investments and asset classes. These proxies may have holdings and performance that vary from the investments or asset classes over time. Proxies include but are not limited to: Asset Class Proxy Asset Class Proxy Large Cap Value Equity S&P 500 Dividend Aristocrats TR USD Short Bond BBgBarc US Aggregate 1-3 Yr TR USD Large Cap Growth Equity DJ US TSM Large Cap Growth TR USD Pacer Wealthshield Index WealthShield Sector TR USD Small Cap Equity Russell 2000 TR USD Managed Futures SG Trend Index International Developed Equity MSCI EAFE NR USD Dividend Growth Strategies S&P 500 Dividend Aristocrats TR USD International Emerging Equity FTSE Emerging TR USD M&A Credit Suisse Merg Arbtrg Liquid TR USD Intermediate/Aggregate Bond BBgBarc US Agg Bond TR USD Commodities Bloomberg Commodity TR USD International Bond BBgBarc Gbl Agg Ex USD TR Hdg USD REITs S&P United States REIT TR USD
Trend Report 11/2017
 Trend Report 11/2017 Table of Contents Macroeconomic Data GDP ECRI Leading Economic Indicators Intermarket Relationships-Trends Stocks vs. Bonds Stocks vs. Gold High Yield vs. Treasuries TIPs vs. Treasuries
Schwab Diversified Growth Allocation Trust Fund (Closed to new investors) Institutional Unit Class As of June 30, 2017
 Institutional Unit Class As of June 30, 2017") Fund Facts Trustee Fund Type Charles Schwab Bank Collective Trust Fund Morningstar Category Allocation - 50-70% Equity Benchmark Global Growth Custom Index 1 Unit Class Inception Date 3/7/2012 Fund Inception
Fund Facts Trustee Fund Type Charles Schwab Bank Collective Trust Fund Morningstar Category Allocation - 50-70% Equity Benchmark Global Growth Custom Index 1 Unit Class Inception Date 3/7/2012 Fund Inception
Florida United Methodist Foundation Cautious As Of: September 30, 2017
 Cautious Low 0.85% The Cautious Portfolio is designed for a short-term investment horizon and/or risk-averse investor. It seeks a regular and constant income stream, high liquidity and muted volatility.
Premise Capital 3rd Quarter Investment Commentary
 Premise Capital 3rd Quarter Investment Commentary Premise Investors, Q3 2018 YTD Return Std Dev Return Std Dev BBgBarc US Agg Bond TR USD 0.02 2.84-1.60 3.40 BBgBarc US Treasury US TIPS TR USD -0.82 3.27-0.84
Focus on preservation of investor capital in down markets. Designed to put investor capital to work during sustained bull markets
 A diversified portfolio including domestic equity, international, alternative, and fixed income components. ETF universe is ranked using a quantitative system based on market price anomalies and the direction
INVESTMENT PLAN. Sample Client. For. May 04, Prepared by : Sample Advisor Financial Consultant.
 INVESTMENT PLAN For Sample Client May 04, 2012 Prepared by : Sample Advisor Financial Consultant sadvisor@loringward.com Materials provided to approved advisors by LWI Financial Inc., ( Loring Ward ).
Schwab Diversified Growth Allocation Trust Fund
 Fund Facts Trustee Fund Type Charles Schwab Bank Collective Trust Fund Category Global Asset Allocation Benchmark Global Growth Custom Index 1 Unit Class Inception Date 11/21/2012 Fund Inception Date 3/7/2012
offer to sell nor does it seek an offer to buy these CDs in any jurisdiction where the offer or sale is not permitted.
 The information in this preliminary disclosure statement supplement is not complete and may be changed. This preliminary disclosure statement supplement is not an offer to sell nor does it seek an offer
Brexit and Market Implications Special Commentary & Webinar
 Brexit and Market Implications Special Commentary & Webinar June 27, 2016 SR# 904360 Today s Speakers Envestnet PMC Zachary Karabell Head of Global Strategy, Envestnet As Head of Global Strategy, Mr. Karabell
Barings Participation Investors
 Historical Price Performance Worst 3 Months -10.01% Best 3 Months 9.30% 2013 2014 2015 2016 2017 2018 Closed End Fund Strategy Information on Fund Strategy is not available Performance Returns Data as
Benchmark Review September 30, 2017
 September 0, 20 0 Std Dev s YTD Year Year Year Year Year Year 206 20 204 20 202 20 200 U.S. Equity Market Indexes S&P 00 2.06 4.48 4.24 8.6 0.8 4.22 6.4.44 0..96.8.69 2.9 6.00 2..06 S&P 00 Equal Weighted
Focus on preservation of investor capital in down markets. Designed to put investor capital to work during sustained bull markets
 Portfolio A diversified 403(b) portfolio including domestic equity, international, alternative, and fixed income components. ETF universe is ranked using a quantitative system based on market price anomalies
Market Overview As of 1/31/2019
 Asset Class Leadership Periodic Table Worst Best 78.51 58.21 41.45 37.21 34.47 27.45 26.46 20.58 19.69 29.09 27.58 2 18.88 16.71 15.51 15.12 15.06 11.15 7.84 7.28 4.98 2.64 2.11 0.39-2.91-5.50-13.71 20.14
Market Overview As of 4/30/2018
 Asset Class Leadership Periodic Table Worst Best 5.24-26.16-28.92-36.85-37.00-37.34-38.44-38.54-45.53 78.51 58.21 41.45 37.21 34.47 27.45 26.46 20.58 19.69 29.09 27.58 24.50 18.88 16.71 15.51 15.12 15.06
Market Overview As of 11/30/2018
 Asset Class Leadership Periodic Table Worst Best 5.24-26.16-28.92-36.85-37.00-37.34-38.44-38.54-45.53 78.51 58.21 41.45 37.21 34.47 27.45 26.46 20.58 19.69 29.09 27.58 24.50 18.88 16.71 15.51 15.12 15.06
1000G 1000G HY
 Asset Class Leadership Periodic Table Worst Best 5.24-26.16-28.92-36.85-37.00-37.34-38.44-38.54-45.53 78.51 58.21 41.45 37.21 34.47 27.45 26.46 20.58 19.69 29.09 27.58 24.50 18.88 16.71 15.51 15.12 15.06
plan investment review performance summary
 CASH AND EQUIVALENTS - MONEY MARKET Vanguard Federal Money Market Investor 0.54% 1.78% 0.81% 0.30% 0.04% 0.01% 0.02% 1.78% 0.96% 0.59% 0.34% ICE BofA ML US Treasury Bill 3 Mon USD 0.56% 1.87% 0.86% 0.33%
Market Overview As of 8/31/2017
 Asset Class Leadership Periodic Table Worst Best 39.42 16.65 11.81 7.05 6.97 5.49 1.87-0.17-9.78 5.24-26.16-28.92-36.85-37.00-37.34-38.44-38.54-45.53 78.51 58.21 41.45 37.21 34.47 27.45 26.46 20.58 19.69
Market Overview As of 10/31/2017
 Asset Class Leadership Periodic Table Worst Best 39.42 16.65 11.81 7.05 6.97 5.49 1.87-0.17-9.78 5.24-26.16-28.92-36.85-37.00-37.34-38.44-38.54-45.53 78.51 58.21 41.45 37.21 34.47 27.45 26.46 20.58 19.69
The Risk in Asset Allocation
 The Risk in Asset Allocation SAMER HABL Managing Director Tactical Allocation Franklin Templeton Multi-Asset Strategies Franklin Advisers, Inc. June 5, 2013 Agenda Asset Allocation Post a 30 Year Bond
Morgan Stanley ETF-MAP 2 Index Information
 Morgan Stanley ETF-MAP 2 Index Information Investing in instruments linked to the Morgan Stanley ETF-MAP 2 Index involves risks not associated with an investment in other instruments. See Risk Factors
AllianceBernstein Global High Income Fund Inc.
 Historical Price Performance Worst 3 Months -7.90% Best 3 Months 10.38% 2014 2015 2016 2017 2018 Closed End Fund Strategy Information on Fund Strategy is not available Performance Returns Data as of 10/31/2018
July J.P. Morgan Structured Investments. The J.P. Morgan Efficiente Plus 5 Index (Net ER) Strategy Guide
 Strategy Guide") July 2017 J.P. Morgan Structured Investments The J.P. Morgan Efficiente Plus 5 Index (Net ER) Strategy Guide Important Information The information contained in this document is for discussion purposes
July 2017 J.P. Morgan Structured Investments The J.P. Morgan Efficiente Plus 5 Index (Net ER) Strategy Guide Important Information The information contained in this document is for discussion purposes
Subject to Completion. Dated June 3, Goldman Sachs Bank USA $ GS Momentum Builder Multi-Asset 5 ER Index-Linked Certificates of Deposit due 2021
 The information in this preliminary disclosure statement supplement is not complete and may be changed. This preliminary disclosure statement supplement is not an offer to sell nor does it seek an offer
North Carolina Supplemental Retirement Plans. Performance Review First Quarter 2017
 North Carolina Supplemental Retirement Plans Performance Review First Quarter 2017 Asset Allocation Summary Current Asset Allocation As of March 31, 2017 Prior Period Asset Allocation As of December 31,
Performance Notes Linked to the HSBC Vantage5 Index (USD) Excess Return
 Excess Return") Filed Pursuant to Rule 433 Registration No. 333-202524 January 2, 2018 FREE WRITING PROSPECTUS (To Prospectus dated March 5, 2015, Prospectus Supplement dated March 5, 2015, Equity Index Underlying Supplement
Filed Pursuant to Rule 433 Registration No. 333-202524 January 2, 2018 FREE WRITING PROSPECTUS (To Prospectus dated March 5, 2015, Prospectus Supplement dated March 5, 2015, Equity Index Underlying Supplement
GS Momentum Builder Multi-Asset 5S ER Index-Linked CDs Due 2024
 GS Momentum Builder Multi-Asset 5S ER Index-Linked CDs Due 2024 OVERVIEW The CDs do not bear interest. At maturity an investor in the CDs will be paid an amount in cash equal to the face amount of their
Morningstar Advisor Workstation
 Morningstar Advisor Workstation Selecting a Benchmark Below outline s the applicable benchmarks to use for each CIFSC categories. These investments can be used to compare investments in Graphs, Portfolios
Goldman Sachs Bank USA $2,799,000 Variable Coupon GS Momentum Builder Multi-Asset 5 ER Index-Linked Certificates of Deposit due 2022
 Goldman Sachs Bank USA $2,799,000 Variable Coupon GS Momentum Builder Multi-Asset 5 ER Index-Linked Certificates of Deposit due 2022 The CDs will pay an annual coupon based on (i) the performance of the
SAMPLE. Portfolio Insights Analysis. May 16, years, 1 month. Improve growth. Minimize impact of market volatility BENCHMARK DATE RANGE GOAL
 May 16, 2018 Portfolio Insights Analysis ILOVEJP Sample Portfolio BENCHMARK JPMorgan 80-20 Benchmark DATE RANGE 10 years, 1 month GOAL Improve growth CONCERN Minimize impact of market volatility As the
Chart 1: Dow Jones Industrial Average. Chart 2: Dow Jones Transportation Average
 December 17th, 2018 1 You are probably going to hear a lot about Dow Theory in the coming days and weeks. Just like the death crosses that have been occurring in several broad market indices, Dow Theory
Disclosure Statement Supplement to the Disclosure Statement dated December 19, 2011 No. 73 Goldman Sachs Bank USA $12,366,000 Contingent Coupon
 Disclosure Statement Supplement to the Disclosure Statement dated December 19, 2011 No. 73 Goldman Sachs Bank USA $12,366,000 Contingent Coupon Index-Linked Certificates of Deposit due 2019 (Linked to
RBC Strategic Asset Allocation Models
 Page 1 of United States Core Very conservative Last updated: April 17 Risk Profile 1 The focus is capital preservation. The portfolio will typically be invested mainly in fixed income and other low volatility
Market Commentary - 2nd Quarter 2017
 3 Months YTD 1 Year 3 Years 5 Years 1 Years As the economy picks up we will need to be gradual when adjusting our policy parameters, so as to ensure that our stimulus accompanies the recovery amid the
Focus on preservation of investor capital in down markets. Designed to put investor capital to work during sustained bull markets
 A diversified portfolio including domestic equity, international, alternative, and fixed income components. ETF universe is ranked using a quantitative system based on market price anomalies and the direction
Columbus Asset Allocation Report For Portfolio Rebalancing on
 Columbus Asset Allocation Report For Portfolio Rebalancing on 2017-08-31 Strategy Overview Columbus is a global asset allocation strategy designed to adapt to prevailing market conditions. It dynamically
A Guide to Our REAL SPEND. Investment Strategies A RETIREMENT INCOME STRATEGY.
 A Guide to Our REAL Investment Strategies A www.horizoninvestments.com horizoninvestments.com 2 Challenge + Opportunity Challenge + Opportunity horizoninvestments.com 3 Demographic Shift Over the next
Investment Perspectives. From the Global Investment Committee
 Investment Perspectives From the Global Investment Committee Introduction Domestic equities continued to race ahead during the fourth quarter of 2014 amid spikes in volatility, dramatic declines in oil
MAY 2018 Capital Markets Update
 MAY 2018 Market commentary U.S. ECONOMICS The U.S. added 223,000 jobs to payrolls in May, well above the consensus estimate of 180,000 and the expansion average of around 200,000. Sector job gains were
TEL FAX cookstreetconsulting.com
 TEL 303.333.7770 1.800.318.7770 FAX 303.333.7771 cookstreetconsulting.com Contents 1 Market Review 2 Plan Overview 3 Investment Due Diligence Appendix Appendix 3 1 Market Review 5 Q2 2017 Economic Review
Morgan Stanley Dynamic Balance Index
 Morgan Stanley Dynamic Balance Index Return MORGAN STANLEY DYNAMIC BALANCE INDEX Morgan Stanley Dynamic Balance Index A rules-based index offering risk-controlled exposure to a broad range of asset classes
Crescat Portfolio Management, LLC Verification and Crescat Global Macro Hedge Fund Composite Performance Examination Report.
 Crescat Portfolio Management, LLC Verification and Crescat Global Macro Hedge Fund Composite Performance Examination Report December 31, 2018 Verification and Performance Examination Report Investors Crescat
HSBC Vantage5 Index Methodology Guide
 HSBC Vantage5 Index Methodology Guide Table of contents Index overview 1 Index components 2 Vantage5 Index methodology 3 Monthly rebalancing process 4 Simulated historic volatility 5 Simulated portfolio
SEPTEMBER 2018 Capital Markets Update
 SEPTEMBER 2018 Market commentary U.S. ECONOMICS Non-farm payrolls added 134,000 jobs in September, missing the consensus estimate of 185,000. However, net revisions to the two months prior totaled +87,000
CP#32-08 Investment Policy
 Investment Policy Approved: 07/19/08 Revised: 5/11/2017 Charter of the ICC Investment Management Program Committee 1.0 Introduction: The Board of Directors of The International Code Council, Inc. (the
Colby Investment Ratings Report A Publication from Robert W. Colby Asset Management, Inc.
 Ratings for February 17, 2012 Asset Classes. Commodities. Real Estate. Foreign and Emerging Markets. Small Cap Growth, IWO Large Cap Growth, VUG Mid Cap Blend, MDY Small Cap Blend, IWM Mid Cap Growth,
Schwab Indexed Retirement Trust Fund 2040
 Fund Facts Trustee Fund Type Charles Schwab Bank Collective Trust Fund Category Target Date 2036-2040 Benchmark 2040 Custom Index 1 Unit Class Inception Date Fund Inception Date 1/5/2009 Net Asset Value
A Summary of the Rogers International Commodity Index 3 rd Quarter 2017
 A Summary of the Rogers International Commodity Index 3 rd Quarter 2017 The Rogers International Commodity Index (RICI ) was developed by Jim Rogers to be an international, diversified, investable raw
Volatility-Managed Strategies
 Volatility-Managed Strategies Public Pension Funding Forum Presentation By: David R. Wilson, CFA Managing Director, Head of Institutional Solutions August 24, 15 Equity Risk Part 1 S&P 5 Index 1 9 8 7
Exchange Traded Funds ETFs
 Exchange Traded Funds ETFs Table of Content: Topic Page Exchange Traded Funds Definition 3 Exchange Traded Funds Creation and Redemption 3 Exchange Traded Funds benefits 4 Exchange Traded Funds Types 6
March 9, 2017 PORTFOLIO PROTECTION TECHNIQUES By Mike Halloran, CFA Investment Strategist
 March 9, 2017 PORTFOLIO PROTECTION TECHNIQUES By Mike Halloran, CFA Investment Strategist The stock market has been on a historic run higher since last fall. The good news is that global economic growth
Contact Us en español gatesretirement.com. Fee and Investment Notice. Dear Plan Participant,
 Fee and Investment Notice Contact Us 800-401-5866 en español 1-877-905-2553 gatesretirement.com Dear Plan Participant, Saving for retirement is an important key to a secure future, whether you plan to
An Introduction to Dynamic Overlay
 Tactical investment strategy striving to preserve and grow client wealth An Introduction to Dynamic Overlay www.mrminv.com 12444 Powerscourt Drive Suite 350, St. Louis, MO 63131 1-(800) 233-1944 Q4 2018
Going Beyond Style Box Investing
 Going Beyond Style Box Investing NCPERS Presented by Erin Doyle Orekhov, Client Portfolio Manager May 22, 2017 For financial professional or qualified institutional investor use only. Not for inspection
ACG Market Review. Second Quarter Global Highlights: Economy Announced tariffs have so far failed to slow down economic activity
 ACG Market Review Second Quarter 2018 Global Highlights: Economy Announced tariffs have so far failed to slow down economic activity Equities U.S. equites turn positive for the year backed by strong corporate
Income Solutions Beyond Investment Grade Bonds
 October 2017 Income Solutions Beyond Investment Grade Bonds Multiple Fixed Income Approaches Direction of interest rates Reduce Duration Limit Duration to Near Zero with: Floating rate notes (FRNs) for
J.P. Morgan Structured Investments
 Payment at Maturity North America Structured Investments 4yr ETF Efficiente DS 5 CD Overview J.P. Morgan ETF Efficiente DS 5 (the ) is an addition to the JPMorgan Efficiente index family. JPMorgan ETF
Auto Callable Certificates of Deposit Linked to the J.P. Morgan Efficiente Plus DS 5 Index (Net ER) due November 28, 2023, with Step-Up Call Value
 due November 28, 2023, with Step-Up Call Value") October 31, 2016 JPMorgan Chase Bank, National Association Structured Investments Auto Callable Certificates of Deposit Linked to the J.P. Morgan Efficiente Plus DS 5 Index (Net ER) due November 28, 2023,
October 31, 2016 JPMorgan Chase Bank, National Association Structured Investments Auto Callable Certificates of Deposit Linked to the J.P. Morgan Efficiente Plus DS 5 Index (Net ER) due November 28, 2023,
BROAD COMMODITY INDEX
 BROAD COMMODITY INDEX COMMENTARY + STRATEGY FACTS APRIL 2017 80.00% CUMULATIVE PERFORMANCE ( SINCE JANUARY 2007* ) 60.00% 40.00% 20.00% 0.00% -20.00% -40.00% -60.00% -80.00% ABCERI S&P GSCI ER BCOMM ER
Quarterly Asset Class Report Global Equity
 Quarterly Asset Class Report Global Equity canterburyconsulting.com Canterbury Consulting ( CCI ) is an SEC registered Investment Adviser. Information pertaining to CCI's advisory operations, services,
Information Regarding Your Retirement Account LEECH LAKE BAND OF OJIBWE GOVERNMENT 401(K) October 14, 2017
 October 14, 2017") Information Regarding Your Retirement Account LEECH LAKE BAND OF OJIBWE GOVERNMENT 401(K) October 14, 2017 The information in this document is designed to provide you important information about your company
Information Regarding Your Retirement Account LEECH LAKE BAND OF OJIBWE GOVERNMENT 401(K) October 14, 2017 The information in this document is designed to provide you important information about your company
Are We There Yet? # Days. Quantitative Investment Decisions 999 Vanderbilt Beach Road Suite 200 Naples, Florida
 1 11 21 31 41 51 61 71 81 91 101 111 121 131 141 151 161 171 181 191 201 211 221 231 241 251 Are We There Yet? March lived up to expectations with a slightly negative Market return, -0.04%. The post-election
MANAGED FUTURES INDEX
 MANAGED FUTURES INDEX COMMENTARY + STRATEGY FACTS JULY 2018 CUMULATIVE PERFORMANCE ( SINCE JANUARY 2007* ) 120.00% 100.00% 80.00% 60.00% 40.00% 20.00% 0.00% AMFERI BARCLAY BTOP50 CTA INDEX S&P 500 S&P
Asset Strategy Consultants. MARKET ENVIRONMENT First Quarter 2017
 MARKET ENVIRONMENT First Quarter 2017 Market Environment: Economy Economies in the U.S. and Europe continued to gain traction. Expectations for lower taxes, reduced regulation, and other pro-growth reforms
University of Southern California Hospital 401(k) Retirement Plan
 Retirement Plan") Participant Disclosure Notice University of Southern California Hospital 401(k) Retirement Plan IMPORTANT PLAN AND INVESTMENT- RELATED INFORMATION, INCLUDING THE PLAN S INVESTMENT OPTIONS, PERFORMANCE
Participant Disclosure Notice University of Southern California Hospital 401(k) Retirement Plan IMPORTANT PLAN AND INVESTMENT- RELATED INFORMATION, INCLUDING THE PLAN S INVESTMENT OPTIONS, PERFORMANCE
2016 MARKET OUTLOOK PREPARED JANUARY Newfound Case #
 2016 MARKET OUTLOOK PREPARED JANUARY 2016 Newfound Case #4093212 1 LONG-TERM RETURN FORECASTS 2 EQUITY VALUATIONS Shiller Cyclically Adjusted Price-to-Earnings Ratio ( CAPE ): Price divided by 10-year
TOTAL RETURN MARCH Newfound Case ID:
 TOTAL RETURN MARCH 2015 Newfound Case ID: 3377049 1 THE NEWFOUND MISSION Newfound Research s product suite has been designed to balance the desire to pursue growth with the need to avoid large drawdowns.
F U N D E V A L U A T I O N R E P O R T
 F U N D E V A L U A T I O N R E P O R T Santa Barbara Foundation Performance Update M E K E T A I N V E S T M E N T G R O U P BOSTON MASSACHUSETTS CHICAGO ILLINOIS MIAMI FLORIDA PORTLAND OREGON SAN DIEGO
Prepare for Market Volatility. Help Realize Financial Goals.
 Prepare for Market Volatility. Help Realize Financial Goals. ANNUITIES SINGLE PREMIUM DEFERRED Brighthouse Shield Level Selector Annuity SM Brighthouse Shield Level Selector 3-Year Annuity SM Issued by
MANAGED FUTURES INDEX
 MANAGED FUTURES INDEX COMMENTARY + STRATEGY FACTS JUNE 2018 CUMULATIVE PERFORMANCE ( SINCE JANUARY 2007* ) 120.00% 100.00% 80.00% 60.00% 40.00% 20.00% 0.00% AMFERI BARCLAY BTOP50 CTA INDEX S&P 500 S&P
The Bull Market: Six Years Old And Not Over
 The Bull Market: Six Years Old And Not Over April 22-24, 2015 FOR PROFESSIONAL USE ONLY. FURTHER DISTRIBUTION OF THE INFORMATION CONTAINED HEREIN IS PROHIBITED WITHOUT PRIOR PERMISSION. Disclosures This
BROAD COMMODITY INDEX
 BROAD COMMODITY INDEX COMMENTARY + STRATEGY FACTS AUGUST 2018 120.00% 100.00% 80.00% 60.00% 40.00% 20.00% 0.00% -20.00% -40.00% -60.00% CUMULATIVE PERFORMANCE ( SINCE JANUARY 2007* ) -80.00% ABCERI S&P
... Overview Resource B Variable Annuity Investment Options
 Overview Document Summary This document includes important information that may help you compare the different investment options (if available) under your retirement plan. For additional information about
Tax-Managed SMAs: Better Than ETFs?
 June 2018 Tax-Managed SMAs: Better Than ETFs? Rey Santodomingo, CFA Managing Director of Investment Strategy Tim Atwill, PhD, CFA Head of Investment Strategy Exchange-traded funds, or ETFs, are popular
TACTICAL DIVIDEND GROWTH
 TACTICAL DIVIDEND GROWTH THE PROBLEM WITH BUY & HOLD WBI does not stand for We Beat Indexes ; it stands for Wealth Builders, Inc. At WBI, we believe preserving capital to unleash the powerful benefits
Understanding the JPMorgan ETF Efficiente 5 Index
 Fact Sheet Understanding the JPMorgan ETF Efficiente 5 Index Not a bank or credit union deposit, obligation or guarantee May lose value Not FDIC or NCUA/NCUSIF insured Not insured by any federal government
Eric C. Elbell, CFA, CAIA Area Senior Vice President. Kyongdo Min, CPA, CFA Area Vice President. April 11, 2018
 Eric C. Elbell, CFA, CAIA Area Senior Vice President Kyongdo Min, CPA, CFA Area Vice President April 11, 2018 Agenda We will address three key topics: Headline events that impacted markets during the quarter
BROAD COMMODITY INDEX
 BROAD COMMODITY INDEX COMMENTARY + STRATEGY FACTS JUNE 2017 80.00% CUMULATIVE PERFORMANCE ( SINCE JANUARY 2007* ) 60.00% 40.00% 20.00% 0.00% -20.00% -40.00% -60.00% -80.00% ABCERI S&P GSCI ER BCOMM ER
Long-Term Capital Market Assumptions And Model Portfolios February Investment Strategy Group
 Long-Term Capital Market Assumptions And Model Portfolios February 2018 Investment Strategy Group 2018 Long-Term Capital Market Assumptions Every year we update our risk, return and correlation assumptions
Building and Managing a Diversified Portfolio
 Building and Managing a Diversified Portfolio Craig L. Israelsen, Ph.D. Designer of the Portfolio Presentation AAII Silicon Valley Chapter April 14, 2018 Based on research by Craig L. Israelsen, Ph.D.
Investment Option Performance
 Investment Option Performance Data as of: 8/1/2018 The investment funds in this Investment Option Performance Report reflect the investment options currently offered under your plan. MassMutual has not
GOAL ENGINEER SERIES PORTFOLIO HIGHLIGHTS:
 GOAL ENGINEER SERIES The Goal Engineer Series combines Northern Trust s asset allocation, portfolio construction and risk management expertise with Engineered Equity TM and active fixed income strategies
ETF portfolio review, 31st July the ETF investment specialists
 ETF portfolio review, 31st July 2016 the ETF investment specialists market overview The defensive Secure Wealth Management ETF portfolios have performed strongly in 2016, with fixed-income up 7.6%, conservative
PIMCO Global Optima Index
 PIMCO Global Optima Index Dynamically Blending Global Equity and U.S. Fixed Income Markets to Help Deliver Upside Growth Potential Issued by American General Life Insurance Company (AGL), an American International
THE PROBLEM WITH BUY & HOLD
 RETIREMENT INCOME THE PROBLEM WITH BUY & HOLD WBI does not stand for We Beat Indexes ; it stands for Wealth Builders, Inc. At WBI, we believe preserving capital to unleash the powerful benefits of compounding
Factual Studies on Managed Futures Interaction with Stocks
 Factual Studies on Managed Futures Interaction with Stocks Trading futures and options involves substantial risk of loss and is not suitable for all investors. The use of the phrase Managed Futures refers
Chart 1: S&P 500 Death Crosses since 1923;
 December 10th, 2018 1 Last week we had a death cross in the S&P 500 and the 3 year minus 5 year Treasury yield curve went negative (inverted). These two events had talking heads claiming everything from
INVESTMENT FUNDAMENTALS
 INVESTMENT FUNDAMENTALS WHAT YOU NEED TO KNOW If you re just starting out as an investor, there s a lot of information to absorb. This fact file defines and explores the pros and cons of each asset class,
AlphaSolutions Multi-Sector Fixed Income Model
 AlphaSolutions Multi-Sector Fixed Income Model A fixed income model based on trending and momentum strategies Portfolio Goals Primary: Seeks to invest in highranked sectors within the fixed income market
Liberty Mutual 401(k) Plan Annual Fee Disclosure Statement
 Plan Annual Fee Disclosure Statement") Liberty Mutual 401(k) Plan Annual Fee Disclosure Statement Important information about Your Options, Fees and Other Expenses The Liberty Mutual 401(k) Plan (the Plan ) is a great way to build savings for
Liberty Mutual 401(k) Plan Annual Fee Disclosure Statement Important information about Your Options, Fees and Other Expenses The Liberty Mutual 401(k) Plan (the Plan ) is a great way to build savings for
PART TWO: PORTFOLIO MANAGEMENT HOW EXPOSURE TO REAL ESTATE MAY ENHANCE RETURNS.
 PART TWO: PORTFOLIO MANAGEMENT HOW EXPOSURE TO REAL ESTATE MAY ENHANCE RETURNS. MAY 2015 Burland East, CFA CEO American Assets Capital Advisers Creede Murphy Vice President, Investment Analyst American
Correlation and Asset Management
 Correlation and Asset Management Michael Mendelson Principal Ernst Schaumburg Vice President May 2017 AQR Capital Management, LLC Two Greenwich Plaza Greenwich, CT 06830 p: +1.203.742.3600 w: aqr.com 1
PLAN NEWS. See inside for details.
 United Launch Alliance 401(k) Savings Plan PLAN NEWS Changes to Your Investment Options United Launch Alliance (ULA) regularly reviews the funds in the 401(k) Savings Plan to make sure they offer a combination
... Overview Group Variable Annuity Investment Options
 Overview Document Summary This document includes important information that may help you compare the different investment options (if available) under your retirement plan. For additional information about
Schwab Intelligent Portfolios. Investing has changed forever.
 Schwab Intelligent Portfolios. Investing has changed forever. Technology that will change the way you invest. Schwab Intelligent Portfolios is an automated investment advisory service that builds, monitors,
TACTICAL DIVIDEND INCOME
 TACTICAL DIVIDEND INCOME THE PROBLEM WITH BUY & HOLD WBI does not stand for We Beat Indexes ; it stands for Wealth Builders, Inc. At WBI, we believe preserving capital to unleash the powerful benefits
FLOW AND SHORT INTEREST ANALYSIS 27/04/2015 < Last closing date US Broad Indices 28/04/2015 1:23 AM CET < Report creation date & time
 27/4/ < Last closing date US Broad Indices 28/4/ 1:23 AM CET < Report creation date & time ETF Tracking (SI / Daily D_MAV D MAV MSCI World URTH 7. -.1% 2.8%.4% 6.4% Bullish Bullish MSCI Emerging EEM 44..4%
The Power of Quality-Meets-Value: Focus on U.S. Mid-Caps
 BARROW STREET ADVISORS The Power of Quality-Meets-Value: Focus on U.S. Mid-Caps Equity Research Important Information The performance figures presented in this research involve back-tested data which (a)
plan investment review performance summary
 CASH AND EQUIVALENTS - MONEY MARKET CREF Money Market R2 0.28% 0.49% 0.44% 0.06% 0.00% 0.00% 0.00% 0.79% 0.33% 0.20% 0.22% Vanguard Federal Money Market 0.42% 0.75% 0.81% 0.30% 0.04% 0.01% 0.02% 1.26%
AlphaSolutions Sector Rotation Model
 AlphaSolutions Sector Rotation Model An investment model based on trending and momentum strategies Portfolio Goals Primary: Seeks long term growth of capital by investing in highranked U.S. Equity Sectors