Presentation to Investors
|
|
|
- Dorothy Butler
- 5 years ago
- Views:
Transcription

1 Presentation to Investors Improving Lives, Transforming Nigeria THIRD QUARTER, 2018 RC
2 Disclaimer From time to time, Transnational Corporation of Nigeria Plc ( Transcorp ) and its subsidiaries ( the Group ) make written and/or oral forward-looking statements, including in this presentation and in other communications. In addition, representatives of the Group may make forward-looking statements orally to analysts, investors, the media and others. All such statements are intended to be forward looking statements. Forward looking statements include, but are not limited to, statements regarding the Group s objectives and priorities for 2018, and beyond and strategies to achieve them, and the Group s anticipated financial performance. Forward looking statements are typically identified by words such as will, should, believe, expect, anticipate, intend, estimate, may and could. By their very nature, these statements require the Group to make assumptions and are subject to inherent risks and uncertainties, general and specific. Especially in light of the uncertainty related to the financial, economic and regulatory environments, such risks and uncertainties many of which are beyond the Group s control and the effects of which are difficult to predict may cause actual results to differ materially from the expectations expressed in the forward-looking statements. Risk factors that could cause such differences include: exchange rate, market exchange, and interest rate, operational, reputational, insurance, strategic, regulatory, legal, environmental, and other risks. All such factors should be considered carefully, as well as other uncertainties and potential events, and the inherent uncertainty of forward looking statements, when making decisions with respect to the Group and we caution readers not to place undue reliance on the Group s forward looking statements. Any forward looking statements contained in this presentation represent the views of management only as of the date hereof and are presented for the purpose of assisting the Group s investors and analysts in understanding the Group s financial position, objectives and priorities and anticipated financial performance as at and for the periods ended on the dates presented, and may not be appropriate for other purposes. The Group does not undertake to update any forward-looking statements, whether written or oral, that may be made from time to time by or on its behalf, except as required under applicable securities legislation. The information used in the presentation is obtained from several sources the Group believes are reliable. Whilst Transcorp has taken all reasonable care to ensure the accuracy of the information herein, neither Transcorp nor its subsidiaries/affiliates makes representation or warranty, express or implied, as to the accuracy and correctness of the information, Thus, users are hereby advised to exercise caution in attempting to rely on these information and carry out further research before reaching conclusions regarding their investment decisions. 1

3 OVERVIEW OPERATING KEY BUSINESS FINANCIAL REVIEW OUTLOOK QUESTIONS ENVIRONMENT DRIVERS & ANSWERS APPENDIX
4 OVERVIEW
5 Overview of the Company Hotels 83% ownership Transcorp Hilton Abuja - No. 1 hotel asset in Nigeria rooms, 5 hotel Transcorp Hotels Calabar 132 room, 3 hotel Hilton Ikoyi (320 room, 5 )& Hilton PH (250 room, 5 ) under development Diversified Conglomerate with a growth agenda Power % ownership c.972mw gas fired power plant Present available capacity of 644MW Medium term capacity target of 2500MW OPL % ownership Owner/operator of OPL 281 oil block Reserve estimates Oil Mn stock tank barrel Gas Bn std cubic feet Expected production in 2019/20 4

6 OPERATING ENVIRONMENT
7 Local Economy Review Trend Quarterly GDP Growth Rate Trend 3.00% 2.00% 1.00% 0.00% -1.00% -2.00% 0.72% 1.17% 2.11% 1.95% 1.5% -0.91% Q Q Q Q Q Q Avg. Monthly External Reserves and Brent Crude Prices Sep '17 Oct '17 Nov '17 Dec '17 Jan '18 Feb '18 Mar '18 April '18 Average Monthly External Foreign Reserves May June July '18 '18 '18 Aug '18 Sep ' Brent Crude Price Gross Domestic Product The nation s economy expanded by 1.5% year on year in Q2 2018, easing from 1.9% growth in the previous period as the oil sector slowed and the nonoil sector gained. On a quarterly basis, the economy expanded by 2.9% after declining to 13.4% in the previous quarter. External Reserves The foreign exchange reserve account decreased to $44.31bn in Q3, compared to $47.6bn in Q2. Crude oil price averaged US$73/barrel in Q3 2018, moving above US$80/barrel in September, thus hitting a 4-year high. ource: National Bureau of Statistics, Central Bank of Nigeria and US Energy Information Administration 6
8 Local Economy Review Trend Inflation Rate Trend Sep '18 July '18 May '18 Mar '18 Jan '18 Nov '17 Sep ' USD-NGN Exchange Rate Trend (N) Inflation Rate Inflation continues to decline reaching 11.28% YOY in Q Food Inflation rose to 13.16% in August 2018 compared to % in Q Exchange Rate The I&E window established by CBN continues to provide liquidity and exchange rate convergence with parallel market. The CBN has begun sale of Chinese yuan to local traders and businesses. This is expected to strengthen trade activities with China and ease the long-running pressure on the naira currency. ource: National Bureau of Statistics, Central Bank CBN of Nigeria and BDC US Energy Information Administration 7

9 KEY BUSINESS DRIVERS
10 Key Trends Driving Our Business CBN policy initiatives such as the I&E window has helped liquidity of FX Improved access to FX for debt service and rehabilitation of turbines No substantial FX loss anticipated by year end based on CBN policy direction Sustained occupancy rates due to completion of more floors Stabilising foreign exchange regime Improved gas supply driving generation NBET N701bn PAP Focus on Hospitality Improved gas supply, driven by a) tactical engagement of suppliers b) infrastructural improvements by suppliers and c) improved payments to suppliers via PAP, led to generation increase The Payment Assurance Plan (PAP) window continues. TPL was paid up to 80% of 2018 invoices as guaranteed under the PAP. This is inclusive of 90% of gas invoice paid directly to suppliers Outlook is to fast track payment to current month. 9

11 FINANCIAL REVIEW
12 Result Snapshot A solid performance underpinned by sustained momentum in the growth of our businesses Group Q (YTD) Q (YTD) Change(%) Revenue % Gross Profit % INCOME STATEMENT (N billion) Other income % Operating Profit % Profit Before Tax % Profit After Tax % Total Comprehensive Income % Group Q (YTD) Q (FY) Change (%) BALANCE SHEET (N billion) Total Assets % Total Equity % Total Liabilities % 11
13 Group - Income Statement Q (YTD) Q (YTD) Variation N mn N mn % Revenue 79,861 56,757 41% Cost of Sales (42,901) (31,135) -38% Gross profit 36,960 25,622 44% Administrative expenses (11,573) (9,395) -23% Other income/expenses % Operating profit 25,929 16,810 54% Finance income % Finance cost (7,492) (7,196) -4% Foreign - exchange loss (1,621) (1,149) -41% Net finance (cost) (8,213) (7,767) -6% Profit before taxation 17,717 9,042 95% Taxation (1,754) (857) -105% Profit after taxation 15,963 8,185 95% Other comprehensive income Change in value of AFS (917) 1, % Total Comprehensive income 15,046 10,183 48% Items Revenue Cost of sales Admin. Expenses Comment Increase is driven mainly by higher generation in TPL and increase in revenue due to income from food and beverages in THP Movement is driven by increase in cost of gas to achieve increase in generation Increase is largely due to repairs and maintenance expenses 12
14 Group Balance Sheet Year to Date Item Q (YTD) FY 2017 Change NON Property, Plant and Equipment 150, ,836 6% CURRENT Other Non Current Assets 48,624 49,597-2% ASSETS (N million) Total Non Current Assets 198, ,433 4% Trade & Other Receivables 88,459 83,828 6% CURRENT Other Current Assets 11, % ASSETS Total Current Assets 99,642 94,090 6% (N million) Total Assets 298, ,522 5% CURRENT LIABILITIES (N million) NON CURRENT LIABILITIES (N million) EQUITIES (N million) Trade and other payables 73,821 64,847 14% Other current liabilities 29,945 39,809-25% Total Current Liabilities 103, , % Long term borrowings 75,337 75, % Other long term liabilities 9,569 9,569 0% Total Long Term Liabilities 84,906 85, % Total Liabilities 188, , % Total Equity 109,941 95,708 15% Net Equity and Liability 298, ,522 5% Items PPE Trade and other Receivables Trade and other payables Borrowings Comments Increase is due to the assets being added in upgrade project in THP Increase is largely due to receivables owed by NBET for sale of power in Q Increase is driven by payments due to gas suppliers at TPL and vendors for the upgrade of THP Reduced due to repayment of mature loans and bonds 13
15 Income Statement (YTD) 30,425 41,921 Revenue Trend (N Mn) 56,757 79,861 Q Q Q Q ,188 PBT Trend (N Mn) 9,042 17,717 Q Q Q Q ,783 14
16 Key Ratios Annualized ROaE Annualized ROaA 20.70% 11.65% 7.29% 4.10% Q Q ROaE Return on Average Equity Q Q ROaA Return on Average Asset Profit After Tax Margin Gross Profit Margin 46.28% 20% 14% 45.14% Q Q Q Q

17 SEGMENT REVIEW
18 Segment Review Hospitality (N million) Q (YTD) Q (YTD) Variance Revenue 12,671 9,787 29% Cost of Sales (3,347) (2,688) -25% Gross profit 9,324 7,099 31% Other Income % Operating Profit 9,459 7,223 31% OPEX (6,018) (5,719) -5% EBITDA 3,441 1, % Finance Income % PBT 3,452 1, % Items Revenue Cost of sales Comment Change is driven by increase in charges, bolstered by availability of more rooms(more completed floors being released for use) and income from food and beverages. Higher in line with increase in Revenue 17
19 Segment Review Hospitality Quarterly Revenue and PBT Trend (N Mn) Quarterly PBT Margin Trend 3, ,829 4,192 4,663 3,629 1, ,152 1,426 17% 52% 24% 27% 31% Q Q Q Q Q Revenue PBT Q Q Q Q Q Quarterly Occupancy Rate 100% 53% 73% 54% 67% 66% 66% 50% 0% Q Q Q Q Q Q
20 Segment Review Power (N million) Q (YTD) Q (YTD) Variance Revenue 67,190 46,969 43% Cost of Sales (39,533) (28,445) -39% Gross profit 27,657 18,524 49% OPEX (3,999) (2,290) -75% EBIT 23,658 16,234 46% Forex Loss (1,621) (1,149) -41% Net Finance cost (5,014) (5,648) 11% PBT 17,023 9,437 80% Items Revenue Cost of sales OPEX Comment Change is due to increase in generation as a result of significant improvement in gas supply Change is driven by increase in gas underpinning increase in Revenue Change is largely due to increase in cost that are revenue driven, as well as repairs and maintenance 19
21 Segment Review Power POSITION AS NIGERIA S TOP GENCO (MWh) JULY AUGUST SEPTEMBER EGBIN TRANSCORP SHIRORO AZURA OKPAI TRANSCORP EGBIN SHIRORO JEBBA KAINJI SHIRORO EGBIN transcorp JEBBA KAINJI 20
22 Segment Review Power Quarterly PBT Trend (N Mn) Gross Profit Margin 4,553 1,401 6,113 5,750 5,159 43% 40% 41% 40% 43% Q Q Q Q Q Q Q Q Q Q Quarterly Product Mix 64% 64% 64% 65% 65% 35% 35% 35% 34% 35% Q Q Q Q Q Capacity Charge Energy Sent Out Quarterly PBT Margin 24% 27% 24% 24% 7% Q Q Q Q Q

23 OUTLOOK
24 Q Closing Expectations Business Q3 Actual Q4 Target ADR (N) 84,275 85,000 Hospitality Occupancy 66% 70% Rev Par (N) 55,928 59,500 Power Average (MW) Available Capacity Average (MW) Generated Capacity


25 QUESTIONS

26 APPENDIX
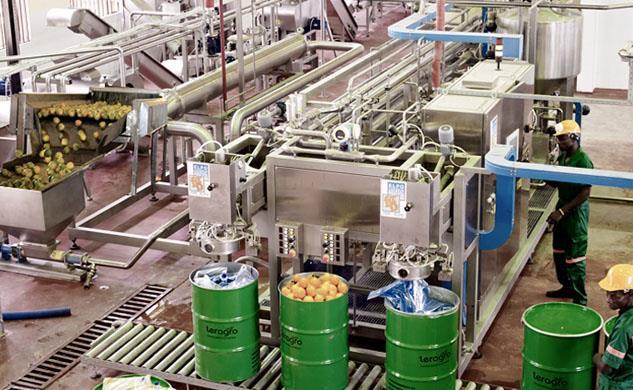
27 Our Journey So Far Transcorp was incorporated in 2004 Transcorp Ughelli Power emerges preferred bidder for Ughelli Power Plc (UPP) in 2012 Commissioning of Teragro Fruit juice concentrate plant in 2012 TPL: Achieve 2500MW Available Capacity Acquisition of NICON Hilton Hotel Abuja in 2005 Listing on the Stock Exchange in 2006 Acquisition of Metropolitan Calabar in 2009 Heirs Holdings becomes core investor 2011 Execution of management agreement with Hilton for Transcorp Hilton Ikoyi in 2013 Execution of Production Sharing Contract on OPL 281 in 2014 Management Agreement for Hilton Port Harcourt executed in 2014 Transcorp Hotels N20bn bond issuance in 2015 Commenced full Upgrade Project for Transcorp Hilton Abuja in 2016 Successful takeover of UPP in 2013 Transcorp Hotels IPO in 2014 Award as the Most Compliant Firm in Nigeria by the NSE in 2014 Merger of TUPL and UPP as Transcorp Power Ltd in 2015 Transcorp Power commissioned GT 15 a 115MW Gas Turbine in 2017 THP: Complete Transcorp Hotel Ikoyi and Portharcourt OPL 281: Production of oil and gas Expand into infrastructure development Expand into Africa PHASE ONE PHASE TWO PHASE THREE


28 Overview A Short Story of Execution We acquired the Ughelli power plant in November 2013, as part of Transcorp Plc s commitment to improve lives and transform Nigeria by powering homes, schools, public utilities and businesses. The Bureau of Public Enterprises gave us a target to increase power generation from 160MW to at least 670MW in 5 years. We surpassed this expectation 12 months ahead of schedule, generating 701MW by November, Diversified conglomerate with a growth agenda With a Purpose of Improving Lives, Transforming Nigeria Listed Company with over 300,000 shareholders Deeply rooted values are the 3Es of Execution, Enterprise and Excellence 27
29 Update on OPL 281 OPL 281 Hydrocarbons in Place Reservoir OIL MMSTB GAS BSCF Proven Prospects Total Million Stock Tank Barrels (MMSTB), * Billion Standard Cubic Feet (BSCF) Partnership Update The partnership engagement with identified new technical partner is at advanced stage. Drilling Update The Drilling permit has been revalidated by DPR. A rig has been identified for exploratory drilling of a well and engagement has advanced, subject to NAPIMS approval Following NAPIMS request, the identified rig has been rescheduled for a re-inspection. 28
30 Contact: Mutiu Bakare
Investor Presentation Improving Lives, Transforming Nigeria RC HALF YEAR, 2018
 Investor Presentation Improving Lives, Transforming Nigeria RC 611238 HALF YEAR, 2018 Disclaimer From time to time, Transnational Corporation of Nigeria Plc ( Transcorp ) and its subsidiaries ( the Group
Half Year 2014 Results Presentation. to Investors and Analysts
 Half Year 2014 Results Presentation to Investors and Analysts 1 DISCLAIMER This presentation is based on Skye Bank PLC s ( Skye Bank or the Group or the Bank ) unaudited IFRS results for the period under
Transnational Corporation of Nigeria Plc Unaudited Condensed Consolidated Financial Statements For the Period Ended 30 Sept 2018
 Unaudited Condensed Consolidated Financial Statements Statement of Financial Position As at Note Assets Non-current assets Property, plant and equipment 5 150,345,829 141,835,592 24,166 18,338 Intangible
Unaudited 2016 First Quarter Results Presentation. April 2016
 Unaudited 2016 First Quarter Results Presentation April 2016 Disclaimer and Note of Caution From time to time, the Bank makes written and/or oral forward-looking statements. These are included in this
Facts Behind the Figures
 Facts Behind the Figures PRESENTATION TO THE NIGERIA STOCK EXCHANGE May 2018 Outline 1 2 3 4 Operating Environment Our Journey Performance Highlights Milestones/Accomplishments Operating Environment %
VETIVA RESEARCH
 NIGERIA EQUITY AGRICULTURE CROP PRODUCTION OKOMUOIL Earnings Release VETIVA RESEARCH www.vetiva.com OKOMU OIL PALM COMPANY PLC Earnings remain strong despite seasonal slowdown 9M 16 PBT doubles, 24% ahead
Financial Year End Results Presentation to Investors and Analysts
 Financial Year End 2011 Results Presentation to Investors and Analysts March 2012 Disclaimer The information presented herein is based on sources which Access Bank Plc (the Bank ) regards dependable. This
FY 2012 & Q Results. May 16, 2013
 United Bank for Africa Plc FY 2012 & Q1 2013 Results Investors/Analysts Presentation May 16, 2013 Forward Looking Statements From time to time, the Bank makes written and/or oral forward-looking statements,
Second Quarter Strategic Update & Financial Results AUGUST 08, 2017
 Second Quarter Strategic Update & Financial Results AUGUST 08, Q2 FINANCIAL RESULTS Certain information in this presentation is forward-looking and related to anticipated financial performance, events
Full Year Investors/Analysts Presentation
 2017 Full Year Investors/Analysts Presentation Outline Macro-economic Review Overview of FY 2017 FY 2017 Performance Review Business Segments and Subsidiary Review Guidance and Plans for 2018 2017 Macro-economic
Transnational Corporation of Nigeria Plc Unaudited condensed consolidated interim financial For the period ended 30 September 2016
 Unaudited condensed consolidated interim financial For the period ended Statement of Financial Position As at Note Assets Non-current assets Property, plant and equipment 6 120,173,968 109,761,030 22,085
Transnational Corporation of Nigeria Plc Unaudited Condensed Consolidated Financial Statements For the Period Ended 30 September 2017
 Unaudited Condensed Consolidated Financial Statements For the Period Ended Statement of Financial Position As at Note Assets Non-current assets Property, plant and equipment 5 137,419,487 124,660,561 21,516
LAFARGE AFRICA PLC. Unaudited Quarter 2 & Half Year 2018 Results Analyst Presentation. National Theatre, Lagos, Nigeria
 LAFARGE AFRICA PLC Unaudited Quarter 2 & Half Year 2018 Results Analyst Presentation National Theatre, Lagos, Nigeria July 24th, 2018 Lekki-Ikoyi Link Bridge, Lagos, Nigeria Overview of Q2 2018 Results
Nigeria: Economic Outlook Top 10 themes for 2018
 PwC Nigeria Economics Top 10 themes for 2018 February 2018 Disclaimer This document has been prepared for general guidance on matters of interest only, and does not constitute professional advice. You
QNB Finansbank Q3 17 Earnings Presentation. October 2017
 QNB Finansbank Earnings Presentation October 2017 Banking sector growth continued in thanks to accommodative policy measures Macro Dynamics Banking Sector Dynamics 13 12 11 CBRT Rates Late liquidity O/N
UAC of Nigeria PLC H Earnings
 UAC of Nigeria PLC H1 2018 Earnings Mr Abdul Bello (Group CEO) Mrs Adeniun Taiwo (CFO) 7 August 2018 DISCLAIMER This presentation contains forward-looking statements which reflect management's expectations
ACCESS BANK PLC. Q1 15 Results Presentation to Investors & Analysts. April 2015
 ACCESS BANK PLC Q1 15 Results Presentation to Investors & Analysts April 2015 Disclaimer The information presented herein is based on sources which Access Bank Plc (the Bank ) regards dependable. This
Sterling Bank Plc. Analyst/Investor Presentation Q3 2017
 Sterling Bank Plc Analyst/Investor Presentation Q3 2017 Important Information Notice This presentation has been prepared by Sterling Bank PLC. It is intended for an audience of professional and institutional
2017 FULL YEAR RESULTS PRESENTATION TO INVESTORS & ANALYSTS
 2017 FULL YEAR RESULTS PRESENTATION TO INVESTORS & ANALYSTS OUTLINE Section Page 1. Africa Prudential Overview 02 2. Domestic Operating Environment 08 3. Financial Overview 11 4. 2018 Outlook 17 5. Appendix
Sterling Bank PLC H Investor/Creditor Presentation. July 2011
 Sterling Bank PLC H1 2011 Investor/Creditor Presentation July 2011 Important Information Investor Relations This presentation has been prepared by Sterling Bank PLC. It is intended for an audience of professional
Transnational Corporation of Nigeria Plc Unaudited Condensed Consolidated Financial Statements For the Period Ended 30 June 2017
 Unaudited Condensed Consolidated Financial Statements For the Period Ended Statement of Financial Position As at Note Assets Non-current assets Property, plant and equipment 5 134,541,374 124,660,561 15,880
Global Markets Group. Trade Performance: Depressed by the Eid holiday Author: Juniman Chief Economist. Economic Research. Trade Outlook Monthly Report
 Global Markets Group Trade Outlook Monthly Report Economic Research August 2016 Trade Performance: Depressed by the Eid holiday Author: Juniman Chief Economist Trade Highlights Exports in June 2016 rose
Sterling Bank Plc. Analyst/Investor Presentation FY 2014 & Q1 2015
 Sterling Bank Plc Analyst/Investor Presentation FY 2014 & Q1 2015 1 Important Information Notice This presentation has been prepared by Sterling Bank PLC. It is intended for an audience of professional
06 July 2007 Flash Comment
 06 July 2007 Flash Comment CR Power (0836.HK) Acquisition of Jinzhou Power Plant Expected Return Rating : Reduce Price (05/07/07) : HK$19.50 Target Price : HK$16.66 Expected Capital Gain : -14.6% Expected
Global Markets Group. Trade Performance: Narrowing Surplus Author: Juniman Chief Economist. Economic Research. Trade Outlook Monthly Report
 Global Markets Group Trade Outlook Monthly Report Economic Research November 2016 Trade Performance: Narrowing Surplus Author: Juniman Chief Economist Trade Highlights Exports in September 2016 fell to
FY16 YEAR END RESULTS 5 APRIL 2016
 FY16 YEAR END RESULTS 5 APRIL 2016 DEFINITIONS AND IMPORTANT NOTICE The following definitions apply throughout Trading EBITDA (earnings before interest, tax, depreciation and amortisation): excludes exceptional
China GDP grows 6.8% in Q4 2016
 Thomas Shik Acting Chief Economist thomasshik@hangseng.com The 2017 Outlook The mainland China economy expanded by an annual rate of 6.8% in the fourth quarter of 2016, up from 6.7% in the third quarter,
Partnership Investment Company Limited: Offer by Private Placement
 Equity Research Other Financial Services Nigeria Partnership Investment Company Limited: Offer by Private Placement Idowu Ogedengbe Idowu.ogedengbe@ubagroup.com Tola Odukoya Adetola.odukoya@ubagroup.com
CorpBanca. First Quarter 2015 Financial Results
 CorpBanca First Quarter 2015 Financial Results Disclaimer 2 This Presentation contains forward-looking statements, including statements related to the planned acquisition of Helm Bank and the timing thereof.
Financial Industry Solutions. Second Quarter Financial Results AUGUST 9, 2018
 Financial Industry Solutions Second Quarter Financial Results AUGUST 9, Disclaimer Certain information in this presentation is forward-looking and related to anticipated financial performance, events and
NIGERIA S ECONOMIC OVERVIEW
 NIGERIA S ECONOMIC OVERVIEW Presented at the Plenary Session of UK-Nigeria Trade & Investment Forum By Senator Udoma Udo Udoma, CON Honourable Minister Ministry of Budget and National Planning 17 th April,2018
2015 Unaudited Nine Months Results Management Presentation
 2015 Unaudited Nine Months Results Management Presentation Disclaimer and Note of Caution From time to time, the Bank makes written and/or oral forward-looking statements. These are included in this presentation
2015 Full Year Investors/Analysts Presentation
 2015 Full Year Investors/Analysts Presentation 1 OUTLINE 1. Macro-economic Review 2. 3. 4. 5. Overview of 2015 FY 2015 Performance Review Business Segments and Subsidiary Review 2016 Guidance and Plans
Quarterly Meeting # 2/2015
 Quarterly Meeting # 2/2015 1Q15 Performance & Outlook 18 May 2015 The views expressed here contain some information derived from publicly available sources that have not been independently verified. No
Market Access. M&A Securities. Results Review (2Q16) SapuraKencana Petroleum Berhad. Solid Orderbook as a Shield BUY (TP: RM2.
 SapuraKencana Petroleum Berhad. Solid Orderbook as a Shield BUY (TP: RM2.") M&A Securities Results Review (2Q16) PP14767/09/2012(030761) SapuraKencana Petroleum Berhad Thursday, September 17, 2015 BUY (TP: RM2.55) Solid Orderbook as a Shield Results Review Actual vs. expectations.
M&A Securities Results Review (2Q16) PP14767/09/2012(030761) SapuraKencana Petroleum Berhad Thursday, September 17, 2015 BUY (TP: RM2.55) Solid Orderbook as a Shield Results Review Actual vs. expectations.
PT Ultrajaya Milk Industry & Trading Company Tbk. FY 2013 results update
 PT Ultrajaya Milk Industry & Trading Company Tbk. FY 2013 results update April 2014 0 Disclaimer These materials are not intended to be a public offering document under Law of the Republic of Indonesia
Outline: Skye Bank Overview. Business Environment. Financial Highlights. Risk Management. Strategic Outlook
 = Disclaimer This presentation may contain certain forward-looking statements, estimates and targets with respect to the operating results, financial condition and business of Skye Bank. Such statements
Gulf Keystone Petroleum
 Gulf Keystone Petroleum 13 July 2018 Annual General Meeting Amsterdam Disclaimer This proprietary presentation (the Presentation ) has been prepared by Gulf Keystone Petroleum Limited (the Company ). Under
INVESTING FBN NIGERIA EUROBOND (USD) FUND
 FUND") Earn returns in US Dollars INVESTING FBN NIGERIA EUROBOND (USD) FUND A MUTUAL FUND EXPLAINED A mutual fund is an investment solution that allows individuals invest in different asset classes such as treasury
Earn returns in US Dollars INVESTING FBN NIGERIA EUROBOND (USD) FUND A MUTUAL FUND EXPLAINED A mutual fund is an investment solution that allows individuals invest in different asset classes such as treasury
Q Results presentation
 Q1 2016 Results presentation 12 May 2016 1 Disclaimer This presentation (the "Presentation") has been prepared and is issued by, and is the sole responsibility of Telepizza Group, S.A. ( Telepizza" or
Outline. 9 Months 2018 Key Highlights 04. Financial Review 11. Risk Management 17. Business Group Performance 22. Appendix 27
 Disclaimer This presentation is based on FBN Holdings Plc s ( FBNH or FBNHoldings or the Group ) unaudited results for the nine months ended 30 September, 2018. The Group s Financial statements have been
FLOUR MILLS OF NIGERIA PLC
 Feb-14 Mar-14 Apr-14 May-14 Jun-14 Jul-14 Aug-14 Sep-14 Oct-14 Nov-14 Dec-14 Jan-15 NSE: FLOURMILL l Bloomberg: FLOURMIL NL Usual Double Digits Trajectory Eludes Flour Mills of Nigeria reversed the previous
Financial Results for FY2017 and Strategy
 Financial Results for FY2017 and Strategy Recruit Holdings Co., Ltd. Masumi Minegishi President, CEO, and Representative Director Keiichi Sagawa CFO and Senior Managing Corporate Executive Officer May
Nigeria Equities Financial Services August 23,
 Guaranty Trust Bank Plc Nigeria Equities Financial Services August 23, 2018 Result Meets Expectation as Non-Interest Income Lifts Earnings INVESTMENT SUMMARY In line with our projection, the H1 18 audited
VETIVA RESEARCH SELL. GUINNESS NIGERIA PLC Q3 sales hit 6 year low. Equity Research 25 April 2016
 NIGERIA EQUITY CONSUMER GOODS BEVERAGES-BREWERS/DISTILLERS GUINNESS Earnings Release VETIVA RESEARCH GUINNESS NIGERIA PLC Q3 sales hit 6 year low Volume shock cuts Q3 sales to lowest since 2008 Reports
Unipro PJSC 2016 Full year results
 Unipro PJSC 2016 Full year results 16 March 2017 2016 results stable operating earnings hit by a one off effect EBITDA 1,2 EBIT 1,2 Highlights 24.9bn 17.7bn 12M 2015 12M 2016 17.4bn 12M 2015 11.0bn 12M
T R U S T F U N D P E N S I O N S P L C
 MARKET AND ECONOMIC COMMENTARY NOVEMBER 31, 2014 T R U S T F U N D P E N S I O N S P L C Investment Research MACROS EQUITIES BONDS MONEY MARKET ALTERNATIVE INVESTMENTS Outline Key Macro Variables Growth
ACCESS BANK RIGHTS ISSUE
 Jan-14 Feb-14 Mar-14 Apr-14 May-14 Jun-14 Jul-14 Aug-14 Sep-14 Oct-14 Nov-14 Dec-14 Primary Market Watch Capitalising to push strategic growth plan Capital is key to achieving medium term strategic plan:
Table 1 Key macro indicators. Source: SAMA, * Provisional
 Saudi Arabian economy Research Department ARC Research Team Tel 966 11 211 9370, research@alrajhi-capital.com Saudi Arabian Economy The Kingdom maintained oil output at an elevated level (~10.3mbpd in
SEVEN-UP BOTTLING COMPANY PLC
 Nov-13 Dec-13 Jan-14 Feb-14 Mar-14 Apr-14 May-14 Jun-14 Jul-14 Aug-14 Sep-14 Oct-14 SEVEN-UP BOTTLING COMPANY PLC NSE: 7UP l Bloomberg 7UP NL 2015H1 EARNINGS UPDATE Strong with Enviable Performance though
FIXED INCOME UPDATE AUGUST 17
 1 FIXED INCOME UPDATE AUGUST 17 Aug-16 Aug-16 Sep-16 Sep-16 Oct-16 Oct-16 Nov-16 Nov-16 Dec-16 Dec-16 Jan-17 Jan-17 Feb-17 Feb-17 Mar-17 Mar-17 Apr-17 Apr-17 May-17 May-17 Jun-17 Jun-17 Jul-17 Jul-17 Aug-17
Corral Q August 2017
 Corral Q2 2017 August 2017 Disclaimer This presentation has been prepared by Corral Petroleum Holdings AB (publ) and/or its subsidiaries and affiliates ( Corral ). The information contained in this presentation
Disclaimer 2017 ACCESS BANK PLC H1 17 RESULTS PRESENTATION TO INVESTORS & ANALYSTS 2
 Disclaimer The information presented herein is based on sources which Access Bank Plc. (the Bank ) regards dependable. This presentation may contain forward looking statements. These statements concern
H Results Presentation
 Results Presentation WABERER S INTERNATIONAL Nyrt. Budapest, August 14, Forward-looking statements This presentation may contain forward-looking statements. Statements that are not historical facts, including
Trustfund Pensions Plc
 Trustfund Pensions Plc H1 Performance Report Update on the Economies, Markets and Portfolio Performance... Global Economy...Nigeria...Trustfund Pensions Plc Investment Department June 2016 Global Economy
Dangote Cement Plc. Higher Volume, Improved Pricing and Exchange Rate Benefit Impact Earnings. Nigeria Equities Industrial Goods May 18, 2018
 Dangote Cement Plc Nigeria Equities Industrial Goods May 18, 2018 Higher Volume, Improved Pricing and Exchange Rate Benefit Impact Earnings INVESTMENT SUMMARY Dangote Cement Plc reported another impressive
Macro-economic & Market Trends
 November Investor Relations This presentation has been prepared by Sterling Bank PLC. It is intended for an audience of professional and institutional investors who are aware of the risks of investing
Saudi Arabian Economy
 Saudi Arabian Economy Research Department ARC Research Team, Tel. +966 11 211 9370, devassyp@alrajhi-capital.com Saudi Arabian economy continued to expand in Q3 Saudi Arabian economy has continued to expand
Historical Pricing PJM COMED, Around the Clock. Cal '15 Cal '16 Cal '17 Cal '18 Cal '19 Cal '20 Cal '21 Cal '22
 $50 Historical Pricing PJM COMED, Around the Clock $48 $46 $44 $42 $40 $38 $36 $34 $32 $30 $28 $26 Cal '15 Cal '16 Cal '17 Cal '18 Cal '19 Cal '20 Cal '21 Cal '22 The information presented above was gathered
H1 16 interim results. 22 September 2015
 H1 16 interim results 22 September 2015 Important notice 2 This presentation may include certain forward-looking statements, beliefs or opinions, including statements with respect to the Company s business,
2016 HALF YEAR RESULTS Presentation to Analysts and Investors. July 2016
 2016 HALF YEAR RESULTS Presentation to Analysts and Investors July 2016 1 section page 1 Business and Operating Highlights 3 2 H1 Financial performance 8 3 Outlook & Strategy 19 2 H1 2016 HIGHLIGHTS Continued
2016 1Q Results. May 2016
 216 1Q Results May 216 Agenda 1. Financials 2. Refinery Division 3. Olefins Division 4. Plant Operation 5.Expansion 2 Financial Status (NTD) Category Units 2154Q 2161Q QoQ 2151Q YoY Revenue Mn 15,296 124,471-17%
Results 2Q18. August 2, 2018
 Results August 2, 2018 Highlights Indicators Var. x 2Q17 Operating Income (R$ MM) 42.8 +92.7% Operating Margin 1.8% +0.8 p.p. Net operating revenues: R$2.4 billion (+9.0% vs. 2Q17) ASK (BN) 10.7 +2.2%
Near-term pressure, but long-term outlook positive
 INDUSTRY IT CMP (as on 2 Nov 2015) Rs 1,812 Target Price Rs 2,050 Nifty 8,051 Sensex 26,559 KEY STOCK DATA Bloomberg ECLX IN No. of Shares (mn) 30 MCap (Rs bn) / ($ mn) 55/843 6m avg traded value (Rs mn)
Fixed Income Monthly Report
 Fixed Income Monthly Report Prepared by Lead Asset Management Limited 01/10/2018 CONTENTS GLOBAL DEVELOPMENTS Global Bond Yields Oil Prices MONTHLY ECONOMIC AND MARKET REVIEW June 2008 DOMESTIC UPDATES
G u a r a n t y T r u s t B a n k p l c A u g u s t
 2018 Half Year Investors/Analysts Presentation G u a r a n t y T r u s t B a n k p l c A u g u s t 2 0 1 8 Outline OUTLINE 01 02 03 04 05 Macro-economic Review Overview of HY 2018 HY 2018 Performance Review
HALF YEAR INVESTORS & ANALYSTS PRESENTATION. July 2018
 2018 HALF YEAR INVESTORS & ANALYSTS PRESENTATION July 2018 2 Important Information This presentation has been prepared by Sterling Bank PLC. It is intended for an audience of professional and institutional
Group Results Presentation for the six months ended 31 March 2016
 Group Results Presentation for the six months ended 31 March 2016 Index Overview Financial performance Operational performance Outlook 2 Overview Noel Doyle Chief Operating Officer Disclaimer Forward-looking
INEOS STYROLUTION. Q1/ 2018 Investor Earnings Call
 INEOS STYROLUTION Q1/ 2018 Investor Earnings Call Disclaimer The following presentation includes forward-looking statements, within the meaning of the US securities laws, based on our current expectations
BUY Target Price, Rp 4,350 Upside 11,9%
 Friday, 9 May 214 BUY Target Price, Rp 4,350 Upside 11,9% SMSM IJ/SMSM.JK Last Price, Rp 3,885 No. of shares (bn) 1,439 Market Cap, Rp bn 5,591 (US$ mn) 484 3M T/O, US$mn 0.2 Last Recommendation 09Jan14
Interim Results Presentation. For the six months ended 31 December 2018
 Interim Results Presentation For the six months ended 31 December 2018 1 STEEL & TUBE IS One of New Zealand s leading providers of steel solutions, and a proud New Zealand company, with over 65 years of
Marico Kaya BUY RESULTS REVIEW 4QFY15 29 APR 2015
 RESULTS REVIEW 4QFY15 29 APR 2015 Marico Kaya INDUSTRY FMCG CMP (as on 28 Apr 2015) Rs 1,635 Target Price Rs 1,823 Nifty 8,240 Sensex 27,226 KEY STOCK DATA Bloomberg MAKA IN No. of Shares (mn) 13 MCap
2017 1Q Results. May 2017
 217 1Q Results May 217 Agenda 1. Financials 2. Market Fundamental 3. Industry Outlook 4. Plant Operation 5.Expansion 2 Financial Status (Unit: NTD Million) 4Q16 1Q17 QoQ 1Q16 YoY Revenues 152,287 164,486
Looking to the medium term
 Looking to the medium term Issued: 4 September 2013 Legal notice This presentation has been prepared to inform investors and prospective investors in the secondary markets about the Group and does not
Historical Pricing PJM PSEG, Around the Clock. Cal '15 Cal '16 Cal '17 Cal '18 Cal '19 Cal '20 Cal '21 Cal '22
 $70 Historical Pricing PJM PSEG, Around the Clock $65 $60 $55 $50 $45 $40 $35 $30 $25 Cal '15 Cal '16 Cal '17 Cal '18 Cal '19 Cal '20 Cal '21 Cal '22 The information presented above was gathered and compiled
FY 2015 Group Results. Presentation to Investors & Analysts. December 2015 ZENITH BANK PLC
 FY 2015 Group Results Presentation to Investors & Analysts December 2015 ZENITH BANK PLC Disclaimer This presentation is based on the consolidated financial statements of Zenith Bank Plc, a company incorporated
Saudi Arabian Economy
 Saudi Arabian Economy Economic Research Research Department ARC Research Team Tel. +966 11 211 937, research@alrajhi-capital.com Saudi Arabia: Preliminary Govt. estimates for 219 budget point to expansionary
KCB INVESTOR AND MEDIA PRESENTATION 2012 FULL YEAR GROUP AUDITED FINANCIAL RESULTS
 KCB INVESTOR AND MEDIA PRESENTATION 2012 FULL YEAR GROUP AUDITED FINANCIAL RESULTS 1 Outline 1. East Africa Macroeconomic View 2. The Bank at a Glance 3. 2012 full year KCB group Financial Results 4. Future
UAC of Nigeria Plc FY 2018 Results. Fola Aiyesimoju Group MD / CEO Ibikunle Oriola Group Finance Director
 UAC of Nigeria Plc FY Results Fola Aiyesimoju Group MD / CEO Ibikunle Oriola Group Finance Director Disclaimer 2 This presentation contains forward-looking statements which reflect management's expectations
Saudi Arabian Economy
 Saudi Arabian Economy Economic Research Research Department ARC ResearchTeam, Tel. +966 1 211 9370, devassyp@alrajhi-capital.com IMF hikes Saudi Arabia s 2018 growth forecast The IMF raised Saudi Arabia
Financial Data Report CIEL LTD (THE GROUP) for the period ending 31.Dec.2017
 for the period ending 31.Dec.2017") Financial Data Report CIEL LTD (THE GROUP) for the period ending 31.Dec.2017 Equity Statistics Particulars Units 29-Dec-17 Current Market Price MUR 7.14 52 week H/L* MUR 7.94 / 6.26 Market Capitalisation
Financial Data Report CIEL LTD (THE GROUP) for the period ending 31.Dec.2017 Equity Statistics Particulars Units 29-Dec-17 Current Market Price MUR 7.14 52 week H/L* MUR 7.94 / 6.26 Market Capitalisation
China Recovery pace is moderating in Q2
 Dec- Jun-11 Dec-11 Jun-12 Dec-12 Jun-13 Dec-13 Jun-14 Dec-14 Jun-1 17 May 21 ECONOMIC ACTIVITY PULSE China Recovery pace is moderating in Q2 Jinyue Dong Le Xia Gonzalo de Cadenas Economic activity indicators
2017 Results Presentation.
 2017 Results Presentation www.moelisaustralia.com 20 February 2018 Moelis Australia Overview Moelis Australia is a leading diversified financial services group incorporating Corporate Advisory, Equities
Fixed Income Investing in a Low Yield World: High Yield Bonds Still Part of the Solution. Fall 2012
 Fixed Income Investing in a Low Yield World: High Yield Bonds Still Part of the Solution Fall 2012 U.S. 10-Year Treasury Yields October 5, 2012 16 14 12 10 8 6 4 2 1.74% 0 Jan-82 Feb-86 Mar-90 May-94 Jun-98
FINANCIAL RESULTS PRESENTATION 1H2017
 FINANCIAL RESULTS PRESENTATION 1H2017 Disclaimer These preliminary materials and any accompanying oral presentation (together, the Materials ) have been prepared by MYTILINEOS Holdings SA (the Company
Inflation Outlook and Monetary Easing
 Thomas Shik Acting Chief Economist thomasshik@hangseng.com Inflation Outlook and Monetary Easing Although annual consumer price inflation rose for a second consecutive month in July, the underlying trend
Turkey s Largest Food Company
 Turkey s Largest Food Company F i r s t H a l f 2017 F i n a n c i a l R e s u l t s A u g 16, 2 0 1 7 Borsa Istanbul: ULKER ULKER.TI (Bloomberg) ULKER IS (Reuters) www.ulkerbiskuvi.com.tr Disclaimer This
Interbank and Parallel M
 ECONOMIC REVIEW Interbank and Parallel M MARKET REVIEW According to the International Monetary Fund ( IMF ), the global economy is expected to grow by 3.7 and 3.8 in 2017 and 2018 respectively. The increased
Financial Data Report LOTTOTECH LIMITED. for the period ending 30.Jun.2018
 Financial Data Report LOTTOTECH LIMITED for the period ending 30.Jun.2018 Equity Statistics Particulars Units 29-Jun-18 Current Market Price MUR 9.72 52 week H/L* MUR 9.88 / 5.66 Market Capitalisation
Financial Data Report LOTTOTECH LIMITED. for the period ending 30.Jun.2017
 Financial Data Report LOTTOTECH LIMITED for the period ending 30.Jun.2017 Equity Statistics Particulars Units 31-Jul-17 Current Market Price MUR 5.90 52 week H/L* MUR 6.50 / 4.02 Market Capitalisation
Financial Data Report LOTTOTECH LIMITED. for the period ending 31.Dec.2017
 Financial Data Report LOTTOTECH LIMITED for the period ending 31.Dec.2017 Equity Statistics Particulars Units 29-Dec-17 Current Market Price MUR 7.30 52 week H/L* MUR 9.12 / 5.28 Market Capitalisation
Key estimate revision. Financial summary. Year
 : price: EPS: How does our one year outlook change? We retain our positive outlook on WIL and believe that revival in MHCV industry, increasing content per vehicle and opportunity in exports would drive
Grupo Supervielle 2Q16 Earnings Conference Call
 Grupo Supervielle 2Q16 Earnings Conference Call Disclaimer This presentation contains certain forward-looking statements that reflect the current views and/or expectations of Grupo Supervielle and its
INVESTING FBN NIGERIA SMART BETA EQUITY FUND
 INVESTING FBN NIGERIA SMART BETA EQUITY FUND Unlock opportunity. Create wealth. A MUTUAL FUND EXPLAINED A mutual fund is an investment solution that allows individuals to invest in different asset classes
Financial Data Report SUN LIMITED (THE GROUP) for the period ending 31.Mar.2017
 for the period ending 31.Mar.2017") Financial Data Report SUN LIMITED (THE GROUP) for the period ending 31.Mar.2017 Equity Statistics Particulars Units 31-Mar-17 Current Market Price MUR 40.00 52 week H/L* MUR 40.00 / 32.80 Market Capitalisation
Financial Data Report SUN LIMITED (THE GROUP) for the period ending 31.Mar.2017 Equity Statistics Particulars Units 31-Mar-17 Current Market Price MUR 40.00 52 week H/L* MUR 40.00 / 32.80 Market Capitalisation
TGC-1 9M 2016 IFRS Results. November 21, 2016 Saint Petersburg
 TGC-1 9M 2016 IFRS Results November 21, 2016 Saint Petersburg Disclaimer The information contained herein has been prepared using information available to Public Joint Stock Company Territorial generating
Click to edit Master title style 2013 MARKET OUTLOOK. Presented by. Oscar N. Onyema CEO. January 17, 2013
 Click to edit Master title style 2013 MARKET OUTLOOK Presented by Oscar N. Onyema CEO January 17, 2013 Click Outline to edit Master title style Summary 2012 Market Review Macro Economic Performance Capital
Investor/Analyst Presentation FY 2015
 Investor/Analyst Presentation FY 2015 1 Agenda 1. Overview 2. Operating environment 3. Funding and liquidity 4. Credit risk and asset quality 5. Profitability and capital 6. Outlook 2 Overview Overview
Nigeria Economic Update QNB Group. September 2014
 Nigeria Economic Update QNB Group September 21 Nigeria Overview A rebasing of GDP in 213 has made Nigeria the biggest economy in Africa with the largest population; the economy is growing rapidly but remains
NATIONAL ALUMINIUM COMPANY LTD RESEARCH
 RESULTS REVIEW Share Data Market Cap Rs. 234.4 bn Price Rs. 363.80 BSE Sensex 16,886.43 Reuters Bloomberg Avg. Volume (52 Week) NALU.BO NACL IN 0.1 mn 52-Week High/Low Rs. 425/108.35 Shares Outstanding