SAN MIGUEL BREWERY INC. A subsidiary of San Miguel Corporation
|
|
|
- Milo Terry
- 5 years ago
- Views:
Transcription

1 SAN MIGUEL BREWERY INC. A subsidiary of San Miguel Corporation August 15, 2011 Philippine Stock Exchange Inc. Disclosure Department 3 rd Floor, Philippine Stock Exchange Center Ayala Triangle, Ayala Avenue Makati City ATTENTION: MS. JANET A. ENCARNACION HeadDisclosure Department Gentlemen: We submit herewith the attached quarterly report (SEC Form 17Q) of the Company for the period June 30, 2011.

2

3

4

5

6
7

8

9
10
11
12 SAN MIGUEL BREWERY INC. AND SUBSIDIARIES SELECTED NOTES TO FINANCIAL STATEMENTS (Amounts in Millions, Except Per Share Data) 1. Summary of Significant Accounting and Financial Reporting Policies The Group prepared its consolidated interim financial statements as of and for the period ended June 30, 2011 and comparative financial statements for the same period in 2010 following the new presentation rules under Philippine Accounting Standard (PAS) No. 34, Interim Financial Reporting. The consolidated financial statements of the Group have been prepared in compliance with Philippine Financial Reporting Standards (PFRS). The consolidated financial statements are presented in Philippine peso and all values are rounded to the nearest million (P=000,000), except when otherwise indicated. The principal accounting policies and methods adopted in preparing the interim consolidated financial statements of the Group are the same as those followed in the most recent audited annual financial statements. Adoption of New Standards, Amendments to Standards and Interpretations The Financial Reporting Standards Council (FRSC) approved the adoption of a number of new or revised standards, amendments to standards, and interpretations (based on International Financial Reporting Interpretation Committee (IFRIC) Interpretations) as part of PFRS. Amendments to Standard and Interpretations Adopted in 2011 Starting January 1, 2011, the Group adopted the following PFRS: Amendment to PAS 32, Financial Instruments: Presentation Classification of Rights Issues, permits rights, options or warrants to acquire a fixed number of the entity s own equity instruments for a fixed amount of any currency to be classified as equity instruments provided the entity offers the rights, options or warrants pro rata to all of its existing owners of the same class of its own nonderivative equity instruments. The amendment is effective for annual periods beginning on or after February 1, Revised PAS 24, Related Party Disclosures (2009), amends the definition of a related party and modifies certain related party disclosure requirements for governmentrelated entities. The revised standard is effective for annual periods beginning on or after January 1, Prepayments of a Minimum Funding Requirement (Amendments to Philippine Interpretation IFRIC 14: PAS 19 The Limit on a Defined Benefit Asset, Minimum Funding Requirements and their Interaction). These amendments remove unintended consequences arising from the treatment of prepayments where there is a minimum funding requirement and result in prepayments of contributions in certain circumstances being recognized as an asset rather than an expense. The amendments are effective for annual periods beginning on or after January 1, Improvements to PFRSs 2010 contain 11 amendments to 6 standards and 1 interpretation, of which only the following are applicable to the Group. PFRS 3, Business Combinations. The amendments (i) clarify that contingent consideration arising in a business combination previously accounted for in accordance with PFRS 3 (2004) that remains outstanding at the adoption date of PFRS 3 (2008) continues to be 1
13 accounted for in accordance with PFRS 3 (2004); (ii) limit the accounting policy choice to measure noncontrolling interests upon initial recognition at fair value or at the noncontrolling interest s proportionate share of the acquiree s identifiable net assets to instruments that give rise to a present ownership interest and that currently entitle the holder to a share of net assets in the event of liquidation; and (iii) expand the current guidance on the attribution of the marketbased measure of an acquirer s sharebased payment awards issued in exchange for acquiree awards between consideration transferred and postcombination compensation cost when an acquirer is obliged to replace the acquiree s existing awards to encompass voluntarily replaced unexpired acquiree awards. These amendments are effective for annual periods beginning on or after July 1, PAS 27, Consolidated and Separate Financial Statements. The amendments clarify that the consequential amendments to PAS 21 The Effects of Changes in Foreign Exchange Rates, PAS 28, Investments in Associates, and PAS 31, Interests in Joint Ventures, resulting from PAS 27 (2008) should be applied prospectively, with the exception of amendments resulting from renumbering. The amendments are effective for annual periods beginning on or after July 1, PFRS 7, Financial Instruments: Disclosures. The amendments add an explicit statement that qualitative disclosure should be made in the context of the quantitative disclosures to better enable users to evaluate an entity s exposure to risks arising from financial instruments. In addition, the IASB amended and removed existing disclosure requirements. The amendments are effective for annual periods beginning on or after January 1, PAS 1, Presentation of Financial Statements. The amendments clarify that disaggregation of changes in each component of equity arising from transactions recognized in other comprehensive income also is required to be presented, either in the statement of changes in equity or in the notes. The amendments are effective for annual periods beginning on or after January 1, PAS 34, Interim Financial Reporting. The amendments add examples to the list of events or transactions that require disclosure under PAS 34 and remove references to materiality in PAS 34 that describes other minimum disclosures. The amendments are effective for annual periods beginning on or after January 1, The adoption of these foregoing new or revised standards, amendments to standards and Philippine Interpretation of IFRIC did not have a material effect on the interim consolidated financial statements. New or Revised Standards, Amendments to Standards and Interpretations Not Yet Adopted The Group will adopt the following new or revised standards, amendments to standards and interpretations in the respective effective dates: Disclosures Transfers of Financial Assets (Amendments to PFRS 7), require additional disclosures about transfers of financial assets. The amendments require disclosure of information that enables users of financial statements to understand the relationship between transferred financial assets that are not derecognized in their entirety and the associated liabilities and to evaluate the nature of, and risks associated with, the entity s continuing involvement in derecognized financial assets. Entitites are required to apply the amendments for annual periods beginning on or after July 1,
14 Deferred Tax: Recovery of Underlying Assets (Amendments to PAS 12, Income Taxes) introduces an exception to the current measurement principles of deferred tax assets and liabilities arising from investment property measured using the fair value model in accordance with PAS 40, Investment Property. The exception also applies to investment properties acquired in a business combination accounted for in accordance with PFRS 3 provided the acquirer subsequently measure these assets applying the fair value model. The amendments integrated the guidance of Philippine Interpretation Standards Interpretation Committee (SIC) 21, Income Taxes Recovery of Revalued NonDepreciable Assets into PAS 12, and as a result Philippine Interpretation SIC 21 has been withdrawn. The effective date of the amendments is for periods beginning on or after January 1, 2012 and is applied retrospectively. The Group will assess the impact of the new or revised standards, amendments to standards and interpretations on the consolidated financial statements upon adoption on their respective effective dates. PFRS 9, Financial Instruments (2009) was issued as the first phase of the PAS 39 replacement project. The chapters of the standard released in 2009 only related to the classification and measurement of financial assets. PFRS 9 (2009) retains but simplifies the mixed measurement model and establishes two primary measurement categories for financial assets: amortized cost and fair value. The basis of classification depends on the entity s business model and contractual cash flow characteristics of the financial asset. In October 2010, a new version of PFRS 9, Financial Instruments (2010) was issued which now includes all the requirements of PFRS 9 (2009) without amendment. The new version of PFRS 9 also incorporates requirements with respect to the classification and measurement of financial liabilities and the derecognition of financial assets and financial liabilities. The guidance in PAS 39 on impairment of financial assets and hedge accounting continues to apply. The new standard is effective for annual periods beginning on or after January 1, PFRS 9 (2010) supersedes PFRS 9 (2009). However, for annual periods beginning before January 1, 2013, an entity may elect to apply PFRS 9 (2009) rather than PFRS 9 (2010). The Group is still assessing the impact of the adoption of PFRS 9 (2009) or PFRS 9 (2010) on the consolidated financial statements and therefore, the interim consolidated financial statements do not reflect the impact of the new standard. The Group is evaluating whether it will opt for the early adoption of PFRS 9 (2009) or PFRS 9 (2010) in its consolidated financial statements which will result in a change in the classification and measurement of the Group s financial assets and liabilities. 2. Segment Information Operating Segments The reporting format of the Group s operating segments is determined by the Group s risks and rates of return which are affected predominantly by differences in the products and services produced. The operating businesses are organized and managed separately according to geographic location, with each segment representing a strategic business unit that offers different products and serves different markets. With the acquisition of San Miguel Brewing International Limited (SMBIL), the Group is organized in two major business segments domestic and international operations. The domestic operations produce fermented and maltbased beverages within the Philippines and market the same within the country and to some export markets. 3
15 The international operations also produce fermented and maltbased beverages in five foreign countries and market the same in several foreign markets. It also imports beer products for distribution in the Hong Kong market. Intersegment Transactions Segment revenues, expenses and performance include sales and purchases between operating segments. Transfer prices between operating segments are set on an arm s length basis in a manner similar to transactions with third parties. Such transfers are eliminated in consolidation. Financial information about business segments follow: For the Period Ended June 30, 2011 Domestic International Eliminations Consolidated Sales External sales P=29,309 P=6,284 P= P=35,593 Intersegment sales 9 ( 9) Total Sales P=29,318 P=6,284 (P= 9) P=35,593 Results Segment Results P= 10,093 P= 151 P= P= 10,244 For the Period Ended June 30, 2010 Domestic International Eliminations Consolidated Sales External sales P=27,644 P=5,684 P= P=33,328 Intersegment sales 25 ( 25) Total Sales P=27,669 P=5,684 (P= 25) P=33,328 Results Segment Results P= 9,376 P= 81 P= P= 9, Related Party Transactions The following transactions and related account balances with San Miguel Corporation (SMC) and its subsidiaries were entered into at normal market prices. San Miguel Corporation June 2011 Dec San Miguel Yamamura Packaging June 2011 Corporation Dec San Miguel Paper Packaging Corporation June 2011 Dec SMC Shipping and Lighterage June 2011 Corporation Dec SMITS, Inc. and subsidiary June 2011 Dec San Miguel Yamamura Asia Corporation June 2011 Dec Sales to Related Parties P Purchases from Related Parties P 643 1,806 1,042 2, Amounts Owed by Related Parties P Amounts Owed to Related Parties P Forward 4
16 Ginebra San Miguel, Inc. and subsidiaries June 2011 Dec San Miguel International Limited and June 2011 subsidiaries Dec San Miguel Pure Foods Company, Inc. June 2011 and subsidiaries Dec Petron Corporation and subsidiaries June 2011 Dec San Miguel Properties, Inc. June 2011 Dec Others June 2011 Dec Sales to Related Parties Purchases from Related Parties Amounts Owed by Related Parties Amounts Owed to Related Parties Property, Plant and Equipment Property, plant and equipment consist of: Balance, December 31, 2010 Disposals and Reclassifications Currency Translation Adjustments Balance, June 30, 2011 June 30, 2011 Additions Cost: Land P= 8,120 P= P= P= (30) P= 8,090 Buildings and improvements 11, (4) 11,414 Machinery and equipment 35, ,820 Transportation equipment (26) Tools and small equipment (28) (1) 114 Office equipment, furniture and fixtures (11) 712 Leasehold improvements Construction in progress (251) (1) ,215 1,040 (305) (4) 57,946 Accumulated depreciation and amortization: Buildings and improvements 3, (4) (8) 3,772 Machinery and equipment 21, (9) (29) 21,796 Transportation equipment (25) Tools and small equipment (29) (1) 79 Office equipment, furniture and Fixtures (12) (1) 592 Leasehold improvements , (79) (37) 26,836 Accumulated impairment losses: Buildings and improvements 3, ,838 Machinery and equipment 7,344 (4) 53 7,393 Transportation equipment Tools and small equipment Office equipment, furniture and fixtures ,239 (4) 69 11,304 Net book value P= 19,635 P= 429 (P= 222) (P= 36) P=19,806 Forward 5
17 Balance, December 31, 2009 Disposals and Reclassifications Currency Translation Adjustments Balance, June 30, 2010 June 30, 2010 Additions Cost: Land P= P= P= 1,006 P= 33 P= 1,039 Buildings and improvements 3, , ,684 Machinery and equipment 17, , ,554 Transportation equipment Tools and small equipment 9 9 Office equipment, furniture and fixtures Leasehold improvements Construction in progress 335 (77) , , ,160 Accumulated depreciation and amortization: Buildings and improvements 1, , ,681 Machinery and equipment 13, , ,759 Transportation equipment Tools and small equipment Office equipment, furniture and fixtures Leasehold improvements , , ,659 Accumulated impairment losses: Buildings and improvements 2, ,316 Machinery and equipment 5, ,281 Transportation equipment 6 6 Tools and small equipment Office equipment, furniture and fixtures , ,625 Net book value P= 5,765 (P= 402 ) P= 11,473 P= 40 P=16,876 Depreciation and amortization charged to operations amounted to P=611 and P=700 in June 2011 and 2010, respectively. 5. Basic and Diluted Earnings Per Share (EPS) Basic EPS is computed by dividing the net income for the period attributable to equity holders of the Parent Company by the weighted average number of issued and outstanding common shares during the period, with retroactive adjustments for any stock dividends declared. Diluted EPS is computed by adjusting the net income for the period attributable to equity holders of the Parent Company and the weighted average number of issued and outstanding common shares during the period, for the effects of all dilutive common shares. Basic/Diluted EPS is computed as follows: Net Income attributable to equity holders of the Parent Company (a) P= Weighted average number of shares outstanding (b) Basic / Diluted EPS (a/b) P= June P= 6,025 7,887 15,410 15,410 P=
18 As of June 30, 2011 and 2010, the Group has no dilutive debt or equity instruments. 6. Dividends Cash dividends declared by the Parent Company s Board of Directors (BOD) to common shareholders amounted to P=0.28 and P=0.27 per share in June 2011 and 2010, respectively. 7. Financial Risk Management Objectives and Policies Objectives and Policies The Group has significant exposure to the following financial risks primarily from its use of financial instruments: Interest Rate Risk Foreign Currency Risk Liquidity Risk Credit Risk This note presents information about the Group s exposure to each of the foregoing risks, the Group s objectives, policies and processes for measuring and managing these risks, and the Group s management of capital. The Group s principal nontrade related financial instruments include cash and cash equivalents, availableforsale (AFS) financial assets, shortterm and longterm loans and derivative instruments. These financial instruments, except derivative instruments, are used mainly for working capital management purposes. The Group s traderelated financial assets and financial liabilities such as trade and other receivables, noncurrent receivables, accounts payable and accrued expenses and other noncurrent liabilities arise directly from and are used to facilitate its daily operations. The BOD has the overall responsibility for the establishment and oversight of the Group s risk management framework. The Group s risk management policies are established to identify and analyze the risks faced by the Group, to set appropriate risk limits and controls, and to monitor risks and adherence to limits. Risk management policies and systems are reviewed regularly to reflect changes in market conditions and the Group s activities. The Group, through its training and management standards and procedures, aims to develop a disciplined and constructive control environment in which all employees understand their roles and obligations. The Parent Company s Audit Committee oversees how management monitors compliance with the Group s risk management policies and procedures, and reviews the adequacy of the risk management framework in relation to the risks faced by the Group. The Parent Company s Audit Committee is assisted in its oversight role by Internal Audit. Internal Audit undertakes both regular and ad hoc reviews of risk management controls and procedures, the results of which are reported to the Audit Committee. The Group s accounting policies in relation to derivatives are set out in Note 8 to the consolidated financial statements. Interest Rate Risk Interest rate risk is the risk that future cash flows from a financial instrument (cash flow interest rate risk) or its fair value (fair value interest rate risk) will fluctuate because of changes in market interest rates. The Group s exposure to changes in interest rates relates primarily to the Group s longterm borrowings. Borrowings issued at fixed rates expose the Group to fair value interest rate risk. On the other hand, borrowings issued at variable rates expose the Group to cash flow interest rate risk. 7
19 The Group manages its interest cost by using an optimal combination of fixed and variable rate debt instruments. Management is responsible for monitoring the prevailing marketbased interest rate and ensures that the markup rates charged on its borrowings are optimal and benchmarked against the rates charged by other creditor banks. In managing interest rate risk, the Group aims to reduce the impact of shortterm fluctuations on the Group s earnings. Over the longer term, however, permanent changes in interest rates would have an impact on profit or loss. The sensitivity to a reasonably possible 1% increase in the interest rates, with all other variables held constant, would have decreased the Group s profit before tax (through the impact on floating rate borrowings) by P=130 and P=138 in June 30, 2011 and 2010, respectively. A 1% decrease in the interest rate would have had the equal but opposite effect. These changes are considered to be reasonably possible given the observation of prevailing market conditions in those periods. There is no impact on the Group s other comprehensive income. Interest Rate Risk Table As at June 30, 2011 and December 31, 2010, the terms and maturity profile of the interestbearing financial instruments, together with its gross amounts, are shown in the following tables: June 30, 2011 <1 year 1<2 years >2<3 years >3<4 years >4<5 years >5 years Total Fixed rate Philippine pesodenominated P= 13,590 P= P= 22,400 P= P= P= 2,810 P= 38,800 Interest rate 8.25% 8.875% 10.50% Floating rate Foreign currencydenominated (expressed in Philippine pes 12,999 12,999 Interest rate LIBOR + margin 13,590 22,400 12,999 2,810 51,799 P= P= P= P= P= P= December 31, 2010 <1 year 1<2 years >2<3 years >3<4 years >4<5 years >5 years Total Fixed rate Philippine pesodenominated P= P= 13,590 P= P= 22,400 P= P= 2,810 P= 38,800 Interest rate 8.25% 8.875% 10.50% Floating rate Foreign currencydenominated (expressed in Philippine peso) 13,152 13,152 Interest rate LIBOR + margin P= P= 13,590 P= P= 22,400 P= 13,152 P= 2,810 P= 51,952 P= Foreign Currency Risk The Group s exposure to foreign currency risk results from significant movements in foreign exchange rates that adversely affect the foreign currencydenominated transactions of the Group. The Group s risk management objective with respect to foreign currency risk is to reduce or eliminate earnings volatility and any adverse impact on equity. The Group uses a combination of natural hedges and buying foreign currencies at spot rates where necessary to address shortterm imbalances from importations, revenue and expense transactions, and other foreign currencydenominated obligations. 8
20 Information on the Group s foreign currencydenominated monetary assets and liabilities and their Philippine peso equivalents are as follows: June 30, 2011 December 31, 2010 US Peso US Peso Dollar Equivalent Dollar Equivalent Assets Cash and cash equivalents US$94.8 P=4,106 US$93.3 P=4,093 Trade and other receivables , ,350 Noncurrent receivable , ,454 Liabilities Drafts and loans payable , ,644 Accounts payable and accrued expenses , ,691 Longterm debt , , , ,487 Net foreign currencydenominated monetary liabilities (US$257.3) (P=11,149) (US$251.7) (P=11,033) The Group reported net foreign exchange gains amounting to P=174 and P=137 in June 30, 2011 and 2010, respectively, with the translation of its foreign currencydenominated assets and liabilities. These mainly resulted from the movements of the Philippine peso against the US dollar as shown in the following table: Peso to US Dollar December 31, June 30, December 31, 2010 June 30, The following table demonstrates the sensitivity to a reasonably possible change in the US dollar exchange rate, with all other variables held constant, of the Group s profit before tax (due to changes in the fair value of monetary assets and liabilities) and the Group s equity (due to translation of results and financial position of foreign operations) as of June 30, 2011 and December 31, 2010: June 30, 2011 P1 decrease in the US dollar exchange rate Effect on Income before Effect on Income Tax Equity P1 increase in the US dollar exchange rate Effect on Income before Effect on Income Tax Equity Cash and cash equivalents (P6) (P93) P6 P93 Trade and other receivables (2) (58) 2 58 (8) (151) Drafts and loans payable 46 (46) Accounts payable and accrued expenses 1 65 (1) (65) Longterm debt (300) (210) (301) (321) P293 P170 (P293) (P170) 9
21 December 31, 2010 P1 decrease in the US dollar exchange rate Effect on Income before Effect on Income Tax Equity P1 increase in the US dollar exchange rate Effect on Income before Effect on Income Tax Equity Cash and cash equivalents (P5) (P92) P5 P92 Trade and other receivables (2) (53) 2 53 (7) (145) Drafts and loans payable 38 (38) Accounts payable and accrued expenses 2 52 (2) (52) Longterm debt (300) (210) (302) (300) P295 P155 (P295) (P155) Exposures to foreign exchange rate vary during the period depending on the value of overseas transactions. Nonetheless, the analysis above is considered to be representative of the Group s currency risk. Liquidity Risk Liquidity risk pertains to the risk that the Group will encounter difficulty in meeting obligations associated with financial liabilities that are settled by delivering cash or another financial asset. The Group s objectives to manage its liquidity risk are as follows: a) to ensure that adequate funding is available at all times; b) to meet commitments as they arise without incurring unnecessary costs; c) to be able to access funding when needed at the least possible cost; and d) to maintain an adequate time spread of refinancing maturities. The Group constantly monitors and manages its liquidity position, liquidity gaps or surplus on a daily basis. A committed standby credit facility from several local banks is also available to ensure availability of funds when necessary. The table below summarizes the maturity profile of the Group s financial assets and financial liabilities based on contractual undiscounted payments used for liquidity management as of June 30, 2011 and December 31, 2010: June 30, 2011 Carrying Amount Contractual Cash Flow 1year or less > 1 year 2 years >2 years 5 years Over 5 years Financial Assets Cash and cash equivalents P15,657 P15,657 P15,657 P P P Trade and other receivables net 4,558 4,558 4,558 Derivative assets (included under Prepaid expenses and other current assets account in the consolidated statements of financial position)
22 Carrying Amount Contractual Cash Flow 1year or less > 1 year 2 years >2 years 5 years Over 5 years AFS financial assets (included under Investments account in the consolidated statements of financial position) Noncurrent receivables (included under Other noncurrent assets account in the consolidated statements of financial position) Financial Liabilities Drafts and loans payable 1,983 2,049 2,049 Accounts payable and accrued expenses 6,895 6,895 6,895 Derivative liabilities (included under Accounts payable and accrued expenses account in the consolidated statements of financial position) Longterm debt (including current maturities) 51,296 61,344 16,847 2,595 38,279 3,623 December 31, 2010 Carrying Amount Contractual Cash Flow 1year or less > 1 year 2 years >2 years 5 years Over 5 years Financial Assets Cash and cash equivalents P15,076 P15,076 P15,076 P P P Trade and other receivables net 4,366 4,366 4,366 Derivative assets (included under Prepaid expenses and other current assets account in the consolidated statements of financial position) AFS financial assets (included under Investments account in the consolidated statements of financial position) Noncurrent receivables (included under Other noncurrent assets account in the consolidated statements of financial position) Financial Liabilities Drafts and loans payable 1,644 1,663 1,663 Accounts payable and accrued expenses 6,825 6,825 6,825 11
23 Carrying Amount Contractual Cash Flow 1year or less > 1 year 2 years >2 years 5 years Over 5 years Derivative liabilities (included under Accounts payable and accrued expenses account in the consolidated statements of financial position) Longterm debt 51,364 63,379 3,722 16,479 39,407 3,771 Credit Risk Credit risk is the risk of financial loss to the Group if a customer or counterparty to a financial instrument fails to meet its contractual obligations, and arises principally from the Group s trade receivables and investment securities. The Group manages its credit risk mainly through the application of transaction limits and close risk monitoring. It is the Group s policy to enter into transactions with a wide diversity of creditworthy counterparties to mitigate any significant concentration of credit risk. The Group has regular internal control reviews to monitor the granting of credit and management of credit exposures. Where appropriate, the Group obtains collateral or arranges master netting agreements. Trade and Other Receivables The Group s exposure to credit risk is influenced mainly by the individual characteristics of each customer. However, management also considers the demographics of the Group s customer base, including the default risk of dealers, wholesalers and retailers as these factors may have an influence on the credit risk. The Group has established a credit policy under which each new customer is analyzed individually for creditworthiness before the Group s standard payment and delivery terms and conditions are offered. The Group ensures that sales on account are made to customers with appropriate credit history. The Group has detailed credit criteria and several layers of credit approval requirements before engaging a particular customer or counterparty. The Group s review includes external ratings, when available, and in some cases bank references. Purchase limits are established for each customer and are reviewed on a regular basis. Customers that fail to meet the Group s benchmark creditworthiness may transact with the Group only on a cash basis. In monitoring customer credit risk, customers are grouped according to their credit characteristics, including whether they are an individual or legal entity, whether they are a wholesale, retail or enduser customer, aging profile, maturity and existence of previous financial difficulties. Customers that are graded as high risk are placed on a restricted customer list and future sales are made on cash basis. The Group establishes an allowance for impairment that represents its estimate of incurred losses in respect of trade and other receivables. The main components of this allowance are a specific loss component that relates to individually significant exposures, and a collective loss component established for groups of similar assets in respect of losses that have been incurred but not yet identified. The collective loss allowance is determined based on historical data of payment statistics for similar financial assets. Investments The Group recognizes provision for impairment losses based on specific and collective impairment tests, when objective evidence of impairment has been identified either on an individual account or on a portfolio level. 12
24 Financial information on the Group s maximum exposure to credit risk as of June 30, 2011 and December 31, 2010, without considering the effects of collaterals and other risk mitigation techniques, is presented below. June 30, 2011 December 31, 2010 Cash and cash equivalents P=15,657 P=15,076 Trade and other receivables net 4,558 4,366 Derivative assets AFS financial assets Noncurrent receivables P=20,461 P=19,642 The credit risk for cash and cash equivalents, derivative assets and AFS financial assets is considered negligible, since the counterparties are reputable entities with high quality external credit ratings. The Group s exposure to credit risk arises from default of counterparty. Generally, the maximum credit risk exposure of receivables is its carrying amount without considering collaterals or credit enhancements, if any. The Group has no significant concentration of credit risk since the Group deals with a large number of homogenous trade customers. The Group does not execute any credit guarantee in favor of any counterparty. Capital Management The primary objective of the Group s capital management is to ensure that it maintains a strong credit rating and healthy capital ratios in order to support its business and maximize shareholder value. The Group manages its capital structure and makes adjustments, in the light of changes in economic conditions. To maintain or adjust the capital structure, the Group may adjust the dividend payment to shareholders, payoff existing debt, return capital to shareholders or issue new shares. The Group defines capital as capital stock, additional paidin capital and retained earnings. Other components of equity such as cumulative translation adjustments are excluded from capital for purposes of capital management. The BOD has overall responsibility for monitoring capital in proportion to risk. Profiles for capital ratios are set in the light of changes in the Group s external environment and the risks underlying the Group s business, operation and industry. The Group monitors capital on the basis of debttoequity ratio, which is calculated as total debt divided by total equity. Total debt is defined as total current liabilities and total noncurrent liabilities, while equity is total equity as shown in the consolidated statements of financial position. There were no changes in the Group s approach to capital management during the period. 8. Financial Assets and Financial Liabilities Date of Recognition. The Group recognizes a financial asset or a financial liability in the consolidated statements of financial position when it becomes a party to the contractual provisions of the instrument. In the case of a regular way purchase or sale of financial assets, recognition is done using settlement date accounting. 13
25 Initial Recognition of Financial Instruments. Financial instruments are recognized initially at fair value of the consideration given (in case of an asset) or received (in case of a liability). The initial measurement of financial instruments, except for those designated at fair value through profit and loss (FVPL), includes transaction costs. The Group classifies its financial assets in the following categories: heldtomaturity (HTM) investments, AFS financial assets, financial assets at FVPL and loans and receivables. The Group classifies its financial liabilities as either financial liabilities at FVPL or other liabilities. The classification depends on the purpose for which the investments are acquired and whether they are quoted in an active market. Management determines the classification of its financial assets and financial liabilities at initial recognition and, where allowed and appropriate, reevaluates such designation at every reporting date. Determination of Fair Value. The fair value of financial instruments traded in active markets at the reporting date is based on their quoted market price or dealer price quotations (bid price for long positions and ask price for short positions), without any deduction for transaction costs. When current bid and ask prices are not available, the price of the most recent transaction provides evidence of the current fair value as long as there is no significant change in economic circumstances since the time of the transaction. For all other financial instruments not listed in an active market, the fair value is determined by using appropriate valuation techniques. Valuation techniques include the discounted cash flow method, comparison to similar instruments for which market observable prices exist, options pricing models and other relevant valuation models. Day 1 Profit. Where the transaction price in a nonactive market is different from the fair value of the other observable current market transactions in the same instrument or based on a valuation technique whose variables include only data from observable market, the Group recognizes the difference between the transaction price and fair value (a Day 1 profit) in profit or loss unless it qualifies for recognition as some other type of asset. In cases where use is made of data which are not observable, the difference between the transaction price and model value is only recognized in profit or loss when the inputs become observable or when the instrument is derecognized. For each transaction, the Group determines the appropriate method of recognizing the Day 1 profit amount. Financial Assets Financial Assets at FVPL. Financial assets at FVPL include financial assets held for trading and financial assets designated upon initial recognition as at FVPL. Financial assets are designated at FVPL if the Group manages such investments and makes purchase and sale decisions based on their fair value in accordance with the Group s documented risk management or investment strategy. Derivative instruments (including embedded derivatives), except those covered by hedge accounting relationships, are classified under this category. Financial assets are classified as held for trading if they are acquired for the purpose of selling in the near term. Financial assets may be designated by management at initial recognition as at FVPL, when any of the following criteria is met: the designation eliminates or significantly reduces the inconsistent treatment that would otherwise arise from measuring the assets or recognizing gains or losses on a different basis; 14
26 the assets are part of a group of financial assets which are managed and their performances are evaluated on a fair value basis, in accordance with a documented risk management or investment strategy; or the financial instrument contains an embedded derivative, unless the embedded derivative does not significantly modify the cash flows or it is clear, with little or no analysis, that it would not be separately recognized. The Group carries financial assets at FVPL using their fair values. Attributable transaction costs are recognized in profit or loss as incurred. Fair value changes and realized gains and losses are recognized in profit or loss. Fair value changes from derivatives accounted for as part of an effective accounting hedge are recognized in other comprehensive income and presented under the Cumulative translation adjustments account in equity. Any interest earned shall be recognized as part of Interest income in the consolidated statements of income. Any dividend income from equity securities classified as FVPL shall be recognized in profit or loss when the right to receive payment has been established. The Group s derivative assets are classified under this category. The carrying amounts of financial assets under this category amounted to P=60, P=61 and P=54 as of June 30 and March 31, 2011 and December 31, 2010, respectively. Loans and Receivables. Loans and receivables are nonderivative financial assets with fixed or determinable payments and maturities that are not quoted in an active market. They are not entered into with the intention of immediate or shortterm resale and are not designated as AFS financial assets or financial assets at FVPL. Subsequent to initial measurement, loans and receivables are carried at amortized cost using the effective interest rate method, less any impairment in value. Any interest earned on loans and receivables shall be recognized as part of Interest income in the consolidated statements of income on an accrual basis. Amortized cost is calculated by taking into account any discount or premium on acquisition and fees that are integral part of the effective interest rate. The periodic amortization is also included as part of Interest income in the consolidated statements of income. Gains or losses are recognized in profit or loss when loans and receivables are derecognized or impaired, as well as through the amortization process. Cash includes cash on hand and in banks which are stated at face value. Cash equivalents are shortterm, highly liquid investments that are readily convertible to known amounts of cash and which are subject to an insignificant risk of changes in value. The Group s cash and cash equivalents, trade and other receivables and other noncurrent receivables are included in this category. The combined carrying amounts of financial assets under this category amounted to P=20,263, P=23,887 and P=19,453 as of June 30 and March 31, 2011 and December 31, 2010, respectively. HTM Investments. HTM investments are quoted nonderivative financial assets with fixed or determinable payments and fixed maturities for which the Group s management has the positive intention and ability to hold to maturity. Where the Group sells other than an insignificant amount of HTM investments, the entire category would be tainted and classified as AFS financial assets. After initial measurement, these investments are measured at amortized cost using the effective interest rate method, less impairment in value. Any interest earned on the HTM investments shall be recognized as part of Interest Income in the consolidated statements of income on an accrual basis. Amortized cost is calculated by taking into account any discount or premium on acquisition and fees that are integral 15
27 part of the effective interest rate. The periodic amortization is also included as part of Interest income in the consolidated statements of income. Gains and losses are recognized in profit or loss when the HTM investments are derecognized or impaired, as well as through the amortization process. The Group has no investments accounted for under this category as of June 30 and March 31, 2011 and December 31, AFS Financial Assets. AFS financial assets are nonderivative financial assets that are either designated in this category or not classified in any of the other financial asset categories. Subsequent to initial recognition, they are measured at fair value and changes therein, other than impairment losses and foreign currency differences on AFS debt instruments, are recognized in other comprehensive income and presented in the Cumulative translation adjustments in equity. The effective yield component of AFS debt securities is reported as part of Interest income in the consolidated statements of income. Dividends earned on holding AFS equity securities are recognized as Dividend income when the right to receive payment has been established. When individual AFS financial assets are either derecognized or impaired, the related accumulated unrealized gains or losses previously reported in equity are transferred to and recognized in profit or loss. AFS financial assets also include unquoted equity instruments with fair values which cannot be reliably determined. These instruments are carried at cost less impairment in value, if any. The Group s investments in equity securities included under Investments account are classified under this category. The carrying amounts of financial assets under this category amounted to P=138, P=137 and P=135 as of June 30 and March 31, 2011 and December 31, 2010, respectively. Financial Liabilities Financial Liabilities at FVPL. Financial liabilities are classified under this category through the fair value option. Derivative instruments (including embedded derivatives) with negative fair values, except those covered by hedge accounting relationships, are also classified under this category. The Group carries financial liabilities at FVPL using their fair values and reports fair value changes in profit or loss. Fair value changes from derivatives accounted for as part of an effective accounting hedge are recognized in other comprehensive income and presented under the Cumulative translation adjustments account in equity. Any interest expense incurred shall be recognized as part of Interest expense in the consolidated statements of income. The Group s derivative liabilities are classified under this category. The carrying amounts of financial liabilities under this category amounted to P=10, P=7 and P=8 as of June 30 and March 31, 2011 and December 31, 2010, respectively. Other Financial Liabilities. This category pertains to financial liabilities that are not designated or classified as at FVPL. After initial measurement, other financial liabilities are carried at amortized cost using the effective interest rate method. Amortized cost is calculated by taking into account any premium or discount and any directly attributable transaction costs that are considered integral part of the effective interest rate of the liability. Included in this category are the Group s liabilities arising from its trade or borrowings such as drafts and loans payable, accounts payable and accrued expenses and longterm debt. 16
28 The combined carrying amounts of financial liabilities under this category amounted to P=60,174, P=62,435 and P=59,833 as of June 30 and March 31, 2011 and December 31, 2010, respectively. Debt Issue Costs Debt issue costs are considered as an adjustment to the effective yield of the related debt and are deferred and amortized using the effective interest rate method. When a loan is paid, the related unamortized debt issue costs at the date of repayment are charged against current operations. Derecognition of Financial Assets and Financial Liabilities Financial Assets. A financial asset (or, where applicable, a part of a financial asset or part of a group of similar financial assets) is derecognized when: the rights to receive cash flows from the asset expired; the Group retains the right to receive cash flows from the asset, but has assumed an obligation to pay them in full without material delay to a third party under a passthrough arrangement; or the Group has transferred its rights to receive cash flows from the asset and either: (a) has transferred substantially all the risks and rewards of the asset; or (b) has neither transferred nor retained substantially all the risks and rewards of the asset, but has transferred control of the asset. When the Group has transferred its rights to receive cash flows from an asset and has neither transferred nor retained substantially all the risks and rewards of the asset nor transferred control of the asset, the asset is recognized to the extent of the Group s continuing involvement in the asset. Continuing involvement that takes the form of a guarantee over the transferred asset is measured at the lower of the original carrying amount of the asset and the maximum amount of consideration that the Group could be required to pay. Financial Liabilities. A financial liability is derecognized when the obligation under the liability is discharged, cancelled or expired. When an existing financial liability is replaced by another from the same lender on substantially different terms, or the terms of an existing liability are substantially modified, such an exchange or modification is treated as a derecognition of the original liability and the recognition of a new liability. The difference in the respective carrying amounts is recognized in profit or loss. Impairment of Financial Assets The Group assesses at reporting date whether a financial asset or group of financial assets is impaired. A financial asset or a group of financial assets is deemed to be impaired if, and only if, there is objective evidence of impairment as a result of one or more events that have occurred after the initial recognition of the asset (an incurred loss event) and that loss event has an impact on the estimated future cash flows of the financial asset or the group of financial assets that can be reliably estimated. Assets Carried at Amortized Cost. For assets carried at amortized cost such as loans and receivables, the Group first assesses whether objective evidence of impairment exists individually for financial assets that are individually significant, or collectively for financial assets that are not individually significant. If no objective evidence of impairment has been identified for a particular financial asset that was individually assessed, the Group includes the asset as part of a group of financial assets pooled according to their credit risk characteristics and collectively assesses the group for impairment. Assets that are individually assessed for impairment and for which an impairment loss is, or continues to be, recognized are not included in the collective impairment assessment. 17
29 Evidence of impairment for specific impairment purposes may include indications that the borrower or a group of borrowers is experiencing financial difficulty, default or delinquency in principal or interest payments, or may enter into bankruptcy or other form of financial reorganization intended to alleviate the financial condition of the borrower. For collective impairment purposes, evidence of impairment may include observable data on existing economic conditions or industrywide developments indicating that there is a measurable decrease in the estimated future cash flows of the related assets. If there is objective evidence of impairment, the amount of loss is measured as the difference between the asset s carrying amount and the present value of estimated future cash flows (excluding future credit losses) discounted at the financial asset s original effective interest rate (i.e., the effective interest rate computed at initial recognition). Time value is generally not considered when the effect of discounting the cash flows is not material. If a loan or receivable has a variable rate, the discount rate for measuring any impairment loss is the current effective interest rate, adjusted for the original credit risk premium. For collective impairment purposes, impairment loss is computed based on their respective default and historical loss experience. The carrying amount of the asset shall be reduced either directly or through use of an allowance account. The impairment loss for the period shall be recognized in profit or loss. If, in a subsequent period, the amount of the impairment loss decreases and the decrease can be related objectively to an event occurring after the impairment was recognized, the previously recognized impairment loss is reversed. Any subsequent reversal of an impairment loss is recognized in the consolidated statements of income, to the extent that the carrying value of the asset does not exceed its amortized cost at the reversal date. AFS Financial Assets. If an AFS financial asset is impaired, an amount comprising the difference between the cost (net of any principal payment and amortization) and its current fair value, less any impairment loss on that financial asset previously recognized in profit or loss, is transferred from equity profit or loss. Reversals in respect of equity instruments classified as AFS financial assets are not recognized in profit or loss. Reversals of impairment losses on debt instruments are reversed through profit or loss, if the increase in fair value of the instrument can be objectively related to an event occurring after the impairment loss was recognized in profit or loss. In the case of an unquoted equity instrument or of a derivative asset linked to and must be settled by delivery of an unquoted equity instrument, for which its fair value cannot be reliably measured, the amount of impairment loss is measured as the difference between the asset s carrying amount and the present value of estimated future cash flows from the asset discounted using its historical effective rate of return on the asset. Classification of Financial Instruments Between Debt and Equity From the perspective of the issuer, a financial instrument is classified as debt instrument if it provides for a contractual obligation to: deliver cash or another financial assets to another entity; exchange financial assets or financial liabilities with another entity under conditions that are potentially unfavorable to the Group; or satisfy the obligation other than by the exchange of a fixed amount of cash or another financial asset for a fixed number of own equity shares. If the Group does not have an unconditional right to avoid delivering cash or another financial asset to settle its contractual obligation, the obligation meets the definition of a financial liability. 18
30 Offsetting Financial Instruments Financial assets and financial liabilities are offset and the net amount is reported in the consolidated statements of financial position if, and only if, there is a currently enforceable legal right to offset the recognized amounts and there is an intention to settle on a net basis, or to realize the asset and settle the liability simultaneously. This is not generally the case with master netting agreements, and the related assets and liabilities are presented gross in the consolidated statements of financial position. The table below presents a comparison by category of carrying amounts and fair values of the Group s financial instruments as of June 30, 2011 and December 31, 2010: June 30, 2011 December 31, 2010 Carrying Carrying Amount Fair Value Amount Fair Value Financial Assets Cash and cash equivalents P=15,657 P=15,657 P=15,076 P=15,076 Trade and other receivables net 4,558 4,558 4,366 4,366 Derivative assets (included under Prepaid expenses and other current assets account in the consolidated statements of financial position) AFS financial assets (included under Investments account in the consolidated statements of financial position) Noncurrent receivables (included under Other noncurrent assets account in the consolidated statements of financial position) Financial Liabilities Drafts and loans payable 1,983 1, ,644 Accounts payable and accrued expenses 6,895 6,895 6,825 6,825 Derivative liabilities (included under Accounts payable and accrued expenses account in the consolidated statements of financial position) Longterm debt (including current maturities) 51,296 56,084 51,364 57,346 The following methods and assumptions are used to estimate the fair value of each class of financial instruments: Cash and Cash Equivalents, Trade and Other Receivables and Noncurrent Receivables. The carrying amount of cash and cash equivalents and receivables approximates fair value primarily due to the relatively shortterm maturities of these financial instruments. In the case of longterm receivables, the fair value is based on the present value of expected future cash flows using the applicable discount rates based on current market rates of identical or similar quoted instruments. Derivatives. The fair values of forward exchange contracts are calculated by reference to current forward exchange rates. Fair values for embedded derivatives are based on valuation models used for similar instruments using both observable and nonobservable inputs. AFS Financial Assets. The fair values of publicly traded instruments and similar investments are based on quoted market prices in an active market. For debt instruments with no quoted market prices, a 19
31 reasonable estimate of their fair values is calculated based on the expected cash flows from the instruments discounted using the applicable discount rates of comparable instruments quoted in active markets. Unquoted equity securities are carried at cost less impairment. Drafts and Loans Payable and Accounts Payable and Accrued Expenses. The carrying amount of drafts and loans payable and accounts payable and accrued expenses approximates fair value due to the relatively shortterm maturities of these financial instruments. Longterm Debt. The fair value of interestbearing fixedrate loans is based on the discounted value of expected future cash flows using the applicable market rates for similar types of instruments as of reporting date. As of June 30, 2011 and December 31, 2010, discount rates used range from 3.1% to 6.1% and 1.34% to 5.71%, respectively. The carrying values of floating rate loans with quarterly interest rate repricing approximate their fair values. Derivative Financial Instruments The Group s derivative financial instruments according to the type of financial risk being managed and the details of embedded derivative financial instruments not designated as hedges are discussed below. Other Derivative Instruments Not Designated as Hedges The Group enters into certain derivatives as economic hedges of certain underlying exposures. These include embedded derivatives found in host contracts, which are not designated as accounting hedges. Changes in fair value of these instruments are accounted for directly in profit or loss. Details are as follows: Embedded Derivatives The Group assesses whether embedded derivatives are required to be separated from host contracts when the Group becomes a party to the contract. An embedded derivative is separated from the host contract and accounted for as a derivative if all of the following conditions are met: a) the economic characteristics and risks of the embedded derivative are not closely related to the economic characteristics and risks of the host contract; b) a separate instrument with the same terms as the embedded derivative would meet the definition of a derivative; and c) the hybrid or combined instrument is not recognized at FVPL. Reassessment only occurs if there is a change in the terms of the contract that significantly modifies the cash flows that would otherwise be required. The Group s embedded derivatives include currency forwards embedded in nonfinancial contracts. Embedded Currency Forwards As of June 30 and March 31, 2011 and December 31, 2010, the total outstanding notional amount of currency forwards embedded in nonfinancial contracts amounted to US$49, US$25 and US$24, respectively. These nonfinancial contracts consist mainly of foreign currencydenominated purchase orders, sales agreements and capital expenditures. The embedded forwards are not clearly and closely related to their respective host contracts. As of June 30 and March 31, 2011 and December 31, 2010, the net positive fair value of these embedded currency forwards amounted to P=49, P=54 and P=46, respectively. For the periods ended June 30 and March 31, 2011 and June 30 and March 31, 2010, the Group recognized markedtomarket gains from freestanding and embedded derivatives amounting to P=13, P=15, P=37 and P=28, respectively. 20
32 Fair Value Hierarchy Financial assets and financial liabilities measured at fair value in the consolidated statements of financial position are categorized in accordance with the fair value hierarchy. This hierarchy groups financial assets and financial liabilities into three levels based on the significance of inputs used in measuring the fair value of the financial assets and financial liabilities. The table below analyzes financial instruments carried at fair value, by valuation method as of June 30, 2011 and December 31, The different levels have been defined as follows: Level 1: quoted prices (unadjusted) in active markets for identical assets or liabilities; Level 2: inputs other than quoted prices included within Level 1 that are observable for the asset or liability, either directly or indirectly; and Level 3: inputs for the asset or liability that are not based on observable market data. June 30, 2011 Level 1 Level 2 Total Financial Assets Derivative Assets P= P= 60 P= 60 AFS financial assets Financial Liabilities Derivative Liabilities December 31, 2010 Level 1 Level 2 Total Financial Assets Derivative Assets P= P= 54 P= 54 AFS financial assets Financial Liabilities Derivative Liabilities 8 8 As of June 30, 2011 and December 31, 2010, the Group has no financial instruments valued based on Level 3. During the period, there were no transfers between Level 1 and Level 2 fair value measurements, and no transfers into and out of Level 3 fair value measurements. 9. Other Matters a. There are no unusual items as to nature and amount affecting assets, liabilities, equity, net income or cash flows, except those stated in Management s Discussion and Analysis of Financial Position and Performance. b. There were no material changes in estimates of amounts reported in prior interim periods of the current year or changes in estimates of amounts reported in prior financial years. c. There were no known trends, demands, commitments, events or uncertainties that will have a material impact on the Group s liquidity. d. There were no known trends, events or uncertainties that have had or that are reasonably expected to have a favorable or unfavorable impact on net sales or revenues or income from continuing operation. 21
33 e. There were no known events that will trigger direct or contingent financial obligation that is material to the Group, including any default or acceleration of an obligation. No material contingencies and any other events or transactions exist that are material to an understanding of the current interim period. f. There were no material offstatement of financial position transactions, arrangements, obligations (including contingent obligations), and other relationship of the Group with unconsolidated entities or other persons created during the reporting period, except for the outstanding derivative transactions entered into by the Group as of and for the period ended June 30, g. The effects of seasonality or cyclicality on the interim operations of the Group s business are not material. h. The Group s material commitments for capital expenditure projects have been approved during the current year but are still ongoing and not yet completed as of June 30, These consist of construction, acquisition, upgrade or repair of fixed assets needed for normal operations of the business. The said projects will be carried forward to the next quarter until its completion. The fund to be used for these projects will come from available cash. i. On August 11, 2011, the BOD of the Parent Company declared cash dividends amounting to P=0.14 per share payable to stockholders of record as of August 26, 2011 to be paid on September 12,

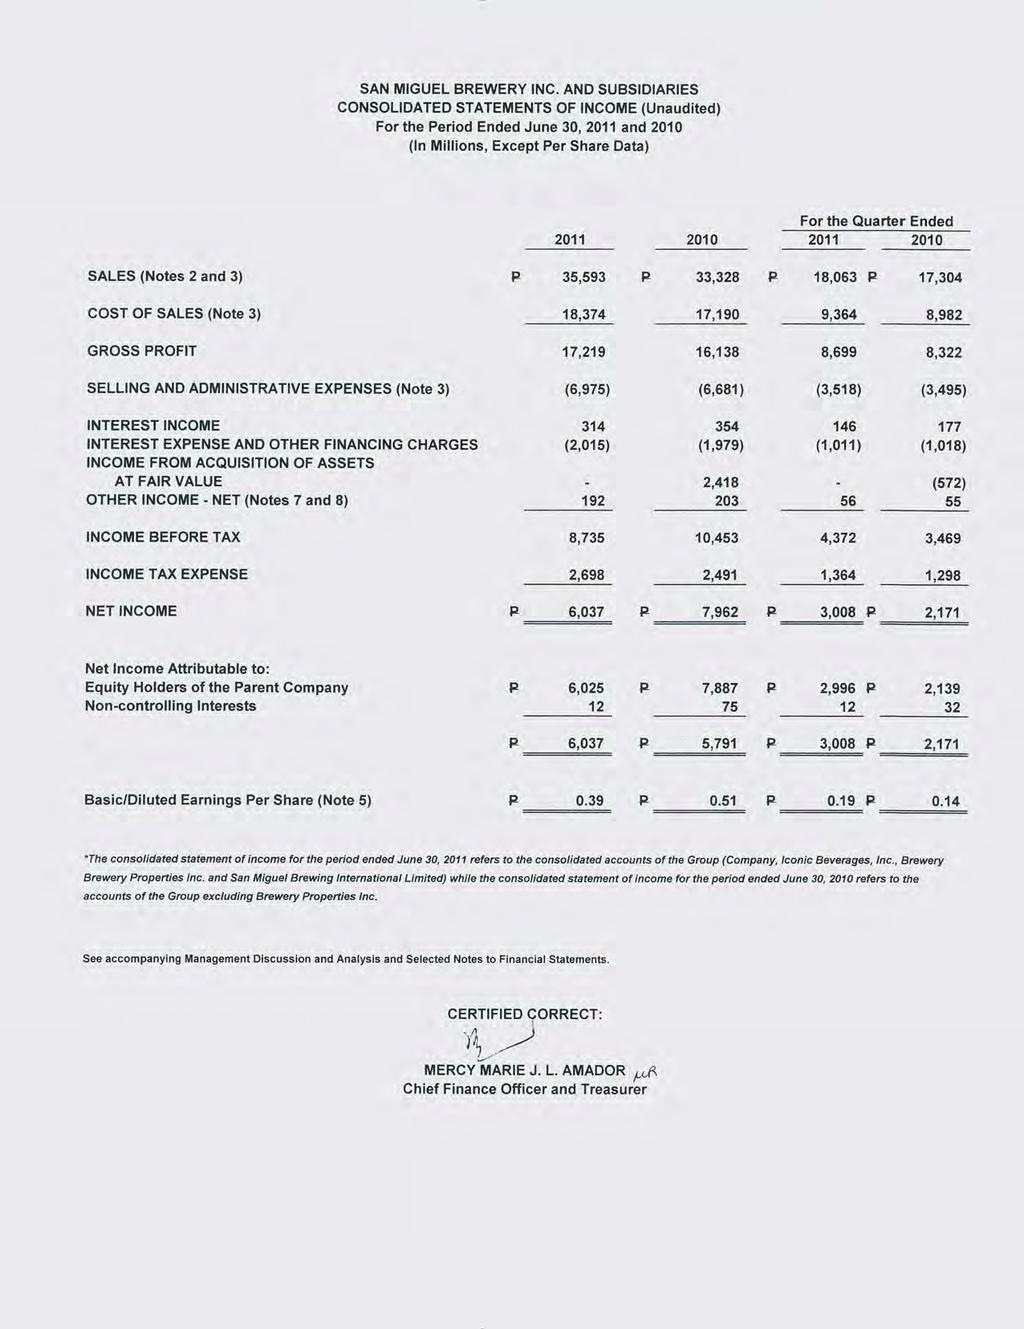
34 Annex B MANAGEMENT S DISCUSSION AND ANALYSIS OF FINANCIAL POSITION AND PERFORMANCE INTRODUCTION The following discussion should be read in conjunction with the attached unaudited consolidated financial statements of San Miguel Brewery Inc. (the Company or Parent Company ) and its subsidiaries (collectively referred to as the Group ) as of and for the period ended June 30, 2011 (with comparative figures as of December 31, 2010 and for the period ended June 30, 2010). All necessary adjustments to present fairly the Group s financial position, financial performance and cash flows as of June 30, 2011 and for all the periods presented, have been made. Certain information and footnote disclosures normally included in the audited consolidated financial statements prepared in accordance with Philippine Financial Reporting Standards have been omitted. I. FINANCIAL PERFORMANCE 2011 vs The consolidated statement of income for the first half of 2011 already reflects the financial performance of the Group s domestic and international businesses including Iconic Beverages, Inc. ( IBI ), Brewery Properties Inc. ( BPI ), San Miguel Brewing International Limited ( SMBIL ) and the subsidiaries of BPI and SMBIL while the statement of income for the first half of 2010 also reflects the consolidated results of both domestic and international operations excluding BPI and its subsidiary. The Group registered consolidated sales revenue of P35,593 million for the first half of 2011, 6.8% higher compared with the P33,328 million for the same period last year. Domestic operations contributed P29,318 million or 6.0% increase from the same period last year due to a 4% increase in volume while international operations contributed US$144 million, an improvement of 16.3% from the same period last year due to a 6% increase in volume. Cost of sales amounted to P18,374 million in 2011, with domestic operations accounting for P14,310 million and US$94 million for international operations. Operating expenses amounted to P6,975 million, an increase of 4.4% from the same period last year. Domestic operations accounted for P4,915 million while international operations accounted for US$47 million or P2,060 million. Income from operations increased by 8.3% to P10,244 million in the first half with domestic operations contributing P10,093 million and US$4 million or P151 million from international operations. 1
SAN MIGUEL CORPORATION
 SAN MIGUEL CORPORATION November 15, 2010 The Philippine Stock Exchange, Inc. Disclosure Department 3 rd Floor, Tower One and Exchange Plaza Ayala Triangle, Ayala Avenue Makati City Attention: Ms. Janet
MAA General Assurance Philippines, Inc. Financial Statements December 31, 2011 and and. Independent Auditors Report. SyCip Gorres Velayo & Co.
 MAA General Assurance Philippines, Inc. Financial Statements December 31, 2011 and 2010 and Independent Auditors Report SyCip Gorres Velayo & Co. SyCip Gorres Velayo & Co. 6760 Ayala Avenue 1226 Makati
C O V E R S H E E T. P W S. E. C. Registration Number
 C O V E R S H E E T S A N M I G U E L C O R P O R A T I O N P W - 2 7 7 S. E. C. Registration Number (Company s Full Name) N o. 4 0 S a n M i g u e l A v e. M a n d a l u y o n g C i t Y (Business Address:
Cebu Holdings, Inc. and Subsidiaries
 Cebu Holdings, Inc. and Subsidiaries Consolidated Financial Statements December 31, 2012 and 2011 and Years ended December 31, 2012, 2011 and 2010 and Independent Auditors Report SyCip Gorres Velayo &
C O V E R S H E E T. P W S. E. C. Registration Number S A N M I G U E L C O R P O R A T I O N. N o. 4 0 S a n M i g u e l A v e.
 C O V E R S H E E T S A N M I G U E L C O R P O R A T I O N P W - 2 7 7 S. E. C. Registration Number (Company s Full Name) N o. 4 0 S a n M i g u e l A v e. M a n d a l u y o n g C i t Y (Business Address:
MAA General Assurance Philippines, Inc. Financial Statements December 31, 2012 and and. Independent Auditors Report. SyCip Gorres Velayo & Co.
 MAA General Assurance Philippines, Inc. Financial Statements December 31, 2012 and 2011 and Independent Auditors Report SyCip Gorres Velayo & Co. SyCip Gorres Velayo & Co. 6760 Ayala Avenue 1226 Makati
Notes to Financial Statements
 Page - 2 Page - 3 Page - 4 Page - 5 Page - 6 Page - 7 MERALCO EMPLOYEES MUTUAL AID AND BENEFIT ASSOCIATION, INC. A Non-stock, Non-profit Organization Notes to Financial Statements As at and for the Years
COVER SHEET C E B U H O L D I N G S, I N C. A N D S U B S I D I A R. (Company s Full Name)
") COVER SHEET 1 5 7 9 1 2 SEC Registration Number C E B U H O L D I N G S, I N C. A N D S U B S I D I A R I E S (Company s Full Name) 7 t h F l o o r, C e b u H o l d i n g s C e n t e r, D C e b u B u s
COVER SHEET 1 5 7 9 1 2 SEC Registration Number C E B U H O L D I N G S, I N C. A N D S U B S I D I A R I E S (Company s Full Name) 7 t h F l o o r, C e b u H o l d i n g s C e n t e r, D C e b u B u s
CARD Pioneer Microinsurance Inc.
 CARD Pioneer Microinsurance Inc. Financial Statements December 31, 2015 and 2014 and Independent Auditors Report SyCip Gorres Velayo & Co. 6760 Ayala Avenue 1226 Makati City Philippines Tel: (632) 891
COVER SHEET J O L L I B E E F O O D S C O R P O R A T I O N A N D S U 7 B S I D I A R I E S. (Company s Full Name)
") COVER SHEET SEC Registration Number 7 7 4 8 7 J O L L I B E E F O O D S C O R P O R A T I O N A N D S U 7 B S I D I A R I E S (Company s Full Name) 1 0 t h F l o o r, J o l l i b e e P l a z a B u i l
COVER SHEET SEC Registration Number 7 7 4 8 7 J O L L I B E E F O O D S C O R P O R A T I O N A N D S U 7 B S I D I A R I E S (Company s Full Name) 1 0 t h F l o o r, J o l l i b e e P l a z a B u i l
Sun life Grepa Financial, Inc.
 Sun life Grepa Financial, Inc. Financial Statements December 31, 2012 (With Comparative Figures for December 31, 2011) and Independent Auditors' Report SyCip Gorres Velayo & Co. SyCip Gorres Velayo & Co.
BPI Direct Savings Bank, Inc. Financial Statements As at and for the years ended December 31, 2010 and 2009
 BPI Direct Savings Bank, Inc. Financial Statements As at and for the years ended December 31, 2010 and 2009 BPI Direct Savings Bank, Inc. Statements of Condition December 31, 2010 and 2009 (All amounts
MAPFRE INSULAR INSURANCE CORPORATION. FINANCIAL STATEMENTS December 31, 2015 (With Comparative Figures for 2014)
") MAPFRE INSULAR INSURANCE CORPORATION FINANCIAL STATEMENTS December 31, 2015 (With Comparative Figures for 2014) MAPFRE INSULAR INSURANCE CORPORATION STATEMENT OF FINANCIAL POSITION (With Comparative Figures
MAPFRE INSULAR INSURANCE CORPORATION FINANCIAL STATEMENTS December 31, 2015 (With Comparative Figures for 2014) MAPFRE INSULAR INSURANCE CORPORATION STATEMENT OF FINANCIAL POSITION (With Comparative Figures
COVER SHEET B E L L E C O R P O R A T I O N A N D S U B S I D I A R I E. (Company s Full Name) 5 t h F l o o r, T o w e r A, T w o E - C o m C e n
 5 t h F l o o r, T o w e r A, T w o E - C o m C e n") COVER SHEET 5 2 4 1 2 SEC Registration Number B E L L E C O R P O R A T I O N A N D S U B S I D I A R I E S (Company s Full Name) 5 t h F l o o r, T o w e r A, T w o E - C o m C e n t e r, P a l m C o
COVER SHEET 5 2 4 1 2 SEC Registration Number B E L L E C O R P O R A T I O N A N D S U B S I D I A R I E S (Company s Full Name) 5 t h F l o o r, T o w e r A, T w o E - C o m C e n t e r, P a l m C o
INDEPENDENT AUDITORS REPORT. The Stockholders and the Board of Directors Mapfre Insular Insurance Corporation. Report on the Financial Statements
 SyCip Gorres Velayo & Co. 6760 Ayala Avenue 1226 Makati City Philippines Phone: (632) 891 0307 Fax: (632) 819 0872 www.sgv.com.ph BOA/PRC Reg. No. 0001, January 25, 2010, valid until December 31, 2012
Bermaz Auto Philippines Inc. (formerly Berjaya Auto Philippines Inc.)
") Bermaz Auto Philippines Inc. (formerly Berjaya Auto Philippines Inc.) Financial Statements April 30, 2016, 2015 and 2014 and Years Ended April 30, 2016, 2015 and 2014 and Independent Auditors Report C
Bermaz Auto Philippines Inc. (formerly Berjaya Auto Philippines Inc.) Financial Statements April 30, 2016, 2015 and 2014 and Years Ended April 30, 2016, 2015 and 2014 and Independent Auditors Report C
Generali Pilipinas Life Assurance Company, Inc.
 Generali Pilipinas Life Assurance Company, Inc. (A Wholly Owned Subsidiary of Generali Pilipinas Holding Company, Inc.) Financial Statements December 31, 2015 and 2014 and Independent Auditors Report SyCip
Republic of the Philippines COMMISSION ON AUDIT INDEPENDENT AUDITOR S REPORT
 Republic of the Philippines COMMISSION ON AUDIT Commonwealth Avenue, Quezon City INDEPENDENT AUDITOR S REPORT THE BOARD OF DIRECTORS Philippine National Oil Company Energy Center, Fort Bonifacio Taguig
COVER SHEET. (Company's Full Name) L E V E L P H I N M A P L A Z A 3 9 P L A Z A
 L E V E L P H I N M A P L A Z A 3 9 P L A Z A") COVER SHEET 1 2 3 9 7 S.E.C. Registration Number P H I N M A C O R P O R A T I O N (Company's Full Name) L E V E L 1 2 - P H I N M A P L A Z A 3 9 P L A Z A D R I V E, R O C K W E L L C E N T E R M A K
COVER SHEET 1 2 3 9 7 S.E.C. Registration Number P H I N M A C O R P O R A T I O N (Company's Full Name) L E V E L 1 2 - P H I N M A P L A Z A 3 9 P L A Z A D R I V E, R O C K W E L L C E N T E R M A K
AIG Philippines Insurance, Inc. Financial Statements As at and for the years ended December 31, 2016 and 2015
 AIG Philippines Insurance, Inc. Financial Statements As at and for the years ended December 31, 2016 and 2015 AIG Philippines Insurance, Inc. Statements of Comprehensive Income For the years ended
 SAN MIGUEL CORPORATION AND SUBSIDIARIES SELECTED NOTES TO THE CONSOLIDATED FINANCIAL STATEMENTS (Amounts in Millions, Except Per Share Data) 1. Summary of Significant Accounting and Financial Reporting
COVER SHEET for SEC FORM 17-Q
 COVER SHEET for SEC FORM 17-Q SEC Registration Number A S O 9 4-8 8 1 1 Company Name T R A N S - A S I A P E T R O L E U M C O R P O R A T I O N A N D A S U B S I D I A R Y Principal Office (No./Street/Barangay/City/Town/Province)
BANK OF THE PHILIPPINE ISLANDS
 BANK OF THE PHILIPPINE ISLANDS STATEMENTS OF CONDITION DECEMBER 31, 2011 AND 2010 Notes 2011 2010 2011 2010 RESOURCES CASH AND OTHER CASH ITEMS 7 22,395 18,151 21,661 17,573 DUE FROM BANGKO SENTRAL NG
 PRIME ORION PHILIPPINES, INC. AND SUBSIDIARIES Unaudited Interim Consolidated Financial Statements March 31, 2012 and June 30, 2011 PRIME ORION PHILIPPINES, INC. AND SUBSIDIARIES CONSOLIDATED STATEMENTS
Philippine AXA Life Insurance Corporation Financial Statements December 31, 2012 and 2011 and Independent Auditors Report SyCip Gorres Velayo & Co.
 Philippine AXA Life Insurance Corporation Financial Statements December 31, 2012 and 2011 and Independent Auditors Report SyCip Gorres Velayo & Co. COVER SHEET 2 1 9 3 8 SEC Registration Number P H I L
Toyota Financial Services Philippines Corporation. Financial Statements March 31, 2010 and and. Independent Auditors Report
 Toyota Financial Services Philippines Corporation Financial Statements March 31, 2010 and 2009 and Independent Auditors Report SyCip Gorres Velayo & Co. SyCip Gorres Velayo & Co. 6760 Ayala Avenue 1226
Liberty Flour Mills, Inc. and Subsidiary
 Liberty Flour Mills, Inc. and Subsidiary Consolidated Financial Statements December 31, 2013 and 2012 and Years Ended December 31, 2013, 2012 and 2011 and Independent Auditors Report SyCip Gorres Velayo
DMCI Holdings, Inc. Parent Company Financial Statements December 31, 2016 and 2015 and Years Ended December 31, 2016, 2015 and 2014.
 DMCI Holdings, Inc. Parent Company Financial Statements December 31, 2016 and 2015 and Years Ended December 31, 2016, 2015 and 2014 and Independent Auditor s Report SyCip Gorres Velayo & Co. 6760 Ayala
Sterling Bank of Asia, Inc. (A Savings Bank) Financial Statements December 31, 2011 and and. Independent Auditors Report
 Financial Statements December 31, 2011 and and. Independent Auditors Report") Sterling Bank of Asia, Inc. (A Savings Bank) Financial Statements December 31, 2011 and 2010 and Independent Auditors Report SyCip Gorres Velayo & Co. SyCip Gorres Velayo & Co. 6760 Ayala Avenue 1226 Makati
Sterling Bank of Asia, Inc. (A Savings Bank) Financial Statements December 31, 2011 and 2010 and Independent Auditors Report SyCip Gorres Velayo & Co. SyCip Gorres Velayo & Co. 6760 Ayala Avenue 1226 Makati
BPI/MS Insurance Corporation. Financial Statements As at and for the years ended December 31, 2014 and 2013
 BPI/MS Insurance Corporation Financial Statements As at and for the years ended December 31, 2014 and 2013 BPI/MS Insurance Corporation Statements of Financial Position December 31, 2014 and 2013 (In
 GRAND PLAZA HOTEL CORPORATION STATEMENTS OF FINANCIAL POSITION December 31 Note 2017 2016 ASSETS Current Assets Cash and cash equivalents 4, 25 P242,452,360 P260,870,964 Receivables - net 5, 14, 25 102,364,011
AIG Philippines Insurance, Inc. Financial Statements As at and for the years ended December 31, 2015 and 2014
 AIG Philippines Insurance, Inc. Financial Statements As at and for the years ended December 31, 2015 and 2014 COVER SHEET for AUDITED FINANCIAL STATEMENTS SEC Registration Number 1 8 3 8 9 Company Name
Prudential Guarantee and Assurance Inc.
 Prudential Guarantee and Assurance Inc. Financial Statements December 31, 2016 and 2015 and Independent Auditor s Report SyCip Gorres Velayo & Co. 6760 Ayala Avenue 1226 Makati City Philippines Tel: (632)
March 15, Philippine Stock Exchange, Inc. Disclosure Department Philippine Stock Exchange Plaza Ayala Triangle Ayala Avenue, Makati City
 March 15, 2011 Philippine Stock Exchange, Inc. Disclosure Department Philippine Stock Exchange Plaza Ayala Triangle Ayala Avenue, Makati City Attention: Ms. Janet A. Encarnacion Head - Disclosure Department
Century Properties Group Inc. and Subsidiaries
 Century Properties Group Inc. and Subsidiaries Consolidated Financial Statements December 31, 2014 and 2013 and Years Ended December 31, 2014, 2013 and 2012 and Independent Auditors Report SyCip Gorres
 SAN MIGUEL CORPORATION AND SUBSIDIARIES SELECTED NOTES TO THE CONSOLIDATED FINANCIAL STATEMENTS (Amounts in Millions, Except Per Share Data) 1. Summary of Significant Accounting and Financial Reporting
STERLING BANK OF ASIA INC. (A Savings Bank) Financial Statements December 31, 2015 and 2014 REYES TACANDONG & CO. FIRM PRINCIPLES. WISE SOLUTIONS.
 Financial Statements December 31, 2015 and 2014 REYES TACANDONG & CO. FIRM PRINCIPLES. WISE SOLUTIONS.") STERLING BANK OF ASIA INC. (A Savings Bank) Financial Statements December 31, 2015 and 2014 With independent auditor s report provided by REYES TACANDONG & CO. FIRM PRINCIPLES. WISE SOLUTIONS. C O V E
STERLING BANK OF ASIA INC. (A Savings Bank) Financial Statements December 31, 2015 and 2014 With independent auditor s report provided by REYES TACANDONG & CO. FIRM PRINCIPLES. WISE SOLUTIONS. C O V E
SMC GLOBAL POWER HOLDINGS CORP. AND SUBSIDIARIES. (A Wholly-owned Subsidiary of San Miguel Corporation)
") SMC GLOBAL POWER HOLDINGS CORP. AND SUBSIDIARIES (A Wholly-owned Subsidiary of San Miguel Corporation) CONSOLIDATED FINANCIAL STATEMENTS December 31, 2017, 2016 and 2015 SMC GLOBAL POWER HOLDINGS
SMC GLOBAL POWER HOLDINGS CORP. AND SUBSIDIARIES (A Wholly-owned Subsidiary of San Miguel Corporation) CONSOLIDATED FINANCIAL STATEMENTS December 31, 2017, 2016 and 2015 SMC GLOBAL POWER HOLDINGS
SECURITIES AND EXCHANGE COMMISSION
 http://edge.pse.com.ph/downloadhtml.do?file_id=380199 Page 1 of 3 8/15/2017 CR06033-2017 SECURITIES AND EXCHANGE COMMISSION SEC FORM 17-Q QUARTERLY REPORT PURSUANT TO SECTION 17 OF THE SECURITIES REGULATION
SECURITIES AND EXCHANGE COMMISSION SEC FORM 17-Q
 SECURITIES AND EXCHANGE COMMISSION SEC FORM 17-Q QUARTERLY REPORT PURSUANT TO SECTION 17 OF THE SECURITIES REGULATION CODE AND SRC RULE 17(2) (b) THEREUNDER 1. For the quarterly period ended: September
C O V E R S H E E T. for AUDITED FINANCIAL STATEMENTS 3 R D F L O O R, D A C O N B U I L D I N G, 2 2 8
 C O V E R S H E E T for AUDITED FINANCIAL STATEMENTS SEC Registration Number A S 0 9 5 0 0 2 2 8 3 C O M P A N Y N A M E D M C I H O L D I N G S, I N C PRINCIPAL OFFICE ( No. / Street / Barangay / City
Paxys, Inc. and Subsidiaries Consolidated Financial Statements December 31, 2012 and 2011 and January 1, 2011 and For Years Ended December 31, 2012, 2
 Paxys, Inc. and Subsidiaries Consolidated Financial Statements December 31, 2012 and 2011 and January 1, 2011 and For Years Ended December 31, 2012, 2011 and 2010 and Independent Auditors Report SyCip
COVER SHEET S M P R I M E H O L D I N G S, I N C. A N D S U B S I. (Company s Full Name) S M C o r p o r a t e O f f i c e s, B u i l d i n g A,
 S M C o r p o r a t e O f f i c e s, B u i l d i n g A,") COVER SHEET A S 0 9 4-0 0 0 0 8 8 SEC Registration Number S M P R I M E H O L D I N G S, I N C. A N D S U B S I D I A R I E S (Company s Full Name) S M C o r p o r a t e O f f i c e s, B u i l d i n g
COVER SHEET A S 0 9 4-0 0 0 0 8 8 SEC Registration Number S M P R I M E H O L D I N G S, I N C. A N D S U B S I D I A R I E S (Company s Full Name) S M C o r p o r a t e O f f i c e s, B u i l d i n g
Prudential Guarantee and Assurance Inc.
 Prudential Guarantee and Assurance Inc. Financial Statements December 31, 2017 and 2016 and Independent Auditor s Report SyCip Gorres Velayo & Co. 6760 Ayala Avenue 1226 Makati City Philippines Tel: (632)
The First Nationwide Assurance Corporation
 The First Nationwide Assurance Corporation Financial Statements December 31, 2017 and 2016 and Independent Auditor s Report SyCip Gorres Velayo & Co. 6760 Ayala Avenue 1226 Makati City Philippines Tel:
Carmen Copper Corporation
 Carmen Copper Corporation Financial Statements December 31, 2012 and 2011 and Independent Auditors Report SyCip Gorres Velayo & Co. COVER SHEET C A R M E N C O P P E R C O R P O R A T I O N (Company s
MULTICARE PHARMACEUTICALS PHILIPPINES, INC. (A Subsidiary of Lupin Holdings, B.V.)
") MULTICARE PHARMACEUTICALS PHILIPPINES, INC. (A Subsidiary of Lupin Holdings, B.V.) Financial Statements March 31, 2017 and 2016 and Independent Auditors Report 26 th Floor, Rufino Tower Building, 6784
MULTICARE PHARMACEUTICALS PHILIPPINES, INC. (A Subsidiary of Lupin Holdings, B.V.) Financial Statements March 31, 2017 and 2016 and Independent Auditors Report 26 th Floor, Rufino Tower Building, 6784
Prudential Guarantee and Assurance Incorporated
 Prudential Guarantee and Assurance Incorporated Financial Statements December 31, 2015 and 2014 and Independent Auditors Report SyCip Gorres Velayo & Co. 6760 Ayala Avenue 1226 Makati City Philippines
BDO Life Assurance Company, Inc. (Formerly Generali Pilipinas Life Assurance Company, Inc.)
") BDO Life Assurance Company, Inc. (Formerly Generali Pilipinas Life Assurance Company, Inc.) (A Wholly Owned Subsidiary of BDO Life Assurance Holdings Corp.) Financial Statements December 31, 2016 and 2015
BDO Life Assurance Company, Inc. (Formerly Generali Pilipinas Life Assurance Company, Inc.) (A Wholly Owned Subsidiary of BDO Life Assurance Holdings Corp.) Financial Statements December 31, 2016 and 2015
PNB General Insurers Co., Inc. (A Subsidiary of Philippine National Bank)
") PNB General Insurers Co., Inc. (A Subsidiary of Philippine National Bank) Financial Statements December 31, 2016 and 2015 and Independent Auditor s Report SyCip Gorres Velayo & Co. 6760 Ayala Avenue 1226
PNB General Insurers Co., Inc. (A Subsidiary of Philippine National Bank) Financial Statements December 31, 2016 and 2015 and Independent Auditor s Report SyCip Gorres Velayo & Co. 6760 Ayala Avenue 1226
Management s Responsibility for the Consolidated Financial Statements
 SyCip Gorres Velayo & Co. 10F Pag-IBIG Fund WT Corporate Tower Mindanao Avenue, Cebu Business Park Cebu City, 6000 Cebu Philippines Phone: (032) 231-7331 to 33 Fax: (032) 231-9539 www.sgv.com.ph INDEPENDENT
COVER SHEET. (Company s Full Name) 5 D T o w e r O n e, O n e M c K i n l e y P l a c e. N e w G l o b a l B o n i f a c i o C i t y, F o r t
 5 D T o w e r O n e, O n e M c K i n l e y P l a c e. N e w G l o b a l B o n i f a c i o C i t y, F o r t") COVER SHEET CS 2 0 0 6 0 2 3 5 6 SEC Registration Number G M A H O L D I N G S, I N C. (Company s Full Name) 5 D T o w e r O n e, O n e M c K i n l e y P l a c e N e w G l o b a l B o n i f a c i o C i
COVER SHEET CS 2 0 0 6 0 2 3 5 6 SEC Registration Number G M A H O L D I N G S, I N C. (Company s Full Name) 5 D T o w e r O n e, O n e M c K i n l e y P l a c e N e w G l o b a l B o n i f a c i o C i
- 3 - Subsidiaries/Associates Business
 - 3 - Effective Percentage Line of of Ownership Subsidiaries/Associates Business 2017 2016 Associates: YGC Corporate Services, Inc. (YCS) Support services for YGC 40.00 40.00 Luisita Industrial Park Co.
MANILA BANKERS LIFE INSURANCE CORPORATION. NOTES TO FINANCIAL STATEMENTS December 31, 2015 and 2014
 MANILA BANKERS LIFE INSURANCE CORPORATION NOTE 1 CORPORATE INFORMATION NOTES TO FINANCIAL STATEMENTS December 31, 2015 and 2014 Manila Bankers Life Insurance Corporation (MB Life) is a company formed and
 MABUHAY VINYL CORPORATION AND SUBSIDIARY SELECTED NOTES TO UNAUDITED INTERIM CONSOLIDATED FINANCIAL STATEMENTS (ANNEX B) For the First Quarter and Three Months Ended March 31, 2018 (Amounts in Thousands,
Quidan Pag-inupdanay Mutual Benefit Association, Inc. (A Nonstock, Not-for-Profit Association)
") Quidan Pag-inupdanay Mutual Benefit Association, Inc. (A Nonstock, Not-for-Profit Association) Financial Statements December 31, 2012 and 2011 and Independent Auditors Report SyCip Gorres Velayo & Co.
Quidan Pag-inupdanay Mutual Benefit Association, Inc. (A Nonstock, Not-for-Profit Association) Financial Statements December 31, 2012 and 2011 and Independent Auditors Report SyCip Gorres Velayo & Co.
Bankers Assurance Corporation (A Wholly Owned Subsidiary of Malayan Insurance Co., Inc.)
") Bankers Assurance Corporation (A Wholly Owned Subsidiary of Malayan Insurance Co., Inc.) Financial Statements December 31, 2015 and 2014 and Independent Auditors Report SyCip Gorres Velayo & Co. 6760 Ayala
Bankers Assurance Corporation (A Wholly Owned Subsidiary of Malayan Insurance Co., Inc.) Financial Statements December 31, 2015 and 2014 and Independent Auditors Report SyCip Gorres Velayo & Co. 6760 Ayala
SECURITIES AND EXCHANGE COMMISSION
 http://edge.pse.com.ph/downloadhtml.do?file_id=403956 Page 1 of 3 11/10/2017 CR07750-2017 SECURITIES AND EXCHANGE COMMISSION SEC FORM 17-Q QUARTERLY REPORT PURSUANT TO SECTION 17 OF THE SECURITIES REGULATION
August 14, PHILIPPINE STOCK EXCHANGE, INC. Tower One and Exchange Plaza Ayala Triangle, Ayala Avenue, Makati City
 ISO 28000:2007, OHSAS 18001:2007, ISO 14001:2004 certified ISPS Code compliant Asian Terminals Inc. Head Office A. Bonifacio Drive, Port Area, Manila, 1018 Philippines PO Box 3021, Manila, Philippines
PGA Sompo Insurance Corporation (formerly PGA Sompo Japan Insurance, Inc.)
") PGA Sompo Insurance Corporation (formerly PGA Sompo Japan Insurance, Inc.) Financial Statements December 31, 2016 and 2015 and Independent Auditor s Report SyCip Gorres Velayo & Co. 6760 Ayala Avenue 1226
PGA Sompo Insurance Corporation (formerly PGA Sompo Japan Insurance, Inc.) Financial Statements December 31, 2016 and 2015 and Independent Auditor s Report SyCip Gorres Velayo & Co. 6760 Ayala Avenue 1226
SECURITIES AND EXCHANGE COMMISSION
 SECURITIES AND EXCHANGE COMMISSION SEC FORM 17-Q QUARTERLY REPORT PURSUANT TO SECTION 17 OF THE SECURITIES REGULATION CODE AND SRC RULE 17(2)(b) THEREUNDER 1. For the quarterly period ended : June 30,
INTEGRATED ANNUAL & SUSTAINABILITY REPORT BANK OF THE PHILIPPINE ISLANDS. P-P Financial Statements.indd 66
 66 2013 INTEGRATED ANNUAL & SUSTAINABILITY REPORT BANK OF THE PHILIPPINE ISLANDS P-P Financial Statements.indd 66 4/8/14 7:11 PM BANK OF THE PHILIPPINE ISLANDS 2013 INTEGRATED ANNUAL & SUSTAINABILITY REPORT
The First Nationwide Assurance Corporation
 The First Nationwide Assurance Corporation Financial Statements with Supplementary Information by Operation December 31, 2015 and 2014 and Independent Auditors' Report SyCip Gorres Velayo & Co. 6760 Ayala
MAA General Assurance Philippines, Inc.
 MAA General Assurance Philippines, Inc. Financial Statements December 31, 2013 and 2012 and Independent Auditors Report SyCip Gorres Velayo & Co. 6760 Ayala Avenue 1226 Makati City Philippines Tel: (632)
Philippine Veterans Bank and Subsidiaries Financial Statements December 31, 2009 and 2008 and Independent Auditors Report SyCip Gorres Velayo & Co.
 Philippine Veterans Bank and Subsidiaries Financial Statements December 31, 2009 and 2008 and Independent Auditors Report SyCip Gorres Velayo & Co. SyCip Gorres Velayo & Co. 6760 Ayala Avenue 1226 Makati
BAC BAHAMAS BANK LIMITED
 Financial Statements of BAC BAHAMAS BANK LIMITED BAC BAHAMAS BANK LIMITED Financial Statements Page Independent Auditors Report 1-2 Statement of Financial Position 3 Statement of Comprehensive Income 4
Malayan Insurance Co., Inc.
 Malayan Insurance Co., Inc. Parent Company Financial Statements December 31, 2015 and 2014 and Independent Auditors Report SyCip Gorres Velayo & Co. 6760 Ayala Avenue 1226 Makati City Philippines Tel:
MULTICARE PHARMACEUTICALS PHILIPPINES, INC. (A Subsidiary of Lupin Holdings, B.V.)
") MULTICARE PHARMACEUTICALS PHILIPPINES, INC. (A Subsidiary of Lupin Holdings, B.V.) Financial Statements March 31, 2018 and 2017 and Independent Auditors Report 26 th Floor, Rufino Tower Building, 6784
MULTICARE PHARMACEUTICALS PHILIPPINES, INC. (A Subsidiary of Lupin Holdings, B.V.) Financial Statements March 31, 2018 and 2017 and Independent Auditors Report 26 th Floor, Rufino Tower Building, 6784
MEDIATEK INC. PARENT COMPANY ONLY BALANCE SHEETS
 PARENT COMPANY ONLY BALANCE SHEETS As of 2013, and January 1, (Amounts in thousands of New Taiwan Dollars) ASSETS Notes 2013 % % January 1, % Current assets Cash and cash equivalents 4, 6(1) $ 53,710,940
 GRAND PLAZA HOTEL CORPORATION FINANCIAL STATEMENTS December 31, 2015, 2014 and 2013 GRAND PLAZA HOTEL CORPORATION STATEMENTS OF FINANCIAL POSITION ASSETS December 31 Note 2015 2014 Current Assets Cash
CARD MRI Information Technology, Inc.
 CARD MRI Information Technology, Inc. Financial Statements December 31, 2015 and 2014 and Independent Auditors Report SyCip Gorres Velayo & Co. 6760 Ayala Avenue 1226 Makati City Philippines Tel: (632)
 MABUHAY VINYL CORPORATION AND SUBSIDIARY SELECTED NOTES TO UNAUDITED INTERIM CONSOLIDATED FINANCIAL STATEMENTS (ANNEX B) For the Third Quarter and Nine Months Ended September 30, 2017 (Amounts in Thousands,
SOCResources, Inc. (Formerly South China Resources, Inc.)
") SOCResources, Inc. (Formerly South China Resources, Inc.) Parent Company Financial Statements December 31, 2014 and 2013 and Independent Auditors Report SyCip Gorres Velayo & Co. 6760 Ayala Avenue 1226
SOCResources, Inc. (Formerly South China Resources, Inc.) Parent Company Financial Statements December 31, 2014 and 2013 and Independent Auditors Report SyCip Gorres Velayo & Co. 6760 Ayala Avenue 1226
LUPIN PHILIPPINES, INC. (A Wholly Owned Subsidiary of Lupin Holdings, B.V.)
") LUPIN PHILIPPINES, INC. (A Wholly Owned Subsidiary of Lupin Holdings, B.V.) Financial Statements March 31, 2017 and 2016 and Independent Auditors Report 1135 Chino Roces Avenue, Makati City, Philippines
LUPIN PHILIPPINES, INC. (A Wholly Owned Subsidiary of Lupin Holdings, B.V.) Financial Statements March 31, 2017 and 2016 and Independent Auditors Report 1135 Chino Roces Avenue, Makati City, Philippines
 PETRON CORPORATION AND SUBSIDIARIES SELECTED NOTES TO THE CONSOLIDATED INTERIM FINANCIAL STATEMENTS (Amounts in Million Pesos, Except Par Value, Number of Shares and Per Share Data, Exchange Rates and
 MERALCO EMPLOYEES MUTUAL AID AND BENEFIT ASSOCIATION, INC. A Non-stock, Non-profit Organization Notes to Financial Statements As at and for the years ended December 31, 2017 and 2016 1. ASSOCIATION INFORMATION
C O V E R S H E E T. for AUDITED FINANCIAL STATEMENTS A R A N E T A P R O P E R T I E S, I N C. 2 1 S T F L O O R, C I T I B A N K T O W E R, P A
 C O V E R S H E E T for AUDITED FINANCIAL STATEMENTS SEC Registration Number 0 0 0 0 1 5 2 2 4 9 C O M P A N Y N A M E A R A N E T A P R O P E R T I E S, I N C. PRINCIPAL OFFICE ( No. / Street / Barangay
BANK OF THE PHILIPPINE ISLANDS. Statement of Management s Responsibility for Financial Statements
 Statement of Management s Responsibility for Financial Statements 50 Independent Auditor s Report To the Board of Directors and Stockholders of Bank of the Philippine Islands BPI Building, Ayala Avenue
CARD Pioneer Microinsurance Inc.
 CARD Pioneer Microinsurance Inc. Financial Statements December 31, 2014 and 2013 and Independent Auditors Report SyCip Gorres Velayo & Co. 6760 Ayala Avenue 1226 Makati City Philippines Tel: (632) 891
BotiCARD Inc. Financial Statements December 31, 2013 and 2012 and Years Ended December 31, 2013 and and. Independent Auditors Report
 [ BotiCARD Inc. Financial Statements December 31, 2013 and 2012 and Years Ended December 31, 2013 and 2012 and Independent Auditors Report SyCip Gorres Velayo & Co. 6760 Ayala Avenue 1226 Makati City Philippines
C O V E R S H E E T. for AUDITED FINANCIAL STATEMENTS I N T E R N A T I O N A L F A M I L Y F O O D S E R V
 C O V E R S H E E T for AUDITED FINANCIAL STATEMENTS SEC Registration Number 5 4 6 6 6 C O M P A N Y N A M E I N T E R N A T I O N A L F A M I L Y F O O D S E R V I C E S, I N C. PRINCIPAL OFFICE ( No.
LUPIN PHILIPPINES, INC. (A Wholly Owned Subsidiary of Lupin Holdings, B.V.)
") LUPIN PHILIPPINES, INC. (A Wholly Owned Subsidiary of Lupin Holdings, B.V.) Financial Statements March 31, 2018 and 2017 and Independent Auditors Report 1135 Chino Roces Avenue, Makati City, Philippines
LUPIN PHILIPPINES, INC. (A Wholly Owned Subsidiary of Lupin Holdings, B.V.) Financial Statements March 31, 2018 and 2017 and Independent Auditors Report 1135 Chino Roces Avenue, Makati City, Philippines
1 ST CHOICE SAVINGS AND CREDIT UNION LTD.
 Financial Statements of 1 ST CHOICE SAVINGS AND CREDIT UNION LTD. MANAGEMENT'S RESPONSIBILITY FOR FINANCIAL REPORTING The financial statements of 1 st Choice Savings and Credit Union Ltd. and all other
Universal Investment Bank AD Skopje. Financial Statements for the year ended 31 December 2010
 for the year ended 31 December 2010 Contents Independent Auditors' report Statement of financial position 1 Statement of comprehensive income 2 Statement of changes in equity 3 Statement of cash flows
October 12, PHILIPPINE STOCK EXCHANGE 3 rd Floor Philippine Stock Exchange Plaza Ayala Triangle, Ayala Avenue Makati City.
 3/L Starmall Las Piñas, CV Starr Avenue, Pamplona, Las Piñas City 1746 UGF Worldwide Corporate Center, Shaw Boulevard, Mandaluyong City 1552 Tel. No. (+632) 532 0605 / (+632) 871 4001 Fax No. (+632) 872
INDUSTRIAL AND COMMERCIAL BANK OF CHINA (CANADA)
") Financial Statements of INDUSTRIAL AND COMMERCIAL BANK OF CHINA (CANADA) KPMG LLP Telephone (416) 777-8500 Chartered Accountants Fax (416) 777-8818 Bay Adelaide Centre Internet www.kpmg.ca 333 Bay Street
Financial Statements of INDUSTRIAL AND COMMERCIAL BANK OF CHINA (CANADA) KPMG LLP Telephone (416) 777-8500 Chartered Accountants Fax (416) 777-8818 Bay Adelaide Centre Internet www.kpmg.ca 333 Bay Street
8990 Holdings, Inc. and Subsidiaries
 8990 Holdings, Inc. and Subsidiaries Consolidated Financial Statements December 31, 2014 and 2013 and Independent Auditors' Report A member firm of Ernst & Young Global Limited SyCip Gorres Velayo & Co.
MANDARIN ORIENTAL INTERNATIONAL LIMITED. Preliminary Financial Statements for the year ended 31st December 2017
 MANDARIN ORIENTAL INTERNATIONAL LIMITED Preliminary Financial Statements for the year ended 31st December 2017 Consolidated Profit and Loss Account for the year ended 31st December 2017 2017 2016 Underlying
PHILEQUITY MONEY MARKET FUND, INC. (An Open-End Mutual Fund Company)
") PHILEQUITY MONEY MARKET FUND, INC. (An Open-End Mutual Fund Company) Financial Statements December 31, 2006 and 2005 and Years Ended December 31, 2006, 2005 and 2004 and Independent Auditors Report COVER
PHILEQUITY MONEY MARKET FUND, INC. (An Open-End Mutual Fund Company) Financial Statements December 31, 2006 and 2005 and Years Ended December 31, 2006, 2005 and 2004 and Independent Auditors Report COVER
Notes to the Consolidated Financial Statements (Amount in millions of Renminbi, unless otherwise stated)
") (Amount in millions of Renminbi, unless otherwise stated) I GENERAL INFORMATION AND PRINCIPAL ACTIVITIES Bank of China Limited (the Bank ), formerly known as Bank of China, a State-owned joint stock commercial
(Amount in millions of Renminbi, unless otherwise stated) I GENERAL INFORMATION AND PRINCIPAL ACTIVITIES Bank of China Limited (the Bank ), formerly known as Bank of China, a State-owned joint stock commercial
Asia Insurance (Philippines) Corporation. Financial Statements As at and for the years ended December 31, 2012 and 2011
 Corporation. Financial Statements As at and for the years ended December 31, 2012 and 2011") Asia Insurance (Philippines) Corporation Financial Statements As at and for the years ended December 31, 2012 and 2011 Asia Insurance (Philippines) Corporation Statements of Financial Position December
Asia Insurance (Philippines) Corporation Financial Statements As at and for the years ended December 31, 2012 and 2011 Asia Insurance (Philippines) Corporation Statements of Financial Position December
SEDPI Capital Credit, Inc. Financial Statements December 31, 2011 and and. Independent Auditors Report. SyCip Gorres Velayo & Co.
 SEDPI Capital Credit, Inc. Financial Statements December 31, 2011 and 2010 and Independent Auditors Report SyCip Gorres Velayo & Co. COVER SHEET C S 2 0 0 8 0 3 7 2 5 SEC Registration Number S E D P I
NHN ENTERTAINMENT CORPORATION. Condensed Separate Interim Financial Statements
 NHN ENTERTAINMENT CORPORATION Condensed Separate Interim Financial Statements (With Independent Auditors Review Report Thereon) Contents Page Independent Auditors Review Report 1 Condensed Separate Statement
Alpha Bank AD Skopje. Financial Statements for the year ended 31 December 2007
 for the year ended 31 December 2007 Contents Auditors' report Balance sheet 2 Income statement 3 Statement of changes in equity 4 Statement of cash flows 5 Notes to the financial statement 6 Balance sheet
Kuwait Telecommunications Company K.S.C.P. Financial Statements and Independent Auditors Report for the year ended 31 December 2014
 Financial Statements and Independent Auditors Report 1 Contents Page Independent auditors report 1-2 Statement of financial position 3 Statement of profit or loss and comprehensive income 4 Statement of
QNB ALAHLI S.A.E (Egyptian Joint Stock Company) Consolidated Financial Statements Together With Limited Review Report
 Consolidated Financial Statements Together With Limited Review Report") (Egyptian Joint Stock Company) Consolidated Financial Statements Together With Limited Review Report For The Period Ended June 30, 2018 KPMG Hazem Hassan Public Accountants & Consultants Allied for Accounting
(Egyptian Joint Stock Company) Consolidated Financial Statements Together With Limited Review Report For The Period Ended June 30, 2018 KPMG Hazem Hassan Public Accountants & Consultants Allied for Accounting
Financial Statements and Independent Auditors' Report. Universal Investment Bank AD, Skopje. 31 December 2013
 Financial Statements and Independent Auditors' Report Universal Investment Bank AD, Skopje 31 December 2013 Universal Investment Bank, AD Skopje Contents Page Independent Auditors Report 1 Statement of
Notes to the Consolidated Financial Statements (Amount in millions of Renminbi, unless otherwise stated)
") Notes to the Consolidated Financial Statements (Amount in millions of Renminbi, unless otherwise stated) I GENERAL INFORMATION AND PRINCIPAL ACTIVITIES Bank of China Limited (the Bank ), formerly known
Notes to the Consolidated Financial Statements (Amount in millions of Renminbi, unless otherwise stated) I GENERAL INFORMATION AND PRINCIPAL ACTIVITIES Bank of China Limited (the Bank ), formerly known
C O V E R S H E E T. for AUDITED FINANCIAL STATEMENTS L I B E R T Y F L O U R M I L L S, I N C. A N D. 7 F L i b e r t y B u i l d i n g, A.
 C O V E R S H E E T for AUDITED FINANCIAL STATEMENTS SEC Registration Number 1 4 7 8 2 C O M P A N Y N A M E L I B E R T Y F L O U R M I L L S, I N C. A N D S U B S I D I A R I E S PRINCIPAL OFFICE ( No.
TOP FRONTIER INVESTMENT HOLDINGS, INC. AND SUBSIDIARIES. PRO FORMA CONSOLIDATED FINANCIAL STATEMENTS August 31, 2013 and December 31, 2012
 TOP FRONTIER INVESTMENT HOLDINGS, INC. AND SUBSIDIARIES PRO FORMA CONSOLIDATED FINANCIAL STATEMENTS August 31, 2013 and December 31, 2012 kpmg Manabat Sanagustin & Co., CPAs Telephone +63 (2) 885 7000