KEY FINANCIAL METRICS & DASHBOARD REPORTING FOR HIGHER EDUCATION INSTITUTIONS 1/26/2016. January 26, Adam Smith Director
|
|
|
- Amice Nelson
- 5 years ago
- Views:
Transcription


1 KEY FINANCIAL METRICS & DASHBOARD REPORTING FOR HIGHER EDUCATION INSTITUTIONS January 26, 2016 Jim Creeden Partner Adam Smith Director 1
2 TO RECEIVE CPE CREDIT Participate in entire webinar Answer polls when they are provided If you are viewing this webinar in a group Complete group attendance form with Title & date of live webinar Your company name Your printed name, signature & address All group attendance sheets must be submitted to training@bkd.com within 24 hours of live webinar Answer polls when they are provided If all eligibility requirements are met, each participant will be ed their CPE certificates within 15 business days of live webinar GOALS FOR TODAY Importance of Financial Metrics & Ratio Analysis Review & Evaluate Key Financial Metrics & Ratios Composite Financial Index (CFI) & Linkage to Strategic Planning Presenting Results in Dashboards 2

3 FINANCIAL METRIC & RATIO ANALYSIS Why important? Recent economic factors & industry pressures Transparency Accountability Identification of financial risks Method of communication to stakeholders Risk with peer comparisons Apples vs. oranges? MOODY S & S&P RATING CONSIDERATIONS Four broad factors in assessing ratings Market profile Operating performance Wealth & liquidity Leverage Self-assessment & benchmarking 3

4 MOODY S & S&P RATING CONSIDERATIONS Positive indicators of self-assessment & benchmarking Identification of key performance indicators Monitoring of key performance indicators Examples of leadership actions based on performance relative to key indicators Comparison to carefully selected set of peers 4
5 Resource Sufficiency & Liquidity Ratios RATIO/METRIC Primary reserve ratio Monthly/annual days of cash on hand Monthly/annual liquidity Expendable financial resources Monthly/annual liquidity to demand debt OVERALL OBJECTIVES Sufficient amount of funds to meet current & future operating & capital requirements Ability to achieve & sustain a level of resources sufficient to realize mission Insight about capacity to manage through stress Operating flexibility Primary Reserve Ratio Calculation Compares expendable net assets to total expenses Private Institution Public Institution Snapshot of financial strength & flexibility Indicates how long institution can function using expendable reserves without relying on additional net assets generated by operations Expendable Net Assets Expendable net assets plus FASB CU expendable net assets Assets that could be access quickly to spend to satisfy obligations Helps understand affordability of strategic plans Total Expenses Total expenses plus FASB CU total expenses 5
6 Primary Reserve Represents a sample of 40 Midwest based private institutions Monthly/Annual Days of Cash On Hand Measure number of days an institution is able to operate from unrestricted liquidity within one month & one year Measure of operating flexibility & cushion Highly correlated with Moody s ratings Monthly/Annual Liquidity X 365 Total expenses less: Deprecation Other large noncash expenses 6
7 Days of Cash on Hand Represents a sample of 40 Midwest based private institutions Monthly/Annual Liquidity Distinguishing between wealth & liquidity Takes into account donor restrictions, accounting rules, investment strategies, etc. Assess how much liquidity to meet large unexpected payments, demand or accelerated payments on debt Funds available within one month (one year) Consists of unrestricted operating accts or Other non-endowment unrestricted funds Lesser of Funds available within one month (one year) in endowment or other long-term funds or Unrestricted Board Designated Endowment as presented in footnotes or self-reported (public institutions) 7
8 Expendable Financial Resources Indicates amount of net assets spendable in long run Total unrestricted & temporarily restricted net assets Long-term debt, less net investment in plant Expendable Financial Resources to Direct Debt Represents a sample of 40 Midwest-based private institutions 8
9 Monthly/Annual Liquidity to Demand Debt Liquidity available to cover outstanding demand debt Monthly/Annual Liquidity Measure Demand Debt: All VRDOs Commercial Paper Put Bonds Outstanding Lines of Credit Loans or private placements with put features (Excludes regularly scheduled principal maturities) Operating Metrics RATIO/METRIC Net operating revenues ratio Cash income ratio Net tuition dependency Net tuition per student FTE ratio Deferred maintenance ratio Operating income ratio OVERALL OBJECTIVES Sufficient amount of funds to meet current & future operating & capital requirements Ability to achieve & sustain resources Insight about capacity to manage through stress Operating flexibility 9
10 Net Operating Revenues Ratio Indicates whether total unrestricted activities resulted in surplus or deficit Private Public Living within means? Positive & higher ratio show stronger performance as a result of year s activities Pattern of large deficits or surpluses can be revealing Excess (deficiency) of unrestricted operating revenues over unrestricted operating expenses Total unrestricted operating revenue Operating income (Loss) plus net nonoperating revenues (expenses) plus FASB CU change in unrestricted net assets Operating revenues plus non-operating revenues plus FASB CU total unrestricted revenue Cash Income Ratio Good indication of an institution s liquidity A higher ratio provides institution with a greater amount of flexibility in its operations Private Net cash provided by operating activities Public Cash provided from operations plus cash received from appropriations for operating purposes plus gifts & grants for operating purposes plus FASB CU net cash provided by operating activities Total unrestricted income excluding gains or losses Operating revenues plus appropriations revenues for operating purposes plus gifts & grants revenues for operating purposes plus FASB CU total unrestricted income, excluding gains & losses 10
11 Operating Income Ratio Demonstrates extent to which current-year activities have contributed to overall operations Measures institutional selfsufficiency Highlights variability of this source of income & need to maintain quality & market demand All Operating income (excludes investment income, contributions, net assets released from restrictions) Educational & general expenses Deferred Maintenance Ratio Calculation Increasing ratio is an indicator of growing deferred maintenance & an aging plant A decline in this ratio must be viewed in context of other issues affecting institution, such as large investments in new facilities Private Outstanding maintenance requirements Expendable net assets Public Outstanding maintenance requirements Expendable net assets plus FASB CU expendable net assets 11
12 Net Tuition Dependency Ratio Dependency on tuition & fees All Shows relative importance of revenue stream An increasing trend or over dependence isn t desirable Net Tuition Total Revenue (Includes investment return) Net Tuition Per Student FTE Ratio Analyzed with view of tuition discounting & aid All Increases show generating more per student Net tuition Full-time equivalent students 12
13 Asset Performance Ratio/Metric Return on net assets Capitalization ratio Composition of equity ratio Overall Objectives Is net asset growth sufficient? Capitalization provide flexibility? Right type of net asset growth to achieve objectives Sufficiently invested in financial assets Return on Net Assets Ratio Measure of whether or not institution s resources are growing Decline in this ratio may be appropriate if it reflects a strategy that will better fulfill institution s mission Improving trend Institution is increasing net assets Can set aside resources to strengthen future financial flexibility Private Change in net assets Total net assets Public Change in net assets plus FASB CU change in net assets Total net assets plus FASB CU total net assets 13
14 Capitalization Ratio Determines financial flexibility on an accumulated return basis A high capitalization implies Financing flexibility May not be leveraging assets & too much invested in physical assets Modified Net Assets Modified Total Assets Composition of Equity Ratio Reveals allocation of equity among different types of assets primarily physical & financial Stronger institutions typically have a ratio in excess of 1 Equilibrium of investment for institution tradeoffs between investment for current generation vs. investment for future generation Financial Assets (All assets expect PP&E) Physical assets 14
15 Debt Management & Capital Ratio/Metric Viability ratio Debt burden ratio Debt service coverage ratio Age of facility Interest burden Overall Objectives Managing debt strategically? How much debt can be afforded? Methods for accessing additional resources to support mission & objectives Viability Ratio Indicates availability of resources to cover debt Private Public Generally a ratio range of 1.25x to 2.0x indicates a strong creditworthy institution Expendable net assets Plant-related debt Expendable net assets plus FASB CU expendable net assets Plant-related debt plus FASB CU plant-related debt 15
16 Debt Burden Ratio Calculation Primarily measures likelihood that you can repay your existing loans The higher the debt burden ratio, less of your income is disposable Private Debt service Total expenditures Public Debt service plus FASB CU debt service Total expenditures plus FASB CU total expenditures Debt Service Coverage Ratio Amount of cash flow available to meet annual interest & payments on debt Comfort level that institution has income to cover debt burden DSR of less than 1 means a negative cash flow Private Adjusted change in unrestricted net assets from operations Debt service Public Net operating income plus nonoperating revenues plus interest expense plus depreciation plus FASB CU adjusted change in net assets Debt service plus CU debt service 16
17 Age of Facilities Ratio Calculation Provides rough sense of aging of facilities & potential need for future resources to be invested into facilities Private Public Low ratio Generally good Indicates recent investment in plant Intangible asset Accumulated depreciation Accumulated depreciation plus FASB CU accumulated depreciation High ratio Generally not good Indicates deferred reinvestment in plant Will require significant expenditures in future Unrecorded liability Depreciation expense Depreciation expense plus FASB CU depreciation expense Age of Facilities Represents a sample of 40 Midwest-based private institutions 17
18 Interest Burden Calculation Target range should be no greater than 5% - 6% Private Public Principal is excluded from this ratio Interest expense Interest expense plus FASB CU interest expense More useful in perpetual debt structure Total expenditures Total expenditures plus FASB CU total expenditures COMPOSITE FINANCIAL INDEX Developed by KPMG & Prager McCarthy and Sealy, LLC in late 1990s Developed specifically for higher education institutions Widely accepted set of ratios & overall measurement of financial health Four core ratios Primary reserve ratio Net operating revenues ratio Return on net assets ratio Viability ratio 18
19 COMPOSITE FINANCIAL INDEX Four ratios weighted & scored on scale Creates single score of financial health Single score allows weakness in one ratio to be offset by strength in another ratio Ratios computed Converted to strength factor Factors weighted Four numbers totaled CFI THOUGHTS & IMPLICATIONS Scores do not have precision Indicators of ranges of financial health Best served calculated over time period Does not include a deferred maintenance factor Provides opportunity for constant assessment of institutional performance Stated graphically 19
20 CFI SCALE Scale for Converting Core Ratios to Strength Factors SCORING SCALE Primary Reserve Ratio 0.133x.4x 1.33x Net Operating Revenues Ratio: Private 0.7% 2% 7% Public 1.3% 4% 13% Return on Net Assets Ratio 2.0% 6% 20% Viability Ratio 0.417% 1.25x 4.17x 20
21 Weighting Patterns with with Ratio Long-Term Debt No Long-Term Debt Primary Reserve 35% 55% Net Operating Revenues 10% 15% Return on Net Assets 20% 30% Viability Ratio 35% -- Peer Institution Profile Used for Analysis Liberal arts institutions Non-urban setting Enrollment approximately 1,300 21
22 CFI Scores for Peer Ratio Primary reserve Return on net assets Net operating revenue ratio Viability CFI Score Graphic Financial Profile PRIMARY RESERVE RATIO RETURN ON NET ASSETS RATIO NET OPERATING REVENUE RATIO 3 10 VIABILITY RATIO 22
23 2015 Graphic Financial Profile CFI SCALE 3 year average
24 Linking Mission to Strategic & Other Plans Institutional Mission Strategic Plan (Goals, Strategies, Key Metrics) Institution Risk Management Summary Institution Wide Plans (Academic, Research, Facilities, Operating & Capital Budgets, etc.) Institutional Academic & Administrative Processes INSTITUTION-WIDE STRATEGIC FINANCIAL QUESTIONS How does institution evaluate & address Financial risks Operating Capital What is institution s liquidity & how does it affect operations? Is debt used strategically? Are financial resources allocated to support institutional strategies? What is institution s overall financial health? 24

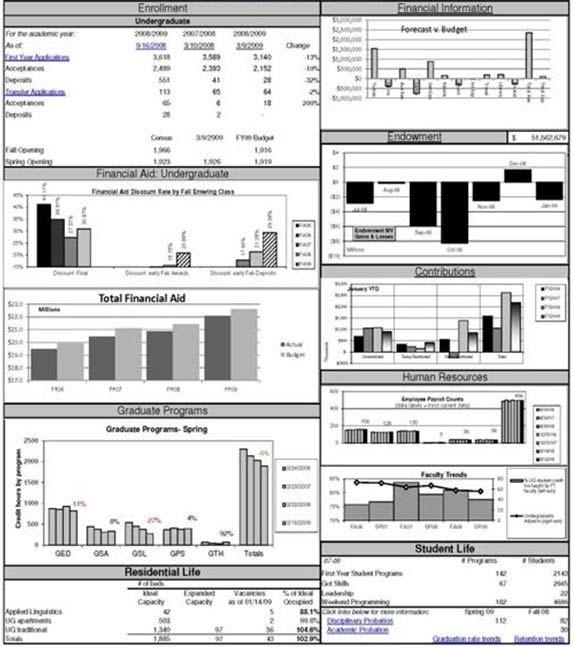
25 Benefits of Dashboard Reporting Dashboard popularity continues to rise Provides efficiency in analysis vs. spreadsheets & reports Identify trends more easily & efficiently Simple way to line up goals/strategies to performance Dashboard Example 25
26 Finance Dashboard Example Advancement Endowment Market Value Endowment Market Value in millions 8.3 Change in Endowment Total Gifts and Grants 7.50% 40% 7.50% 37% -8.40% 37% Faculty Spending Rate 5.00% 5.00% Student/Faculty 5.00% 12:1 11.6:1 Donor-Supported Aid 11: % 17.60% Alumni Participation 17.60% 93% 89% Annual Operating Margin 89% 2.80% 2.80% 1.30% 0% 4% Return on Net Assets 4% 7.30% 7.30% -5.70% Key: Current Value Direction of change Importance of change Highest value for past 5 years 22% higher blue =better 20% lower red =worse Lowest value for past 5 year 2% no change Dashboard Example Strategic Direction yr change 1 yr goal 5 yr trend 5 yr goal FT degree enrollment Down Up Net tuition per FTE Up Up Net tuition dependency Up Up CFI Down Up Days of cash on hand Down Up Debt Burden Ratio Up Up/Up Expendable Financial Resources Up Age of Facilities Down Up Endowment per FTE Down Up Primary Reserve Ratio Up Up 26

27 Moody s 27
 CREDITS BKD, LLP is registered with the National Association of State Boards of Accountancy (NASBA) as a sponsor of continuing professional education on the")
28 QUESTIONS? CONTINUING PROFESSIONAL EDUCATION (CPE) CREDITS BKD, LLP is registered with the National Association of State Boards of Accountancy (NASBA) as a sponsor of continuing professional education on the National Registry of CPE Sponsors. State boards of accountancy have final authority on the acceptance of individual courses for CPE credit. Complaints regarding registered sponsors may be submitted to the National Registry of CPE Sponsors through its website: The information in BKD webinars is presented by BKD professionals, but applying specific information to your situation requires careful consideration of facts & circumstances. Consult your BKD advisor before acting on any matters covered in these webinars. 28
29 CPE CREDIT CPE credit may be awarded upon verification of participant attendance For questions, concerns or comments regarding CPE credit, please BKD Learning & Development Department at THANK YOU! FOR MORE INFORMATION Jim Creeden // Adam Smith // 29

30 30
USE OF FINANCIAL RATIOS IN COMMUNITY COLLEGE INSTITUTIONAL RESEARCH
 USE OF FINANCIAL RATIOS IN COMMUNITY COLLEGE INSTITUTIONAL RESEARCH David Case Vice President for Institutional Research & Effectiveness East Central Community College Decatur, MS WHAT IS A FINANCIAL RATIO?
University of Maine System and Component Units. Core Financial Ratios and Composite Financial Index. FY10 and FY11
 University of Maine System Office of Finance and Treasurer January 2012 TABLE OF CONTENTS Page Introduction 1 Component Units 1 Primary Reserve Ratio 2 Net Operating Revenues Ratio 3 Return on Net Assets
Prepared by the Office of the Treasurer
 Prepared by the Office of the Treasurer The Board s Role in Financial Oversight The Board of Trustees is tasked with financial oversight of the College. The Association of Governing Boards of Universities
University of Maine System and Component Units. Core Financial Ratios and Composite Financial Index. FY10 to FY12
 University of Maine System Office of Finance and Treasurer January 2013 TABLE OF CONTENTS Page Introduction 1 Component Units 1 Primary Reserve Ratio 2 Net Operating Revenues Ratio 3 Return on Net Assets
Financial Ratios and Trends
 Financial s and Trends (2008 2013) Mississippi Institutions of Higher Learning Office of Finance and Administration 3825 Ridgewood Road, Jackson, Mississippi 39211 (601) 432-6561 Are resources sufficient
Financial Ratios and Trends
 Financial s and Trends (2011 2016) Mississippi Institutions of Higher Learning Office of Finance and Administration 3825 Ridgewood Road, Jackson, Mississippi 39211 (601) 432-6316 Are resources sufficient
Financial Ratios and Trends
 Financial s and Trends (2010 2015) Mississippi Institutions of Higher Learning Office of Finance and Administration 3825 Ridgewood Road, Jackson, Mississippi 39211 (601) 432-6316 Are resources sufficient
Annual Financial Assessment Higher Learning Commission Financial Ratios
 Annual Financial Assessment Higher Learning Commission Financial Ratios Financial ratios can be useful tools for measuring and analyzing financial performance, understanding and communicating financial
READY TO ROLL WITH THE NEW NFP REPORTING STANDARD? 7/19/2017. July 19, Dustin Haywood Director
 READY TO ROLL WITH THE NEW NFP REPORTING STANDARD? July 19, 2017 Kieth McGovern Director kmcgovern@bkd.com Dustin Haywood Director dhaywood@bkd.com 1 TO RECEIVE CPE CREDIT Participate in entire webinar
REVISED FY 2009 ASSESSMENT OF FINANCIAL STRENGTH ARIZONA STATE UNIVERSITY NORTHERN ARIZONA UNIVERSITY THE UNIVERSITY OF ARIZONA. REVISED March 5, 2010
 REVISED FY 2009 ASSESSMENT OF FINANCIAL STRENGTH OF ARIZONA STATE UNIVERSITY NORTHERN ARIZONA UNIVERSITY THE UNIVERSITY OF ARIZONA REVISED March 5, 2010 This document may be accessed at www.azregents.edu
University of Maine at Presque Isle. Core Financial Ratios and Composite Financial Index FY06 to FY10
 Core Financial s and Composite Financial Index University of Maine System Office of Finance and Treasurer January 2011 TABLE OF CONTENTS Page Introduction 1 Primary Reserve 2 Net Operating Revenues 4 Return
University of Southern Maine Core Financial Ratios and Composite Financial Index FY06 to FY11
 Core Financial s and Composite Financial Index University of Maine System Office of Finance and Treasurer January 2012 TABLE OF CONTENTS Page Introduction 1 Primary Reserve 2 Net Operating Revenues 4 Return
South Dakota Board of Regents University Financial Ratios
 ATTACHMENT I 3 South Dakota Board of Regents University Financial Ratios This report provides key financial ratios for 2007 through 2011 for all of the South Dakota public universities. The ratio calculations
University of Maine System Office of Finance and Treasurer January Report on Core Financial Ratios and Composite Financial Index
 University of Maine System Office of Finance and Treasurer January 2018 on Core Financial Ratios and Composite Financial Index This page intentionally left blank. TABLE OF CONTENTS Overview 1 Primary Reserve
KEY FINANCIAL PERFORMANCE INDICATORS
 KEY FINANCIAL PERFORMANCE INDICATORS Strategic Financial Management Fiscal Health Key Financial Indicators Reserves Strategy Operating Performance Return on Financial Resources Debt & Investment Management
University of Southern Maine Core Financial Ratios and Composite Financial Index FY06 to FY12
 Core Financial s and Composite Financial Index University of Maine System Office of Finance and Treasurer January 2013 TABLE OF CONTENTS Page Introduction 1 Primary Reserve 2 Net Operating Revenues 4 Return
University of Maine System Office of Finance and Treasurer January Report on Core Financial Ratios and Composite Financial Index
 University of Maine System Office of Finance and Treasurer January 2018 on Core Financial Ratios and Composite Financial Index TABLE OF CONTENTS Overview 1 Primary Reserve Ratio 2 Net Operating Revenues
University of Maine at Presque Isle. Core Financial Ratios and Composite Financial Index FY06 to FY13
 University of Maine at Presque Isle Core Financial s and Composite Financial Index FY06 to FY13 University of Maine System Office of Finance and Treasurer January 2014 TABLE OF CONTENTS Change in Terminology
Prepared by the Office of the Treasurer
 Prepared by the Office of the Treasurer Strategic Financial Management TCNJ s leadership emphasizes long-term fiscal sustainability in its operational and resource allocation decisions. In analyzing and
Minnesota State University, Mankato Fiscal Year 2016 Financial Trends and Highlights
 Minnesota State University, Mankato Fiscal Year 2016 Financial Trends and Highlights Without GASB 68 (Unfunded Pension Liabilities) Per Full Year Equivalent Student Data Composite Financial Index Benchmark
Financial analysis. Using financial statements to measure performance at. Michigan State University. MSU s financial statements Analyzing performance
 Financial analysis Using financial statements to measure performance at Michigan State University MSU s financial statements Analyzing performance Professor Kirt C. Butler Department of Finance Broad College
Composite Financial Index*
 Composite Financial Index* The composite financial index (CFI) is a measure of financial health used widely throughout higher education. It relies on information from audited financial statements and utilizes
Annual Financial Statement Analysis FY
 Annual Financial ment Analysis FY 2010-2014 Finance and Administration Committee January 15, 2015 Page F-21 Purpose Overview Provide information on the financial health of the university, including key
FINANCIAL HOW TO ASSESS AND ENHANCE. Larry L. Orsini, and Brenda M. Snow
 HOW TO ASSESS AND ENHANCE FINANCIAL HEALTHBy Lawrence Saint Bonaventure uses a ratio analysis based on a composite financial index to communicate financial strengths and weaknesses and carry out the strategic
UPDATE TO THE 7TH EDITION OF STRATEGIC FINANCIAL ANALYSIS IN HIGHER EDUCATION SUMMER 2016
 UPDATE TO THE 7TH EDITION OF STRATEGIC FINANCIAL ANALYSIS IN HIGHER EDUCATION SUMMER 2016 1 UPDATE TO THE 7TH EDITION OF STRATEGIC FINANCIAL ANALYSIS IN HIGHER EDUCATION UPDATE TO THE 7TH EDITION OF STRATEGIC
Fiscal Analysis Including the Composite Financial Index: A Tale of Two Universities
 Fiscal Analysis Including the Composite Financial Index: A Tale of Two Universities Presented By: Mary H. Loomis, CPA, MPA Vice President for Business & Finance Why use ratios? Ratios are important for
Multiemployer Pension Plans Preparation for New Disclosures December 6, 2012
 Multiemployer Pension Plans Preparation for New Disclosures December 6, 2012 Mark Prouhet, CPA Senior Manager St. Louis mprouhet@bkd.com To Receive CPE Credit Participate in entire webinar Answer polls
ARIZONA UNIVERSITY SYSTEM FY 2005 FINANCIAL RATIO ANALYSIS
 Board policy 3-410 requires each university to provide the Arizona Board of Regents with audited annual financial reports and a ten-year ratio analysis of selected data from the financial reports. With
Alan Taylor. Partner Bowling Green, KY BKD, LLP.
 ESOPs: Creating a Legacy June 28, 2012 Alan Taylor Partner Bowling Green, KY BKD, LLP ataylor@bkd.com To Receive CPE Credit Participate in entire webinar Answer polls when they are provided If you are
Navigating Guidance on Grants & Contributions How ASU Is Impacting Not-for-Profit Entities
 Navigating Guidance on Grants & Contributions How ASU 2018-08 Is Impacting Not-for-Profit Entities October 16, 2018 To Receive CPE Credit Individuals Participate in entire webinar Answer polls when they
Westfield State University number 0480 Policy concerning: page 1 of 5
 Policy concerning: page 1 of 5 I. GOALS AND OBJECTIVES DEBT The goal of this policy is to present guidelines for the management of Westfield State University s debt portfolio. For purposes of this policy,
Wright State University Financial Governance Policy DRAFT v.1 With Comments March 31, 2017
 Wright State University Financial Governance Policy DRAFT v.1 With Comments March 31, 2017 A. Overview Wright State University is committed to transforming the lives of its students and the communities
TAX POLICY & CHARITABLE GIVING
 TAX POLICY & CHARITABLE GIVING October 5, 2017 Joyce Dulworth, CPA Partner jdulworth@bkd.com Una Osili Associate Dean for Research & International Programs Lilly Family School of Philanthropy uosili@iupui.edu
Five-Year Financial Analysis Mary H. Loomis, CPA, MPA Assistant Vice-President, Business & Finance/Comptroller
 Five-Year Financial Analysis Mary H. Loomis, CPA, MPA Assistant Vice-President, Business & Finance/Comptroller 2015 Table of Contents Introduction... 3 Discussion of Net Pension Obligation for the Fiscal
Strategic Issues Related to: University Plan, Performance, and Accountability Report. Finance Committee September 12, 2013
 Strategic Issues Related to: University Plan, Performance, and Accountability Report Finance Committee September 12, 2013 University Goal Outstanding Organization Be responsible stewards of resources,
Debt Policy Ratio Review. March 25, 2009
 Debt Policy Ratio Review March 25, 2009 1. Ratio definitions. 2. Key assumptions. 3. Historical & Projected Ratios 4. Peer Comparisons 5. Closing Points. 0 Ratio Definitions Expendable Resources to Debt:
HIGHER LEARNING COMMISSION FINANCIAL RATIO UPDATE
 Regular Meeting Agenda Item 7B June 21, 2016 Information Only HIGHER LEARNING COMMISSION FINANCIAL RATIO UPDATE Summary: The Higher Learning Commission (HLC) uses specific financial ratios to track institutional
HIGHER LEARNING COMMISSION FINANCIAL RATIO UPDATE
 Regular Meeting Agenda Item 7C May 16, 2017 Informational Item HIGHER LEARNING COMMISSION FINANCIAL RATIO UPDATE Summary: The Higher Learning Commission (HLC) uses specific financial ratios to track institutional
Health Care. A Focus on Financial Reporting. FASB Revenue Recognition for CHCs: 4/16/2018
 Health Care FASB Revenue Recognition for CHCs: A Focus on Financial Reporting Helping Community Health Centers Understand the Changes Needed for Financial Statement Presentation & Disclosure Requirements
FISCAL YEARS 2012 & 2011 FINANCIAL STATEMENTS EXECUTIVE SUMMARY
 FISCAL YEARS 2012 & 2011 FINANCIAL STATEMENTS EXECUTIVE SUMMARY TO: FROM: The College of New Jersey Board of Trustees Dr. R. Barbara Gitenstein, President Lloyd Ricketts, Treasurer DATE: August 27, 2012
I. Financial Diagnostics
 Financial, Marketing and Management Diagnostics list I. Financial Diagnostics A. Operations 1. Is the operating net or total net increasing or decreasing; if it is decreasing, why? 2. Are revenue and expense
The Art and Science of Multi-Year Planning
 The Art and Science of Multi-Year Planning Bethany Pugh Managing Director PFM Financial Advisors LLC www.pfm.com Kevin Kuhar Senior Solutions Consultant PFM Solutions LLC www.whitebrichsoftware.com 1/31
Financial Review FISCAL YEAR 2015
 Financial Review FISCAL YEAR 2015 AGENDA Overview Resource Sufficiency & Flexibility Operating Results Financial Asset Performance Debt Management Financial Outlook 2 Overview EWU is strong, vibrant, and
ESOPS: CONTINUING A LEGACY
 ESOPS: CONTINUING A LEGACY November 19, 2015 Cara Benningfield, CPA Director cbenningfield@bkd.com 1 TO RECEIVE CPE CREDIT Participate in entire webinar Answer polls when they are provided If you are viewing
Implemented (University & Auxilaries Combined) Year 2 Year 3 Year 4 Year 5
 Year 2 Year 3 Year 4 Year 5") Return on Net Assets Change in Net Assets / Total Net Assets at beginning of fiscal year 0.020 0.204 0.247 0.069 Beg Yr NA $ 137,586,412 $ 140,339,979 $ 168,911,516 $ 210,683,163 End Yr NA $ 140,339,979
Return on Net Assets Change in Net Assets / Total Net Assets at beginning of fiscal year 0.020 0.204 0.247 0.069 Beg Yr NA $ 137,586,412 $ 140,339,979 $ 168,911,516 $ 210,683,163 End Yr NA $ 140,339,979
Increasing Shareholder Value Through Transaction Preparation
 Increasing Shareholder Value Through Transaction Preparation PRESENTED BY: CHRIS DALTON, NATIONAL TRANSACTION SERVICES LEADER & KEN HIRSCH, MANAGING DIRECTOR, BKD CORPORATE FINANCE TO RECEIVE CPE CREDIT
BKD NATIONAL NOT-FOR-PROFIT GROUP
 BKD NATIONAL NOT-FOR-PROFIT GROUP COMMON NOT-FOR-PROFIT REPORTING ERRORS PRESENTED BY: BKD, LLP Published 08/01/2017 AGENDA About AICPA report Identification of contributions Classification of net assets
POLICY & PROCEDURE DOCUMENT NUMBER: DIVISION: Finance & Administration. TITLE: Comprehensive Debt Policy. DATE: December 1, 2015
 POLICY & PROCEDURE DOCUMENT NUMBER: 3.1301 DIVISION: Finance & Administration TITLE: Comprehensive Debt Policy DATE: December 1, 2015 Authorized by: K. Ann Mead, Sr. VP of Finance & Administration Issued
Forensics Institute: Tax Reform s Effect on Valuations. May 16, 2018
 Forensics Institute: Tax Reform s Effect on Valuations May 16, 2018 TO RECEIVE CPE CREDIT Individuals Participate in entire webinar Answer polls when they are provided Groups Group leader is the person
CALIFORNIA STATE UNIVERSITY, FRESNO. Financial Statements. June 30, (With Independent Auditors Report Thereon)
") Financial Statements (With Independent Auditors Report Thereon) Table of Contents Page Independent Auditors Report 1 Management s Discussion and Analysis 3 Financial Statements: Statement of Net Assets
Financial Statements (With Independent Auditors Report Thereon) Table of Contents Page Independent Auditors Report 1 Management s Discussion and Analysis 3 Financial Statements: Statement of Net Assets
ASSESSING JOHNSON COUNTY COMMUNITY COLLEGE S FISCAL HEALTH USING FINANCIAL RATIOS
 ASSESSING JOHNSON COUNTY COMMUNITY COLLEGE S FISCAL HEALTH USING FINANCIAL RATIOS Mission: JCCC inspires learning to transform lives and strengthen communities. Presentation to the JCCC Board of Trustees
ENDs Monitoring Report
 ENDs Monitoring Report FINANCE June 12, 2017 Presented To: President Dr. Daniel J. Phelan Jackson College Board of Trustees Presented by: Darrell R. Norris, Vice President of Finance I. Executive Summary
Higher Learning Commission (HLC) Ratios Black Hills State University
 Ratios Black Hills State University") Black Hills State University.374 0.345 0.351 0.304 0.467.012 (0.010) 0.065 0.093 0.024 Return on Net Asset Ratio.042 0.089 0.462 0.061 0.023 1.421 1.268 1.155 0.868 1.265 Composite Financial Indicator
Black Hills State University.374 0.345 0.351 0.304 0.467.012 (0.010) 0.065 0.093 0.024 Return on Net Asset Ratio.042 0.089 0.462 0.061 0.023 1.421 1.268 1.155 0.868 1.265 Composite Financial Indicator
Rutgers, The State University of New Jersey Debt Policy May 2006 FINAL
 Rutgers, The State New Jersey Debt Policy May 2006 FINAL Table of Contents I. Overview... 2 II. Scope and Objectives... 2 III. Oversight... 3 IV. Strategic Debt Allocation...... 4 V. Debt Affordability
Tax Cuts & Jobs Act of 2017
 Tax Cuts & Jobs Act of 2017 What Exempt Organizations Need to Know BIG CHANGES AHEAD FOR EXEMPT ORGANIZATIONS DECEMBER 20, 2017 TO RECEIVE CPE CREDIT Participate in entire webinar Answer polls when they
HUMBOLDT STATE UNIVERSITY. Financial Statements. June 30, 2011
 Financial Statements Table of Contents Page Management s Discussion and Analysis 2 Financial Statements: Statement of Net Assets 11 Statement of Revenues, Expenses, and Changes in Net Assets 12 Statement
University of Virginia Debt Policy Dated February 22, 2013
 University of Virginia Debt Policy Dated February 22, 2013 Table of Contents I. Overview... 2 II. Scope and Objectives... 2 III. Oversight and Approval... 3 IV. Debt Affordability and Capacity... 3 V.
CALIFORNIA POLYTECHNIC STATE UNIVERSITY, SAN LUIS OBISPO. Financial Statements. June 30, (With Independent Auditors Report Thereon)
") Financial Statements (With Independent Auditors Report Thereon) Table of Contents Page Independent Auditors Report 1 Management s Discussion and Analysis 3 Financial Statements: Statement of Net Assets
Financial Statements (With Independent Auditors Report Thereon) Table of Contents Page Independent Auditors Report 1 Management s Discussion and Analysis 3 Financial Statements: Statement of Net Assets
ANNUAL FINANCIAL REPORT For the Fiscal Year Ended June 30, 2015
 Hutchinson and Willmar, MN ANNUAL FINANCIAL REPORT For the Fiscal Creating Opportunities, Changing Lives. ANNUAL FINANCIAL REPORT For the year ended June 30, 2015 TABLE OF CONTENTS Page College Administration
THE UNIVERSITY FOUNDATION AT SACRAMENTO STATE
 THE UNIVERSITY FOUNDATION AT SACRAMENTO STATE Independent Auditor s Report, Management s Discussion and Analysis, Basic Financial Statements and Supplemental Schedules Table of Contents Page(s) Independent
WHITTIER COLLEGE. Financial Statements. June 30, 2017 and (With Independent Auditors Report Thereon)
") Financial Statements (With Independent Auditors Report Thereon) Table of Contents Page Management s Discussion and Analysis i Independent Auditors Report 1 Financial Statements: Statements of Financial
Financial Statements (With Independent Auditors Report Thereon) Table of Contents Page Management s Discussion and Analysis i Independent Auditors Report 1 Financial Statements: Statements of Financial
Health Care. A Focus on Patient Service Revenue. FASB Revenue Recognition for CHCs: 4/10/2018
 Health Care FASB Revenue Recognition for CHCs: A Focus on Patient Service Revenue Applying the 5-Step Model to the Traditional Patient Service Revenue Cycle of a Community Health Center April 10, 2018
CALIFORNIA STATE UNIVERSITY, FULLERTON. Financial Statements. June 30, (With Independent Auditors Report Thereon)
") Financial Statements (With Independent Auditors Report Thereon) Table of Contents Page Independent Auditors Report 1 Management s Discussion and Analysis (Unaudited) 3 Financial Statements: Statement of
Financial Statements (With Independent Auditors Report Thereon) Table of Contents Page Independent Auditors Report 1 Management s Discussion and Analysis (Unaudited) 3 Financial Statements: Statement of
The University of Texas at San Antonio 2012 Summary of Financial Condition. Financial Condition: Satisfactory
 The University of Texas at San Antonio 2012 Summary of Financial Condition Financial Condition: Satisfactory Composite Financial Index Operating Expense Coverage Ratio 4.0 3.5 3.3 3.2 (in months) 6.0 5.1
Critical New Insights on Proposed Opportunity Zone Regulations NOVEMBER 7, 2018
 Critical New Insights on Proposed Opportunity Zone Regulations NOVEMBER 7, 2018 To Receive CPE Credit Participate in entire webinar Answer polls when they are provided If you are viewing this webinar in
Financial Review FISCAL YEAR 2013
 Financial Review FISCAL YEAR 2013 AGENDA Overview Resource Sufficiency & Flexibility Operating Results Financial Asset Performance Debt Management Financial Outlook 2 Achieving the Goals of the EWU Board
SAN JOSE STATE UNIVERSITY. Financial Statements. June 30, (With Independent Auditors Report Thereon)
") Financial Statements (With Independent Auditors Report Thereon) Table of Contents Page Independent Auditors Report 1 Management s Discussion and Analysis 3 Financial Statements: Statement of Net Assets
Financial Statements (With Independent Auditors Report Thereon) Table of Contents Page Independent Auditors Report 1 Management s Discussion and Analysis 3 Financial Statements: Statement of Net Assets
Analysis of the Financial Condition of the University of Illinois System
 Analysis of the Financial Condition of the University of Illinois System This study was commissioned by UIC United Faculty Organizing Committee American Association of University Professors (AAUP) American
Total $ % Operating Investing Financing Total Non-Cash Cash Assets Cash and cash equivalents
 Consolidated Balance Sheets As of June 30, Cash Flows For the Period July 1, 1999 Through June 30, 2011 Change Cash Flow (operating was completed under the indirect method) Total 1999 2011 $ % Operating
Webinar Series ESOPS: CONTINUING A LEGACY 10/31/2017. October 31, Cara Benningfield Partner
 Webinar Series ESOPS: CONTINUING A LEGACY October 31, 2017 Cara Benningfield Partner cbenningfield@bkd.com Angela Fisher Manager afisher@bkd.com 1 TO RECEIVE CPE CREDIT Participate in entire webinar Answer
In the Wake of Catastrophe: Navigating Business Income Losses
 In the Wake of Catastrophe: Navigating Business Income Losses Todd Burchett, CPA/ABV, ASA, CFF, CFE Partner tburchett@bkd.com Keith Seiffert, CPA, CFE Managing Consultant kseiffert@bkd.com October 11,
WORCESTER STATE UNIVERSITY (AN AGENCY OF THE COMMONWEALTH OF MASSACHUSETTS) FINANCIAL STATEMENTS AND MANAGEMENT S DISCUSSION AND ANALYSIS WITH
 FINANCIAL STATEMENTS AND MANAGEMENT S DISCUSSION AND ANALYSIS WITH") (AN AGENCY OF THE COMMONWEALTH OF MASSACHUSETTS) FINANCIAL STATEMENTS AND MANAGEMENT S DISCUSSION AND ANALYSIS WITH SUPPLEMENTARY INFORMATION, STATISTICAL INFORMATION AND OTHER REPORTS YEARS ENDED JUNE
(AN AGENCY OF THE COMMONWEALTH OF MASSACHUSETTS) FINANCIAL STATEMENTS AND MANAGEMENT S DISCUSSION AND ANALYSIS WITH SUPPLEMENTARY INFORMATION, STATISTICAL INFORMATION AND OTHER REPORTS YEARS ENDED JUNE
Annual. Investment Policy Report. August 18, 2011 Board of Trustees Finance & Audit Workgroup
 Annual Investment Policy Report August 18, 2011 Board of Trustees Finance & Audit Workgroup Annual Investment Policy Report Policy Requirements (Policy Adopted 2006) Establish an investment program for
The University of Texas at San Antonio 2015 Summary of Financial Condition. Financial Condition: Satisfactory
 The University of Texas at San Antonio 2015 Summary of Financial Condition Financial Condition: Satisfactory Composite Financial Index Operating Expense Coverage Ratio 4.0 3.2 3.7 3.3 2.8 (in months) 7.0
EAST TENNESSEE STATE UNIVERSITY BOARD OF TRUSTEES FINANCE AND ADMINISTRATION COMMITTEE FEBRUARY 2019 MEETING AGENDA
 EAST TENNESSEE STATE UNIVERSITY BOARD OF TRUSTEES FINANCE AND ADMINISTRATION COMMITTEE FEBRUARY 2019 MEETING 10:15-11:45am EST Friday February 22, 2019 The Millennium Center 2001 Millennium Pl Johnson
{Michigan Community College Association}
 {Michigan Community College Association} Trustees Summer Institute July 23, 2015 Agenda Understanding College Funds 2 Revenue Sources and Expense Classification Statement of Net Position Reading the Financial
HARFORD COMMUNITY COLLEGE COMPONENT UNIT FINANCIAL STATEMENTS AND SINGLE AUDIT COMPLIANCE REPORTS YEAR ENDED JUNE 30, 2013
 COMPONENT UNIT FINANCIAL STATEMENTS AND SINGLE AUDIT COMPLIANCE REPORTS YEAR ENDED TABLE OF CONTENTS YEAR ENDED INDEPENDENT AUDITORS REPORT 1 MANAGEMENT DISCUSSION AND ANALYSIS (UNAUDITED) 4 FINANCIAL
COLBY COLLEGE CONSOLIDATED FINANCIAL STATEMENTS June 30, 2016 and 2015
 CONSOLIDATED FINANCIAL STATEMENTS June 30, 2016 and 2015 Consolidated Financial Statements Table of Contents Consolidated Financial Statements: Independent Auditors Report 1-2 Consolidated Balance Sheets
Financial Report of Ontario Universities Highlights. Council of Ontario Finance Officers Council of Ontario Universities
 Financial Report of Ontario Universities 2013-14 Highlights Council of Ontario Finance Officers Council of Ontario Universities APRIL 2015 Financial Report of Ontario Universities 2013-14 Highlights Prepared
2/25/2015 RESEARCH TAX CREDIT. R&D Credits for Software Development. R. Ashley Thompson Director
 RESEARCH TAX CREDIT R&D Credits for Software Development February 26, 2015 R. Ashley Thompson Director athompson@bkd.com 1 TO RECEIVE CPE CREDIT Participate in entire webinar Answer polls when they are
Financial Report Review
 BAC-1.1 Financial Report Review Board of Trustees Meeting February 20, 2018 Key Elements of Financial Statements & Footnotes MD&A (Management's Discussion & Analysis) Auditor's Opinion Statement of Net
Operationalizing Lease Accounting Accounting, Legal & Financing Perspectives
 Operationalizing Lease Accounting Accounting, Legal & Financing Perspectives Presented by December 4, 2018 TO RECEIVE CPE CREDIT Individuals Participate in entire webinar Answer polls when they are provided
Southern West Virginia Community and Technical College
 Southern West Virginia Community and Technical College Financial Statements for the Years Ended June 30, 2003 and 2002 and Independent Auditors Reports SOUTHERN WEST VIRGINIA COMMUNITY AND TECHNICAL COLLEGE
UNIVERSITY OF NEW HAVEN. Consolidated Financial Statements. June 30, (With Independent Auditors Report Thereon)
") Consolidated Financial Statements (With Independent Auditors Report Thereon) Consolidated Financial Statements Table of Contents Independent Auditors Report 1 Consolidated Statement of Financial Position
Consolidated Financial Statements (With Independent Auditors Report Thereon) Consolidated Financial Statements Table of Contents Independent Auditors Report 1 Consolidated Statement of Financial Position
Medians - US Private Universities Maintain Stability but Pockets of Stress Remain
 SECTOR IN-DEPTH Higher Education - US Medians - US Private Universities Maintain Stability but Pockets of Stress Remain TABLE OF CONTENTS Basis for Medians Appendix I: FY 2011 - FY 2015 Medians Appendix
UNIVERSITY OF HAWAII FOUNDATION. Financial Statements. June 30, 2017 and (With Independent Auditors Report Thereon)
") Financial Statements (With Independent Auditors Report Thereon) KPMG LLP Suite 2100 1003 Bishop Street Honolulu, HI 96813-6400 Independent Auditors Report The Board of Trustees University of Hawaii Foundation:
Financial Statements (With Independent Auditors Report Thereon) KPMG LLP Suite 2100 1003 Bishop Street Honolulu, HI 96813-6400 Independent Auditors Report The Board of Trustees University of Hawaii Foundation:
CALIFORNIA STATE UNIVERSITY, NORTHRIDGE. Financial Statements. June 30, (With Independent Auditors Report Thereon)
") Financial Statements (With Independent Auditors Report Thereon) Table of Contents Page Independent Auditors Report 1 Management s Discussion and Analysis 3 Basic Financial Statements: Statement of Net
Financial Statements (With Independent Auditors Report Thereon) Table of Contents Page Independent Auditors Report 1 Management s Discussion and Analysis 3 Basic Financial Statements: Statement of Net
HOBART AND WILLIAM SMITH COLLEGES. Financial Statements. May 31, 2017 and (With Independent Auditors Report Thereon)
") Financial Statements (With Independent Auditors Report Thereon) Financial Statements Table of Contents Page(s) Independent Auditors Report 1 Financial Statements: Statements of Financial Position 2 Statements
Financial Statements (With Independent Auditors Report Thereon) Financial Statements Table of Contents Page(s) Independent Auditors Report 1 Financial Statements: Statements of Financial Position 2 Statements
BEWARE OF THE LOOSE CANNON
 BEWARE OF THE LOOSE CANNON Experts Need to Prudently Apply Professional Standards October 26, 2016 Bryan Callahan, CPA, CFF, CFE, CVA Director Forensics & Valuation Services bcallahan@bkd.com 1 TO RECEIVE
Trey Turnage, CPA Gordon Dobner, CPA
 CECL Breaking Down the Final Standard July 27, 2016 Trey Turnage, CPA Partner tturnage@bkd.com Gordon Dobner, CPA Director gdobner@bkd.com 1 TO RECEIVE CPE CREDIT Participate in entire webinar Answer polls
Understanding College and University Financial Statements
 Understanding College and University Financial Statements By Rudy Fichtenbaum Professor of Economics Department of Economics Wright State University Dayton, OH 45435 (937) 775-3085 rfichtenbaum@sbcglobal.net
Revenue Recognition: Considerations for Technology & Software Companies
 Revenue Recognition: Considerations for Technology & Software Companies JULY 25, 2018 To Receive CPE Credit Individuals Participate in entire webinar Answer polls when they are provided Groups Group leader
SAVANNAH STATE UNIVERSITY Fiscal Analysis Mary H. Loomis, CPA, MPA Assistant Vice-President, Business & Finance/Comptroller
 SAVANNAH STATE UNIVERSITY Fiscal Analysis Mary H. Loomis, CPA, MPA Assistant Vice-President, Business & Finance/Comptroller 2012 Although audited or state auditor reviewed financial information was used
ESOPs: Continuing a Legacy 10/30/2018. THOUGHTWARE Manufacturing & Distribution THOUGHTWARE. Cara Benningfield Partner Bowling Green
 THOUGHTWARE Manufacturing & Distribution THOUGHTWARE ESOPs: Continuing a Legacy Cara Benningfield Partner Bowling Green 270.781.0111 Angela Fisher Managing Consultant Bowling Green 270.781.0111 November
U.S. Colleges and Universities Increase Liquidity as Credit Pressures Continue
 MAY 12, 2011 SPECIAL COMMENT U.S. Colleges and Universities Increase Liquidity as Credit Pressures Continue Table of Contents: SUMMARY 1 BACKGROUND 2 LIQUIDITY ISSUES HIGHLIGHTED IN 2011 OUTLOOK FOR U.S.
VASSAR COLLEGE. Financial Statements. June 30, 2017 and (With Independent Auditors Report Thereon)
") Financial Statements (With Independent Auditors Report Thereon) Table of Contents Page Independent Auditors Report 1 Financial Statements: Statements of Financial Position 2 Statements of Activities 3
Financial Statements (With Independent Auditors Report Thereon) Table of Contents Page Independent Auditors Report 1 Financial Statements: Statements of Financial Position 2 Statements of Activities 3
California State University Bakersfield Foundation. FINANCIAL REPORT (Audited)
") California State University Bakersfield Foundation FINANCIAL REPORT (Audited) JUNE 30, 2013 CALIFORNIA STATE UNIVERSITY, BAKERSFIELD, FOUNDATION FINANCIAL REPORT (Audited) JUNE 30, 2013 C O N T E N T S
California State University Bakersfield Foundation FINANCIAL REPORT (Audited) JUNE 30, 2013 CALIFORNIA STATE UNIVERSITY, BAKERSFIELD, FOUNDATION FINANCIAL REPORT (Audited) JUNE 30, 2013 C O N T E N T S
MADONNA UNIVERSITY. Financial Statements. June 30, 2004 and (With Independent Auditors Report Thereon)
") Financial Statements (With Independent Auditors Report Thereon) Table of Contents Page Independent Auditors Report 1 Statements of Financial Position 2 Statement of Activities Year ended June 30, 2004
Financial Statements (With Independent Auditors Report Thereon) Table of Contents Page Independent Auditors Report 1 Statements of Financial Position 2 Statement of Activities Year ended June 30, 2004
HOBART AND WILLIAM SMITH COLLEGES. Financial Statements. May 31, 2016 and (With Independent Auditors Report Thereon)
") Financial Statements (With Independent Auditors Report Thereon) Financial Statements Table of Contents Page(s) Independent Auditors Report 1 Financial Statements: Statements of Financial Position 2 Statements
Financial Statements (With Independent Auditors Report Thereon) Financial Statements Table of Contents Page(s) Independent Auditors Report 1 Financial Statements: Statements of Financial Position 2 Statements
Accounting for Colleges & Universities. Chapter 14
 Accounting for Colleges & Universities Chapter 14 Learning Objectives Understand why most government C&Us choose to report as business-type only special purpose governments Explain unique aspects of C&U