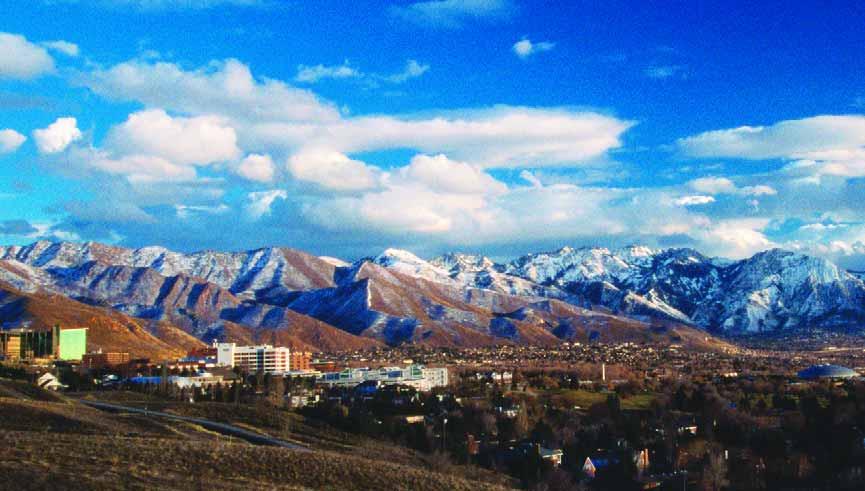
2004 Annual Financial Report THE UNIVERSITY OF UTAH A Component Unit of the State of Utah
|
|
|
- Allen Sims
- 5 years ago
- Views:
Transcription

1 2004 Annual Financial Report THE UNIVERSITY OF UTAH A Component Unit of the State of Utah
2
3
4
5 Contents Message from the President 2-3 Independent State Auditor s Report 4-5 Management s Discussion and Analysis 6-17 Financial Statements Statement of Net Assets 20 Statement of Revenues, Expenses, and Changes in Net Assets 21 Statement of Cash Flows Notes to Financial Statements Governing Boards and Officers 42

6 Message from the President As the flagship institution of the Utah System of Higher Education, the University of Utah is a positive force in the intellectual, cultural, and economic lives of people and communities throughout our state. A University s greatest resource is its people students, faculty, administrators, staff, alumni, and friends. I am excited to be associated with a community of uncommonly talented and dedicated people here at the University of Utah. The financial information presented in this report is a reflection of their collective efforts. Despite fiscal challenges, financial results for this past year offer some reasons for optimism: Each of our major sources of operating revenues were up significantly over fiscal year Patient revenues climbed 8%; grants and contracts rose by 6%; tuition and fees increased 8%; and sales and services jumped 13%. This demonstrates continuing confidence by our customers in the programs and services we offer whether they be patient care, post-secondary education, sponsored research or public services. Our endowments surpassed $300 million this fiscal year, with an overall investment return of over 16%. The growth and performance of our endowments reflect the generosity of our donors and their willingness to support the institution; and our investment management acumen, which maximizes the potential of these funds in providing much-needed resources in carrying out our mission. As you review our financial statistics, I encourage you to also envision the countless hours spent by hundreds of dedicated people in classrooms, libraries, laboratories, clinics, and offices. These efforts provide our students a world-class education and improve the quality of life of our citizens through groundbreaking research and patient care. The financial, economic, and cultural impact that the University s presence has on our community and our state are significant and far-reaching. Some highlights might be illustrative: In the last 5 years, the University has received more than $1.2 billion in federal research funding, consistently ranking among the top 30 public universities in terms of federally funded research. According to Dr. Kelly Matthews, economist for Wells Fargo Bank, the University of Utah is an essential component of Utah s economic prosperity. The ongoing success of a prestigious research university will produce huge economic benefits for the state of Utah. With more than 7,500 employees and an annual payroll exceeding $531 million, the Health Sciences Center is one of the state s largest employers, and contributes millions of dollars in new, net tax revenue to Utah every year. Nearly one-third of the patients at University Hospitals and Clinics come from out of state. The University s Research Park is home to 37 companies, housing approximately 4,500 non-university employees, and generating approximately $600 million annually in economic impact. 2
7 Contributions to Utah s cultural life emanate from many University sources, including the Utah Museum of Fine Arts, Museum of Natural History, Red Butte Gardens & Arboretum, KUED, KUER, Pioneer Theatre Company, Gardner Hall, and Kingsbury Hall. The University of Utah is doing more with less. State support has declined and unavoidable costs such as utilities are on the rise. As with universities across the nation, students and their parents are bearing a heavier portion of the burden through higher tuition. We are working hard to find the best solutions to these challenges. Use of technology has expanded. Collaboration has increased. Responsiveness and accountability have improved. We are determined to move forward. It is my pleasure to convey this annual financial report and recognize the tireless efforts of dedicated faculty and skilled administrators who work hard to ensure that the financial condition of the University of Utah is not only sound, but improving. While there are certainly challenges, I am confident that the University will successfully meet them and make the most of the opportunities that are before us. 3
8 4
9 5

10 Management s Discussion and Analysis
11 INTRODUCTION The following discussion and analysis provides an overview of the financial position and activities of the University of Utah (University) for the year ended June 30, 2004, with selected comparative information for the year ended June 30, This discussion has been prepared by management and should be read in conjunction with the financial statements and the notes thereto, which follow this section. The University is a comprehensive public institution of higher learning with approximately 28,900 students, 2,300 faculty members and more than 20,000 supporting staff. The University offers a diverse range of degree programs from baccalaureate to post-doctoral levels, through a framework of 15 schools, colleges and divisions, and contributes to the state and nation through related research and public service programs. The University also maintains a prestigious health care complex through its University of Utah Hospitals and Clinics (UUHC). The UUHC consists of three hospitals and numerous specialty clinics. The UUHC is an integral part of the University s health care system that also includes the University s School of Medicine and the Colleges of Health, Nursing, and Pharmacy. The University s health care system has a tradition of excellence in teaching, advancement of medical science and patient care, consistently ranking among the best health care systems in the western United States. The University consistently ranks as one of the nation s top universities by various measures of quality, both in general academic terms and in terms of strength of offerings in specific academic disciplines and professional subjects. Excellence in research is another crucial element in the University s high ranking among educational institutions. Research is central to the University s mission and permeates its schools and colleges. In addition to the academic schools, colleges, and departments, the University operates the University of Utah Research Foundation (UURF), a separately incorporated entity that specializes in applied research, the transfer of patented technology to business entities, leasing and administration of Research Park (a research park located on land owned by the University), and the leasing of certain buildings. Also, a whollyowned, separately incorporated enterprise, the Associated Regional University Pathologists, Inc. (ARUP) provides pathology services to regional and national customers. 7
12 FINANCIAL HIGHLIGHTS The University s financial position remained strong at June 30, 2004, with assets of $2.3 billion and total liabilities of $.6 billion. Net assets, which represent the residual interest in the University s assets after liabilities are deducted, increased by $137.4 million to $1.7 billion at June 30, Changes in net assets represent the total activity of the University, which results from all revenues, expenses, gains and losses, and are summarized for the years ended June 30, 2004 and 2003 in Figure 1. Fiscal year 2004 revenues before change in fair value of investments increased 8.9%, or $146.9 million, while expenses increased 8.8%, or $138.6 million. This resulted in a net gain before changes in fair value of investments of $99.4 million for fiscal year 2004, and $91.1 million for fiscal year The University invests its endowment funds to maximize total return over the long term, within an appropriate level of risk. The success of this long-term investment strategy is evidenced by returns averaging 8.7% during the past ten years. USING THE FINANCIAL STATEMENTS The University s financial report is prepared in accordance with Governmental Accounting Standards Board (GASB) principles and includes three financial statements: the Statement of Net Assets; the Statement of Revenues, Expenses and Changes in Net Assets; and the Statement of Cash Flows. Revenues and expenses are categorized as operating or nonoperating and other net asset additions as capital contributions or additions to permanent endowments. Significant recurring sources of the University s revenues, including state appropriations, gifts and investment income, are considered nonoperating, as defined by GASB Statement No. 34, Basic Financial Statements and Management s Discussion and Analysis for State and Local Governments. Nonoperating revenues totaled $309.5 million and $282.6 million for the years ended June 30, 2004 and 2003, respectively. Nonoperating expenses, which include interest expense, totaled $16.5 million and $21.3 million for the years ended June 30, 2004 and 2003, respectively. Also, as required by GASB Statement No. 34, scholarships and fellowships applied to student accounts are shown as a reduction of student tuition and fee revenues, while stipends and other payments made directly to students continue to be presented as scholarship and fellowship expenses. In addition, other appropriate revenue items have been reduced by bad debt expense incurred during each fiscal year. For the years ended June 30, 2004 and 2003, scholarship and fellowship expenses totaled $21.1 million and $17.5 million, respectively. In addition, scholarships and fellowships in the amount of $12.1 million and $9.4 million for the years ended June 30, 2004 and 2003, are reported as a reduction of tuition and fees and auxiliary enterprises revenue. Figure (in thousands) Total revenues before change in fair value of investments $1,807,007 $1,660,146 Total expenses 1,707,576 1,568,999 Increase in net assets before change in fair value of investments 99,431 91,147 Increase in fair value of investments 37,994 6,384 Increase in net assets $ 137,425 $ 97,531 8

13 between total assets and total liabilities is net assets and is one indicator of the current financial condition of the University, while the change in net assets is an indicator of whether the overall financial condition has improved or worsened during the year. Assets and liabilities are generally measured using current values except for capital assets, which are stated at historical cost less an allowance for depreciation. A summarized comparison of the University s assets, liabilities and net assets at June 30, 2004 and 2003 as shown in Figure 2. STATEMENT OF NET ASSETS The Statement of Net Assets presents the financial position of the University at the end of the fiscal year and includes all assets and liabilities of the University. The difference A review of the University s Statement of Net Assets at June 30, 2004 and 2003, shows that the University continues to build upon its strong financial foundation. This strong financial position reflects the prudent utilization of its financial resources, including careful cost controls, management of its endowment funds, utilization of debt and adherence to its long range capital plan for the maintenance and replacement of the physical plant. Current assets consist primarily of cash, operating investments, trade receivables and inventories. Current assets represent approximately 4.9 months of total operating expenses (excluding depreciation). Current investments for capital and student loan Figure Current assets (in thousands) $ 652,611 $ 514,731 Noncurrent assets Endowments and other investments 532, ,724 Receivables 56,669 32,256 Capital assets, net 1,025,401 1,024,498 Other 20,300 22,449 Total assets 2,286,997 2,101,658 Current liabilities 251, ,236 Noncurrent liabilities 350, ,381 Total liabilities 602, ,617 Net assets $1,684,466 $1,547,041 9

14 activities totaled $138.0 million at June 30, 2004 and $92.5 million at June 30, Receivables increased slightly from $186.2 million at June 30, 2003 to $188.1 million at June 30, Current liabilities consist primarily of trade accounts, accrued compensation, deposits, and other liabilities, which totaled $251.8 million at June 30, 2004, as compared to $206.2 million at June 30, Current liabilities also include deferred revenue, and the current portion of bonds payable. Total current liabilities increased $45.5 million during fiscal year ENDOWMENT AND SIMILAR INVESTMENTS The University s endowment funds consist of both permanent endowments and funds functioning as endowments. Permanent endowments are those funds received from donors with the stipulation that the principal remain inviolate and be invested in perpetuity to produce income that is to be expended for the purposes specified by the donor. Funds functioning as endowments consist of amounts (restricted gifts or unrestricted funds) that have been allocated by the University for long-term investment purposes, although amounts are not subject to donor restrictions requiring the University to preserve the principal in perpetuity. Programs supported by endowment funds include scholarships, fellowships, professorships, research efforts and other important programs and activities. Endowment funds are invested to maximize long-term results. Because of the volatility in the equity markets, the University Investment Advisory Committee approved recommended changes to the University s asset allocation plan effective July 1, By approving the changes, the Committee is striving to achieve broad diversification with the long-term goal of earning maximum returns within an acceptable risk range for investment of the University s endowment funds. Endowment funds invested in the University s endowment pool are invested on a unit basis similar to mutual funds where each new dollar buys a number of shares in the pool. The pool is subject to a spending policy, which determines a distribution rate of return that will be used to allocate funds to University departments from the growth portion of the endowment pool. The The University of Utah endowment pool returned 16.9% for the year ended June 30, 2004 compared to 4.1% for the year ended June 30, These results reflect the heavy weighting of equities in the asset allocation of the pool and compare favorably to broad indexes such as the S&P 500 and Lehman Brothers Aggregate Bond (19.1% and 0.3% gain, respectively, for fiscal year 2004). The net gain on the endowment pool for the year ended June 30, 2004 totaled $38.5 million compared to a gain of $4.6 million for the year ended June 30,

15 purpose of the spending policy is to establish a distribution rate that over time will generate returns adequate to continue support for future expenses in perpetuity assuming moderate levels of inflation. During the year ended June 30, 2004, the spending policy was 4.0% of the twelve quarter moving average of unit market values. Endowment pool income used in operations was $10.4 million in fiscal year The amount allocated to operations exceeded dividends and interest earned on pool investments by $5.3 million. Since endowment funds are invested for longterm results rather than short-term annual returns, it is important to reflect on the longer investment horizon. Over the past ten years, the University s endowment pool has earned an average total return of 8.7%, paid out an average of 4.3%, and reinvested the balance representing an average of 4.4%. The reinvested funds enabled higher balances, thus yielding greater returns to keep pace with inflation of program expenses. Endowments provide crucial support for the University s quality academic programs and accessibility to these programs for all students. Gifts to the endowment funds at the University totaled $11.4 million and $7.2 million for the fiscal years 2004 and 2003, respectively. CAPITAL AND DEBT ACTIVITIES One of the critical factors in continuing the quality of the University s academic and research programs is the development and renewal of its capital assets. The University continues to implement its long-range plan to modernize its complement of older teaching and research facilities, balanced with new construction. Capital additions totaled $133.2 million in fiscal year 2004, as compared to $196.4 million in fiscal year Capital additions primarily comprise replacement, renovation, and new construction of academic, research, and health care facilities, as well as significant investments in equipment. Capital asset additions are funded by capital appropriations, bond proceeds, gifts which were designated for capital purposes, and unrestricted net assets. Construction in progress at June 30, 2004, totaled $75.7 million that includes projects in numerous buildings across the campus. Significant projects include: student housing facilities; expansion of the University Hospital for critical care facilities; additional ophthalmologic facilities; and additional medical laboratories. The University takes seriously its role of financial stewardship and works hard to manage its financial resources effectively, including the prudent use of debt to finance capital projects. The debt rating of the University is an important indicator of success 11

16 in this area. The underlying bond ratings from Standard and Poor s and Moody s Investors Service for the Auxiliary and Campus Facilities Bonds and the Hospital Revenue Bonds are AA/Aa3, and for the Research Facilities Revenue Bonds are AA-/Aa3, respectively. These ratings are considered high investment grade quality and positions the University, if deemed necessary, to obtain future debt financing at low interest rates and reduced issuance costs. Bonds payable totaled $243.6 million and $241.0 million at June 30, 2004 and 2003, respectively. A new bond was issued in fiscal year 2004 to renovate medical research facilities. All other bonds were issued in prior years to finance new construction or renovation of the Huntsman Cancer Institute, a new biology research building, the University Hospital expansion, and auxiliary enterprise facilities, including Rice-Eccles Stadium, student housing, and parking, as well as equipment for the University Hospital. An institution s ratio of unrestricted operating revenues to bonds, notes and contract debt is a valuable indicator of its ability to finance its outstanding debt. At June 30, 2004, the University has 3.6 times the unrestricted operating revenue necessary to meet its debt requirements. NET ASSETS Net assets represent the residual interest in the University s assets after liabilities are deducted. Invested in capital assets, net of related debt represents the University s capital assets net of accumulated depreciation and outstanding principal balances of debt attributable to the acquisition, construction or improvement of those assets. Restricted nonexpendable net assets are the University s permanent endowment funds. Restricted expendable net assets are subject to externally imposed restrictions governing their use. This category of net assets includes $74.3 million of funds functioning as endowments. Although unrestricted net assets are not subject to externally imposed stipulations, substantially all of the University s unrestricted net assets have been designated for various academic and research programs and initiatives, as well as capital projects. 12
17 STATEMENT OF REVENUES, EXPENSES, AND CHANGES IN NET ASSETS The Statement of Revenues, Expenses and Changes in Net Assets presents the University s results of operations. A summarized comparison of the University s revenues, expenses and changes in net assets for the years ended June 30, 2004 and 2003 is shown in Figure 3. One of the University s greatest strengths is the diverse streams of revenues which supplement its student tuition and fees, including voluntary private support from individuals, foundations, and corporations, along with government and other grants and contracts, state appropriations, and investment income. The University has in the past and will continue to aggressively seek funding from all possible sources consistent with its mission, to supplement student tuition, and to manage prudently the financial resources realized from these efforts to fund its operating activities. Significant recurring sources of the University s revenues are considered nonoperating, as defined by GASB Statement No. 34. The following page shows graphic illustrations of revenues by source (both operating and nonoperating), which were used to fund the University s operations for the year ended June 30, 2004 (amounts are presented in thousands of dollars). Figure (in thousands) Operating revenues Tuition and fees $ 116,714 $ 107,796 Patient services 669, ,460 Grants and contracts 278, ,557 Sales and services 293, ,314 Auxiliary enterprises 63,781 63,508 Other 47,433 36,028 Total operating revenues 1,469,583 1,348,663 Operating expenses 1,691,073 1,547,699 Operating loss (221,490) (199,036) Nonoperating revenues (expenses) State appropriations 227, ,821 Gifts 22,123 27,482 Investment income 57,449 27,338 Interest expense (16,503) (17,692) Other revenues (expenses) 2,102 (3,608) Net nonoperating revenues 293, ,341 Capital appropriations 11,600 7,730 Capital and endowment grants and gifts 54,309 27,496 Total capital and endowment revenues 65,909 35,226 Increase in net assets 137,425 97,531 Net assets - beginning of year, restated 1,547,041 1,449,510 Net assets - end of year $1,684,466 $1,547,041 13
18 OPERATING REVENUES Tuition and Fees Other Auxillary Enterprises The University continues to face significant financial pressure, particularly in the areas of compensation and benefits, which represent 53.1% of total expenses, as well as in the areas of technology and investments. To manage this financial pressure, the University continues to seek diversified sources of revenue and to implement cost containment measures. Sales and Services Nongovernmental Grants and Contracts Governmental Grants and Contracts Patient Services Tuition and state appropriations are the primary sources of funding for the University s academic programs. Student tuition and fees, net of allowances for scholarships and fellowships, increased $8.9 million, or 8.3% to $116.7 million in fiscal year State appropriations of $227.8 million in fiscal year 2004 is virtually unchanged from fiscal year Tuition and Fees $116,714 Patient Services $669,851 Governmental Grants & Contracts $214,866 Nongovernmental Grants & Contracts $63,884 Sales and Services $293,054 Auxiliary Enterprises $63,781 Other $47,433 Other Investment Income Gifts NONOPERATING REVENUES State Appropriations State Appropriations $227,835 Gifts $22,123 Investment Income $57,449 Other $2,102 While tuition and state appropriations fund a significant percentage of the University s academic and administrative costs, private support has been, and will continue to be, essential to the University s academic success. The struggling economy of both the State of Utah and nation has had a negative impact on private support. Gift revenues for operations decreased 19.5%, or $5.4 million, to $22.1 million in fiscal year Revenues for grants and contracts increased 6.2%, or $16.2 million, to $278.8 million in fiscal year 2004, primarily related to research programs. The increase in grant and contract revenues was generated by a broad base of schools, colleges, and research units across the University. The University receives revenues for grants and contracts from government and private sources, which provide for the recovery of direct costs and facilities and administrative (indirect) costs. Patient care revenues increased 8.0% or $49.4 million to $669.9 million in fiscal year The majority of these revenues relate to patient care services, which are generated within UUHC under contractual arrangements with governmental payers and private insurers. Increased revenues primarily resulted from a growth in patient volume and moderate price increases for patient services. In addition, 14
19 UUHC has continued to experience increased demand for specialty services provided by outpatient clinics and has also opened a new primary care clinic to serve the growing population base in the market. Net investment income for the years ended June 30, 2004 and 2003, consisted of the following components: (in thousands) Interest and dividends, net $19,455 $ 20,954 Net increase in fair value of investments 37,994 6,384 Net investment income $57,449 $27,338 Net investment income totaled $57.4 million in fiscal year 2004, as compared to $27.3 million in fiscal year 2003, which is a net increase of $30.1 million. Moreover, as discussed previously, the University s endowment investment policies are designed to maximize long-term total return while its income distribution policies are designed to preserve the value of the endowment portfolio and to generate a predictable stream of spendable income. The income distribution from the University s endowment portfolio for the support of operating activities, in accordance with the University s spending policy, totaled $10.4 million in fiscal year 2004, as compared to $9.2 million in fiscal year In addition, in fiscal year 2004, $4.2 million was returned to endowment principal. Capital appropriations received from the State in fiscal year 2004, which totaled $11.6 million, funded a portion of building renovation projects. Other revenues include capital grants and gifts and additions to permanent endowments totaling $54.3 million for the fiscal year ending June 30, A comparative summary of the University s expenses for the years ended June 30, 2004 and 2003 follows: _ 2004 _ 2003 (in thousands) Operating Compensation and benefits $ 906,868 $ 833,590 Scholarships and fellowships 21,062 17,541 Utilities 20,309 19,627 Depreciation and amortization 95,952 90,062 Other 646, ,879 Total operating 1,691,073 1,547,699 Nonoperating Interest and other 16,503 21,300 Total expenses $1,707,576 $1,568,999 The following is a graphic illustration of total expenses, in thousands of dollars, by natural classification: Other Interest Depreciation and Amortization Utilities Scholarships and Fellowships Compensation and Benefits Compensation and Benefits $906,868 Scholarships and Fellowships $21,062 Utilities $20,309 Depreciation and Amortization $95,952 Interest $16,503 Other $646,882 15
20 The University is committed to recruiting and retaining an outstanding faculty and staff and the compensation package is one way to successfully compete with peer institutions and nonacademic employers. The resources expended for compensation and benefits increased 8.8%, or $73.3 million, to $906.9 million in fiscal year Of this increase, compensation increased 7.5%, or $49.0 million, as a result of annual increases and the hiring of additional employees. The related employee benefits increased 13.6% or $24.3 million in fiscal year 2004, due primarily to increased medical benefits paid by the University. Other operating expenses increased 10.2%, or $60.0 million, to $646.9 million in fiscal year In addition to their natural classification, it is also informative to review operating expenses by function. A comparative summary of the University s operating expenses by functional classification for the years ended June 30, 2004 and 2003 follows: (in thousands) Instruction $ 216,498 $ 195,973 Research 200, ,702 Public service 307, ,723 Academic support 61,481 61,984 Student services 16,205 16,119 Institutional support 49,725 42,563 Operations and maintenance of plant 41,332 38,020 Student aid 27,838 26,701 Other 328, ,267 Hospital 441, ,647 Total operating expenses $1,691,073 $1,547,699 Instruction, research, and public service expenses increased 7.7%, or $51.7 million, to $724.1 million in fiscal year Academic and institutional support expenses increased 6.4%, or $6.7 million, to $111.2 million in fiscal year STATEMENT OF CASH FLOWS The Statement of Cash Flows provides additional information about the University s financial results, by reporting the major sources and uses of cash. The University s cash and cash equivalents increased $173.9 million due to the positive flow of funds provided by noncapital financing activities in support of operating activities, offset by the use of funds for capital acquisitions and related financing activities. The University s significant sources of cash provided by noncapital financing activities, as defined by GASB Statement No. 34, include state appropriations and private gifts used to fund operating activities. CURRENT FACTORS HAVING PROBABLE FUTURE FINANCIAL SIGNIFICANCE As can be seen by an examination of the revenues, and as referred to in the Introduction of this Management's Discussion and Analysis, the growth enjoyed during these past few years is primarily being driven by UUHC, along with the component units UURF and ARUP. It is not anticipated that this pattern will change in the future. These areas will probably continue to comprise a larger and larger proportion of total University revenues. While the academic colleges and related services operating on the main campus are, for the most part, financially healthy, they rely on state appropriations as a major source of support and are therefore limited in how much they can grow their core programs. Increasingly, the core teaching function of the University is becoming more dependent on nonstate sources of financial support, such as student tuition and private donations. These resources are also growing, but such growth is tempered by the economy. While the State is rebounding from the recent recession, it may be several years before it expands to a point where major new funds can flow to higher education. Until then, continuing support from the State is 16

21 anticipated, most probably in line with an annual growth factor equivalent to inflation. This translates into state appropriations that will continue to comprise a smaller and smaller proportion of total University revenues. On the expense side, increasing costs of employee health insurance and utilities are the main concern. These cost categories are rising dramatically faster than the pace of inflation. Given the outlook for state appropriations, the University will continue to emphasize cost containment and fiscal prudence wherever possible. Conservative financial philosophies and practices have served the institution well in the past and should continue to do so. The institution has traditionally managed its resources capably, and this fact is reflected in its healthy financial ratios and in its strong bond ratings. This financial strength and stability will serve the University well as we anticipate future growth in the infrastructure and the attendant need to go out into the bond market for financing capital projects. Finally, the University welcomed a new president on August 1, Strengthening the working relationship with the State s executive and legislative leadership is a high priority, with the intent of improving the University's advocacy and support when it comes to funding and related issues. In addition, Utah will be electing a new governor in November 2004, and both candidates have made education one of the key focuses of their campaigns. Clearly, the State and the University are entering into a new era with new leadership and new opportunities to address current and future issues with the energy and enthusiasm that change often brings. 17
22
23 Financial Statements
24 THE UNIVERSITY OF UTAH (in thousands of dollars) As of June 30 Statement of Net Assets ASSETS Current Assets Cash and cash equivalents (Notes 2 & 4) $ 405,614 $ 252,592 Short-term investments (Notes 2 & 4) 25,100 40,113 Receivables, net (Note 5) 188, ,248 Inventory 25,435 23,440 Other assets (Note 6) 8,389 12,338 Total current assets 652, ,731 Noncurrent Assets Restricted cash and cash equivalents (Notes 2 & 4) 48,895 28,048 Restricted short-term investments (Notes 2 & 4) Investments (Notes 3 & 4) 251, ,472 Restricted investments (Notes 3 & 4) 231, ,569 Restricted receivables, net (Note 5) 56,669 32,256 Donated property held for sale 3,155 2,816 Other assets (Note 6) 17,145 19,633 Capital assets, net 1,025,401 1,024,498 Total noncurrent assets 1,634,386 1,586,927 Total assets 2,286,997 2,101,658 LIABILITIES Current Liabilities Accounts payable 79,456 59,417 Accrued payroll 52,460 41,564 Compensated absences & postemployment benefits (Note 1) 3,838 3,815 Deferred revenue (Note 9) 29,391 19,107 Deposits & other liabilities (Notes 11 & 15) 66,576 61,463 Bonds, notes and contracts payable (Notes 14, 15, & 16) 20,033 20,870 Total current liabilities 251, ,236 Noncurrent Liabilities Compensated absences & postemployment benefits (Note 1) 28,522 26,422 Deposits & other liabilities (Notes 11 & 15) 11,732 9,613 Bonds, notes and contracts payable (Notes 14, 15, & 16) 310, ,346 Total noncurrent liabilities 350, ,381 Total liabilities 602, ,617 NET ASSETS Invested in capital assets, net of related debt 706, ,717 Restricted for: Nonexpendable: Instruction 84,043 68,471 Research 26,389 22,715 Public service 34,843 27,851 Academic support 27,580 23,424 Scholarships 71,049 61,330 Other 3,941 3,659 Expendable: Instruction 9,389 8,695 Research 110, ,247 Public service 15,528 18,739 Academic support 37,341 33,811 Institutional support 19,875 21,334 Scholarships 18,520 3,625 Loans 35,981 36,081 Debt service 14,897 14,842 Capital additions 54,708 22,115 Other 4,082 5,555 Unrestricted 409, ,830 Total net assets $1,684,466 $1,547, The accompanying notes are an integral part of these financial statements [For Comparison Only]
25 THE UNIVERSITY OF UTAH Statement of Revenues, Expenses, and Changes in Net Assets (in thousands of dollars) For the Years Ended June 30 [For Comparison Only] OPERATING REVENUES AND EXPENSES Revenues: Tuition and fees (Note 1) $ 116,714 $ 107,796 Patient services (Note 1) 669, ,460 Federal grants and contracts 202, ,484 State and local grants and contracts 12,831 10,749 Nongovernmental grants and contracts 63,884 64,324 Sales and services (Note 1) 293, ,314 Auxiliary enterprises (Note 1) 63,781 63,508 Other operating revenues 47,433 36,028 Total operating revenues 1,469,583 1,348,663 Expenses: Compensation and benefits 906, ,590 Scholarships and fellowships 21,062 17,541 Utilities 20,309 19,627 Depreciation and amortization 95,952 90,062 Other operating expenses 646, ,879 Total operating expenses 1,691,073 1,547,699 Operating loss (221,490) (199,036) NONOPERATING REVENUES (EXPENSES) State appropriations 227, ,821 Gifts 22,123 27,482 Investment income 57,449 27,338 Interest (16,503) (17,692) Other nonoperating revenues (expenses) 2,102 (3,608) Total nonoperating revenues 293, ,341 Gain before capital and permanent endowment additions 71,516 62,305 Capital appropriations 11,600 7,730 Capital grants and gifts 42,920 20,322 Additions to permanent endowments 11,389 7,174 Total capital and permanent endowment additions 65,909 35,226 Increase in net assets 137,425 97,531 NET ASSETS Net assets - beginning of year, restated (Note 1) 1,547,041 1,449,510 Net assets - end of year $1,684,466 $1,547, The accompanying notes are an integral part of these financial statements
26 THE UNIVERSITY OF UTAH (in thousands of dollars) For the Years Ended June 30 Statement of Cash Flows [For Comparison Only] CASH FLOWS FROM OPERATING ACTIVITIES Receipts from tuition and fees $124,440 $ 111,245 Receipts from patient services 660, ,966 Receipts from contracts and grants 278, ,264 Receipts from auxiliary and educational services 358, ,159 Collection of loans to students 8,893 7,893 Payments to suppliers (642,710) (630,432) Payments for personal services (893,850) (833,909) Payments for scholarships/fellowships (21,062) (17,541) Loans issued to students (9,546) (6,988) Other 59,053 33,060 Net cash used by operating activities (77,687) (97,283) CASH FLOWS FROM NONCAPITAL FINANCING ACTIVITIES State appropriations 227, ,821 Gifts Endowment 11,287 7,206 Nonendowment 19,636 27,949 Other 2,079 (3,931) Net cash provided by noncapital financing activities 260, ,045 CASH FLOWS FROM CAPITAL AND RELATED FINANCING ACTIVITIES Proceeds from capital debt 9,724 Capital appropriations 11,600 7,730 Gifts 25,217 26,176 Purchase of capital assets (88,378) (95,515) Principal paid on capital debt (20,857) (21,376) Interest paid on capital debt (16,486) (17,263) Net cash used by capital and related financing activities (79,180) (100,248) CASH FLOWS FROM INVESTING ACTIVITIES Proceeds from sales and maturities of investments 265, ,624 Receipt of interest on investments 20,633 22,727 Purchase of investments (215,799) (196,005) Net cash provided by investing activities 69,899 8,346 Net increase in cash 173,869 69,860 Cash - beginning of year 280, ,780 Cash - ending of year $454,509 $280, The accompanying notes are an integral part of these financial statements
27 THE UNIVERSITY OF UTAH (in thousands of dollars) For the Years Ended June 30 Statement of Cash Flows [For Comparison Only] RECONCILIATION OF NET OPERATING LOSS TO CASH USED BY OPERATING ACTIVITIES: Operating loss $ (221,490) $ (199,036) Adjustments to reconcile operating loss to cash used by operating activities: Depreciation expense 95,952 90,062 Change in assets and liabilities: Receivables, net (7,168) 3,666 Inventory (1,994) (2,393) Other assets 6,439 3,258 Accounts payable 20,039 7,935 Accrued payroll 10,896 (1,603) Compensated absences & postemployment benefits 2,122 1,284 Deferred revenue 10,285 (2,372) Deposits & other liabilities 7,232 1,916 Net cash used by operating activities $ (77,687) $ (97,283) NONCASH INVESTING, CAPITAL, AND FINANCING ACTIVITIES Capital leases $ 8,479 $ 7,974 Donated property and equipment 5,025 5,579 Annuity and life income (6) 106 Increase in fair value of investments 37,994 6,384 Total noncash investing, capital, and financing activities $ 51,492 $ 20, The accompanying notes are an integral part of these financial statements

28 Notes to Financial Statements
29 1. SUMMARY OF SIGNIFICANT ACCOUNTING POLICIES A. Reporting Entity The financial statements report the financial activity of the University of Utah (University), including the University of Utah Hospitals and Clinics (UUHC). The University is a component unit of the State of Utah. In addition, University administrators hold a majority of seats on the boards of trustees of two other related entities representing component units of the University. Component units are entities that are legally separate from the University, but are financially accountable to the University, or whose relationships with the University are such that exclusion would cause the University s financial statements to be misleading or incomplete. The relationship of the University with its component units requires the financial activity of the component units to be blended with that of the University. Copies of the financial report of each component unit can be obtained from the University. The component units of the University are the University of Utah Research Foundation (UURF) and Associated Regional University Pathologists, Incorporated (ARUP). UURF is a not-for-profit corporation governed by a board of directors who are affiliated with the University with the exception of one. The operations of UURF include the leasing and the administration of Research Park (a research park located on land owned by the University), the leasing of certain buildings, and the commercial development of patents and products developed by University personnel. The fiscal year end for UURF is June 30. Other independent auditors audited UURF and their report, dated September 9, 2004, has been issued under separate cover. ARUP is a for-profit corporation that provides clinical laboratory services to medical centers, hospitals, clinics and other clinical laboratories throughout the United States, including UUHC. ARUP contracts with the Department of Pathology of the University of Utah School of Medicine to provide pathology consulting services. The fiscal year end for ARUP is June 30. Other independent auditors audited ARUP and their report, dated August 20, 2004, has been issued under separate cover. All Governmental Accounting Standards Board (GASB) pronouncements and all applicable Financial Accounting Standards Board pronouncements are applied by UURF and ARUP in the accounting and reporting of their operations. B. Basis of Accounting All statements have been prepared using the economic resources measurement focus and the accrual basis of accounting. Operating activities include all revenues and expenses, derived on an exchange basis, used to support the instructional, research and public service efforts, and other University priorities. Significant recurring sources of the University s revenues are considered nonoperating as defined by GASB Statement No. 34, Basic Financial Statements and Management s Discussion and Analysis for State and Local Governments, and required by GASB Statement No. 35, Basic Financial Statements and Management s Discussion and Analysis for Public Colleges and Universities. When both restricted and unrestricted resources are available, such resources are spent and tracked at the discretion of the department within the guidelines of donor restrictions. Investments are recorded at fair value in accordance with GASB Statement No. 31, Accounting and Financial Reporting for Certain Investments and for External Investment Pools. Accordingly, the change in fair value of investments is recognized as an increase or decrease to investment assets and investment revenue. The University distributes earnings from pooled investments based on the average daily investment of each participating account or for endowments, 25
30 distributed according to the University s spending policy. In accordance with GASB Statement No. 33, Accounting and Financial Reporting for Nonexchange Transactions, the University recognizes gifts, grants, appropriations, and the estimated net realizable value of pledges as revenue as soon as all eligibility requirements imposed by the provider have been met. Patient revenue of UUHC and the School of Medicine medical practice plan are reported net of third-party adjustments. In accordance with GASB Statement No. 34, certain expenses are netted against revenues as allowances. The following schedule presents revenue allowances for the years ended June 30, 2004 and 2003: Revenue Tuition and fees $11,619,653 $ 9,312,966 Patient services 35,682,964 31,024,136 Sales and services 8,650 9,428 Auxiliary enterprises 812, ,422 C. Inventories Inventories of UUHC are stated at the lower of cost or market using the first-in, first-out method. Bookstore inventories are valued using the retail inventory method. All other inventories are stated at the lower of cost or market using the first-in, first-out method or on a basis which approximates cost determined on the first-in, first-out method. D. Research and Development Costs Research and development costs of ARUP are expensed as incurred. These costs, for the year ended June 30, 2004, were approximately $5,466,000. E. Compensated Absences & Postemployment Benefits Employees vacation leave is accrued at a rate of eight hours each month for the first five years and increases to a rate of hours each month after fifteen years of service. There is no requirement to use vacation leave, but a maximum of thirty days plus one-year accrual may be carried forward at the beginning of each calendar year. Employees are reimbursed for unused vacation leave upon termination and vacation leave is expended when used or reimbursed. The liability for vacation leave at June 30, 2004, was approximately $29,422,000. Employees earn sick leave at a rate of eight hours each month, with an accumulation limit of 1,040 hours. The University does not reimburse employees for unused sick leave. Each year, eligible employees may convert up to four days of unused sick leave to vacation leave based on their use of sick leave during the year. Sick leave is expended when used. In addition, the University provides postemployment benefits, as approved by the Board of Trustees, for those employees who have attained the age of 60 with at least fifteen years of service and elect the University s early retirement option. Currently, 103 eligible employees have elected to take the early retirement option. The University pays each early retiree an annual amount equal to the lesser of 20.00% of the retiree s final salary or their estimated social security benefit, as well as health care and life insurance premiums until the employee reaches the age of 65. The funding for these postemployment benefits is provided on a pay-as-you-go basis. For the year ended June 30, 2004, these expenditures were approximately $1,548,000. F. Construction The Utah State Division of Facilities Construction and Management administers most of the construction of facilities for state institutions, maintains records, and furnishes cost information for recording plant assets on the books of the University. Interest expense incurred for construction of capital facilities is considered immaterial and is not capitalized. Construction projects administered by the Utah State Division of Facilities Construction and Management that were started prior to fiscal 26
31 year 2002 and are not completed are recorded as Construction in Progress. Construction projects beginning in fiscal year 2002 and after will not be recorded on the books of the University until the facility is available for occupancy. G. Accounting Changes The University has implemented GASB Statement No. 40, Deposit and Investment Risk Disclosures, which requires certain reporting changes for the disclosure of deposits and investment risk. H. Disclosures The footnotes related to the financial statements for the fiscal year ended June 30, 2003 have not been repeated in this report but are available in the separately issued financial statements for that year. Also, certain amounts for fiscal year 2003 have been restated and fiscal year 2003 information is presented for comparison purposes only. oversight for the PTIF. The PTIF is available for investment of funds administered by any Utah Public Treasurer. The fair value of the PTIF investments is approximately the same as the stated value of the PTIF shares at June 30, At June 30, 2004, cash and cash equivalents and short-term investments consisted of: Cash and Cash Equivalents Cash $ (871,896) Money market funds 12,437,547 Time certificates of deposit 12,862,815 Obligations of the U.S. Government and its agencies 34,598,943 Utah Public Treasurer s Investment Fund 395,481,389 Total (fair value) $454,508,798 Short-term Investments Obligations of the U.S. Government and its agencies $ 25,450,051 Total (fair value) $ 25,450, CASH, CASH EQUIVALENTS, AND SHORT-TERM INVESTMENTS Cash and cash equivalents consists of cash and short-term investments with an original maturity of three months or less. Cash, depending on source of receipts, is pooled, except for cash and cash equivalents held by ARUP and when legal requirements dictate the use of separate accounts. The cash balances and cash float from outstanding checks are invested principally in short-term investments that conform to the provisions of the Utah Code. It is the practice of the University that the investments ordinarily be held to maturity at which time the par value of the investments will be realized. The Utah State Treasurer s Office operates the Utah Public Treasurer s Investment Fund (PTIF) which is invested in accordance with the State Money Management Act. The State Money Management Council provides regulatory 3. INVESTMENTS Funds available for investment are pooled to maximize return and minimize administrative cost, except for funds that are authorized by the University administration to be separately invested or which are separately invested to meet legal or donor requirements. Investments received as gifts are recorded at market or appraised value on the date of receipt. Other investments are also recorded at fair value. UURF receives, in exchange for patent rights, common stock of newly organized companies acquiring these patents. Inasmuch as the stock is ordinarily not actively traded, the fair value is ordinarily not ascertainable and any realization from the sale of the stock is often uncertain. Therefore, prior to July 1, 1997, such stock is recorded by UURF at a nominal value. Effective July 1, 1997, UURF adopted GASB Statement No. 31. Accordingly, those stocks that are publicly traded are recorded at their fair value on June 30,
32 University personnel manage certain portfolios, while other portfolios are managed by banks, investment advisors or through trust agreements. According to the Uniform Management of Institutional Funds Act, Section of the Utah Code, the governing board may appropriate for expenditure for the purposes for which an endowment is established, as much of the net appreciation, realized and unrealized, of the fair value of the assets of an endowment over the historic dollar value as is prudent under the facts and circumstances prevailing at the time of the action or decision. The endowment income spending policy at June 30, 2004, is 4% of the twelve quarter moving average of the market value of the endowment pool. The spending policy is reviewed periodically and any necessary changes are made. The amount of net appreciation on investments of donor-restricted endowments that were available for authorization for expenditure at June 30, 2004, was approximately $43,848,000. The net appreciation is a component of restricted expendable net assets. At June 30, 2004, the investment portfolio composition was as follows: Obligations of the U.S. Government and its agencies $119,466,667 Mutual funds 334,192,551 Common and preferred stocks 29,111,500 Total (fair value) $482,770, DEPOSITS AND INVESTMENTS The Utah State Money Management Act defines the types of securities authorized as appropriate investments for the University and the conditions for making investment transactions. Investment transactions may be conducted only through qualified depositories, certified dealers, or directly with issuers of the investment securities. Statutes authorize the University to invest in negotiable or nonnegotiable deposits of qualified depositories and permitted negotiable depositories; repurchase and reverse repurchase agreements; commercial paper that is classified as first tier by two nationally recognized statistical rating organizations, one of which must be Moody s Investors Service or Standard & Poor s; bankers acceptances; obligations of the United States Treasury including bills, notes, and bonds; bonds, notes, and other evidence of indebtedness of political subdivisions of the State; fixed rate corporate obligations and variable rate securities rated A or higher, or the equivalent of A or higher, by two nationally recognized statistical rating organizations; shares or certificates in a money market mutual fund as defined in the Act; and the Utah State Public Treasurer s Investment Fund. Statutes also authorize the University to invest funds acquired by gift, private grant, and the corpus of funds functioning as endowments according to the rules of the State Money Management Council. Rule 2 allows the University to invest these funds in any of the above investments or any of the following subject to satisfying certain criteria: professionally managed pooled or commingled investment funds, or mutual funds which satisfy certain criteria; common stock, convertible preferred stock or convertible bonds; corporate bonds or debentures; and alternative investments as defined in the rule. The PTIF is not registered with the SEC as an investment company. The PTIF is authorized and regulated by the State Money Management Act, Section 51-7, Utah Code Annotated, 1953, as amended. The Act established the State Money Management Council which oversees the activities of the State Treasurer and the PTIF and details the types of authorized investments. Deposits in the PTIF are not insured or otherwise guaranteed by the State of Utah, and participants share proportionally in any realized gains or losses on investments. 28
33 The PTIF operates and reports to participants on an amortized cost basis. The income, gains, and losses net of administration fees, of the PTIF are allocated based upon the participant s average daily balance. The fair value of the PTIF investment pool is approximately equal to the value of the pool shares. The University s participation in mutual funds may indirectly expose it to risks associated with using, holding, or writing derivatives. However, specific information about any such transactions is not available to the University. A. Deposits At June 30, 2004, the carrying amounts of the University s deposits and bank balances were $20,665,109 and $41,889,014, respectively. The bank balances of the University were insured for $400,000, by the Federal Deposit Insurance Corporation. The bank balances in excess of $400,000 were uninsured and uncollateralized, leaving $41,489,014 exposed to custodial credit risk. All deposits were held by a qualified depository as defined by the State Money Management Act. The State of Utah does not require collateral on deposits. Custodial credit risk for deposits is the risk that, in the event of a bank failure, the University s deposits may not be returned to the University. The University does not have a formal deposit policy for custodial credit risk. B. Investments As of June 30, 2004, the University had investments and maturities as shown in Figure 1. Interest Rate Risk: Interest rate risk is the risk that changes in interest rates will adversely affect the fair value of an investment. The University s policy for managing its exposure to fair value loss arising from increasing interest rates is to comply with the State Money Management Act. Section of the Act requires that the remaining term to maturity of investments may not exceed the period of availability of the funds to be invested. Except for University funds acquired by gifts, grants, or the corpus of funds functioning as endowments, the Act further limits the remaining term to maturity on all investments in commercial paper, bankers acceptances, fixed rate negotiable deposits and fixed rate corporate obligations, to days or less. In addition, variable rate negotiable deposits and variable rate securities may not have a remaining term to final maturity exceeding two years. For University funds acquired by gifts, grants, or the corpus of funds functioning as endowments, Rule 2 of the State Money Figure 1. Investment Maturities (in years) Fair Less Investment Type Value than Money market funds $ 3,321,070 $ 3,321,070 Utah Public Treasurer s Investment Fund 395,481, ,481,389 U.S. Treasuries 34,899,518 5,006,251 $ 29,568,900 $ 324,367 U.S. Agencies 144,616,143 55,042,743 89,573,400 Mutual bond funds 73,402,461 9,753,454 63,649,007 Totals 651,720,581 $458,851,453 $128,895,754 $63,973,374 Common and preferred stocks 29,111,500 Absolute return fund 45,461,483 Equity funds 175,455,434 Hedge fund 38,857,944 Venture capital funds 1,015,229 Totals $941,622,171 29
34 Figure 2. Quality Rating Fair Investment Type Value AAA Unrated Money market funds $ 3,321,070 $ 3,045,888 $ 275,182 Utah Public Treasurer s Investment Fund 395,481, ,481,389 U.S. Treasuries 34,899,518 34,899,518 U.S. Agencies 144,616, ,616,143 Mutual bond funds 73,402,461 47,915 73,354,546 Totals $651,720,581 $147,709,946 $504,010,635 Management Council does not allow the dollarweighted average maturity of fixed-income securities to exceed ten years. Credit Risk: Credit risk is the risk that an issuer or other counterparty to an investment will not fulfill its obligations. The University s policy for reducing its exposure to credit risk is to comply with the State Money Management Act as previously discussed. At June 30, 2004, the University had debt securities and quality ratings as shown in Figure 2. Custodial Credit Risk: Custodial credit risk for investments is the risk that, in the event of a failure of the counterparty, the University will not be able to recover the value of the investments that are in the possession of an outside party. The University does not have a formal investment policy for custodial credit risk that further limits custodial arrangements from what is required by the State Money Management Act in regard to custody of the University s investments. At June 30, 2004, U.S. Treasuries and Agencies debt securities investments were held in a University account at the University s custodial bank, Wells Fargo Bank. Concentration of Credit Risk: Concentration of credit risk is the risk of loss attributed to the magnitude of a government s investment in a single issuer. The University s policy for reducing this risk of loss is to comply with the Rules of the State Money Management Council. For University funds acquired by gifts, grants, or the corpus of funds functioning as endowments, Rule 2 of the State Money Management Council limits investments in equity securities and fixed income securities to no more than 5% of all funds in any one issuer and no more than 25% of all funds in any one industry. No more than 5% of all funds may be invested in securities of a corporation that has been in continuous operation for less than three years. No more than 5% of the outstanding voting securities of any one corporation may be held. In addition, Rule 2 limits investment concentrations in certain types of investments. Rule 17 of the State Money Management Council limits investments in a single issuer of commercial paper and corporate obligations to 5-10% depending upon the total dollar amount held in the portfolio. At June 30, 2004, there were no single issuer investments that exceeded 5%. 5. RECEIVABLES Accounts, pledges, and interest receivable include hospital patient accounts, medical services plan accounts, trade accounts, pledges, interest income on investments, and other receivables. Loans receivable predominantly consist of student loans. Allowances for doubtful accounts are established by charges to operations to cover anticipated losses from accounts receivable generated by sales and services and student loans. Such accounts are charged to the allowance when collection appears doubtful and the accounts are referred to collection agencies. Any subsequent recoveries are credited to the 30

35 allowance accounts. Allowances are not established for pledges or in those instances where receivables consist of amounts due from governmental units or where receivables are not material in amount. The following schedule presents receivables at June 30, 2004, including approximately $26,201,000 and $30,468,000 of noncurrent loans and pledges receivable, respectively: Accounts $191,728,815 Contracts and grants 28,167,866 Loans 31,866,042 Pledges 30,467,813 Interest 1,481, ,712,465 Less allowances for bad debt (38,969,829) Receivables, net $244,742, DEFERRED CHARGES AND OTHER ASSETS The costs associated with issuing long-term bonds payable are deferred and amortized over the life of the related bonds using the straightline method, which approximates the effective interest method. In addition, goodwill associated with the purchase of certain health clinics is amortized using the straight-line method. 7. CAPITAL ASSETS Buildings; infrastructure and improvements, which includes roads, curbs and gutters, streets and sidewalks, and lighting systems; land; equipment; and library materials are valued at cost at the date of acquisition or at fair market value at the date of donation in the case of gifts. Buildings, infrastructure and improvements, and additions to existing assets are capitalized when acquisition cost equals or exceeds $50,000. Equipment is capitalized when acquisition costs exceed $5,000 for the University or $500 for UUHC. All costs incurred in the acquisition of library materials are capitalized. The University acquires some of its 31
36 equipment from inventories of government excess property for which the University pays a minimal processing charge. Such property is valued at the original cost paid by the governmental entity. All campus land acquired through grants from the U.S. Government has been valued at $3,000 per acre. Other land acquisitions have been valued at original cost or fair market value at the date of donation in the case of gifts. Buildings, improvements, land, and equipment of component units have been valued at cost at the date of acquisition. Capital assets of the University and its component units are depreciated on a straightline basis over their estimated useful lives. The estimated useful lives of University assets extends to forty years on buildings, fifteen years on infrastructure and improvements, twenty years on library books, and from five to fifteen years on equipment. The estimated useful lives of component unit assets extends to fifty years on buildings and improvements and from three to eight years on equipment. Land, art and special collections, and construction in progress are not depreciated. At June 30, 2004, the University had outstanding commitments for the construction and remodeling of University buildings of approximately $44,683,000. Capital assets at June 30, 2004, are shown in Figure PENSION PLANS AND RETIREMENT BENEFITS As required by state law, eligible nonexempt employees (as defined by the U.S. Fair Labor Standards Act) of the University are covered by either the Utah State and School Contributory or Noncontributory or the Public Safety Noncontributory Retirement Systems and eligible exempt employees (as defined by the U.S. Fair Labor Standards Act) are covered by the Teachers Insurance and Annuity Association College Retirement Equities Fund (TIAA-CREF). Eligible employees of ARUP are covered by a separate defined contribution pension plan and a profit sharing plan. The University contributes to the Utah State and School Contributory and Noncontributory and the Public Safety Noncontributory Retirement System (Systems) that are multi-employer, cost sharing, defined benefit pension plans. The Figure 3. Beginning Ending _ Balance _ Additions _ Retirements _ Balance Buildings $1,030,348,393 $27,174,381 $ 2,652,943 $1,054,869,831 Infrastructure and improvements 107,613,250 12,560, , ,740,959 Land 17,267,453 17,267,453 Equipment 423,354,994 45,887,118 32,303, ,938,746 Library materials 135,070,602 5,665,480 1,300, ,435,441 Art and special collections 28,702,402 3,226,662 31,929,064 Construction in progress 68,512,697 38,676,854 _ 31,450,783 75,738,768 Total cost 1,810,869, ,190,742 _ 68,140,271 1,875,920,262 Less accumulated depreciation Buildings 360,989,508 40,775, , ,302,415 Infrastructure & improvements 58,203,599 5,622, ,619 63,552,738 Equipment 295,763,793 42,544,994 28,469, ,839,591 Library materials 71,414,925 5,651,009 _ 1,241,972 75,823,962 Total accumulated depreciation 786,371,825 94,594,109 _ 30,447, ,518,706 Capital assets, net $1,024,497,966 $38,596,633 $ 37,693,043 $1,025,401,556 _ 32
37 Systems provide refunds, retirement benefits, annual cost of living adjustments, and death benefits to plan members and beneficiaries in accordance with retirement statutes. The Systems are established and governed by the respective sections of Chapter 49 of the Utah Code Annotated, 1953, as amended. The Utah State Retirement Office Act provides for the administration of the Utah Retirement Systems and Plans under the direction of the Utah State Retirement Board (Board) whose members are appointed by the Governor. The Systems issue a publicly available financial report that includes financial statements and required supplementary information for the Systems. A copy of the report may be obtained by writing to the Utah Retirement Systems. Plan members in the State and School Contributory Retirement System are required to contribute 6.00% of their annual covered salaries, all of which is paid by the University, and the University is required to contribute 7.21% of their annual salaries. In the State and School Noncontributory Retirement System and the Public Safety Noncontributory Retirement System, the University is required to contribute 13.20% (including 1.50% to a 401(k) salary deferral program) and 21.15%, respectively, of plan members annual salaries. The contribution requirements of the Systems are authorized by statute and specified by the Board and the contribution rates are actuarially determined. TIAA-CREF provides individual retirement fund contracts with each participating employee. Benefits provided to retired employees are based on the value of the individual contracts and the estimated life expectancy of the employee at retirement. Contributions by the University to the employee s contract become vested at the time the contribution is made. Employees are eligible to participate from the date of employment and are not required to contribute to the fund. For the year ended June 30, 2004, the University s contribution to this defined contribution pension plan was 14.20% of the employees annual salaries. The University has no further liability once contributions are made. Certain health clinic employees hired prior to January 1, 2001, were fully vested as of that date. Employees hired subsequent to January 1, 2001, are eligible to participate in the plan one year after hire date and vest after six years. The University s contribution for these health clinic employees was 3.00% of the employees annual salaries. The ARUP defined contribution pension and profit sharing plans provide retirement benefits for all employees who have one year of service and have worked 1,000 hours during the plan year. Employees are fully vested in both plans after five years of service. For the year ended June 30, 2004, ARUP contributed 5.00% of the employees annual salaries (less forfeitures) to the pension plan. Contributions to the profit sharing plan are at the discretion of ARUP. For the years ended June 30, 2004, 2003, and 2002, the University s contributions to the Systems, as shown in Figure 4, were equal to the required amounts. Figure State and School Contributory Retirement System $ 1,312,287 $ 1,273,895 $ 1,419,412 State and School Noncontributory Retirement System 18,665,355 18,098,640 20,178,128 Public Safety Noncontributory Retirement System 277, , ,877 TIAA-CREF 58,427,949 60,285,163 68,747,144 Pension plan 1,989,086 2,303,659 2,646,171 Profit sharing plan 1,468,390 2,256,037 3,173,865 Total contributions $82,141,021 $84,478,070 $96,444,597 33
38 9. DEFERRED REVENUE Deferred revenue consists of summer school tuition and student fees, advance payments on grants and contracts, and results of normal operations of auxiliary enterprises and service units. 10. FUNDS HELD IN TRUST BY OTHERS Funds held in trust by others are neither in the possession of nor under the management of the University. These funds, which are not recorded on the University s financial records and which arose from contributions, are held and administered by external fiscal agents, selected by the donors, who distribute net income earned by such funds to the University, where it is recorded when received. The fair value of funds held in trust at June 30, 2004, was $47,360,966. In addition, certain funds held in trust by others are comprised of stock, which is reported at a value of $7,001,819 as of June 30, 2004, based on a predetermined formula. The fair value of this stock as of June 30, 2004 cannot be determined because the stock is not actively traded. 11. RISK MANAGEMENT The University maintains insurance coverage for commercial general liability, automobile, errors and omissions, and property (building and equipment) through policies administered by the Utah State Risk Management Fund. Employees of the University and authorized volunteers are covered by workers compensation and employees liability through the Workers Compensation Fund of Utah. In addition, the University maintains selfinsurance funds for health care, dental, and auto/physical damage, as well as hospital and physicians malpractice liability self-insurance funds, which are held in trust with an independent financial institution in compliance with Medicare reimbursement regulations. Based on an analysis prepared by UUHC administration, the administration believes that the balance in the trust funds as of June 30, 2004, is adequate to cover any claims incurred through that date. The University and UUHC have a claims made umbrella malpractice insurance policy in an amount considered adequate by its respective administrations for catastrophic malpractice liabilities in excess of the trusts fund balances. The estimated self-insurance claims liability at June 30, 2004, is based on the requirements of GASB Statement No. 10, Accounting and Financial Reporting for Risk Financing and Related Insurance Issues, which requires that a liability for claims be reported if information prior to the issuance of the financial statements indicates that it is probable that a liability has been incurred at the date of the financial statements and the amount of the loss can be reasonably estimated. Changes in the University s estimated selfinsurance claims liability are as follows: Estimated claims liability - beginning of year $ 32,830,781 Current year claims and changes in estimates 100,540,860 Claim payments, including related legal and administrative expenses (90,512,411) Estimated claims liability - end of year $ 42,859,230 The University has recorded the investments of the malpractice liability trust funds at June 30, 2004, and the estimated liability for selfinsurance claims at that date in the Statement of Net Assets. The income on fund investments, the expenses related to the administration of the self-insurance and malpractice liability trust funds, and the estimated provision for the claims liability for the year then ended are recorded in the Statement of Revenues, Expenses, and Changes in Net Assets. 34
39 12. INCOME TAXES The University, as a political subdivision of the state of Utah, has a dual status for federal income tax purposes. The University is both an Internal Revenue Code (IRC) Section 115 organization and an IRC Section 501(c)(3) charitable organization. This status exempts the University from paying federal income tax on revenue generated by activities which are directly related to the University s mission. This exemption does not apply to Unrelated Business Activities. On these activities, the University is required to report and pay federal and state income tax. UURF is not subject to income taxes under Section 501(c)(3) of the Internal Revenue Code. In April 2001, ARUP received a private letter ruling from the Internal Revenue Service stating that certain income providing an essential governmental function is exempt from federal income taxes under Internal Revenue Code Section 115. As a result of this ruling, ARUP eliminated its deferred tax assets and liabilities and filed for refunds of previously paid federal and state income taxes. ARUP collected $5,616,700 in income tax refunds and $1,791,779 in related interest during the year ended June 30, No additional income tax refunds are expected. 13. HOSPITAL REVENUE A. Net Patient Service Revenue UUHC reports net patient service revenue at the estimated net realizable amounts from patients, third-party payors, and others for services rendered, including estimated retroactive adjustments under reimbursement agreements with third-party payors. Retroactive adjustments are accrued on an estimated basis in the period the related services are rendered and adjusted in future periods as final settlements are determined. Charity care is excluded from net patient service revenue. UUHC has third-party payor agreements with Medicare and Medicaid that provide for payments to UUHC at amounts different from established rates. Inpatient acute care services rendered to Medicare and Medicaid program beneficiaries are paid at prospectively determined rates per discharge. These rates vary according to a patient classification system that is based on clinical, diagnostic, and other factors. Outpatient services rendered to Medicaid program beneficiaries and certain outpatient services and defined capital costs related to Medicare beneficiaries are paid based on a cost reimbursement basis. Medicare reimbursements are based on a tentative rate with final settlement determined after submission of annual cost reports by UUHC and audits thereof by the Medicare fiscal intermediary. The estimated final settlements for open years are based on preliminary cost findings after giving consideration to interim payments that have been received on behalf of patients covered under these programs. B. Charity Care UUHC maintains records to identify and monitor the level of charity care it provides. Based on established rates, the charges foregone as a result of charity during the year ended June 30, 2004, were approximately $20,692, LEASES A. Revenue UURF receives lease revenues from noncancellable sublease agreements with tenants of the Research Park, from tenants occupying six buildings owned by UURF. The lease revenue to be received from these noncancellable leases for each of the subsequent five years is $6,000,000, and for twenty years thereafter, comparable annual amounts. Most lease revenue is subject to escalation based on changes in the Consumer 35
40 Price Index (CPI). Since such escalations are dependent upon future changes in the CPI, these escalations, if any, are not reflected in the minimum noncancellable lease revenues listed above. B. Commitments The University leases buildings and office and computer equipment. Capital leases are valued at the present value of future minimum lease payments. Assets associated with the capital leases are recorded as buildings and equipment together with the related long-term obligations. Assets currently financed as capital leases amount to $16,875,000 and $102,785,314 for buildings and equipment, respectively. Accumulated depreciation for these buildings and equipment amounts to $1,202,344 and $54,004,786, respectively. Capital leases of ARUP are guaranteed by the University. Operating leases and related assets are not recorded in the Statement of Net Assets. Payments are recorded as expenditures when incurred and amount to approximately $9,432,000 for the University and $4,337,000 for component units for the year ended June 30, Total operating lease commitments for the University include approximately $5,755,000 of commitments to component units. Included in the above component unit lease expenditures is a lease by ARUP for its principal laboratory building, under a long-term agreement, from a partnership in which one of its directors is a principal. The agreement has two five-year renewal options and includes rent increases of two and three percent annually in the sixth and eleventh years from the commencement of the lease. Total lease payments for the year ended June 30, 2004 was $4,330,402. The University entered into a Huntsman Cancer Institute capital sublease agreement in the amount of $16,875,000 dated November 1996 with the State of Utah, acting through its Department of Administrative Services Division of Facilities Construction and Management for the lease of the Huntsman Cancer Institute Building, located east of the University campus and adjacent to the University Hospital. The Huntsman sublease is an annually renewable lease with a final expiration date of May Annual payments began November 1999 and range from a low of $434,000 to a high of $1,607,255. At the end of the lease, title to the Huntsman Cancer Institute Building will be transferred to the University. Future minimum lease commitments for operating and capital leases as of June 30, 2004 are shown in Figure BONDS PAYABLE AND OTHER LONG-TERM LIABILITIES The long-term debt of the University consists of bonds payable, capital lease obligations, compensated absences, and other minor obligations. Figure 5. Fiscal Year Operating Capital 2005 $ 16,123,683 $13,841, ,364,844 11,223, ,476,252 9,239, ,941,863 7,994, ,496,842 20,316, ,811,224 30,452,498 Total future minimum lease payments $112,214,708 93,067,625 Amount representing interest (17,809,457) Present value of future minimum lease payments $75,258,168 36

41 The State Board of Regents of the State of Utah issues bonds to provide funds for the construction and renovation of major capital facilities and the acquisition of capital equipment for the University. In addition, revenue bonds have been issued to refund other revenue bonds and capitalized leases. The revenue bonds are special limited obligations of the University. The obligation for repayment is solely that of the University and payable from the net revenues of auxiliary enterprises and UUHC, student building fees, land grant income, and recovered indirect costs. Neither the full faith and credit nor the taxing power of the State of Utah or any other political subdivision of the State is pledged to the payment of the bonds, the distributions or other costs appertaining thereto. In 1985, the State Board of Regents authorized the University to issue Variable Rate Demand Industrial Development Bonds (University Inn Project 1985 Series) for the Salt Lake City Marriott University Park Hotel, separate from the University. The bonds are payable from the revenues of the hotel and the University has no responsibility or commitment for repayment of the bonds. The outstanding balance of the bonds at June 30, 2004, is $7,100,000. The Series 1997A Auxiliary and Campus Facilities Revenue Bonds currently bear interest at a weekly rate in accordance with the bond provisions. When a weekly rate is in effect, the Series 1997A Bonds are subject to purchase on the demand of the holder at a price equal to principal plus accrued interest on seven days notice and delivery to the University s tender agent. The University s remarketing agent is authorized to use its best efforts to sell the repurchased bonds at a price equal to 100 percent of the principal amount by adjusting the interest rate. If any Series 1997A Bonds cannot be remarketed to new holders, the tender agent is required to draw on an irrevocable standby bond purchase agreement to pay the purchase price of the bonds delivered to it. The standby bond purchase agreement is with the Bank of Nova Scotia and is valid through July 30, The University pays a quarterly fee for the services provided by the Bank of Nova Scotia. No funds have been drawn against the standby bond purchase agreement. The interest requirement for the Series 1997A Bonds is calculated using an interest rate of 1.08%, which is the rate in effect at June 30,
42 The following schedule lists the outstanding bonds payable of the University at June 30, 2004: Date Maturity Interest Original Current Balance Issue Issued Date Rate Issue Liability 6/30/2004 Auxiliary and Campus Facilities 3/1/ % - $ 11,140,000 $ 185,000 $ 1,875, % Research Facilities Revenue 4/1/ % - 21,050,000 1,451,298 11,965, % Auxiliary and Campus Facilities 7/30/ Variable 52,590, ,000 16,390,000 Hospital Revenue Refunding 12/1/ % - 24,615,000 3,143,997 9,873, % Hospital Revenue 6/1/ % - 25,020,000 54,176 25,633, % Auxiliary and Campus Facilities Revenue and Refunding 7/1/ % - 120,240,000 1,773, ,963, % Auxiliary and Campus Facilities 5/1/ % - 5,975, ,704 4,577, % Research Facilities Revenue 7/13/ % - 17,585, ,296 15,074, % Auxiliary and Campus Facilities 7/18/ %- 2,755,000 98,934 2,527, % Hospital Revenue 8/7/ %- 26,670,000 13,694 27,036, % Research Facilities Revenue 6/30/ %- 9,685, ,051 9,724, % Total $9,245,876 $243,641,739 UURF has purchased three buildings with two mortgages that are guaranteed by the University. The remaining amounts of the mortgages are $6,684,163 at 8.87% interest and $3,275,519 at 7.15% interest. The mortgages will be paid off on April 1, 2020 and September 1, 2021, respectively. The following schedule summarizes the changes in long-term liabilities for the year ended June 30, 2004: Beginning Ending Current Balance Additions Reductions Balance Portion Bonds payable $ 241,036,353 $ 9,724,221 $ 7,118,835 $ 243,641,739 $ 9,245,876 Capital leases payable 80,060,117 8,478,740 13,280,689 75,258,168 10,102,043 Notes & contracts payable 12,119,829 41, ,877 11,655, ,243 Total long-term debt 333,216,299 18,244,902 20,905, ,555,800 20,033,162 Compensated absences 30,237,305 21,201,555 19,079,428 32,359,432 3,837,490 Deposits & other liabilities 71,076,332 68,862,763 61,630,458 78,308,637 66,576,475 Total long-term liabilities $ 434,529,936 $108,309,220 $101,615,287 $ 441,223,869 $ 90,447,127 38

43 Maturities of principal and interest requirements for bonds, notes and contracts payable are as follows: _ Payments Fiscal Year Principal Interest 2005 $ 20,033,162 $ 16,191, ,276,932 15,430, ,167,730 14,612, ,311,440 13,844, ,947,267 12,774, ,547,181 46,350, ,535,338 28,927, ,138,599 15,253, ,598,151 6,273,287 Total $ 330,555,800 $169,658, RETIREMENT OF DEBT In prior years, the University defeased certain revenue bonds by placing the proceeds of new bonds and various bond reserves in irrevocable trusts to provide for all future debt service payments on the old bonds. Accordingly, the trust account assets and the liability for the defeased bonds are not included in the University s financial statements. The total principal amount of defeased bonds held in irrevocable trusts at June 30, 2004, is $4,330, FUNCTIONAL CLASSIFICATION OF EXPENSES The following schedule presents operating expenses by functional classification for the year ended June 30, 2004: Amount Function (in thousands) Instruction $ 216,498 Research 200,304 Public service 307,298 Academic support 61,481 Student services 16,205 Institutional support 49,725 Operation & maintenance of plant 41,332 Student aid 27,838 Other 328,810 Hospital 441,582 Total $1,691, SEGMENT INFORMATION The University issues revenue bonds to provide funds for the construction and renovation of major capital facilities and the acquisition of capital equipment for the University. Investors in these bonds rely solely on the revenue generated by specific activities, identified as segments, for repayment. The net revenue of the following segments has been pledged for the retirement of outstanding bonds payable. Auxiliary Campus and Facility Bond System is comprised of specific auxiliary enterprises, namely: University Bookstore, Residential Living, University Student Apartments, Commuter Services, Jon M. Huntsman Center, Rice-Eccles Stadium, and Union Building. These auxiliaries provide oncampus services for the benefit of students, faculty and staff. In addition to the net revenues of these auxiliaries, student building fees, state land grant income and a subsidy from the federal department of Housing and Urban Development are pledged to the retirement of all Auxiliary Campus and Facility bonds. 39
44 University of Utah Hospitals & Clinics (UUHC) is comprised of the University Hospitals, the University Neuropsychiatric Institute, and other clinics that provide health and psychiatric services to the community. Research Facilities is the revenue generated by charging approved facilities and administration rates to grants and contracts. The following schedule presents condensed financial information for each of the University s segments: STATEMENT OF NET ASSETS Auxiliary Campus Research & Facility System UUHC Facilities Assets Current assets Cash and cash equivalents $(2,775,062) $ 45,218,755 $33,265,898 Short-term investments 2,388,413 Accounts receivable, net 1,829,692 90,956,843 5,366,538 Inventory 3,574,944 13,174,971 Other assets 43,583 7,477,804 42,427 Total current assets 2,673, ,216,786 38,674,863 Noncurrent assets Investments 20,364,249 Total noncurrent assets 20,364,249 Total assets 2,673, ,581,035 38,674,863 Liabilities Current liabilities Accounts payable 967,102 16,501, ,810 Accrued payroll 12,226,241 Compensated absences 951,523 Deferred revenue 888,286 7,388,463 Deposits and other liabilities 817,769 23,365,833 Total current liabilities 2,673,157 60,433, ,810 Noncurrent liabilities Compensated absences 10,202,679 Deposits and other liabilities 8,804,377 Total noncurrent liabilities 19,007,056 Total liabilities 2,673,157 79,440, ,810 Net assets, unrestricted $ 0 $100,140,818 $38,204,053 40
45 STATEMENT OF REVENUES, EXPENSES, AND CHANGES IN NET ASSETS Auxiliary Campus Research & Facility System UUHC Facilities Operating Revenues and Expenses Revenues Sales and services $54,382,784 $536,565,304 Facilities and administration $57,313,279 Other operating revenues 11,592,768 Total operating revenues 54,382, ,158,072 57,313,279 Expenses Compensation and benefits 12,643, ,365,365 15,012,306 Other operating expenses 31,390, ,693,721 26,224,828 Total operating expenses 44,034, ,059,086 41,237,134 Operating income 10,348,777 54,098,986 16,076,145 Nonoperating Revenues (Expenses) State appropriations 4,318,000 Gifts 185 Investment income (loss) (1,203) 3,594 Total nonoperating revenues (expenses) (1,203) 4,321,779 Transfers Mandatory transfers, out (11,650,251) (14,064,912) (3,317,460) Nonmandatory transfers, in (out) 1,302,677 (32,297,891) (15,481,728) Total transfers, out (10,347,574) (46,362,803) (18,799,188) Increase (decrease) in net assets 0 12,057,962 (2,723,043) Net Assets Net assets - beginning of year 0 88,082,856 40,927,096 Net assets - end of year $ 0 $100,140,818 $38,204,053 STATEMENT OF CASH FLOWS Auxiliary Campus Research & Facility System UUHC Facilities Net cash provided (used) by Operating activities $10,585,636 $55,166,494 $16,110,096 Noncapital financing activities (10,347,574) (42,044,618) (18,799,188) Investing activities (1,203) 6,108,946 Net increase (decrease) in cash 236,859 19,230,822 (2,689,092) Cash (deficit) - beginning of year (3,011,921) 25,987,933 35,954,990 Cash (deficit) - end of year $(2,775,062) $45,218,755 $33,265,898 41
46 THE UNIVERSITY OF UTAH Governing Boards and Officers UTAH STATE BOARD OF REGENTS Nolan E. Karras Chair UNIVERSITY ADMINISTRATION Michael K. Young President E. George Mantes A. Lorris Betz Vice Chair Senior Vice President for Health Sciences Dean, School of Medicine Jerry C. Atkin Linnea S. Barney David W. Pershing Daryl C. Barrett Senior Vice President for Academic Affairs Bonnie Jean Beesley Kim R. Burningham Arnold B. Combe William Edwards Vice President for Administrative Services David J. Grant James S. Jardine Fred C. Esplin Michael R. Jensen Vice President for University Relations David J. Jordan Trenton Kemp Raymond F. Gesteland David L. Maher Vice President for Research Jed H. Pitcher Sara V. Sinclair Loretta F. Harper Marlon O. Snow Vice President for Human Resources Maria Sweeten J. Michael Mattsson Richard E. Kendell Vice President for Development Commissioner of Higher Education Barbara H. Snyder Vice President for Student Affairs BOARD OF TRUSTEES John K. Morris James L. Macfarlane General Counsel Chair C. Hope Eccles FINANCIAL AND ACCOUNTING SERVICES Vice Chair Jeffrey J. West H. Roger Boyer Associate Vice President for Gary L. Crocker Financial and Accounting Services Randy L. Dryer E. J. Garn Grant A. Moulton Amy M. Hansen Controller Jeffrey L. Hilton Alex Lowe Gloria T. Wilkinson Spencer F. Eccles Treasurer Laura Snow Secretary Barbara K. Nielsen Director of Governmental Accounting and Support Services Stephen P. Allen Manager, General Accounting 42
47
 581-5077 Fax (801)")
48 ANNUAL FINANCIAL REPORT PREPARED BY: The University of Utah Controller s Office 201 South Presidents Circle, Room 408 Salt Lake City, Utah (801) Fax (801)
The University of Utah Annual Financial Report A Component Unit of the State of Utah
 The University of Utah Annual Financial Report 2003 A Component Unit of the State of Utah THE UNIVERSITY OF UTAH Annual Financial Report 2003 ANNUAL FINANCIAL REPORT PREPARED BY: University of Utah Controller
Wayne State University. Financial Report September 30, 2005
 Financial Report September 30, 2005 Contents Independent Auditor s Report 1 Financial Statements Management s Discussion and Analysis - Unaudited 2-18 Balance Sheets 19 Statements of Revenues, Expenses
Auditors' Opinion 1. Management s Discussion & Analysis Statement of Net Assets 13. Statement of Revenues, Expenses, and Change in Net Assets 14
 Financial Report 2001-2002 TABLE OF CONTENTS Auditors' Opinion 1 Management s Discussion & Analysis 4 11 Statement of Net Assets 13 Statement of Revenues, Expenses, and Change in Net Assets 14 Statement
FINANCIAL STATEMENTS University of South Alabama Year ended September 30, 2002 with Report of Independent Auditors
 FINANCIAL STATEMENTS University of South Alabama Year ended September 30, 2002 with Report of Independent Auditors Financial Statements Year ended September 30, 2002 Contents Management s Discussion and
ANNUAL FINANCIAL REPORT THE UNIVERSITY OF UTAH A COMPONENT UNIT OF THE STATE OF UTAH
 ANNUAL FINANCIAL REPORT THE UNIVERSITY OF UTAH A COMPONENT UNIT OF THE STATE OF UTAH 2 0 1 7 TABLE OF CONTENTS Message from the President 2-3 Independent State Auditor s Report 4-5 Management s Discussion
THE COLLEGE OF NEW JERSEY FOUNDATION, INC. (A Component Unit of The College of New Jersey)
") THE COLLEGE OF NEW JERSEY FOUNDATION, INC. (A Component Unit of The College of New Jersey) Basic Financial Statements and Management s Discussion and Analysis June 30, 2014 and 2013 (With Independent Auditors
THE COLLEGE OF NEW JERSEY FOUNDATION, INC. (A Component Unit of The College of New Jersey) Basic Financial Statements and Management s Discussion and Analysis June 30, 2014 and 2013 (With Independent Auditors
INDEPENDENT AUDITORS REPORT 1 MANAGEMENT S DISCUSSION AND ANALYSIS Statements of Net Assets 11
 University of Idaho Financial Statements for the Years Ended June 30, 2003 and 2002 and Independent Auditors Report Including Single Audit Reports for the Year Ended June 30, 2003 UNIVERSITY OF IDAHO TABLE
ANNUAL FINANCIAL REPORT THE UNIVERSITY OF UTAH A COMPONENT UNIT OF THE STATE OF UTAH
 2018 ANNUAL FINANCIAL REPORT THE UNIVERSITY OF UTAH A COMPONENT UNIT OF THE STATE OF UTAH TABLE OF CONTENTS Message from the President 2-3 Independent State Auditor s Report 4-5 Management s Discussion
THE UNIVERSITY FOUNDATION AT SACRAMENTO STATE
 THE UNIVERSITY FOUNDATION AT SACRAMENTO STATE Independent Auditor s Report, Management s Discussion and Analysis, Basic Financial Statements and Supplemental Schedules Table of Contents Page(s) Independent
FINANCIAL STATEMENT REPORT
 FINANCIAL STATEMENT REPORT FOR THE YEAR ENDED TABLE OF CONTENTS INDEPENDENT AUDITOR S REPORT... 1 MANAGEMENT S DISCUSSION AND ANALYSIS... 3 FINANCIAL STATEMENTS COLLEGE EXHIBITS A-1 STATEMENT OF NET POSITION...
CALIFORNIA STATE UNIVERSITY, CHICO. Financial Statements. June 30, (With Independent Auditors Report Thereon)
") Financial Statements (With Independent Auditors Report Thereon) Table of Contents Page Independent Auditors Report 1 Management s Discussion and Analysis (unaudited) 3 Financial Statements: Statement of
Financial Statements (With Independent Auditors Report Thereon) Table of Contents Page Independent Auditors Report 1 Management s Discussion and Analysis (unaudited) 3 Financial Statements: Statement of
ANNUAL FINANCIAL REPORT 2017
 ANNUAL FINANCIAL REPORT 2017 - SNOW COLLEGE ANNUAL FINANCIAL REPORT i SNOW COLLEGE A Component Unit of the State of Utah Annual Financial Report For the Year Ended June 30, 2017 CONTENTS iv SNOW COLLEGE
UNIVERSITY OF OKLAHOMA HEALTH SCIENCES CENTER. June 30, 2012
 UNIVERSITY OF OKLAHOMA HEALTH SCIENCES CENTER June 30, 2012 UNIVERSITY OF OKLAHOMA HEALTH SCIENCES CENTER June 30, 2012 and 2011 AUDITED FINANCIAL STATEMENTS Independent Auditors Report... 1 Management
KENTUCKY STATE UNIVERSITY (A Component Unit of the Commonwealth of Kentucky) FINANCIAL STATEMENTS June 30, 2018
 FINANCIAL STATEMENTS June 30, 2018") (A Component Unit of the Commonwealth of Kentucky) FINANCIAL STATEMENTS FINANCIAL STATEMENTS CONTENTS INDEPENDENT AUDITOR S REPORT... 1 MANAGEMENT'S DISCUSSION AND ANALYSIS... 3 FINANCIAL STATEMENTS KENTUCKY
(A Component Unit of the Commonwealth of Kentucky) FINANCIAL STATEMENTS FINANCIAL STATEMENTS CONTENTS INDEPENDENT AUDITOR S REPORT... 1 MANAGEMENT'S DISCUSSION AND ANALYSIS... 3 FINANCIAL STATEMENTS KENTUCKY
WEST VIRGINIA UNIVERSITY INSTITUTE OF TECHNOLOGY
 WEST VIRGINIA UNIVERSITY INSTITUTE OF TECHNOLOGY Financial Statements and Additional Information for the Year Ended June 30, 2002 and Independent Auditors Reports WEST VIRGINIA UNIVERSITY INSTITUTE OF
TRUMAN STATE UNIVERSITY A COMPONENT UNIT OF THE STATE OF MISSOURI FINANCIAL STATEMENTS JUNE 30, 2017
 A COMPONENT UNIT OF THE STATE OF MISSOURI FINANCIAL STATEMENTS JUNE 30, 2017 Contents Page Independent Auditors Report... 1-2 Management s Discussion And Analysis... 3-12 Financial Statements Statement
UNIVERSITY OF SOUTH ALABAMA (A Component Unit of the State of Alabama)
") Basic Financial Statements and Supplementary Information on Federal Awards Programs September 30, 2009 Basic Financial Statements Table of Contents Management s Discussion and Analysis (Unaudited) 1 Independent
Basic Financial Statements and Supplementary Information on Federal Awards Programs September 30, 2009 Basic Financial Statements Table of Contents Management s Discussion and Analysis (Unaudited) 1 Independent
Idaho State University
 Idaho State University Financial Statements for the Years Ended June 30, 2003 and 2002 and Independent Auditors Reports Including Single Audit Reports for the Year Ended June 30, 2003 IDAHO STATE UNIVERSITY
FOOTHILL-DE ANZA COMMUNITY COLLEGE DISTRICT COUNTY OF SANTA CLARA LOS ALTOS HILLS, CALIFORNIA FINANCIAL STATEMENTS WITH SUPPLEMENTAL INFORMATION
 COUNTY OF SANTA CLARA LOS ALTOS HILLS, CALIFORNIA FINANCIAL STATEMENTS WITH SUPPLEMENTAL INFORMATION FOR THE YEAR ENDED JUNE 30, 2010 AND INDEPENDENT AUDITOR'S REPORT FINANCIAL STATEMENTS WITH SUPPLEMENTAL
UNIVERSITY OF SOUTH ALABAMA (A Component Unit of the State of Alabama)
") Basic Financial Statements and Single Audit Reporting in Accordance with the Uniform Guidance Table of Contents Management s Discussion and Analysis (Unaudited) 1 Independent Auditors Report 15 Basic Financial
Basic Financial Statements and Single Audit Reporting in Accordance with the Uniform Guidance Table of Contents Management s Discussion and Analysis (Unaudited) 1 Independent Auditors Report 15 Basic Financial
STATE OF NORTH CAROLINA
 STATE OF NORTH CAROLINA WINSTON-SALEM STATE UNIVERSITY WINSTON-SALEM, NORTH CAROLINA FINANCIAL STATEMENT AUDIT REPORT FOR THE YEAR ENDED JUNE 30, 2010 OFFICE OF THE STATE AUDITOR BETH A. WOOD, CPA STATE
ST. CHARLES COMMUNITY COLLEGE FINANCIAL STATEMENTS FOR THE YEARS ENDED JUNE 30, 2018 AND 2017
 ST. CHARLES COMMUNITY COLLEGE FINANCIAL STATEMENTS FOR THE YEARS ENDED JUNE 30, 2018 AND 2017 ST. CHARLES COMMUNITY COLLEGE CONTENTS PAGE INDEPENDENT AUDITORS REPORT 1 MANAGEMENT S DISCUSSION AND ANALYSIS
STATE OF NORTH CAROLINA
 STATE OF NORTH CAROLINA WINSTON-SALEM STATE UNIVERSITY WINSTON-SALEM, NORTH CAROLINA FINANCIAL STATEMENT AUDIT REPORT FOR THE YEAR ENDED JUNE 30, 2012 OFFICE OF THE STATE AUDITOR BETH A. WOOD, CPA STATE
Audited Financial Report and Reports Required by Uniform Guidance As of and for the Years Ended June 30, 2017 and 2016 The University of Oklahoma
 Audited Financial Report and Reports Required by Uniform Guidance As of and for the Years Ended June 30, 2017 and 2016 The University of Oklahoma Health Sciences Center Table of Contents June 30, 2017
Financial Statements June 30, 2017 Rogers State University
 Financial Statements Rogers State University www.eidebailly.com Table of Contents Independent Auditor s Report... 1 Management s Discussion and Analysis... 4 Financial Statements Statement of Net Position...
CALIFORNIA STATE UNIVERSITY, NORTHRIDGE. Financial Statements. June 30, (With Independent Auditors Report Thereon)
") Financial Statements (With Independent Auditors Report Thereon) Table of Contents Page Independent Auditors Report 1 Management s Discussion and Analysis 3 Basic Financial Statements: Statement of Net
Financial Statements (With Independent Auditors Report Thereon) Table of Contents Page Independent Auditors Report 1 Management s Discussion and Analysis 3 Basic Financial Statements: Statement of Net
Utah Valley University
 A Component Unit of the State of Utah 2008 Annual Financial Report Table of Contents President s Message 1 Independent State Auditor s Report 2 3 Management s Discussion and Analysis 5 14 Financial Statements
Report of Independent Auditors in accordance with the Uniform Guidance and Financial Statements for
 Report of Independent Auditors in accordance with the Uniform Guidance and Financial Statements for June 30, 2016 and 2015 LEWIS-CLARK STATE COLLEGE TABLE OF CONTENTS Page REPORT OF INDEPENDENT AUDITORS
Auburn University Report on Federal Awards in Accordance with OMB Circular A-133 For the Year Ended September 30, 2008 EIN:
 Report on Federal Awards in Accordance with OMB Circular A-133 For the Year Ended September 30, 2008 EIN: 63-6000724 Report on Federal Awards in Accordance with OMB Circular A-133 Index September 30, 2008
HUMBOLDT STATE UNIVERSITY. Financial Statements. June 30, 2011
 Financial Statements Table of Contents Page Management s Discussion and Analysis 2 Financial Statements: Statement of Net Assets 11 Statement of Revenues, Expenses, and Changes in Net Assets 12 Statement
Report of Independent Auditors and Financial Statements for
 Report of Independent Auditors and Financial Statements for June 30, 2011 and 2010 LEWIS-CLARK STATE COLLEGE TABLE OF CONTENTS Page INDEPENDENT AUDITOR S REPORT 1 MANAGEMENT S DISCUSSION AND ANALYSIS 2-9
Blue Ridge Community and Technical College (Formerly The Community and Technical College of Shepherd)
") Blue Ridge Community and Technical College (Formerly The Community and Technical College of Shepherd) Financial Statements as of and for the Years Ended June 30, 2007 and 2006, and Independent Auditors
Blue Ridge Community and Technical College (Formerly The Community and Technical College of Shepherd) Financial Statements as of and for the Years Ended June 30, 2007 and 2006, and Independent Auditors
Washburn University of Topeka
 Accountants Report and Financial Statements (Including Reports Required Under OMB-133) June 30, 2008 and 2007 June 30, 2008 and 2007 Contents Independent Accountants Report on Financial Statements and
FINANCIAL OVERVIEW (UNAUDITED)
") FINANCIAL OVERVIEW (UNAUDITED) FINANCIAL HIGHLIGHTS Summarized Selected Data for the Past Six Years 32 Statement of Net Assets 33 Statement of Revenues Expenses, and Changes in Net Assets 34 Statement
FINANCIAL OVERVIEW (UNAUDITED) FINANCIAL HIGHLIGHTS Summarized Selected Data for the Past Six Years 32 Statement of Net Assets 33 Statement of Revenues Expenses, and Changes in Net Assets 34 Statement
THE COLLEGE OF NEW JERSEY FOUNDATION, INC. (A Component Unit of The College of New Jersey)
") THE COLLEGE OF NEW JERSEY FOUNDATION, INC. (A Component Unit of The College of New Jersey) Basic Financial Statements and Management s Discussion and Analysis June 30, 2017 and 2016 (With Independent Auditors
THE COLLEGE OF NEW JERSEY FOUNDATION, INC. (A Component Unit of The College of New Jersey) Basic Financial Statements and Management s Discussion and Analysis June 30, 2017 and 2016 (With Independent Auditors
Southern West Virginia Community and Technical College
 Southern West Virginia Community and Technical College Financial Statements for the Years Ended June 30, 2003 and 2002 and Independent Auditors Reports SOUTHERN WEST VIRGINIA COMMUNITY AND TECHNICAL COLLEGE
Oakland University. Annual Financial Report. Years ended June 30, 2003 and 2002 with Report of Independent Auditors
 Annual Financial Report Years ended June 30, 2003 and 2002 with Report of Independent Auditors Annual Financial Statements Years ended June 30, 2003 and 2002 Contents Management s Discussion and Analysis...
STATE OF ILLINOIS ILLINOIS STATE UNIVERSITY. FINANCIAL AUDIT (In Accordance with the Single Audit Act and OMB Circular A-133)
") STATE OF ILLINOIS ILLINOIS STATE UNIVERSITY FINANCIAL AUDIT (In Accordance with the Single Audit Act and OMB Circular A-133) For The Years Ended June 30, 2009 and 2008 Performed as Special Assistant Auditors
STATE OF ILLINOIS ILLINOIS STATE UNIVERSITY FINANCIAL AUDIT (In Accordance with the Single Audit Act and OMB Circular A-133) For The Years Ended June 30, 2009 and 2008 Performed as Special Assistant Auditors
Washburn University of Topeka
 Accountants Report and Financial Statements (Including Reports Required Under OMB-133) June 30, 2005 and 2004 June 30, 2005 and 2004 Contents Independent Accountants Report on Financial Statements and
ILLINOIS STATE UNIVERSITY 1
 REPORT OF THE COMPTROLLER (In Accordance with the Single Audit Act And OMB Circular A-133) For Years Ended June 30, 2008 and 2007 TABLE OF CONTENTS Page Board of Trustees and Administration 2 Letter of
CALIFORNIA POLYTECHNIC STATE UNIVERSITY, SAN LUIS OBISPO. Financial Statements. June 30, (With Independent Auditors Report Thereon)
") Financial Statements (With Independent Auditors Report Thereon) Table of Contents Page Independent Auditors Report 1 Management s Discussion and Analysis 3 Financial Statements: Statement of Net Assets
Financial Statements (With Independent Auditors Report Thereon) Table of Contents Page Independent Auditors Report 1 Management s Discussion and Analysis 3 Financial Statements: Statement of Net Assets
Ohio University (a component unit of the State of Ohio) Financial Statements June 30, 2017 and 2016
 Financial Statements June 30, 2017 and 2016") (a component unit of the State of Ohio) Financial Statements Contents Independent Auditor s Report 1-3 Financial Statements Management s Discussion and Analysis 4-12 Statements of Net Position 13-14 Statements
(a component unit of the State of Ohio) Financial Statements Contents Independent Auditor s Report 1-3 Financial Statements Management s Discussion and Analysis 4-12 Statements of Net Position 13-14 Statements
THE COLLEGE OF NEW JERSEY FOUNDATION, INC. (A Component Unit of The College of New Jersey)
") THE COLLEGE OF NEW JERSEY FOUNDATION, INC. (A Component Unit of The College of New Jersey) Basic Financial Statements and Management s Discussion and Analysis June 30, 2015 and 2014 (With Independent Auditors
THE COLLEGE OF NEW JERSEY FOUNDATION, INC. (A Component Unit of The College of New Jersey) Basic Financial Statements and Management s Discussion and Analysis June 30, 2015 and 2014 (With Independent Auditors
UNIVERSITY OF ALASKA
 UNIVERSITY OF ALASKA (A Component Unit of the State of Alaska) Financial Statements (With Independent Auditors Report Thereon) University of Alaska (A Component Unit of the State of Alaska) Financial Statements
SAN FRANCISCO STATE UNIVERSITY. Financial Statements. June 30, (With Independent Auditors Report Thereon)
") Financial Statements (With Independent Auditors Report Thereon) Table of Contents Page(s) Independent Auditors Report 1 2 Management s Discussion and Analysis (Unaudited) 3 14 Financial Statements: Statement
Financial Statements (With Independent Auditors Report Thereon) Table of Contents Page(s) Independent Auditors Report 1 2 Management s Discussion and Analysis (Unaudited) 3 14 Financial Statements: Statement
SOUTHWESTERN OKLAHOMA STATE UNIVERSITY
 SOUTHWESTERN OKLAHOMA STATE UNIVERSITY A DEPARTMENT OF THE REGIONAL UNIVERSITY SYSTEM OF OKLAHOMA ANNUAL FINANCIAL STATEMENTS AND INDEPENDENT AUDITOR S REPORT AS OF AND FOR THE YEAR ENDED JUNE 30, 2016
THE COLLEGE OF NEW JERSEY FOUNDATION, INC. (A Component Unit of The College of New Jersey)
") THE COLLEGE OF NEW JERSEY FOUNDATION, INC. (A Component Unit of The College of New Jersey) Basic Financial Statements and Management s Discussion and Analysis June 30, 2018 (With Independent Auditors Report
THE COLLEGE OF NEW JERSEY FOUNDATION, INC. (A Component Unit of The College of New Jersey) Basic Financial Statements and Management s Discussion and Analysis June 30, 2018 (With Independent Auditors Report
YEAR ENDED SEPTEMBER 30, 2004
 YEAR ENDED SEPTEMBER 30, 2004 FINANCIAL REPORT Irvin D. Reid President Executive Officers Harvey Hollins III Vice President for Government Affairs Nancy S. Barrett Provost and Senior Vice President for
OKLAHOMA STATE UNIVERSITY. June 30, 2011
 OKLAHOMA STATE UNIVERSITY June 30, 2011 OKLAHOMA STATE UNIVERSITY June 30, 2011 AUDITED FINANCIAL STATEMENTS Independent Auditors Report... 1 Management s Discussion and Analysis... 3 Statements of Net
Washburn University of Topeka
 Accountants Report and Financial Statements (Including Reports Required Under OMB-133) June 30, 2006 and 2005 June 30, 2006 and 2005 Contents Independent Accountants Report on Financial Statements and
Report of Independent Auditors and Financial Statements for
 Report of Independent Auditors and Financial Statements for June 30, 2013 and 2012 LEWIS-CLARK STATE COLLEGE TABLE OF CONTENTS Page REPORT OF INDEPENDENT AUDITORS 1-2 MANAGEMENT S DISCUSSION AND ANALYSIS
Financial statements and report of independent certified public accountants Oklahoma State University June 30, 2006 and 2005
 Financial statements and report of independent certified public accountants Oklahoma State University June 30, 2006 and 2005 C O N T E N T S Page MANAGEMENT S DISCUSSION AND ANALYSIS i REPORT OF INDEPENDENT
THE UNIVERSITY FOUNDATION AT SACRAMENTO STATE
 THE UNIVERSITY FOUNDATION AT SACRAMENTO STATE Independent Auditor s Report, Management s Discussion and Analysis, Basic Financial Statements and Supplementary Schedules Table of Contents Page(s) Independent
The Community and Technical College of Shepherd. Financial Statements as of and for the Year Ended June 30, 2006, and Independent Auditors Reports
 The Community and Technical College of Shepherd Financial Statements as of and for the Year Ended June 30, 2006, and Independent Auditors Reports THE COMMUNITY AND TECHNICAL COLLEGE OF SHEPHERD TABLE OF
UNIVERSITY OF CALIFORNIA, BERKELEY. Annual Financial Report
 UNIVERSITY OF CALIFORNIA, BERKELEY Annual Financial Report 2008-09 TABLE OF CONTENTS Management's Discussion and Analysis 1 Financial Statements: Statements of Net Assets at June 30, 2009 and 2008 11 Statements
UNIVERSITY OF SOUTH ALABAMA (A Component Unit of the State of Alabama)
") Basic Financial Statements and Supplementary Information on Federal Awards Programs Table of Contents Management s Discussion and Analysis (Unaudited) 1 Independent Auditors Report 13 Basic Financial Statements:
Basic Financial Statements and Supplementary Information on Federal Awards Programs Table of Contents Management s Discussion and Analysis (Unaudited) 1 Independent Auditors Report 13 Basic Financial Statements:
UNIVERSITY OF ALASKA
 UNIVERSITY OF ALASKA (A Component Unit of the State of Alaska) Financial Statements (With Independent Auditors Report Thereon) University of Alaska (A Component Unit of the State of Alaska) Financial Statements
SAN JOSE STATE UNIVERSITY. Financial Statements. June 30, (With Independent Auditors Report Thereon)
") Financial Statements (With Independent Auditors Report Thereon) Table of Contents Page Independent Auditors Report 1 Management s Discussion and Analysis 3 Financial Statements: Statement of Net Assets
Financial Statements (With Independent Auditors Report Thereon) Table of Contents Page Independent Auditors Report 1 Management s Discussion and Analysis 3 Financial Statements: Statement of Net Assets
West Virginia Higher Education Policy Commission
 West Virginia Higher Education Policy Commission Financial Statements and Additional Information for the Year Ended June 30, 2002, and Independent Auditors Reports WEST VIRGINIA HIGHER EDUCATION POLICY
LETTER FROM THE EXECUTIVE VICE CHANCELLOR, CHIEF FINANCIAL OFFICER
 LETTER FROM THE EXECUTIVE VICE CHANCELLOR, CHIEF FINANCIAL OFFICER The California State University is a remarkable institution that is comprised of 23 campuses offering an outstanding education to 438,157
WINSTON-SALEM STATE UNIVERSITY
 STATE OF NORTH f CAROLINA OFFICE OF THE STATE AUDITOR BETH A. WOOD, CPA WINSTON-SALEM STATE UNIVERSITY WINSTON-SALEM, NORTH CAROLINA FINANCIAL STATEMENT AUDIT REPORT FOR THE YEAR ENDED JUNE 30, 2017 A
SOUTHWESTERN OKLAHOMA STATE UNIVERSITY ANNUAL FINANCIAL STATEMENTS AND INDEPENDENT AUDITOR S REPORTS AS OF AND FOR THE YEAR ENDED JUNE 30, 2014
 SOUTHWESTERN OKLAHOMA STATE UNIVERSITY ANNUAL FINANCIAL STATEMENTS AND INDEPENDENT AUDITOR S REPORTS AS OF AND FOR THE YEAR ENDED JUNE 30, 2014 AUDITED FINANCIAL STATEMENTS Independent Auditors Report...
TECHNICAL COLLEGE OF THE LOWCOUNTRY
 Financial Statements For the Year Ended June 30, 2018 921 RIBAUT ROAD, POST OFFICE BOX 1288 BEAUFORT, SOUTH CAROLINA 29901 Audit Period - July 1, 2017 to June 30, 2018 Commission Members Arthur E. Brown,
Financial Statements June 30, 2016 Rogers State University
 Financial Statements Rogers State University www.eidebailly.com Table of Contents Independent Auditor s Report... 1 Management s Discussion and Analysis... 4 Financial Statements Statement of Net Position...
Audited Financial Statements Stanly Community College Albemarle, North Carolina As of and for the Year Ended June 30, 2014
 Audited Financial Statements Stanly Community College Albemarle, North Carolina As of and for the Year Ended June 30, 2014 TABLE OF CONTENTS Pages Independent Auditors' Report 1-2 Management's Discussion
WASHBURN UNIVERSITY OF TOPEKA FINANCIAL STATEMENTS JUNE 30, 2016
 FINANCIAL STATEMENTS JUNE 30, 2016 Index Page Independent Auditors Report... 1-3 Management s Discussion And Analysis... 4-28 Financial Statements Statements Of Net Position... 29-30 Statements Of Financial
Idaho State University
 Idaho State University FINANCIAL STATEMENTS FOR THE YEARS ENDED JUNE 30, 2006 AND 2005 AND INDEPENDENT AUDITOR S REPORT, INCLUDING SINGLE AUDIT REPORTS FOR THE YEAR ENDED JUNE 30, 2006 IDAHO STATE UNIVERSITY
WASHBURN UNIVERSITY OF TOPEKA FINANCIAL STATEMENTS JUNE 30, 2017
 FINANCIAL STATEMENTS JUNE 30, 2017 Index Page Independent Auditors Report... 1-3 Management s Discussion And Analysis... 4-24 Financial Statements Statements Of Net Position... 25-26 Statements Of Financial
PALM BEACH STATE COLLEGE ANNUAL FINANCIAL REPORT June 30, Table of Contents
 PALM BEACH STATE COLLEGE ANNUAL FINANCIAL REPORT June 30, 2018 Table of Contents MANAGEMENT S DISCUSSION AND ANALYSIS... 1 BASIC FINANCIAL STATEMENTS...12 Notes to Financial Statements...17 OTHER REQUIRED
CAL STATE EAST BAY EDUCATIONAL FOUNDATION, INC. Financial Statements and Supplementary Information Years Ended June 30, 2012 and 2011
 Financial Statements and Supplementary Information Years Ended June 30, 2012 and 2011 Table of Contents Page Independent Auditors Report 1 Management s Discussion and Analysis 3 Financial Statements: Statements
WINSTON-SALEM STATE UNIVERSITY
 STATE OF NORTH f CAROLINA OFFICE OF THE STATE AUDITOR BETH A. WOOD, CPA WINSTON-SALEM STATE UNIVERSITY WINSTON-SALEM, NORTH CAROLINA FINANCIAL STATEMENT AUDIT REPORT FOR THE YEAR ENDED JUNE 30, 2018 A
Kent State University. Financial Report June 30, 2008
 Kent State University Financial Report June 30, 2008 Table of Contents Page(s) Management s Discussion and Analysis (unaudited)... 1-6 Financial Statements Report of Independent Auditors... 7-8 Statement
Fairmont State University
 Fairmont State University Financial Statements as of and for the Years Ended June 30, 2009 and 2008, Additional Information as of and for the Year Ended June 30, 2009, and Independent Auditors Reports
CALIFORNIA STATE UNIVERSITY, EAST BAY. Financial Statements. June 30, (With Independent Auditors Report Thereon)
") Financial Statements (With Independent Auditors Report Thereon) Table of Contents Page Independent Auditors Report 1 Management s Discussion and Analysis 3 Financial Statements: Statement of Net Assets
Financial Statements (With Independent Auditors Report Thereon) Table of Contents Page Independent Auditors Report 1 Management s Discussion and Analysis 3 Financial Statements: Statement of Net Assets
CALIFORNIA STATE UNIVERSITY, FULLERTON. Financial Statements. June 30, (With Independent Auditors Report Thereon)
") Financial Statements (With Independent Auditors Report Thereon) Table of Contents Page Independent Auditors Report 1 Management s Discussion and Analysis (Unaudited) 3 Financial Statements: Statement of
Financial Statements (With Independent Auditors Report Thereon) Table of Contents Page Independent Auditors Report 1 Management s Discussion and Analysis (Unaudited) 3 Financial Statements: Statement of
MOREHEAD STATE UNIVERSITY. Single Audit Reports Under Uniform Guidance
 Single Audit Reports Under Uniform Guidance As of and for the Years Ended June 30, 2017 and 2016 with Report of Independent Auditors M CONTENTS Management s Discussion and Analysis... 1 Report of Independent
SONOMA STATE UNIVERSITY. Financial Statements. June 30, (With Independent Auditors Report Thereon)
") Financial Statements (With Independent Auditors Report Thereon) Table of Contents Page Independent Auditors Report 1 Management s Discussion and Analysis 3 Financial Statements: Statement of Net Assets
Financial Statements (With Independent Auditors Report Thereon) Table of Contents Page Independent Auditors Report 1 Management s Discussion and Analysis 3 Financial Statements: Statement of Net Assets
CALIFORNIA POLYTECHNIC STATE UNIVERSITY, SAN LUIS OBISPO. Financial Statements. June 30, (Unaudited)
") Financial Statements (Unaudited) Financial Statements Basis of Accounting and the Independent Audit Under state law for fiscal year 2011/12, the University is not required to issue financial statements
Financial Statements (Unaudited) Financial Statements Basis of Accounting and the Independent Audit Under state law for fiscal year 2011/12, the University is not required to issue financial statements
SANDHILLS COMMUNITY COLLEGE
 STATE OF NORTH CAROLINA OFFICE OF THE STATE AUDITOR BETH A. WOOD, CPA SANDHILLS COMMUNITY COLLEGE PINEHURST, NORTH CAROLINA FINANCIAL STATEMENT AUDIT REPORT FOR THE YEAR ENDED JUNE 30, 2018 A COMPONENT
Report. of the Comptroller. illinois state university
 Report 2003 of the Comptroller for the year ended June 30, 2003 illinois state university ILLINOIS STATE UNIVERSITY REPORT OF THE COMPTROLLER For Year Ended June 30, 2003 TABLE OF CONTENTS PAGE Board of
UNIVERSITY OF ALASKA
 UNIVERSITY OF ALASKA (A Component Unit of the State of Alaska) Financial Statements (With Independent Auditors Report Thereon) University of Alaska (A Component Unit of the State of Alaska) Financial Statements
Basic Financial Statements, Management s Discussion and Analysis and Supplementary Information. June 30, 2012 and 2011
 Basic Financial Statements, Management s Discussion and Analysis and Supplementary Information (With Independent Auditors Report Thereon) Table of Contents Independent Auditors Report 1 Management s Discussion
FINANCIAL STATEMENT AUDIT REPORT
 GRAHAM, NORTH CAROLINA FINANCIAL STATEMENT AUDIT REPORT For the Year Ended June 30, 2012 S. Preston Douglas & Associates, LLP Certified Public Accountants ALAMANCE COMMUNITY COLLEGE GRAHAM, NORTH CAROLINA
Missouri Southern State University (A Component Unit of the State of Missouri) Independent Auditor s Reports and Financial Statements
 Independent Auditor s Reports and Financial Statements") (A Component Unit of the State of Missouri) Independent Auditor s Reports and Financial Statements Contents Independent Auditor s Report... 1 Management s Discussion and Analysis... 3 Financial Statements
(A Component Unit of the State of Missouri) Independent Auditor s Reports and Financial Statements Contents Independent Auditor s Report... 1 Management s Discussion and Analysis... 3 Financial Statements
MOUNTWEST COMMUNITY AND TECHNICAL COLLEGE. Financial Statements as of and for the Years Ended June 30, 2013 and 2012, and Independent Auditors Report
 MOUNTWEST COMMUNITY AND TECHNICAL COLLEGE Financial Statements as of and for the Years Ended June 30, 2013 and 2012, and Independent Auditors Report MOUNTWEST COMMUNITY AND TECHNICAL COLLEGE TABLE OF CONTENTS
Connecticut State University System (The System Office, Central Connecticut State University, Eastern Connecticut State University, Southern
 Connecticut State University System (The System Office, Central Connecticut State University, Eastern Connecticut State University, Southern Connecticut State University, Western Connecticut State University,
SAN JOAQUIN DELTA COMMUNITY COLLEGE DISTRICT COUNTY OF SAN JOAQUIN STOCKTON, CALIFORNIA FINANCIAL STATEMENTS WITH SUPPLEMENTAL INFORMATION
 COUNTY OF SAN JOAQUIN STOCKTON, CALIFORNIA FINANCIAL STATEMENTS WITH SUPPLEMENTAL INFORMATION FOR THE YEAR ENDED JUNE 30, 2010 AND INDEPENDENT AUDITOR'S REPORT FINANCIAL STATEMENTS WITH SUPPLEMENTAL INFORMATION
Central Michigan University. Financial Report. As of and for the Years Ended June 30, 2004 and 2003
 Central Michigan University Financial Report As of and for the Years Ended June 30, 2004 and 2003 Central Michigan University Board of Trustees James C. Fabiano Sr., Mount Pleasant Chair John G. Kulhavi,
CALIFORNIA STATE UNIVERSITY, FRESNO. Financial Statements. June 30, (With Independent Auditors Report Thereon)
") Financial Statements (With Independent Auditors Report Thereon) Table of Contents Page Independent Auditors Report 1 Management s Discussion and Analysis 3 Financial Statements: Statement of Net Assets
Financial Statements (With Independent Auditors Report Thereon) Table of Contents Page Independent Auditors Report 1 Management s Discussion and Analysis 3 Financial Statements: Statement of Net Assets
AS OF AND FOR THE YEAR ENDED JUNE 30, 2016
 TM FINANCIAL STATEMENTS AND SCHEDULE OF EXPENDITURES OF FEDERAL AWARDS WITH REPORTS OF INDEPENDENT AUDITORS AS OF AND FOR THE YEAR ENDED TABLE OF CONTENTS YEAR ENDED INDEPENDENT AUDITORS REPORT 3 MANAGEMENT
AUDITED FINANCIAL STATEMENTS. University of Puerto Rico Years Ended June 30, 2009 and 2008 With Report of Independent Auditors
 AUDITED FINANCIAL STATEMENTS University of Puerto Rico Years Ended June 30, 2009 and 2008 With Report of Independent Auditors Audited Financial Statements Years Ended June 30, 2009 and 2008 Contents Report
MORGAN STATE UNIVERSITY. Financial Statements Together with Report of Independent Public Accounts
 Financial Statements Together with Report of Independent Public Accounts For the Years Ended JUNE 30, 2013 AND 2012 CONTENTS REPORT OF INDEPENDENT PUBLIC ACCOUNTANTS 1 MANAGEMENT S DISCUSSION AND ANALYSIS
BLUEFIELD STATE COLLEGE FINANCIAL STATEMENTS YEARS ENDED JUNE 30, 2018 AND 2017
 FINANCIAL STATEMENTS YEARS ENDED JUNE 30, 2018 AND 2017 TABLE OF CONTENTS YEARS ENDED JUNE 30, 2018 INDEPENDENT AUDITORS REPORT 1 MANAGEMENT S DISCUSSION AND ANALYSIS (RSI) (UNAUDITED) 3 FINANCIAL STATEMENTS
NORTHWESTERN OKLAHOMA STATE UNIVERSITY
 NORTHWESTERN OKLAHOMA STATE UNIVERSITY A DEPARTMENT OF THE REGIONAL UNIVERSITY SYSTEM OF OKLAHOMA ANNUAL FINANCIAL STATEMENTS AND INDEPENDENT AUDITOR S REPORT AS OF AND FOR THE YEAR ENDED JUNE 30, 2015
ST. MARY S COLLEGE OF MARYLAND Management s Discussion and Analysis June 30, 2010
 Management s Discussion and Analysis June 30, 2010 Overview of the Financial Statements and Financial Analysis St. Mary s College of Maryland (College) is pleased to present its financial statements for
UNIVERSITY OF LOUISVILLE AND AFFILIATED CORPORATIONS. A Component Unit of the Commonwealth of Kentucky
 UNIVERSITY OF LOUISVILLE AND AFFILIATED CORPORATIONS A Component Unit of the Commonwealth of Kentucky Auditor s Report and Financial Statements June 30, 2013 and 2012 UNIVERSITY OF LOUISVILLE AND AFFILIATED
2015 ANNUAL FINANCIAL REPORT
 2015 ANNUAL FINANCIAL REPORT ANNUAL FINANCIAL REPORT 2015 CONTENTS 6-7 Message from the President 8-9 Independent State Auditor s Report 10-21 Management s Discussion and Analysis 22-41 Basic Financial
BRISTOL COMMUNITY COLLEGE (an Agency of the Commonwealth of Massachusetts) FINANCIAL STATEMENTS AND MANAGEMENT S DISCUSSION AND ANALYSIS
 FINANCIAL STATEMENTS AND MANAGEMENT S DISCUSSION AND ANALYSIS") (an Agency of the Commonwealth of Massachusetts) FINANCIAL STATEMENTS AND MANAGEMENT S DISCUSSION AND ANALYSIS JUNE 30, 2017 Financial Statements and Management s Discussion and Analysis C O N T E N T
(an Agency of the Commonwealth of Massachusetts) FINANCIAL STATEMENTS AND MANAGEMENT S DISCUSSION AND ANALYSIS JUNE 30, 2017 Financial Statements and Management s Discussion and Analysis C O N T E N T
WASHBURN UNIVERSITY OF TOPEKA FINANCIAL STATEMENTS JUNE 30, 2013
 FINANCIAL STATEMENTS JUNE 30, 2013 Index Page Independent Auditors Report... 1-4 Management s Discussion And Analysis... 5-27 Financial Statements Statements Of Net Position... 28-29 Statements Of Financial
Finance and Facilities Committee Meeting - Agenda
 Finance and Facilities Committee Meeting - Agenda Board of Trustees Finance and Facilities Committee Meeting December 13, 2017 8:30 a.m. President s Boardroom, Millican Hall, 3 rd floor Conference call