The Nasdaq gained 1.84 percent last week,
|
|
|
- Lorena Scott
- 5 years ago
- Views:
Transcription
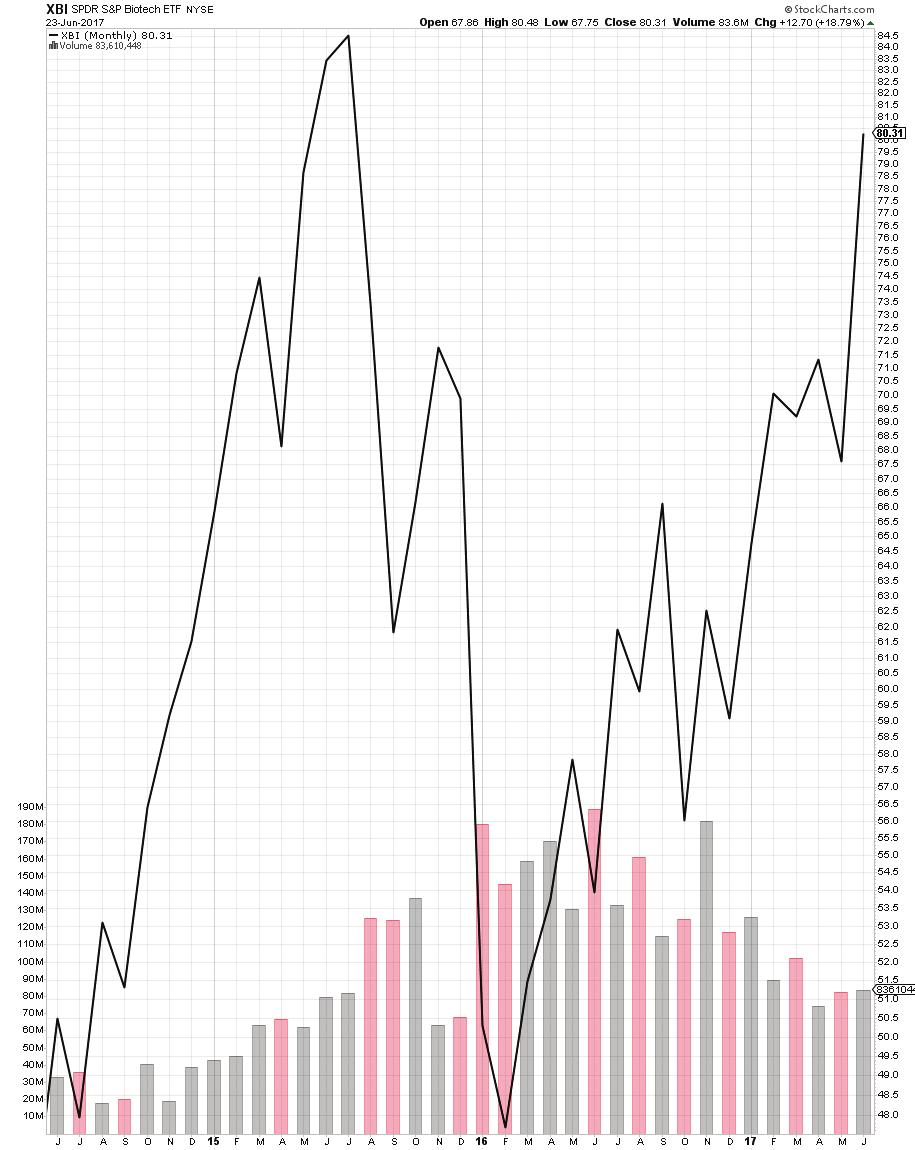
1 GLOBAL MOMENTUMGUIDE JUNE 26, 2017 MUTUALFUNDINVESTORGUIDE.COM Matthew D. Sauer Founder & Chief Investment Officer Matthew Sauer is the Founder and Chief Investment Officer of the Mutual Fund Investor Guide family of newsletters. Each month he analyzes and provides buy, sell and hold recommendations for hundreds of mutual funds and ETFs in three newsletters: The Investor Guide to Fidelity Funds, The ETF Investor Guide and The Investor Guide to Vanguard Funds. Prior to starting the Mutual Fund Investor Guide, Matthew was President and Chief Investment Officer of the Fidelity Independent Adviser, ETF Report & Sector Momentum Tracker newsletters. WEEKLY SECTOR MOVERS The Nasdaq gained 1.84 percent last week, the Russell percent, the S&P 500 Index 0.21 percent, and the Dow Jones Industrial Average 0.05 percent. The MSCI EAFE Index fell 0.20 percent. In 2017, the Nasdaq has risen percent. The MSCI EAFE has advanced percent, the S&P 500 Index 8.91 percent, the Dow Jones Industrial Average 8.26 percent, and the Russell percent. The Fidelity Select Sector Portfolio rallied 1.12 percent last week. The ETF Sector Portfolio returned 1.08 percent, and the ETF Blended Portfolio 0.60 percent. The ETF International Portfolio fell 0.73 percent. The ETF International Portfolio has increased percent year-to-date. The Fidelity Select Sector Portfolio has gained 6.32 percent, the ETF Sector Portfolio 1.08 percent, and the ETF Blended Portfolio 3.25 percent. Sell No Trades Aerospace & Defense (ITA) Trades Fidelity Select Sector Portfolio ETF Sector Portfolio Fidelity Select Biotechnology (FBIOX) gained the greatest relative momentum last week with a six-spot advance. HealthCare (FSPHX) and Transportation (FSRFX) both rose four places. Multimedia (FBMPX) fell five spots and Automotive (FSAVX) lost four. SPDR Healthcare (XLV) and ishares US Healthcare (IYH) both advanced ten places. Guggenheim Solar (TAN) gained six and ishares Nasdaq Biotech (IBB) five. ishares US Consumer Services (IYC) and SPDR Consumer Discretionary (XLY) both fell five spots. Global X Nigeria (NGE) climbed fifteen places in the rankings last week. ishares MSCI New Zealand (ENZL) moved up eight, and VanEck Indonesia (IDX) six. VanEck Russia Small Cap (RSXJ) and Brazil Small Cap (BRF) both fell twelve spots, while Global X Colombia (GXG) and ishares S&P Latin America 40 (ILF) each slid six. Buy No Trades SPDR S&P Biotech (XBI) SECTOR MOVERS 1 FIDELITY 2-4 ETF SECTOR 4-9 ETF INTL ETF BLENDED 15 ETF International Portfolio No Trades No Trades ETF Blended Portfolio Home Construction (ITB) SPDR S&P Biotech (XBI) DISCLOSURE 17 1
2 FIDELITY SECTOR MOMENTUM RANKINGS Name Symbol 3/31 4/7 4/14 4/21 4/28 5/5 5/12 5/19 5/26 6/2 6/9 6/16 6/23 Technology FSPTX Leisure FDLSX Software FSCSX Semiconductors FSELX Computers FDCPX Medical Equip FSMEX Environmental FSLEX Wireless FWRLX IT Services FBSOX Healthcare Svcs FSHCX Defense & Aero FSDAX Air Transport FSAIX Brokerage FSLBX HealthCare FSPHX Utilities FSUTX Consumer Staples FDFAX Constr & Housing FSHOX Chemicals FSCHX Insurance FSPCX Retailing FSRPX Comm Equip FSDCX Transportation FSRFX S&P 500 Index SPX Consumer Discr FSCPX Multimedia FBMPX Materials FSDPX Biotechnology FBIOX Industrials FCYIX Industrial Equip FSCGX Financial Services FIDSX Consumer Finance FSVLX Pharmaceuticals FPHAX Automotive FSAVX Banking FSRBX Telecommunications FSTCX Government Income FGOVX Gold FSAGX Natural Resources FNARX Energy FSENX Energy Services FSESX Natural Gas FSNGX
3 FIDELITY SECTOR PERFORMANCE RETURNS Name Symbol Price 1 Week 2 Week 3 Week 1 Month 3 Month 6 Month 9 Month YTD 1 Year Air Transport FSAIX Automotive FSAVX Banking FSRBX Biotechnology FBIOX Brokerage FSLBX Chemicals FSCHX Comm Equip FSDCX Computers FDCPX Constr & Housing FSHOX Consumer Discr FSCPX Consumer Finance FSVLX Consumer Staples FDFAX Defense & Aero FSDAX Energy FSENX Energy Services FSESX Environmental Svcs FSLEX Financial Services FIDSX Gold FSAGX Government Income FGOVX HealthCare FSPHX Healthcare Svcs FSHCX Industrial Equip FSCGX Industrials FCYIX Insurance FSPCX IT Services FBSOX Leisure FDLSX Materials FSDPX Medical Equip FSMEX Multimedia FBMPX Natural Gas FSNGX Natural Resources FNARX Pharmaceuticals FPHAX Retailing FSRPX S&P 500 SPX Semiconductors FSELX Software FSCSX Technology FSPTX Telecommunications FSTCX Transportation FSRFX Utilities FSUTX Wireless FWRLX
4 FIDELITY SELECT SECTOR RETURNS PERIOD PORTFOLIO BENCHMARK S&P 500 Nasdaq Dow Russell 2000 YTD Week Week Week Week Year Inception* *Inception on 12/31/2011 FIDELITY PORTFOLIO HOLDINGS RANK FUND SYMBOL SHARES PRICE VALUE Date Purchased PERCENT 1 Technology FSPTX $20, /13/ % 2 Leisure FDLSX $24, /08/ % 3 Software FSCSX $20, /24/ % 4 Semiconductors FSELX $30, /20/ % 5 Computers FDCPX $21, /27/ % 6 Medical Equip FSMEX $23, /15/ % 7 Environmental FSLEX $22, /20/ % 8 Wireless FWRLX $20, /17/ % 9 IT Services FBSOX $21, /05/ % 11 Defense & Aero FSDAX $20, /30/ % $225, % THIS WEEK S FIDELITY TRADE RECOMMENDATIONS At the close of trading on June 26, 2017 we will make the following trades. Proceeds from multiple fund sales should be split evenly between new purchases. We hold each Fidelity fund for 30 days to avoid a short-term trading fee even if it falls out of the top 10. Sell No Trades Buy No Trades Last Week s Sell Transactions Date Fund Symbol Shares Buy Value Sell Proceeds Profit No trades last week 4
5 ETF SECTOR MOMENTUM RANKINGS Name Symbol 3/31 4/7 4/14 4/21 4/28 5/5 5/12 5/19 5/26 6/2 6/9 6/16 6/23 Global X Social Media SOCL ishares Semiconductor SOXX ishares NA Software IGV PShrs NASDAQ Internet PNQI ETFS Palladium PALL Glb X Lithium LIT VanEck Gaming BJK ishares US Technology IYW ishares NA Technology IGM ipath DJ Livestock COW ishares US Med Devices IHI ishares US Home Constr ITB FrTrust DJ Internet FDN PShrs Private Equity PSP SPDR Technology XLK SPDR Biotech XBI FrTrust Biotech FBT ishares US Aero & Defense ITA Guggenheim Timber CUT FrTrust Global Wind FAN PShrs Clean Energy PBW SPDR Industrial XLI SPDR Utilities XLU SPDR Homebuilders XHB SPDR DJIA DIA ishares US Utilities IDU ishares US Industrial IYJ SPDR Cons Disc XLY SPDR S&P Cap Mkt KCE ishares US Healthcare IYH ishares US Cons Service IYC SPDR Healthcare XLV ishares US Broker Dealers IAI SPDR S&P 500 SPY PShrs Water PHO ishares NA Networking IGN SPDR S&P Insurance KIE VanEck Nuclear Energy NLR ishares US Financial Svcs IYG ishares US Cons Goods IYK SPDR Basic Materials XLB ishares US Insurance IAK PShrs Dyn Leisure PEJ SPDR Financial XLF VanEck Ag Business MOO ishares US Finance IYF ishares Russell2000 IWM SPDR Cons Staples XLP ishares US Basic Materials IYM
6 ETF SECTOR MOMENTUM RANKINGS Name Symbol 3/31 4/7 4/14 4/21 4/28 5/5 5/12 5/19 5/26 6/2 6/9 6/16 6/23 FrTrust Global Auto CARZ ishares NASDAQ Biotech IBB SPDR S&P Bank KBE ishares US Reg Banks IAT ishares DJ Transports IYT SPDR S&P Reg Bank KRE PShrs Fin Preferred PGF ishares US Real Estate IYR ishares US Preferred PFF PShrs Dyn Media PBS PShrs DB Base Metals DBB ishares C & S Realty ICF VanEck Coal KOL Guggenheim Solar Energy TAN SPDR Pharmaceuticals XPH ishares 20+ Yr Tres Bond TLT ishares Comex Gold IAU SPDR Gold GLD ishares US Telecom IYZ ishares Agg Bond AGG Guggenheim Shipping SEA Teucrium Corn CORN VanEck Rare Earth REMX SPDR Metals & Mining XME PShrs DB Agriculture DBA VanEck Steel SLX Glb X Copper Miners COPX VanEck Gold Miners GDX ishares Silver Trust SLV ETFS Platinum PPLT SPDR Retail XRT Glb X Silver Miners SIL SPDR Energy XLE ishares NA Natural Res IGE ishares US Energy IYE Teucrium Soybean SOYB ishares GSCI Commodity GSG Glb X Uranium URA ishares US Oil & Gas Exp IEO PShrs DB Oil DBO US Brent Oil BNO VanEck Jr Gold Miners GDXJ US Natural Gas UNG US Oil USO SPDR Oil & Gas Explor XOP FrTrust Natural Gas FCG ishares US Oil Equip IEZ SPDR Oil & Gas Equip XES
7 ETF SECTOR PERFORMANCE RETURNS Name Symbol Price 1 Week 2 Week 3 Week 1 Month 3 Month 6 Month 9 Month YTD 1 Year ETFS Palladium PALL ETFS Platinum PPLT FrTrust Biotech FBT FrTrust DJ Internet FDN FrTrust Global Auto CARZ FrTrust Global Wind FAN FrTrust Natural Gas FCG Glb X Copper Miners COPX Glb X Lithium LIT Glb X Silver Miners SIL Glb X Uranium URA Global X Social Media SOCL Guggenheim Shipping SEA Guggenheim Solar Energy TAN Guggenheim Timber CUT ipath DJ Livestock COW ishares 20+ Yr Tres Bond TLT ishares Agg Bond AGG ishares C & S Realty ICF ishares Comex Gold IAU ishares DJ Transports IYT ishares GSCI Commodity GSG ishares NA Natural Res IGE ishares NA Networking IGN ishares NA Software IGV ishares NA Technology IGM ishares NASDAQ Biotech IBB ishares Russell2000 IWM ishares Semiconductor SOXX ishares Silver Trust SLV ishares US Aero & Defense ITA ishares US Basic Materials IYM ishares US Broker Dealers IAI ishares US Cons Goods IYK ishares US Cons Service IYC ishares US Energy IYE ishares US Finance IYF ishares US Financial Svcs IYG ishares US Healthcare IYH ishares US Home Constr ITB ishares US Industrial IYJ ishares US Insurance IAK ishares US Med Devices IHI ishares US Oil & Gas Exp IEO ishares US Oil Equip IEZ ishares US Preferred PFF ishares US Real Estate IYR ishares US Reg Banks IAT ishares US Technology IYW
8 ETF SECTOR PERFORMANCE RETURNS Name Symbol Price 1 Week 2 Week 3 Week 1 Month 3 Month 6 Month 9 Month YTD 1 Year ishares US Telecom IYZ ishares US Utilities IDU MV Ag Business MOO MV Coal KOL MV Gaming BJK MV Gold Miners GDX MV Jr Gold Miners GDXJ MV Nuclear Energy NLR MV Rare Earth REMX MV Steel SLX PShrs Clean Energy PBW PShrs DB Agriculture DBA PShrs DB Base Metals DBB PShrs DB Oil DBO PShrs Dyn Leisure PEJ PShrs Dyn Media PBS PShrs Fin Preferred PGF PShrs NASDAQ Internet PNQI PShrs Private Equity PSP PShrs Water PHO SPDR Basic Materials XLB SPDR Biotech XBI SPDR Cons Disc XLY SPDR Cons Staples XLP SPDR DJIA DIA SPDR Energy XLE SPDR Financial XLF SPDR Gold GLD SPDR Healthcare XLV SPDR Homebuilders XHB SPDR Industrial XLI SPDR Metals & Mining XME SPDR Oil & Gas Equip XES SPDR Oil & Gas Explor XOP SPDR Pharmaceuticals XPH SPDR Retail XRT SPDR S&P 500 SPY SPDR S&P Bank KBE SPDR S&P Cap Mkt KCE SPDR S&P Insurance KIE SPDR S&P Reg Bank KRE SPDR Technology XLK SPDR Utilities XLU Teucrium Corn CORN Teucrium Soybean SOYB US Brent Oil BNO US Natural Gas UNG US Oil USO
9 ETF SECTOR RETURNS PERIOD PORTFOLIO BENCHMARK S&P 500 Nasdaq Dow Russell 2000 YTD Week Week Week Week Year Inception* *Inception on 12/31/2011 ETF SECTOR PORTFOLIO HOLDINGS RANK FUND SYMBOL SHARES PRICE Value DATE PURCHASED PERCENT 2 ishares Semiconductor SOXX $24, /08/ % 3 ishares NA Software IGV $18, /01/ % 5 ETFS Palladium PALL $19, /27/ % 7 VanEck Gaming BJK $19, /08/ % 7 ishares US Technology IYW $16, /24/ % 9 ishares NA Technology IGM $18, /01/ % 10 ishares US Med Devices IHI $19, /08/ % 12 ishares US Home Constr ITB $19, /17/ % 14 PShrs Private Equity PSP $18, /15/ % 18 ishares US Aero & Defense ITA $21, /22/ % $196, % THIS WEEK S ETF SECTOR TRADE RECOMMENDATIONS Sell Aero & Defense (ITA) At the close of trading on June 26, 2017 we will make the following trades. Proceeds from multiple fund sales should be split evenly between new purchases. We hold the top 10 highest ranked ETFs, but do not hold more than 2 ETFs from the same sector. There is no minimum holding period for ETFs. Buy SPDR S&P Biotech (XBI) Last Week s Sell Transactions Date Fund Symbol Shares Buy Value Sell Proceeds Profit No trades last week 9
10 ETF INTERNATIONAL MOMENTUM RANKINGS Name Symbol 3/31 4/7 4/14 4/21 4/28 5/5 5/12 5/19 5/26 6/2 6/9 6/16 6/23 Glb X Greece 20 GREK ishares Austria EWO VanEck India Sm Cap SCIF ishares Poland EPOL ishares Spain EWP PwrShrs Golden Dragon PGJ Glb X Argentina ARGT ishares Finland EFNL ishares South Korea EWY ishares MSCI Italy EWI ishares France EWQ ishares Netherlands EWN ishares Denmark EDEN ishares EMU Index EZU Gugg China RE TAO ishares Turkey TUR WTree Euro Sm Cap Div DFE ishares DJ Euro 50 FEZ ishares Germany EWG ishares Sweden EWD WTree India EPI ishares India 50 INDY WTree Europe Hedged HEDJ ishares S&P Europe 350 IEV ishares Switzerland EWL ishares Ireland EIRL ishares Asia ex Japan AAXJ Wtree Intl Hedged IHDG ishares Hong Kong EWH ishares Taiwan EWT ishares Belguim EWK ishares Mexico EWW ishares Emerging Markets EEM ishares MSCI EAFE EFA WTree Japan Sm Cap Div DFJ ishares Singapore EWS ishares ACWI ex-us ACWX ishares Japan Sm Cap SCJ ishares MSCI EAFE MinVol EFAV ishares Global 100 IOO WTree Emg Mkt Sm Cap DivDGS VanEck Brazil Small Cap BRF ishares Israel Cap Invest EIS SPDR Emg Mkts Sm Cap EWX ishares ACWI Index ACWI ishares Chile ECH ishares MSCI U Kingdom EWU
11 ETF INTERNATIONAL MOMENTUM RANKINGS Name Symbol 3/31 4/7 4/14 4/21 4/28 5/5 5/12 5/19 5/26 6/2 6/9 6/16 6/23 VanEck Russia Sm Cap RSXJ ishares S&P World Property WPS ishares Maylasia EWM China Large Cap FXI ishares South Africa EZA ishares MSCI Emg MinVol EEMV ishares Japan EWJ VanEck Indonesia IDX WTree Japan Hedged DXJ ishares New Zealand ENZL ishares Pacific ex-japan EPP Glb X Colombia GXG ishares Thailand Invest THD WTree Emg Markts HiYld DEM SPDR MidEast & Africa GAF Gugg China Sm Cap HAO VanEck Africa AFK ishares Philippines EPHE VanEck Vietnam VNM db xtrackers China ASHR Glb X Nigeria NGE WTree Emg Currency CEW ishares Australia EWA Glb X Norway 30 NORW ishares S&P Latin Am 40 ILF Euro Currency Trust FXE ishares All Peru EPU Vanguard Intl Bond BWX Wtree Asia Local Debt ALD WTree Dreyfus Brazil Real BZF CurrShrs SwissFranc FXF WTree China Yuan CYB CurrShrs Brit Pound FXB CurrShrs Swed Krona FXS ishares Canada EWC CurrShrs Aust Dollar FXA CurrShrs Japanese Yen FXY ishares Brazil EWZ CurrShrs Can Dollar FXC PShares USD Bullish UUP VanEck Russia RSX WTree USD Bullish USDU VanEck Egypt EGPT
12 ETF INTERNATIONAL PERFORMANCE RETURNS Name Symbol Price 1 Week 2 Week 3 Week 1 Month 3 Month 6 Month 9 Month YTD 1 Year CurrShrs Aust Dollar FXA CurrShrs Brit Pound FXB CurrShrs Can Dollar FXC CurrShrs Japanese Yen FXY CurrShrs Swed Krona FXS CurrShrs SwissFranc FXF db xtrackers China ASHR Euro Currency Trust FXE Glb X Argentina ARGT Glb X Colombia GXG Glb X Greece 20 GREK Glb X Nigeria NGE Glb X Norway 30 NORW Gugg China RE TAO Gugg China Sm Cap HAO ishares ACWI ex-us ACWX ishares ACWI Index ACWI ishares All Peru EPU ishares Asia ex Japan AAXJ ishares Australia EWA ishares Austria EWO ishares Belguim EWK ishares Brazil EWZ ishares Canada EWC ishares Chile ECH ishares China Large Cap FXI ishares Denmark EDEN ishares DJ Euro 50 FEZ ishares Emerging Markets EEM ishares EMU Index EZU ishares Finland EFNL ishares France EWQ ishares Germany EWG ishares Global 100 IOO ishares Hong Kong EWH ishares India 50 INDY ishares Ireland EIRL ishares Israel Cap Invest EIS ishares Japan EWJ ishares Japan Sm Cap SCJ ishares Maylasia EWM ishares Mexico EWW ishares MSCI EAFE EFA ishares MSCI EAFE MinVol EFAV ishares MSCI Emg MinVol EEMV ishares MSCI Italy EWI ishares MSCI U Kingdom EWU
13 ETF INTERNATIONAL PERFORMANCE RETURNS Name Symbol Price 1 Week 2 Week 3 Week 1 Month 3 Month 6 Month 9 Month YTD 1 Year ishares Netherlands EWN ishares New Zealand ENZL ishares Pacific ex-japan EPP ishares Philippines EPHE ishares Poland EPOL ishares S&P Europe 350 IEV ishares S&P Latin Am 40 ILF ishares S&P World Property WPS ishares Singapore EWS ishares South Africa EZA ishares South Korea EWY ishares Spain EWP ishares Sweden EWD ishares Switzerland EWL ishares Taiwan EWT ishares Thailand Invest THD ishares Turkey TUR MV Africa AFK MV Brazil Small Cap BRF MV Egypt EGPT MV India Sm Cap SCIF MV Indonesia IDX MV Russia RSX MV Russia Sm Cap RSXJ MV Vietnam VNM PShares USD Bullish UUP PwrShrs Golden Dragon PGJ SPDR Emg Mkts Sm Cap EWX SPDR MidEast & Africa GAF Vanguard Intl Bond BWX Wtree Asia Local Debt ALD WTree China Yuan CYB WTree Dreyfus Brazil Real BZF WTree Emg Currency CEW WTree Emg Markts HiYld DEM WTree Emg Mkt Sm Cap Div DGS WTree Euro Sm Cap Div DFE WTree Europe Hedged HEDJ WTree India EPI Wtree Intl Hedged IHDG WTree Japan Hedged DXJ WTree Japan Sm Cap Div DFJ WTree USD Bullish USDU
14 ETF INTERNATIONAL RETURNS PERIOD PORTFOLIO MSCI EAFE S&P 500 Nasdaq Dow YTD Week Week Week Week Year Inception* *Inception on 12/31/2011 INTERNATIONAL PORTFOLIO HOLDINGS RANK FUND SYMBOL SHARES PRICE VALUE Date Purchased PERCENT 1 Glb X Greece 20 GREK $11, /15/ % 2 ishares Austria EWO $17, /24/ % 3 VanEck India Sm Cap SCIF $13, /20/ % 4 ishares Poland EPOL $14, /06/ % 5 ishares Spain EWP $13, /03/ % 6 PwrShrs Golden Dragon PGJ $11, /15/ % 7 Glb X Argentina ARGT $20, /23/ % 8 ishares Finland EFNL $13, /12/ % 9 ishares South Korea EWY $13, /12/ % 10 ishares MSCI Italy EWI $12, /22/ % $141, % THIS WEEK S INTERNATIONAL TRADE RECOMMENDATIONS At the close of trading on June 26, 2017 we will make the following trades. Proceeds from multiple fund sales should be split evenly between new purchases. We hold the top 10 highest ranked ETFs, but do not hold more than 2 ETFs from the same geographic region. There is no minimum holding period for ETFs. Sell No Trades Buy No Trades Last Week s Sell Transactions Date Fund Symbol Shares Buy Value Sell Proceeds Profit No trades last week 14
15 ETF BLENDED PORTFOLIO PERIOD PORTFOLIO S&P 500 Nasdaq RUSSELL 2000 MSCI EAFE YTD Week Week Week Week Year Inception* *Inception on 12/31/2013 BLENDED PORTFOLIO HOLDINGS RANK FUND SYMBOL SHARES PRICE VALUE Date Purchased PERCENT 3 VanEck India Sm Cap SCIF $7, /10/ % 4 ishares Poland EPOL $10, /13/ % 5 ishares Spain EWP $9, /15/ % 6 PwrShrs Golden Dragon PGJ $9, /15/ % 8 ishares Semiconductor SOXX $11, /15/ % 10 ishares Finland EFNL $6, /12/ % 11 ishares South Korea EWY $6, /12/ % 14 ishares NA Software IGV $13, /01/ % 34 ishares Home Construction ITB $7, /24/ % 155 WTree USD Bullish USDU $7, /16/ % $91, % THIS WEEK S INTERNATIONAL TRADE RECOMMENDATIONS At the close of trading on June 26, 2017 we will make the following trades. Proceeds from multiple fund sales should be split evenly between new purchases. We hold the top 10 highest ranked ETFs, but do not hold more than 2 ETFs from the same country or sector. There is no minimum holding period for ETFs. Sell Home Constr (ITB) Buy SPDR S&P Biotech (XBI) Last Week s Sell Transactions Date Fund Symbol Shares Buy Value Sell Proceeds Profit No trades last week 15
16 16
17 WHAT IS THE GLOBAL MOMENTUM GUIDE? The Mutual Fund Investor Guide: Global Momentum Guide delivers a strategy which entails investing in momentum leading exchange-traded funds (ETFs) and mutual funds, with the goal of generating long-term market beating gains. Momentum investing involves finding the stocks or sectors that are outperforming the market and buying them, while avoiding or even shorting stocks or sectors that are under performing. How the Global Momentum Guide Works Each week, the Global Momentum Guide will report updated momentum rankings along with trade advice. Subscribers receive buy, sell and hold advice on several portfolios made up of Fidelity Select mutual funds, sector ETFs and international ETFs. Investors hold the top 10 funds based on our proprietary ranking system, adjusted for correlation. When a fund falls from the top 10, we will issue a sell signal on it, and simultaneously issue a buy order on a rising fund that replaces it. Funds that remain in the top 10 are held. The system used by the Global Momentum Guide is designed to generate long-term out performance. It is also designed to remove human emotion from trading. Sometimes sell orders are issued for sectors that are extremely popular with investors and other times it will issue a hold signal on a sector experiencing a large correction that has many investors panicking. This can result in volatile returns, but our experience with the system has shown that some of the largest gains are made in sectors that experience big corrections during the course of a bull market. One of the biggest benefits of using the Global Momentum Guide is that it takes emotion and guesswork out of investing. Why the Global Momentum Guide Works Different sectors lead the stock market at each stage of a market cycle. For instance, consumer discretionary stocks typically lead in the early stage of a bull market, technology stocks lead in the middle, and consumer staples lead at the end. These stages of the market can last for months or even years. Countries, commodities and currencies all experience the same cyclical movements as investor move in and out of investments in waves. There are many explanations for cyclical behavior in the markets, but we don t worry about the whys because the Global Momentum Guide uses a mechanical system of technical indicators to select investments. These signals tells us which funds are leading and which are lagging, and we position the portfolio in the leading funds. If technology stocks lead in the early part of a bull market, our system will pick that up and issue a buy signal. Momentum investing works because investors have been reliably predictable throughout history there hasn t been a market yet where investors didn t exhibit some cyclical behavior. The Global Momentum Guide is designed to capture the gains from these big winners during each bull market phase of the stock market. What Do I Get When I Subscribe? Every week you will receive an updated ranking of all the funds covered in our newsletter, plus buy, hold and sell advice on each of the portfolios. How Do I Begin Following the Model? To begin following a model, purchase equal dollar amounts of each holding in the model. We will hold the funds for at least a week in the case of ETFs, and for 30 days with Fidelity Select funds due to a short term trading fee on Fidelity Select funds held less than 30 days. ETF INVESTOR GUIDE Each month we provide buy, hold and sell recommendations for hundreds of ETFs from companies including Fidelity, ishares, SPDR and Power- Shares. Additionally, you will also have access to our model portfolios, specifically created for conservative, moderate and aggressive investors. To learn more, call (888) INVESTOR GUIDE TO VANGUARD FUNDS For years, we have covered a limited number of Vanguard mutual funds. In 2014, we launched a newsletter dedicated specifically to Vanguard funds and no-transaction-fee funds accessible to Vanguard investors. We provide numerous model portfolios, plus buy, hold and sell recommendations on over 400 mutual funds. I am confident you will find this advice invaluable as you make your investment decisions. To learn more, call (888) DISCLOSURE: Mutual Fund Investor Guide, LLC (MFIG) is an independent company unaffiliated with any of the fund companies discussed in this newsletter, including Fidelity Investments. These results include the reinvestment of all dividends and capital gains. Model trading does not involve financial risk; model trading cannot completely duplicate the financial risk associated with actual trading. MFIG is not an investment advisor and does not provide specific investment advice. This newsletter has been prepared solely for informational purposes. PAST PERFORMANCE IS NOT A GUARANTEE OF FUTURE RESULTS. All investments involve risk including total loss of principal. 17
The MSCI EAFE rallied 1.99 percent last week,
 GLOBAL MOMENTUMGUIDE MARCH 20, 2017 MUTUALFUNDINVESTORGUIDE.COM Matthew D. Sauer Founder & Chief Investment Officer Matthew Sauer is the Founder and Chief Investment Officer of the Mutual Fund Investor
The MSCI EAFE Index increased 1.23 percent
 GLOBAL MOMENTUMGUIDE Matthew D. Sauer Founder & Chief Investment Officer Matthew Sauer is the Founder and Chief Investment Officer of the Mutual Fund Investor Guide family of newsletters. Each month he
GLOBAL MOMENTUM GUIDE
 FEBRUARY 6, 2017 MUTUALFUNDINVESTORGUIDE.COM Matthew D. Sauer Founder & Chief Investment Officer Matthew Sauer is the Founder and Chief Investment Officer of the Mutual Fund Investor Guide family of newsletters.
GLOBAL MOMENTUM GUIDE
 APRIL 20, 2015 MUTUALFUNDINVESTORGUIDE.COM Matthew D. Sauer Founder & Chief Investment Officer Matthew Sauer is the Founder and Chief Investment Officer of the Mutual Fund Investor Guide family of newsletters.
ETF Analysis. Value Index Growth
 ETF Analysis This analysis page is updated through August 31, 2018. This data is used in David Vomund s managed account program (www.vomundinvestments.com). Style Index ishares Style Index Funds Based
ETF Analysis. Value Index Growth
 ETF Analysis This analysis page is updated through January 5, 2018. This data is used in David Vomund s managed account program (www.vomundinvestments.com). Style Index ishares Style Index Funds Based
FIDELITY SELECT FUNDRANKER
 FIDELITY SELECT FUNDRANKER Volume 1 Issue 9 September 26 August Performance The Top Eight Model Portfolio s best performers were Gold, Food & Agriculture, Pharmaceuticals, and Utilities Growth with 3.8%,
FIDELITY SELECT FUNDRANKER
 FIDELITY SELECT FUNDRANKER Volume 3 Issue 1 The Right Funds at the Right Time January 28 December Performance Energy, Natural Resources, and Energy Service led the way for the Top Eight Model Portfolio
FIDELITY SELECT FUNDRANKER Volume 6 Issue 11 The Right Funds at the Right Time November 2011
 FIDELITY SELECT FUNDRANKER Volume 6 Issue 11 The Right Funds at the Right Time November 211 October Performance Dazzles Stocks turned in their best monthly performance in 2 years in October. All eight
January 24, Michael Rechenthin, PhD Frank Kaberna
 January 24, 2017 This week we provide a list of ETFs that are currently exhibiting some of the most liquid options all with a tastytrade liquidity rating of 3 or 4 stars. To dive deeper into the ETFs and
TACTICAL ASSET CLASS ROTATION MODEL DARIUS DALE: MACRO TEAM
 TACTICAL ASSET CLASS ROTATION MODEL DARIUS DALE: MACRO TEAM JANUARY 15, 2015 LEGAL DISCLAIMER Hedgeye Risk Management is a registered investment advisor, registered with the State of Connecticut. Hedgeye
TACTICAL ASSET CLASS ROTATION MODEL DARIUS DALE: MACRO TEAM
 TACTICAL ASSET CLASS ROTATION MODEL DARIUS DALE: MACRO TEAM JANUARY 7, 2015 LEGAL DISCLAIMER Hedgeye Risk Management is a registered investment advisor, registered with the State of Connecticut. Hedgeye
TACTICAL ASSET CLASS ROTATION MODEL DARIUS DALE: MACRO TEAM
 TACTICAL ASSET CLASS ROTATION MODEL DARIUS DALE: MACRO TEAM JANUARY 8, 2015 LEGAL DISCLAIMER Hedgeye Risk Management is a registered investment advisor, registered with the State of Connecticut. Hedgeye
TACTICAL ASSET CLASS ROTATION MODEL DARIUS DALE: MACRO TEAM
 TACTICAL ASSET CLASS ROTATION MODEL DARIUS DALE: MACRO TEAM FEBRUARY 2, 2015 LEGAL DISCLAIMER Hedgeye Risk Management is a registered investment advisor, registered with the State of Connecticut. Hedgeye
Market Outlook Considerations Week Beginning October 23, 2017
 Market Outlook Considerations Week Beginning October 23, 2017 DISCLAIMER-FOR-EDUCATIONAL-PURPOSES-ONLY Bobby Coats, Ph.D. Professor Economics Department of Agricultural Economics and Agribusiness University
EQUITY-FIXED INCOME CURRENCY-COMMODITY
 1 / 5 04/10/2016 USD ETFs 07/04/2017 Absolute Scoring & Ranking EQUITY-FIXED INCOME CURRENCY-COMMODITY Weekly Review www.trendandtiming.com 2/5 Weekly Report USD ETF EQUITIES EQUITY W-1 3-Nov-17 AVG AVG
Market Outlook Considerations Week Beginning November 6, 2017
 Market Outlook Considerations Week Beginning November 6, 2017 DISCLAIMER-FOR-EDUCATIONAL-PURPOSES-ONLY Bobby Coats, Ph.D. Professor Economics Department of Agricultural Economics and Agribusiness University
KEY ETF REPORT BY ASSET CLASS (US LISTED)
") 08/05/2015 < Last closing Date TOP/BOTTOM PERFORMERS 1 D (in $bn) 11/05/2015 < Current Date 10:49 PM CET (For US Listed ETF's, "today's" prices reflect last closing prices. For futures and spot FX, "today's"
08/05/2015 < Last closing Date TOP/BOTTOM PERFORMERS 1 D (in $bn) 11/05/2015 < Current Date 10:49 PM CET (For US Listed ETF's, "today's" prices reflect last closing prices. For futures and spot FX, "today's"
EQUITY-FIXED INCOME CURRENCY-COMMODITY
 1 / 5 04/10/2016 USD ETFs 07/04/2017 Absolute Scoring & Ranking EQUITY-FIXED INCOME CURRENCY-COMMODITY Weekly Review www.trendandtiming.com 2/5 Weekly Report USD ETF EQUITIES EQUITY W-1 11-Aug-17 AVG AVG
Market Recap. TTG Market View. US ETF Index performance (5d): SPY +1.0%, DIA +1.4%, IWM +1.3%, QQQ +2.0%, TLT -0.3%, GLD -1.4%
: SPY +1.0%, DIA +1.4%, IWM +1.3%, QQQ +2.0%, TLT -0.3%, GLD -1.4%") US ETF Index performance (5d): SPY +1.0%, DIA +1.4%, IWM +1.3%, QQQ +2.0%, TLT -0.3%, GLD -1.4% Market Recap US Equities broke out of their +1mo sideways pattern last week. QQQs led the SPX for the 4 th
US ETF Index performance (5d): SPY +1.0%, DIA +1.4%, IWM +1.3%, QQQ +2.0%, TLT -0.3%, GLD -1.4% Market Recap US Equities broke out of their +1mo sideways pattern last week. QQQs led the SPX for the 4 th
Selecting Portfolios for SectorSurfer Strategies
 Selecting Portfolios for SectorSurfer Strategies Don Kinell September 16 th, 2013 1 Review How SectorSurfer is Useful to an Investor 1. Demonstrates the effects of : Rotation to best trending Mutual Fund,
KEY ETF REPORT BY ASSET CLASS (US LISTED)
") 04/03/2015 < Last closing Date TOP/BOTTOM PERFORMERS 1 D (in $bn) 05/03/2015 < Current Date 3:45 AM CET (For US Listed ETF's, "today's" prices reflect last closing prices. For futures and spot FX, "today's"
04/03/2015 < Last closing Date TOP/BOTTOM PERFORMERS 1 D (in $bn) 05/03/2015 < Current Date 3:45 AM CET (For US Listed ETF's, "today's" prices reflect last closing prices. For futures and spot FX, "today's"
Market Recap. TTG Market View. US ETF Index performance (5d): SPY -0.8%, DIA -0.7%, IWM -0.3%, QQQ -1.4%, TLT +1.2%, GLD +1.9%
: SPY -0.8%, DIA -0.7%, IWM -0.3%, QQQ -1.4%, TLT +1.2%, GLD +1.9%") US ETF Index performance (5d): SPY -0.8%, DIA -0.7%, IWM -0.3%, QQQ -1.4%, TLT +1.2%, GLD +1.9% Market Recap Last week Santa was a no show as equities continue to consolidate and move a bit lower. The
US ETF Index performance (5d): SPY -0.8%, DIA -0.7%, IWM -0.3%, QQQ -1.4%, TLT +1.2%, GLD +1.9% Market Recap Last week Santa was a no show as equities continue to consolidate and move a bit lower. The
A sampling of research & data on exchange traded funds from AltaVista Research
 A sampling of research & data on exchange traded funds from AltaVista Research In this week's issue: Chart of the week: Nuclear vs. Clean Energy ETFs Fund Focus: ishares S&P Global Nuclear Energy (NUCL)...
KEY ETF REPORT BY ASSET CLASS (US LISTED)
") 23/04/2015 < Last closing Date TOP/BOTTOM PERFORMERS 1 D (in $bn) 24/04/2015 < Current Date 12:44 AM CET (For US Listed ETF's, "today's" prices reflect last closing prices. For futures and spot FX, "today's"
23/04/2015 < Last closing Date TOP/BOTTOM PERFORMERS 1 D (in $bn) 24/04/2015 < Current Date 12:44 AM CET (For US Listed ETF's, "today's" prices reflect last closing prices. For futures and spot FX, "today's"
KEY ETF REPORT BY ASSET CLASS (US LISTED)
") 13/05/2015 < Last closing Date TOP/BOTTOM PERFORMERS 1 D (in $bn) 14/05/2015 < Current Date 5:47 AM CET (For US Listed ETF's, "today's" prices reflect last closing prices. For futures and spot FX, "today's"
13/05/2015 < Last closing Date TOP/BOTTOM PERFORMERS 1 D (in $bn) 14/05/2015 < Current Date 5:47 AM CET (For US Listed ETF's, "today's" prices reflect last closing prices. For futures and spot FX, "today's"
Commentary. Our greatest weakness lies in giving up. The most certain way to succeed is always to try just one more time.
 LongRun Monthly Strategy Review May 2018 AR +0.2% AG +1.0% TMG +3.0% SP500 +2.4% GDP +0.7% Commentary Last month s commentary led off with our Absolute Return strategy moving to 100% cash for the month
AAII - Los Angeles Strategic Investing Group
 AAII - Los Angeles Strategic Investing Group June 6, 2015 RGB Capital Group LLC 14677 Via Bettona #110, San Diego, CA 92127 858-367-5200 www.rgbcapitalgroup.com This workshop is presented by Robert Bernstein
Quarterly Investment Update First Quarter 2017
 Quarterly Investment Update First Quarter 2017 Market Update: A Quarter in Review March 31, 2017 CANADIAN STOCKS INTERNATIONAL STOCKS Large Cap Small Cap Growth Value Large Cap Small Cap Growth Value Emerging
TACTICAL ASSET CLASS ROTATION MODEL DARIUS DALE: MACRO TEAM
 TACTICAL ASSET CLASS ROTATION MODEL DARIUS DALE: MACRO TEAM MARCH 12, 2015 LEGAL DISCLAIMER Hedgeye Risk Management is a registered investment advisor, registered with the State of Connecticut. Hedgeye
US Index performance (5d): SPX +2.3%, DJIA +2.1%, RTY +3.4%, NDX +3.4%, TLT -0.2%.
: SPX +2.3%, DJIA +2.1%, RTY +3.4%, NDX +3.4%, TLT -0.2%.") US Index performance (5d): SPX +2.3%, DJIA +2.1%, RTY +3.4%, NDX +3.4%, TLT -0.2%. The week ended with Fed Chair Janet Yellen confirming during an interview at Harvard University that a rate increase may
US Index performance (5d): SPX +2.3%, DJIA +2.1%, RTY +3.4%, NDX +3.4%, TLT -0.2%. The week ended with Fed Chair Janet Yellen confirming during an interview at Harvard University that a rate increase may
Quarterly Investment Update First Quarter 2018
 Quarterly Investment Update First Quarter 2018 Dimensional Fund Advisors Canada ULC ( DFA Canada ) is not affiliated with [insert name of Advisor]. DFA Canada is a separate and distinct company. Market
Focus on preservation of investor capital in down markets. Designed to put investor capital to work during sustained bull markets
 Portfolio A diversified 403(b) portfolio including domestic equity, international, alternative, and fixed income components. ETF universe is ranked using a quantitative system based on market price anomalies
TACTICAL ASSET CLASS ROTATION MODEL DARIUS DALE: MACRO TEAM
 TACTICAL ASSET CLASS ROTATION MODEL DARIUS DALE: MACRO TEAM AUGUST 31, 2015 LEGAL DISCLAIMER Hedgeye Risk Management is a registered investment advisor, registered with the State of Connecticut. Hedgeye
San Francisco Retiree Health Care Trust Fund Education Materials on Public Equity
 M E K E T A I N V E S T M E N T G R O U P 5796 ARMADA DRIVE SUITE 110 CARLSBAD CA 92008 760 795 3450 fax 760 795 3445 www.meketagroup.com The Global Equity Opportunity Set MSCI All Country World 1 Index
Focus on preservation of investor capital in down markets. Designed to put investor capital to work during sustained bull markets
 A diversified portfolio including domestic equity, international, alternative, and fixed income components. ETF universe is ranked using a quantitative system based on market price anomalies and the direction
DFA Global Equity Portfolio (Class F) Performance Report Q2 2017
 Performance Report Q2 2017") DFA Global Equity Portfolio (Class F) Performance Report Q2 2017 This presentation has been prepared by Dimensional Fund Advisors Canada ULC ( DFA Canada ), manager of the Dimensional Funds. This presentation
DFA Global Equity Portfolio (Class F) Performance Report Q2 2017 This presentation has been prepared by Dimensional Fund Advisors Canada ULC ( DFA Canada ), manager of the Dimensional Funds. This presentation
DFA Global Equity Portfolio (Class F) Performance Report Q3 2018
 Performance Report Q3 2018") DFA Global Equity Portfolio (Class F) Performance Report Q3 2018 This presentation has been prepared by Dimensional Fund Advisors Canada ULC ( DFA Canada ), manager of the Dimensional Funds. This presentation
DFA Global Equity Portfolio (Class F) Performance Report Q3 2018 This presentation has been prepared by Dimensional Fund Advisors Canada ULC ( DFA Canada ), manager of the Dimensional Funds. This presentation
DFA Global Equity Portfolio (Class F) Performance Report Q4 2017
 Performance Report Q4 2017") DFA Global Equity Portfolio (Class F) Performance Report Q4 2017 This presentation has been prepared by Dimensional Fund Advisors Canada ULC ( DFA Canada ), manager of the Dimensional Funds. This presentation
DFA Global Equity Portfolio (Class F) Performance Report Q4 2017 This presentation has been prepared by Dimensional Fund Advisors Canada ULC ( DFA Canada ), manager of the Dimensional Funds. This presentation
DFA Global Equity Portfolio (Class F) Performance Report Q3 2015
 Performance Report Q3 2015") DFA Global Equity Portfolio (Class F) Performance Report Q3 2015 This presentation has been prepared by Dimensional Fund Advisors Canada ULC ( DFA Canada ), manager of the Dimensional Funds. This presentation
DFA Global Equity Portfolio (Class F) Performance Report Q3 2015 This presentation has been prepared by Dimensional Fund Advisors Canada ULC ( DFA Canada ), manager of the Dimensional Funds. This presentation
Commentary. Things turn out best for the people who make the best of the way things turn out. - John Wooden
 LongRun Monthly Strategy Review Dec 2018 AR +0.1% AG -0.3% TMG -9.8% SP500-8.8% GDP -4.9% Commentary As noted last month, December got off to a bad start wiping out November s equity market gains in the
Focus on preservation of investor capital in down markets. Designed to put investor capital to work during sustained bull markets
 A diversified portfolio including domestic equity, international, alternative, and fixed income components. ETF universe is ranked using a quantitative system based on market price anomalies and the direction
Commentary. Just because the river is quiet doesn't mean the crocodiles have left. Malay proverb
 LongRun Monthly Strategy Review Mar 2016 AR -0.11% AG +8.52% TMG +1.91% SP500 +6.72% R2000 +8.02% GDP +9.17% Commentary Equity markets around the world registered impressive gains in March as follow-through
Commentary. Without deviation from the norm, progress is not possible. Frank Zappa
 LongRun Monthly Strategy Review Aug 2016 AR -0.71% AG -5.21% TMG -2.67% SP500 +0.12% R2000 +1.78% GDP -0.57% Commentary August was a quiet month in most markets with the major US equity indices making
Commentary. "How ridiculous and how strange to be surprised at anything which happens in life." -Marcus Aurelius
 LongRun Monthly Strategy Review Aug 2017 AR +0.72% AG +1.64% TMG +0.36% SP500 +0.29% R2000-1.54% GDP +0.67% Commentary After posting new all-time highs the first week of August, US equity markets had a
Market Briefing: Global Markets
 Market Briefing: Global Markets July 6, 218 Dr. Edward Yardeni 516-972-7683 eyardeni@ Mali Quintana 48-664-1333 aquintana@ Please visit our sites at blog. thinking outside the box Table Of Contents Table
POLICY BASED INVESTING
 STABLE DOLLAR The Federal Reserve meets on Tuesday and Wednesday this week. With monetary policy currently being the single most important policy driver for all asset classes, it will be very important
DIVERSIFICATION. Diversification
 Diversification Helps you capture what global markets offer Reduces risks that have no expected return May prevent you from missing opportunity Smooths out some of the bumps Helps take the guesswork out
KEY ETF REPORT BY ASSET CLASS (US LISTED)
") 08/12/2014 < Last closing Date TOP/BOTTOM PERFORMERS 1 D (in $bn) 09/12/2014 < Current Date 1:29 AM CET (For US Listed ETF's, "today's" prices reflect last closing prices. For futures and spot FX, "today's"
08/12/2014 < Last closing Date TOP/BOTTOM PERFORMERS 1 D (in $bn) 09/12/2014 < Current Date 1:29 AM CET (For US Listed ETF's, "today's" prices reflect last closing prices. For futures and spot FX, "today's"
High Probability ETF Trading For All
 High Probability ETF Trading For All Version 2.10 Strategy Report Chris White, March 2014 Includes full year results 01/01/2009 to 12/31/13 And Last 3 months results (01/12/13 to 02/28/14) Contents Disclaimer...
DFA Global Equity Portfolio (Class F) Quarterly Performance Report Q2 2014
 Quarterly Performance Report Q2 2014") DFA Global Equity Portfolio (Class F) Quarterly Performance Report Q2 2014 This presentation has been prepared by Dimensional Fund Advisors Canada ULC ( DFA Canada ), manager of the Dimensional Funds.
DFA Global Equity Portfolio (Class F) Quarterly Performance Report Q2 2014 This presentation has been prepared by Dimensional Fund Advisors Canada ULC ( DFA Canada ), manager of the Dimensional Funds.
IMPLEMENTING THE DOGS OF THE WORLD STRATEGY USING ETFs
 R IMPLEMENTING THE DOGS OF THE WORLD STRATEGY USING ETFs Cantor Fitzgerald Center for Institutional ETF and Indexing Research David Smith, Ph.D Albert Neubert Denise Shelley, Ph.D Research Brief 2.0 November
POLICY BASED INVESTING
 Stable Dollar Policy In early March we alerted clients that a new monetary policy paradigm was possible as President Trump begins remaking the Federal Reserve Board. We noted at the time, Trump advisor
Commentary. Forecasts usually tell us more about the forecaster than about the future. - Warren Buffett
 LongRun Monthly Strategy Review Nov 2016 AR +1.70% AG +2.07% TMG +1.16% SP500 +3.68% R2000 +11.08% GDP +1.35% Commentary Forecasters and pollsters are having a rough year. First Brexit and now the US presidential
Commentary. If you are the smartest person in the room, then you are in the wrong room. Attributed to Confucius
 LongRun Monthly Strategy Review Jun 2018 AR +0.9% AG +1.0% TMG -0.5% SP500 +0.6% GDP -0.8% Commentary June brought mixed messages from the markets. Worries about the Trump/Kim summit and Federal Reserve
Asset Allocation and Holdings Guide
 Asset Allocation and Holdings Guide Quantitative Advantage, LLC, 10400 Yellow Circle Drive, Suite 303, Minnetonka, MN 55343 866-767-8007 toll-free www.qainvest.com QA GLOBAL EQUITY Seeks long-term growth
Quarterly Market Review. First Quarter 2015
 Q1 Quarterly Market Review First Quarter 2015 Quarterly Market Review First Quarter 2015 This report features world capital market performance and a timeline of events for the past quarter. It begins with
Month-End Asset Return Analysis January 2018
 FEBRUARY 0 1 2018 United States Month-End Asset Return Analysis January 2018 Monthly, Quarterly, Annual, and Long-term tables of the major U.S. indices. Morgan Stanley Wealth Management Capital Markets
Commentary. Patience and perseverance have a magical effect before which difficulties disappear and obstacles vanish. - John Quincy Adams
 LongRun Monthly Strategy Review Sep 2018 AR -2.0% AG-2.5% TMG -0.3% SP500 +0.6% GDP -0.04% Commentary Last month I pointed out that the S&P 500 large cap stock index had closed higher five months in a
Navellier Tactical Portfolios
 Navellier Tactical Portfolios Defensive ETF Portfolios Designed for All Market Cycles As of December 31, 2017 Please see important disclosures at end of presentation. Please see important disclosures at
Prepared By: David Advisor Prepared for: Joe Investor
 Prepared By: David Advisor Prepared for: Joe Investor Content Investment philosophy Risk preference Asset mix History performance Portfolio constitution Disclaimer Date: 2009 10 2 RiskFile Porfolio Composer:
High Probability ETF Trading For All
 High Probability ETF Trading For All Version 2.7 Strategy Report Chris White, August 2012 Includes results to end of July 2012 Contents Disclaimer... 2 Summary... 3 The High Probability ETF Trading book
LongRun Monthly Strategy Review. Commentary. Oct 2017
 LongRun Monthly Strategy Review Oct 2017 AR 1.78% AG -0.61% TMG +1.50% SP500 +2.36% R2000 +0.73% GDP +0.35% Commentary Market history says that October can be a dangerous month and 2017 marked the 40 th
Quarterly Investment Update
 Quarterly Investment Update Second Quarter 2017 Dimensional Fund Advisors Canada ULC ( DFA Canada ) is not affiliated with The CM Group DFA Canada is a separate and distinct company Market Update: A Quarter
Rollercoaster Ride Ahead
 1 11 21 31 41 51 61 71 81 91 101 111 121 131 141 151 161 171 181 191 201 211 221 231 241 251 Rollercoaster Ride Ahead The Dow Jones Industrial Average reached a new high of 21,115.55 on March 1 st. With
Vantage Investment Partners. Quarterly Market Review
 Vantage Investment Partners Quarterly Market Review First Quarter 2016 Quarterly Market Review First Quarter 2016 This report features world capital market performance and a timeline of events for the
Commentary. You can t overlook volatility, but you don t let it push you around in the market - Boone Pickens
 LongRun Monthly Strategy Review Nov 2018 AR +0.2% AG -0.9% TMG +2.4% SP500 +1.9% GDP +0.8% Commentary By way of a recap, US equity markets spent most of October going down before a scramble to recover
Global Business Barometer April 2008
 Global Business Barometer April 2008 The Global Business Barometer is a quarterly business-confidence index, conducted for The Economist by the Economist Intelligence Unit What are your expectations of
Transamerica Tactical Rotation. Monthly Dashboard February 2014
 TRANSAMERICA TACTICAL ROTATION Transamerica Tactical Rotation Monthly Dashboard February 2014 Class A: ATTRX Class C: CTTRX Class I: ITTOX Expectations Indicators Actual Allocations Positioning Risk Portfolio
Month-End Asset Return Analysis February 2018
 M ARCH 0 1 2018 United States Month-End Asset Return Analysis February 2018 Monthly, Quarterly, Annual, and Long-term tables of the major U.S. indices. Morgan Stanley Wealth Management Capital Markets
Month-End Asset Return Analysis March 2018
 A PRIL 0 2 2018 United States Month-End Asset Return Analysis March 2018 Monthly, Quarterly, Annual, and Long-term tables of the major U.S. indices. Morgan Stanley Wealth Management Capital Markets Patrick
Four Components Of A Successful Income Portfolio
 Four Components Of A Successful Income Portfolio Presented by: David Fabian Michael Fabian FMD Capital Management One Park Plaza, Suite 600 Irvine, CA 92614 Ph: 888-823-8111 F: 949-266-5788 www.fmdcapital.com
Global Select International Select International Select Hedged Emerging Market Select
 International Exchange Traded Fund (ETF) Managed Strategies ETFs provide investors a liquid, transparent, and low-cost avenue to equities around the world. Our research has shown that individual country
Market Overview As of 4/30/2018
 Asset Class Leadership Periodic Table Worst Best 5.24-26.16-28.92-36.85-37.00-37.34-38.44-38.54-45.53 78.51 58.21 41.45 37.21 34.47 27.45 26.46 20.58 19.69 29.09 27.58 24.50 18.88 16.71 15.51 15.12 15.06
Market Overview As of 11/30/2018
 Asset Class Leadership Periodic Table Worst Best 5.24-26.16-28.92-36.85-37.00-37.34-38.44-38.54-45.53 78.51 58.21 41.45 37.21 34.47 27.45 26.46 20.58 19.69 29.09 27.58 24.50 18.88 16.71 15.51 15.12 15.06
1000G 1000G HY
 Asset Class Leadership Periodic Table Worst Best 5.24-26.16-28.92-36.85-37.00-37.34-38.44-38.54-45.53 78.51 58.21 41.45 37.21 34.47 27.45 26.46 20.58 19.69 29.09 27.58 24.50 18.88 16.71 15.51 15.12 15.06
Market Overview As of 1/31/2019
 Asset Class Leadership Periodic Table Worst Best 78.51 58.21 41.45 37.21 34.47 27.45 26.46 20.58 19.69 29.09 27.58 2 18.88 16.71 15.51 15.12 15.06 11.15 7.84 7.28 4.98 2.64 2.11 0.39-2.91-5.50-13.71 20.14
Commentary. CBOE Volatility Index (VIX) Brexit Election VIX
 Brexit Election VIX") LongRun Monthly Strategy Review Mar 2018 AR -0.7% AG -2.9% TMG -2.3% SP500-2.7% GDP 0.0% Commentary I finished last month s commentary with a caution that equity markets might retest the lows of February
LongRun Monthly Strategy Review Mar 2018 AR -0.7% AG -2.9% TMG -2.3% SP500-2.7% GDP 0.0% Commentary I finished last month s commentary with a caution that equity markets might retest the lows of February
Market Overview As of 8/31/2017
 Asset Class Leadership Periodic Table Worst Best 39.42 16.65 11.81 7.05 6.97 5.49 1.87-0.17-9.78 5.24-26.16-28.92-36.85-37.00-37.34-38.44-38.54-45.53 78.51 58.21 41.45 37.21 34.47 27.45 26.46 20.58 19.69
Market Overview As of 10/31/2017
 Asset Class Leadership Periodic Table Worst Best 39.42 16.65 11.81 7.05 6.97 5.49 1.87-0.17-9.78 5.24-26.16-28.92-36.85-37.00-37.34-38.44-38.54-45.53 78.51 58.21 41.45 37.21 34.47 27.45 26.46 20.58 19.69
Inflows Picked Up in October Led by Equities Hallie Martin
 Deutsche Bank Markets Research North America Date Synthetic Equity & Index Strategy November 7 Inflows Picked Up in October Led by Equities Hallie Martin Global equities rallied in October 7 led by Emerging
Portfolio Strategist Update from BlackRock Active Opportunity ETF Portfolios
 Portfolio Strategist Update from BlackRock Active Opportunity ETF Portfolios As of Sept. 30, 2017 Ameriprise Financial Services, Inc., ("Ameriprise Financial") is the investment manager for Active Opportunity
US ETF Index performance (5d): SPY -1.9%, DIA -1.7%, IWM -1.7%, QQQ -2.1%, TLT -3.0%.
: SPY -1.9%, DIA -1.7%, IWM -1.7%, QQQ -2.1%, TLT -3.0%.") US ETF Index performance (5d): SPY -1.9%, DIA -1.7%, IWM -1.7%, QQQ -2.1%, TLT -3.0%. TTG Market View (9/10): What a way to end the week! The SPX falling 2.4% and closing on the lows. This marks the first
US ETF Index performance (5d): SPY -1.9%, DIA -1.7%, IWM -1.7%, QQQ -2.1%, TLT -3.0%. TTG Market View (9/10): What a way to end the week! The SPX falling 2.4% and closing on the lows. This marks the first
US ETF Index performance (5d): SPY +1.5%, DIA +2.0%, IWM +2.5%, QQQ +1.4%, TLT -3.6%.
: SPY +1.5%, DIA +2.0%, IWM +2.5%, QQQ +1.4%, TLT -3.6%.") US ETF Index performance (5d): SPY +1.5%, DIA +2.0%, IWM +2.5%, QQQ +1.4%, TLT -3.6%. After the SPX has returned a bullish +6.1% over the last three weeks, equities looked a bit exhausted towards the end
US ETF Index performance (5d): SPY +1.5%, DIA +2.0%, IWM +2.5%, QQQ +1.4%, TLT -3.6%. After the SPX has returned a bullish +6.1% over the last three weeks, equities looked a bit exhausted towards the end
Commentary. "The inevitable may be certain, but it is not always punctual." - Jim Grant - Grant's Interest Rate Observer
 LongRun Monthly Strategy Review Nov 2017 AR +2.2% AG +2.1% TMG +2.7% SP500 +3.1% R2000 +2.9% GDP +0.9% Commentary November saw global markets focused on the prospects for US tax reform and Washington managed
Q2 Quarterly Market Review Second Quarter 2015
 Q2 Quarterly Market Review Second Quarter 2015 Quarterly Market Review Second Quarter 2015 This report features world capital market performance and a timeline of events for the past quarter. It begins
SELECT YOUR SECTORS. Respond to Market Cycles with Agility and Precision
 SELECT YOUR SECTORS Respond to Market Cycles with Agility and Precision ECONOMIC CYCLES & SECTORS The economy moves in cycles. Specific sectors may outperform or underperform during different phases, driven
Commentary. "How ridiculous and how strange to be surprised at anything which happens in life." - Marcus Aurelius, Stoic philosopher
 LongRun Monthly Strategy Review Jan 2018 AR +5.2% AG +5.3% TMG +5.1% SP500 +5.6% R2000+2.6% GDP +2.8% Commentary January took global markets to new heights after a better than expected 2017. Last month
US ETF Index performance (5d): SPY -0.1%, DIA +0.4%, IWM +0.1%, QQQ -0.1%, TLT +1.1%.
: SPY -0.1%, DIA +0.4%, IWM +0.1%, QQQ -0.1%, TLT +1.1%.") US ETF Index performance (5d): SPY -0.1%, DIA +0.4%, IWM +0.1%, QQQ -0.1%, TLT +1.1%. US Indices ran out of steam last week as Brexit fears started to take shape. S&P futures (ESM6) hit major resistance
US ETF Index performance (5d): SPY -0.1%, DIA +0.4%, IWM +0.1%, QQQ -0.1%, TLT +1.1%. US Indices ran out of steam last week as Brexit fears started to take shape. S&P futures (ESM6) hit major resistance
Summit Strategies Group
 As of December 3, 203 US Equity: All Cap Russell 3000 Index 2.64 0.0 33.55 33.55 6.24 8.7 6.50 7.88 7.09 Dow Jones US Total Stock Market Index 2.63 0. 33.47 33.47 6.23 8.86 6.68 8.0 6.90 US Equity: Large
Risks, Returns, and Portfolio Diversification Benefits of Country Index Funds in Bear and Bull Markets
 Volume 2. Number 1. 2011 pp. 1-14 ISSN: 1309-2448 www.berjournal.com Risks, Returns, and Portfolio Diversification Benefits of Country Index Funds in Bear and Bull Markets Ilhan Meric a Leonore S. Taga
20,000 - Check, What s next?
 1 11 21 31 41 51 61 71 81 91 101 111 121 131 141 151 161 171 181 191 201 211 221 231 241 251 20,000 - Check, What s next? The Dow Jones Industrial Average crossed the psychological 20,000 barrier on January
Exchange-Traded Funds
 Exchange-Traded Funds NORTH AMERICA MICHAEL JABARA Morgan Stanley Wealth Management Michael.Jabara@morganstanley.com +1 212 296-5101 JOHN DUGGAN Morgan Stanley Wealth Management John.Duggan@morganstanley.com
Global ex US PE / VC Benchmark Commentary Quarter Ending September 30, 2016
 Global ex US PE / VC Benchmark Commentary Quarter Ending September 30, 2016 Overview In USD terms, the Cambridge Associates LLC Global ex US Developed Markets Private Equity and Venture Capital Index returned
US ETF Index performance (5d): SPY -0.9%, DIA -0.5%, IWM -2.0%, QQQ -1.1%, TLT -1.7% GLD -0.3%
: SPY -0.9%, DIA -0.5%, IWM -2.0%, QQQ -1.1%, TLT -1.7% GLD -0.3%") US ETF Index performance (5d): SPY -0.9%, DIA -0.5%, IWM -2.0%, QQQ -1.1%, TLT -1.7% GLD -0.3% TTG Market View: Next week earnings will be in the spotlight along with the third presidential debate, and
US ETF Index performance (5d): SPY -0.9%, DIA -0.5%, IWM -2.0%, QQQ -1.1%, TLT -1.7% GLD -0.3% TTG Market View: Next week earnings will be in the spotlight along with the third presidential debate, and
Information Circular: ishares Trust
 Information Circular: ishares Trust To: From: Head Traders, Technical Contacts, Compliance Officers, Heads of ETF Trading, Structured Products Traders NASDAQ Listing Qualifications Department BX Listing
Are We There Yet? # Days. Quantitative Investment Decisions 999 Vanderbilt Beach Road Suite 200 Naples, Florida
 1 11 21 31 41 51 61 71 81 91 101 111 121 131 141 151 161 171 181 191 201 211 221 231 241 251 Are We There Yet? March lived up to expectations with a slightly negative Market return, -0.04%. The post-election
FTSE Global Small Cap
 FTSE Russell Factsheet FTSE Global Small Cap ex US Index Data as at: 31 August 2018 bmktitle1 The FTSE Global Small Cap ex US Index is a market-capitalization weighted index representing the performance
Global Equity Strategy Report
 Global Investment Strategy Global Equity Strategy Report April 26, 2017 Stuart Freeman, CFA Co-Head of Global Equity Strategy Scott Wren Senior Global Equity Strategist Analysis and outlook for the equity
Exchange-Traded Funds
 Exchange-Traded Funds NORTH AMERICA MICHAEL JABARA Morgan Stanley Wealth Management Michael.Jabara@morganstanley.com +1 212 296-5101 JOHN DUGGAN Morgan Stanley Wealth Management John.Duggan@morganstanley.com