Franked amount per security Record date Payment date Interim dividend/distribution December February 2018
|
|
|
- Juliet Harper
- 5 years ago
- Views:
Transcription
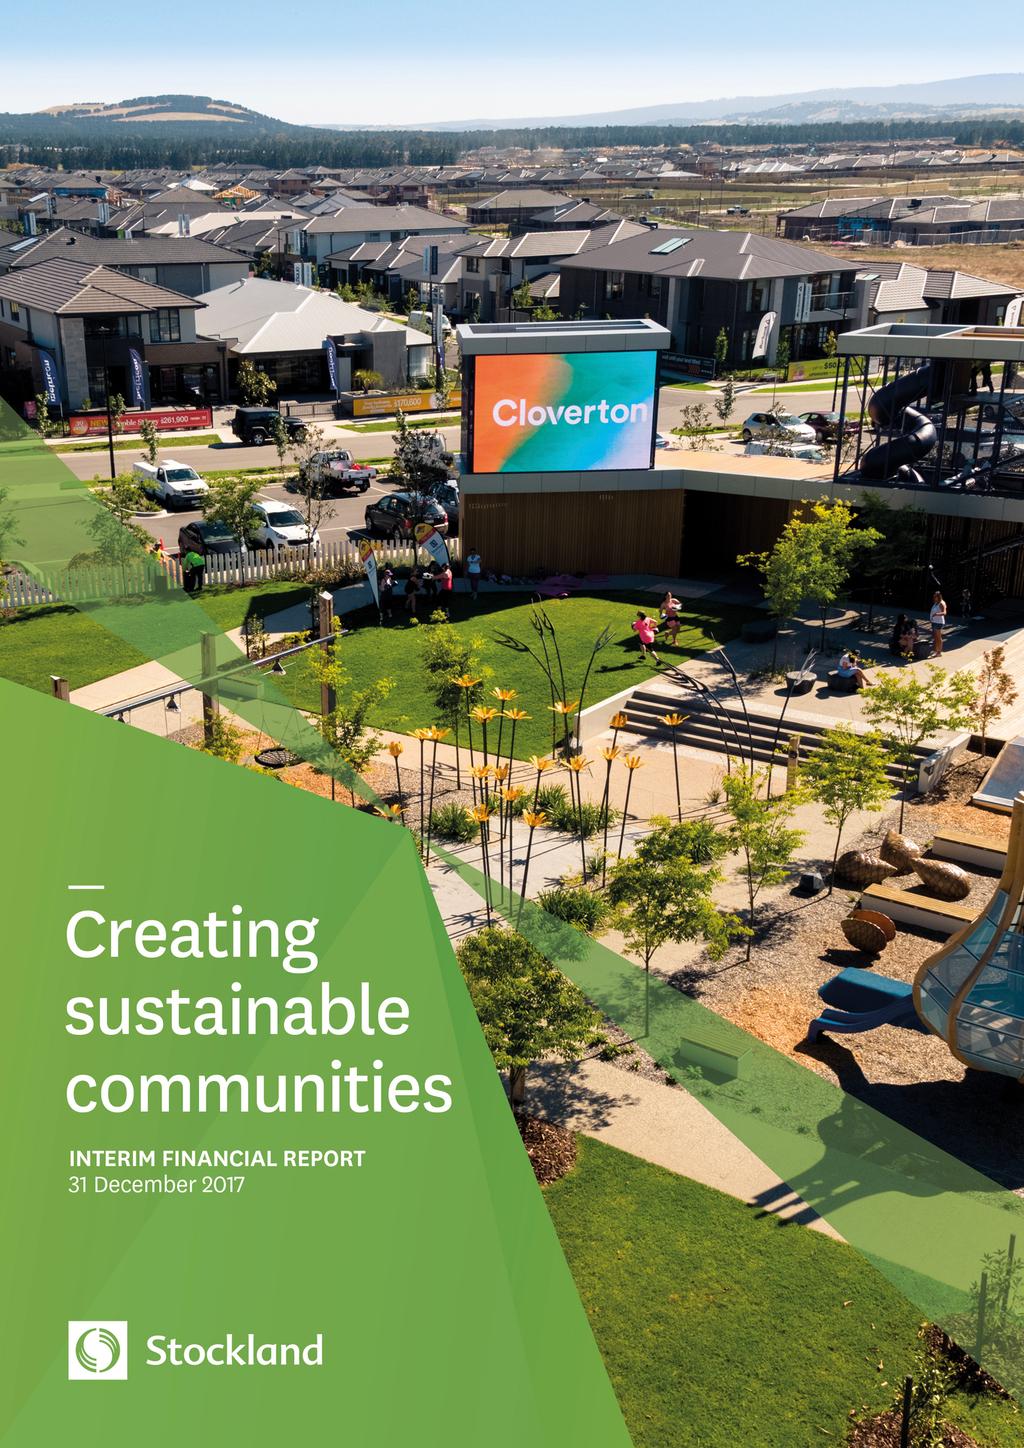
1 Appendix 4D For the half year ended 31 December (previous corresponding period being the half year ended 31 December 2016) Results for announcement to the market STAPLING ARRANGEMENT was established for the purpose of facilitating a joint quotation of Corporation Limited (ABN ) and its controlled entities, and Trust (ARSN ) and its controlled entities on the Australian Stock Exchange. Trust Management Limited (ABN ) is the Responsible Entity of Trust. The Interim Financial Report has been prepared based upon a business combination of the parent entity, Corporation Limited and its controlled entities, and Trust and its controlled entities, in accordance with AASB 3 Business Combinations. Half year ended 31 December Revenue from ordinary activities Up 14.3% to 1,337 Net profit after tax attributable to securityholders Down 2.6% to 684 Funds from operations attributable to securityholders Up 18.2% to 436 Dividends and distributions Half year ended 31 December Amount per security Franked amount per security Record date Payment date Interim dividend/distribution December 28 February 2018 On 21 February 2018 we announced the suspension of the Distribution Reinvestment Plan (DRP) in respect of the half year distribution for the six months ended 31 December. The proposed DRP issue price of stapled securities announced on 16 February 2018 of $4.03 is below the Group s net tangible assets per security at 31 December of $4.18, and significantly below the closing price of $4.74 on 14 December, the day the operation of the DRP was announced. As a result, the Directors have formed the view that some securityholders may be disadvantaged if the issue were to proceed. The Group has sufficient capital to maintain its development and investment activity. Other information 31 December 31 December 2016 Net tangible assets per security $4.18 $4.00 This report is based on the Interim Financial Report 2018 which has been reviewed. The remainder of information requiring disclosure to comply with listing rule 4.3A is contained in the Interim Financial Report 2018 that follows.
2

3 CONTENTS Letter from our Chairman and Managing Director and CEO 1 Directors Report 3 Operating and Financial Review 3 Directors 16 Lead Auditor s Independence Declaration under Section 307C of the Corporations Act Interim Financial Statements 18 Consolidated Statements of Profit or Loss and Other Comprehensive Income 18 Consolidated Balance Sheets 19 Consolidated Statements of Changes in Equity 20 Consolidated Cash Flow Statements 22 Consolidated Notes 23 Directors Declaration 51 Independent Auditor s Review Report 52 Glossary 54 KEEPING IT SIMPLE The aim of the text in Keeping it simple boxes is to explain more complex sections in plain English. Notes to the financial statements provide information required by law, accounting standards or ASX Listing Rules to explain a particular feature of the financial statements. The notes to the financial statements will also provide explanations and additional disclosure to assist readers understanding and interpretation of the financial statements. GLOSSARY A glossary containing acronyms and defined terms is included at the back of this Report.
, reflecting the benefits of our diversified business model.")
 of $436 million, an increase of 18.2 per cent on the previous corresponding period.")
4 Letter from our Chairman and Managing Director and CEO TOM POCKETT CHAIRMAN MARK STEINERT MANAGING DIRECTOR AND CEO Dear Securityholders We are pleased to deliver a solid result for the half year ended 31 December (1H18), reflecting the benefits of our diversified business model. Our continued focus on community creation and leveraging our diverse sector capability is delivering some of the most liveable, affordable and connected communities in Australia and consistent, growing returns for our securityholders. For the half year, we generated funds from operations (FFO) of $436 million, an increase of 18.2 per cent on the previous corresponding period. Our statutory profit was $684 million, slightly down on the previous period, mainly due to lower finance income relative to the prior period. As indicated previously, the distribution for the half year is 13.0 cents per security, supporting our target full year distribution of 26.5 cents per security, assuming no material change in market conditions. Our strategy to broaden our customer reach, grow asset returns, improve operational efficiency and maintain capital strength is driving sustainable profit growth, in an environment that has presented challenging conditions for some of our operating sectors. GROWING ASSET RETURNS AND OUR CUSTOMER BASE Over the last four years we have built a strong residential business with significantly enhanced returns. We have made considerable progress reshaping the business placing a greater focus on the deep Melbourne and Sydney markets, with particular emphasis on transport and infrastructure corridors. As a result, our Residential business delivered another half year of exceptionally strong returns and settlements. Our land bank now totals over 85,000 future housing lots nationally and we maintain our focus on delivering some of the most affordable, liveable and desirable new communities in Australia. Our Logistics and Business Parks business, has also made great progress, delivering strong results and 99 per cent occupancy rate. The value of our Logistics and Business Parks business, has risen around $600 million over the past four years from $1.5 billion to $2.1 billion, and now represents 14 per cent of total Group asset value. We are on track to continue to grow this segment of the Group with $176 million of construction underway and an additional $590 million development pipeline. The retail environment remains subdued however we have maintained high occupancy in our Retail Town Centre business with an intense focus on upgrading and remixing our centres in line with customer preferences. We continue to reposition our Retail Town Centre portfolio and have developed and remixed strong performing centres such as Wetherill Park, Sydney and Green Hills stage 1 and 2 in Maitland, New South Wales. Our repositioning of our portfolio continues at 20 centres across the country with a focus on services, casual dining, health and entertainment. Close to 90 per cent of our Retail Town Centre portfolio comprises centres that lead their catchment area or are mixed use, CBD, or community neighbourhood centres. We will continue to focus on the creation of dynamic, high quality retail town centres through our $530 million development pipeline. As announced in August, we are aiming to divest $300 million of retail town centres over the next 12 to 18 months, of which approximately $70 million has completed to date. Our Retirement Living business continues to be supported by the fundamentals of an ageing population, which continues to underpin this business segment. However, sales at both existing villages and new developments over the half have been affected by the increased media attention on the sector, which has influenced customer confidence. Sales over the period were also affected by lower volumes of new development stock due to project timing. In response to customer preferences we have increased our focus on services, facilities and health and wellbeing. We are proud of our commitment to resident satisfaction and our ability to achieve consistently high levels of satisfaction at our Retirement Living villages across Australia. CAPITAL STRENGTH Over the half, we have sustained disciplined capital management and strong underlying cash flows. We have continued to actively manage our debt program, which has seen us improve our weighted average cost of debt for the period, now down to 5.3 per cent from 5.5 per cent in FY17. Our A-/stable credit rating from Standard & Poor s and A3 credit rating from Moody s were retained and demonstrate the strength of our balance sheet. We have suspended the distribution reinvestment plan (DRP) for the period, as the DRP price of $4.03 is at a discount to our current net tangible assets of $4.18. The Group has sufficient capital to maintain current development and investment activity and remain within our target gearing range. OPERATIONAL EXCELLENCE We remain extremely proud of our leadership and commitment to sustainability. This year we will set a new standard for solar energy in Australian property as we commence the rollout of our $23.5 million solar initiative across 10 of our retail town centres. The initiative will generate strong shared value for both our investors and our communities. We also continue to invest in technology and innovation, which is critical to maintaining a competitive cost structure, and responding to global trends and the changing preferences of our customers. Letter from our Chairman and Managing Director and CEO 1
5 OUTLOOK With a strong balance sheet, good earnings visibility and robust, growing development pipelines, we are well placed to respond to the needs of Australia s growing population. We expect economic conditions to remain relatively favourable with the economic fundamentals, here in Australia and abroad, remaining positive and interest rates at historically low levels. Assuming no material change in market conditions, we remain on track to achieve our target FFO growth per security of per cent for the full year. For more detailed insights on our half year performance and outlook we encourage you to visit our investor centre stockland.com.au/investor-centre TOM POCKETT MARK STEINERT 2
, present their report together with the Financial Report of and the Financial Report of the Trust for the half year ended 31 December and the Independent Auditor s")
6 Directors Report Half year ended 31 December The Directors of Corporation Limited (ACN ) and the Directors of Trust Management Limited (ACN , AFSL ), the Responsible Entity of Trust (ARSN ), present their report together with the Financial Report of and the Financial Report of the Trust for the half year ended 31 December and the Independent Auditor s Review Report thereon. The Financial Report of comprises the consolidated Financial Report of Corporation Limited and its controlled entities, including Trust and its controlled entities, (collectively referred to as or Group ). The Financial Report of Trust comprises the consolidated Financial Report of the Trust and its controlled entities ( Trust Group or the Trust ). Operating and Financial Review About is one of the largest diversified property groups in Australia with more than $17.9 billion of real estate assets. We are Australia s largest community creator and hence we own, manage and develop retail town centres, logistics centres and business parks, office assets, residential communities, and retirement living villages. Founded in 1952, today leverages its diversified model to help create thriving communities with dynamic town centres where people live, shop and work. Our vision is to be a great Australian real estate company that makes a valuable contribution to our communities and our country. This approach is underpinned by our purpose we believe there is a better way to live and is brought to life by our employees who are guided by s values of Community, Accountability, Respect, and Excellence (CARE). Our primary objective is to deliver earnings per security growth and total risk-adjusted securityholder returns above the Australian Real Estate Investment Trust index average, by creating quality communities and property assets and delivering great customer experiences. To optimise value to securityholders we are structured as a stapled security: a combination of a share in Corporation and a unit in Trust that are together traded as one security on the Australian Securities Exchange. This stapled structure allows to efficiently undertake property investment, property management and property development activities to create sustainable risk/reward outcomes. Our strategy Interim Financial Report
7 Directors Report Half year ended 31 December We focus on three strategic priorities: grow asset returns by providing great customer experiences actively managing our portfolio and developing new assets operational excellence improving the way we operate across the Group to drive efficiencies, compliance, sustainability and employee engagement capital strength actively managing our balance sheet to maintain diverse funding sources and an efficient cost of capital Strategic priorities Grow asset returns and our customer base Create liveable, affordable and sustainable communities Develop and manage resilient retail town centres Active asset management and portfolio optimisation Accretive development Operational excellence Continuously improve the customer experience Maintain sustainability leadership Digitise our business Capital strength Maintain investment grade credit ratings Gearing within per cent Safeguard diverse funding sources Maintain strong operating cash flow Risks and opportunities adopts a rigorous approach to understanding and proactively managing the risks faced in the business. We recognise that making business decisions that involve calculated risks, and managing these risks within sensible tolerances, is fundamental to creating long term value for securityholders and meeting commitments to our employees, tenants, customers, business partners, consultants and the communities in which we do business. More information on s risk management policy is available at stockland.com.au/corporate-governance. There are various risks that could impact our business. The nature and potential impact of these risks change over time. For example, future climate change impacts will place greater demands on our assets and communities and influence the actions and behaviours of our stakeholders. Climate change risks and opportunities are reflected in several risks listed below: extreme weather events, changing regulation, and the ability to develop products that meet anticipated future demand. For more information on our climate change action, including governance, strategy, performance and sustainability targets, refer to our response to the Task Force on Climate Related Financial Disclosure s recommendations online at stockland.com.au/corporate-governance. Our risks include but are not limited to: Short term strategy execution Risk Increased competition and changing market conditions impact our opportunities for growth Systems enhancements affect business process efficiency Our response Continue to: maintain a diversified business model at scale in each sector reinvest in our assets to meet changing customer needs focus on retaining a strong balance sheet with appropriate gearing use diverse funding sources concentrate on efficiency and cost management maintain a prudent approach to provisioning and forecasting proactively replenish our land and asset pipelines maintain discipline and agility in our investment decision making use a rigorous whole of business approach informed by detailed research to drive our capital allocation process As part of our continued investment in the efficiency of our operations, we have made significant progress on improving the Group s systems capabilities including the successful implementation of Salesforce and SAP SuccessFactors. Deployment of further SAP and Salesforce capabilities will continue during this year. We continue to maintain two-way engagement with employees to enable a smooth transition. Interim Financial Report
8 Directors Report Half year ended 31 December Risk Housing affordability is increasingly challenging in Australia Our response Our Residential business is influenced by the dynamics of the Australian housing market. Housing affordability remains of key concern for Australians as the price of housing and rental properties continues to increase. We believe a suite of measures is required to unlock housing supply and address affordability. These include early planning and delivery of infrastructure and simplified development controls to enable housing diversity. Our affordability initiatives have given first home buyers priority to purchase land and get a foothold in the market with around 50 per cent of sales to this segment. We will also continue to: partner with government and industry to drive solutions provide a broader mix of value for money housing options including house and land packages, completed housing, medium density and apartments balance the demand from home owners and investors so that our residential communities remain attractive to future buyers Longer term changing marketplace Extreme weather, security risks and price shocks impact business continuity and community resilience Change within the retail sector impacts rental growth Regulatory changes impact our business and customers Continued negative retirement living media coverage impacts sector performance Ability to develop products that meet anticipated future customer and societal demands Our ability to harness opportunities arising from digital disruption Continue to: train our employees and increase their risk awareness undertake regular scenario testing engage with peers and across industries invest in asset upgrades and adapt community design to improve resilience assess and implement wholesale energy strategies and renewable energy installations The retail landscape is constantly evolving. Within the last 10 years the sector has seen a convergence of technological advances, in particular e-commerce, changes in underlying consumer behaviour, and the entry of new, international retailers. These changes have challenged some of our retailers. We have been proactive and have pre-empted many of the changes. We continue to: focus on experiential retail, health, services and food catering redevelop our assets to create diverse, walkable town centres that form the social hub of the community leverage deep customer insights and analytics to inform our tenant remixing Continue to: engage with industry and government on policy areas including taxation and planning reform develop in areas where governments support growth focus on good practice to remain well positioned in the market and prepared for potential regulatory changes Continue to: have an open and respectful approach to our retirement living residents, and remain committed to being transparent and up-front about costs associated with living in our retirement villages proactively engage with residents to maintain high satisfaction levels and standards of care focus on health and wellbeing and our approach to care demonstrate industry leadership and work with our peers to lift industry standards review product and contract choice to meet changing customer preferences Continue to: foster a culture of innovation where we remain flexible, and identify and take advantage of opportunities to leverage movements in stakeholder preferences evolve our market leading product innovation and deepen our customer insights using our proprietary Liveability Index research, Exchange (our online research community), Quantium (which provides data-driven customer insights to inform how we view markets and opportunities) and other data sources focus on creating sustainable and liveable communities and assets, resilient to changes in climate enhance our design excellence, providing greater functionality and value for money that meet the demands of Australia s changing demographics, including an aging population and more socially conscious millennials Continue to: identify, develop and integrate technological enhancements across our business, including online residential and retirement living engagement opportunities support retail town centres as thriving community hubs by delivering quality services and community spaces that are e-enabled Interim Financial Report
9 Directors Report Half year ended 31 December Risk Capital market volatility impacts our ability to access suitable capital Ability to adapt our operating model to meet the changing nature of the workforce Increasing expectation on corporates Our response Our long term growth is dependent on our ability to access capital at the appropriate time and cost even as capital markets fluctuate in response to domestic and global economic shifts. Variable economic activity and changing capitalisation rates may impact the valuation of our assets. So that we are able to continue to raise sufficient capital to fund growth, we will continue to: focus on retaining a strong balance sheet at appropriate levels of gearing maintain and increase access to diverse funding sources maintain our prudent capital management policies Physical and organisational boundaries are becoming increasingly blurred as new technology enables greater workplace flexibility, including when and where employees work and encouraging creative and adaptive teamwork. This year we successfully deployed Office365, Salesforce and SAP SuccessFactors to improve collaboration and flexible working. We will continue to: encourage flexible work practices supported by our new collaboration platforms train our senior leaders to be more agile and resilient through programs such as our Leadership Experience Community expectations on the social and behavioural operations of a good corporate are changing. Corporates are increasingly expected to work in partnership with the community and government on societal issues. We are well placed to meet these expectations and have a strong reputation for sustainability leadership and community development. results and outlook Key metrics Half year distribution was 13.0 cents per security Statutory profit was $684 million, down 2.6 per cent on 1H17 Statutory EPS was 28.3 cents, down 3.4 per cent on 1H17 Funds from operations (FFO) was $436 million, up 18.2 per cent on 1H17 FFO per security was 18.0 cents, up 16.9 per cent on 1H17 Gearing was 23.0 per cent compared to 22.7 per cent in FY17 Return on equity 1 was 11.7 per cent, excluding workout assets has delivered strong profit for the half year ended 31 December, reflecting the benefits of our diversified business model delivering solid results for the Group. Statutory profit for the half was $684 million and the Group generated funds from operations (FFO) of $436 million, an increase of 18.2 per cent on the previous corresponding period. Our continued focus on community creation and leveraging our diverse sector capability are delivering some of the most liveable, affordable and connected communities in Australia and consistently, growing returns for our securityholders. This focus continues to generate strong demand across our Residential business; consistent leads for our Retirement Living business; vibrant, resilient Retail Town Centres; and employment hubs in our Logistics and Business Parks. Our strategy to broaden our customer reach, grow our asset returns, improve operational efficiency and maintain capital strength, is driving sustainable profit growth in an environment that has presented some challenging conditions for some of our operating sectors. Our Residential business delivered particularly strong returns and settlements across the country. Around half of our residential customers are first home buyers and over 75 per cent are owner occupiers, which places us in a preferred position in the current residential lending and government policy environment. Our Commercial Property business continues to deliver solid profit, with the Retail Town Centre business seeing sales growth in the second quarter after a flat start to the half and our growing Logistics and Business Parks business with 99 per cent occupancy across the portfolio. 1 Return on equity accumulates individual business return on assets and incorporates cash interest paid and average drawn debt for the 12 month period ended 31 December. Excludes residential communities workout projects. Interim Financial Report
10 Directors Report Half year ended 31 December The Retirement Living business continues to be supported by the fundamentals of an ageing population, which continues to underpin this business segment. However, sales at both existing villages and new developments over the half have been affected by the increased media attention on the sector, which has influenced customer confidence. Sales over the period were also affected by lower volumes of new development stock due to project timing. Resident satisfaction levels consistently rate above 84 per cent, and in response to customer preferences we have an increased focus on health and wellbeing. We remain proud of our leadership and commitment to excellence in sustainability. In, we committed to investing in sustainable energy and are proud to be setting a new standard in solar for Australian property. This year we are commencing the rollout of our $23.5 million solar initiative across 10 of our Retail Town Centres, which will help create clean, green energy for our retailers, our customers and the communities we operate in. Investing in technology like solar energy makes good business sense. Our forecast average yield over a 10 year period for the solar project is 11.6 per cent on capital invested, which will generate strong shared value for both our investors and our communities. In, we were recognised as a global leader in sustainability, including being the only Australian company to be included on the Climate A list released by CDP 2, and we were named the Global Leader for the Listed Diversified Office/Retail category in the GRESB (Global Real Estate Sustainability Benchmark) survey. We were also listed on the World Dow Jones Sustainability Index for the 11th consecutive year, after being recognised as the most sustainable real estate company in the world in 2011, 2013, 2015 and We continue to invest in technology and innovation, which is critical to maintaining a competitive cost structure, and responding to global trends and the changing preferences of our customers. Outlook Our results continue to be driven by our integrated approach to community creation, active asset management, and disciplined approach to capital allocation and management. We expect economic conditions to remain relatively favourable. The economic fundamentals, in Australia and abroad, remain positive and interest rates are still historically low. Population growth and associated infrastructure investment are key drivers of all our businesses and with a strong balance sheet, good earnings visibility and robust, growing pipelines we are well placed to respond to the needs of Australia needs over the next decade. Assuming no material change in market conditions, we remain on track to achieve our target FFO growth per security of per cent for the full year, with growth skewed to the first half due to timing of residential settlements, and a full year distribution of 26.5 cents per security, representing growth of 4 per cent and within the target range of per cent FFO. 2 Leading sustainability ratings agency, formerly known as the Carbon Disclosure Project. Interim Financial Report
11 Directors Report Half year ended 31 December Funds from operations (FFO) FFO is our primary reporting measure. FFO has been determined with reference to the Property Council of Australia s voluntary disclosure guidelines to help investors and analysts compare Australian real estate organisations. It is designed to present the results of the ongoing operating activities of in a way that reflects our underlying performance. FFO is the basis on which the dividends and distributions are determined. FFO excludes adjustments such as unrealised fair value gains/losses, realised transactions occurring infrequently and those that are outside the course of our core ongoing business activities. also excludes income tax expenses or benefits that do not represent a cash settlement, due to a build-up of tax losses. FFO and statutory profit reconciliation Half year ended 31 December FFO 2016 Statutory adjustments Statutory results FFO Statutory adjustments Statutory results Revenue 1,346 (9) 1,337 1,182 (13) 1,169 Cost of property developments sold: land and development (595) (595) (556) (556) capitalised interest (57) (57) (76) (76) utilisation of provision for impairment of inventories Investment property expenses (124) (7) (131) (117) (6) (123) Share of profits of equityaccounted 15 (3) investments Management, administration, (142) (142) (143) (143) marketing and selling expenses Net change in fair value of investment properties: Commercial Property Retirement Living Net change in fair value of (72) (72) (37) (37) Retirement Living resident obligations Net gain on other financial assets Net loss on sale of other noncurrent (2) (2) (2) (2) assets Finance income Finance expense (37) (37) (42) (42) Profit before income tax Income tax benefit Profit for the period Earnings per security (cents) Strong settlements for our Residential business have contributed to 14 per cent growth in revenue to $1,337 million for the period. FFO growth was strong at 18.2 per cent and statutory profit decreased marginally to $684 million in the half year ended 31 December primarily due to lower finance income which included a $126 million fair value gain on mark to market of derivatives and financial instruments in 1H17. The adjustments excluded from FFO include valuation movements on investment property, primarily due to rental growth and capitalisation rate compression across our Logistics and Business Parks, Office portfolios, valuation uplift from our retail town centre redevelopment at Green Hills (NSW), price growth for Retirement Living dwellings and movements in derivative and financial instrument market values compared to book value. The net gain on other financial assets relates primarily to the gain resulting from the $25 million return of capital received from our investment in BGP Holdings which is excluded from FFO as a one off item. The net income tax benefit in the current year is due to the recognition of previously unbooked tax losses, resulting in an increase in our deferred tax assets. Interim Financial Report
12 Directors Report Half year ended 31 December Capital management Financial position We maintained our focus on prudent balance sheet management, including using diverse funding sources throughout the half year. During the current period repaid USD 40 million ($61 million) of notes that were issued in the US private placement market. In January 2018 new US private placement notes equivalent to $286 million were issued with tranches of between 10 and 15 years. The new notes were issued at a competitive rate and demonstrate continued strong support from debt investors and acknowledgement of our robust credit profile. Our gearing level increased marginally to 23.0 per cent at 31 December (June : 22.7 per cent), as continued reinvestment into our businesses during the half year was partially funded by an increase in drawn debt. Gearing remains within our target range of per cent and we continue to retain our A-/Stable credit rating from S&P and A3 rating from Moody s (equivalent to S&P s A-). We manage our exposure to financial markets, including movements in foreign exchange rates and interest rates, through the use of derivative financial instruments in order to provide greater certainty over future financing costs, taking advantage in particular of the current historically low interest rate environment. The fixed/hedged ratio represents the proportion of debt that has a fixed interest rate based on drawn debt at 31 December. In line with our expectations, the fixed/hedge ratio was 100 per cent at 31 December (June : 109 per cent) as we increased our drawn debt position and managed the amount of fixed debt used. The weighted average cost of debt for the period has decreased to 5.3 per cent (June : 5.5 per cent) as we focus on new lower cost debt and older, higher cost hedges continue to expire. Interest cover has increased to 5.1:1 (June : 4.8:1) due to stronger underlying earnings from the Residential business. Balance Sheet December June Change % Cash and cash equivalents % Real estate assets 3 : Commercial Property 10,537 10, % Residential 3,373 2, % Retirement Living 4,075 3, % Other assets % Total assets 18,867 17,495 Interest bearing loans and borrowings 3,794 3, % Retirement Living resident obligations 2,693 2, % Other liabilities 2,040 1, % Total liabilities 8,527 7,568 Net assets/total equity 10,340 9,927 The Commercial Property investment portfolio has increased by $282 million to $10,537 million primarily due to net valuation uplift (up $124 million including equity-accounted investments) and capital and development expenditure of $225 million, partially offset by the $69 million disposal of Corrimal (NSW). The Retail Town Centre portfolio valuation increase was driven by the $47 million revaluation of the development of Green Hills (NSW), which is now more than 75 per cent complete. Some centres declined in value post tenant remixing. Our Logistics and Business Parks and Office portfolios delivered valuation gains of $47 million and $34 million respectively during the period driven by rental growth and continued capitalisation rate compression across several assets. Valuation gains across the portfolio saw our weighted average capitalisation rate reduce marginally from 6.2 per cent to 6.1 per cent. The increase in capital and development expenditure reflects the continued investment in the Retail Town Centre and Logistics and Business Park development pipeline including the $414 million redevelopment of Green Hills (NSW). 3 Includes non-current assets held for sale, inventories, investment properties, equity-accounted investments and certain other assets. Interim Financial Report
13 Directors Report Half year ended 31 December Residential assets, which represent mainly land under development, increased to $3,373 million at 31 December as we successfully re-stocked our portfolio through land acquisitions including land previously acquired on capital efficient terms settled during the period. Furthermore, we made new capital efficient acquisitions through put and call options, whereby an asset is recognised at 31 December with a corresponding liability included within other liabilities, relating to future payments for this land. We maintained a disciplined approach to development expenditure and finished goods levels remain appropriate. Excluding acquisitions, the underlying asset value of Residential has fallen, because of the significant settlements recorded during the period. The value of the Retirement Living real estate related assets, net of resident obligations, was $1,382 million, an increase of $163 million from June. This primarily reflects capital expenditure on the development pipeline at Birtinya (Qld), The Residences - Cardinal Freeman (NSW) and Willowdale (NSW), fair value uplift on the Retirement Living portfolio, partly offset by an increase in resident loan obligations created on first sales of development units. Total debt increased by $265 million to $3,794 million at 31 December as a result of increased operating activity during the half year funded by the drawing down of bank debt, offset by the maturity of USD 40 million ($61 million) in US Private Placement notes, and includes the fair value movements on the debt. Cash flows Half year ended 31 December 2016 Change % Operating cash flows (excluding payments for land) % Payments for land (392) (70) 460.0% Investing cash flows (286) (174) 64.4% Financing cash flows 44 (67) 165.7% Net change in cash and cash equivalents (64) % Cash and cash equivalents at the end of the period % Net operating cash inflows (excluding payments for land) increased primarily as a result of a $144 million increase in property development sales, driven by an additional 357 residential lots settled compared to the prior corresponding period. In addition, $60 million was received relating to deferred settlements. Payments for land have increased significantly driven by deferred settlement payments for acquisitions made in previous periods and a number of payments relating to strategic acquisitions during the current period to restock our portfolio, with 7,000 new lots acquired in Sydney and Perth. Net cash outflows from investing activities have increased significantly against 1H17, driven mainly by development expenditure of $198 million (1H17: $98 million) and capital expenditure of $57 million (1H17: $80 million) across our Commercial Property assets. Similarly, development expenditure and capital expenditure within the Retirement Living business has increased to $67 million (1H17: $53 million) and $24 million (1H17: $7 million) respectively. This is due to the timing and mix of projects this half. On a full year basis investing cash flows are expected to be consistent with prior year. Net financing cash inflows reflect the net proceeds from borrowings to fund acquisitions and development expenditure, offset by dividends and distributions paid during the period. The improvement is mainly due to the net increase in bank debt drawn. Equity Dividend/distribution reinvestment plan (DRP) On 21 February 2018 we announced the suspension of the Distribution Reinvestment Plan (DRP) in respect of the half year distribution for the six months ended 31 December. The proposed DRP issue price of stapled securities announced on 16 February 2018 of $4.03 is below the Group s net tangible assets per security at 31 December of $4.18, and significantly below the closing price of $4.74 on 14 December, the day the operation of the DRP was announced. As a result, the Directors have formed the view that some securityholders may be disadvantaged if the issue were to proceed. The Group has sufficient capital to maintain its development and investment activity. Interim Financial Report
14 Directors Report Half year ended 31 December Distributions The dividend and distribution payable for the half year ended 31 December is 13.0 cents per security, with a forecast full year distribution of 26.5 cents for the year to 30 June 2018, assuming no material change in market conditions. Our distribution policy is to pay the higher of 100 per cent of Trust taxable income or per cent of FFO. The distribution for the half year comprises: 1H18 Cents 1H17 Cents Corporation dividend, fully franked Trust distribution Total dividend/distribution Registers closed at 5.00pm on 29 December to determine entitlement to the interim dividend/distribution, which will be paid on 28 February Business unit performance and priorities Commercial Property Our Commercial Property business comprises retail town centres, logistics and business parks, and office assets. We are one of the largest retail property owners, developers and managers in Australia. Our 40 retail town centres accommodate more than 3,500 retailers. The Logistics and Business Parks portfolio comprises 27 properties, with 1.4 million square metres of building area. These properties are strategically positioned in key locations for logistics, infrastructure and employment. The Office portfolio comprises eight assets, mostly in Sydney. Portfolio at 31 December Approximate value* 40 retail town centres $7.2 billion 27 logistics and business parks $2.1 billion 8 office buildings $0.9 billion 75 Commercial Property assets $10.2 billion * s ownership interest excluding capital works in progress and sundry properties. Funds from operations Commercial Property (, unless otherwise stated) 1H18 1H17 Change Comparable growth Retail Town Centres % 2.7% Logistics and Business Parks % 4.6% Office % 2.8% Trading profit 1 5 Net overheads (8) (6) Total Commercial Property % 2.6% ROA 7.7% 8.2% Our Commercial Property business continues to deliver solid profit with comparable FFO up 2.6 per cent across the portfolio. We expect our Commercial Property business to maintain moderate growth in returns with comparable FFO growth of 2 3 per cent impacted by higher outgoings and non-sydney office vacancy. Across our Commercial Property portfolio, revaluations produced a net uplift of $124 million for the half year including good gains from several of our recently redeveloped assets, however we have also seen valuation declines at some retail town centres post tenant remixing. Interim Financial Report
15 Directors Report Half year ended 31 December Retail Town Centres The retail environment remains subdued, however across our portfolio of retail town centres in 1H18 we have delivered positive FFO growth of 1.1 per cent and maintained high occupancy with an intense focus on upgrading and remixing our centres in line with customer preferences. Overall, we continue to achieve positive growth in rents for both new leases +1.4 per cent and renewals +2.3 per cent, with a strong focus on the sustainability of our tenants occupancy costs. The priority of our remixing strategy is to future proof the portfolio through increasing services, lifestyle, health, dining and entertainment uses to address customer demand and increase the resilience of our centres. Close to 90 per cent of our Retail Town Centre portfolio comprises centres that lead their catchment area or are mixed use, CBD, or community neighbourhood centres. The integration between the digital and the physical remains a priority for our customers and tenants so technology and digital enhancements, along with upgrading wayfinding, carparking, and communal spaces remains a focus not only to ensure a high quality customer experience, but attract a broader range of tenants and partners. Following a flat start to the half year, retail sales growth for the second quarter improved to 2 per cent, returning the comparable MAT to positive growth. Growth in specialty retail sales of 10.0 per cent in retail services and 2.8 per cent in casual dining and food catering over the half reflects the success of our remixing strategy. Our focused asset management and development activity continues to ensure our town centres are the heart of their communities. In addition to the $414 million redevelopment nearing completion at Green Hills (NSW) and our extensive pipeline of greenfield town centres in our masterplanned communities business, we currently have 20 smaller upgrade and remixing projects underway or recently completed. Our holistic approach to community creation is enhancing our reputation for providing high quality communities and customer experiences for our residential and retirement living customers. The early delivery of retail amenities to our customers is key to providing desirable, liveable communities, and enhanced profit returns over the longer term. Our Birtinya town centre is currently under construction within our Oceanside (Qld) masterplanned community and a number of new retail town centres are in planning. Since the stage two opening of our major Green Hills (NSW) development in November, we have seen record trading and traffic and overwhelmingly positive feedback from customers, tenants and investors. We look forward to the official centre opening on 22 March 2018, followed by the final international mini major and HOYTS theatre complex by the end of June Following the sale of the Corrimal (NSW) shopping centre, we continue to take a considered approach to non-core asset disposals and remain focused on introducing third party capital across our assets. This quarter we will place Highlands on the market and as announced in August we are aiming to divest $300 million of retail town centres over the next 12 to 18 months, of which approximately $70 million has completed to date. Retail Town Centre strategic priorities The Retail Town Centre business maintains its focus on creating market leading town centres, redeveloping our most productive assets to create community and entertainment hubs and maximise trade area market share. We have $537 million at cost, of retail town centre development under construction and a future pipeline of $530 million, targeting incremental IRRs 4 of 9 plus per cent and stabilised FFO yields of 7 plus per cent from this activity. Our retail town centre mix continues to evolve, underpinned by supermarkets, mini majors, food catering, fast casual dining, speciality food, theatre, targeted apparel, health and retail services. We will continue to focus on tailoring our offering to each specific trade area, cultivating retailer relationships and long-term sustainable rent, and invest in industry research and technology to adapt to an evolving retail landscape. Logistics and Business Parks Our Logistics and Business Parks business has once again delivered strong results with comparable FFO up 4.6 per cent on the previous corresponding period. We remain on track with our strategy to continue growing this segment, with a target of increasing its weighting within the portfolio to 20 per cent. Occupancy remains at 99 per cent and we have achieved a number of development milestones including the recent submission of a development application to transform one of our Macquarie Park (NSW) assets into an advanced technology and innovation precinct. We currently have $176 million of projects under construction and an additional development pipeline of over $590 million targeting 7 per cent yields and focused on the eastern seaboard capital cities. Upgrading existing, 4 Unlevered 10 year IRR on incremental development from completion. Interim Financial Report
16 Directors Report Half year ended 31 December well located estates has proven extremely successful with the transformation of our Hendra facility (Qld) which resulted in a tightening in capitalisation rate from 8.25 to 7.75 per cent evidence of this strategy. We undertook similar work at our Oakleigh facility (Vic), which resulted in a tightening of capitalisation rates from 9.25 per cent to 6.25 per cent and improved the WALE to 5.3 years. We have new facilities under construction at Warwick Farm in Sydney (NSW), which is more than two thirds preleased to Daikin, Ingleburn and Yennora in Sydney (NSW) and at our masterplanned community, Aura (Qld). The value of our Logistics and Business Parks business has risen around $600 million over the past four years, from $1.5 billion to $2.1 billion, and now represents 14 per cent of our total Group asset value. Logistics and Business Parks strategic priorities Our focus is on growing and developing a market leading portfolio of logistics centres and business parks by leveraging our existing assets and land, strong tenant relationships and asset management skills to become a scale player in this market. Office Comparable FFO for the period was down 2.8 per cent, largely due to higher vacancies in Perth and the ACT, however these assets are progressively being leased. Our Sydney office portfolio, which represents the majority of office assets, performed well this period. We continue to assess development opportunities for our Sydney assets, a number of which have higher and better use options and will consider divestment opportunities for optimised assets. Office strategic priorities In Office we continue to focus on optimising returns. We intend to retain the majority of our residual office portfolio (strongly weighted to Sydney) while we maximise returns and assess development opportunities over time. Joint ventures (or part sales) will also be considered as appropriate. Residential is the largest residential land developer in Australia. The business has 58 communities across New South Wales, Queensland, Victoria and Western Australia. We are focused on delivering a range of masterplanned communities and medium density housing in growth areas across the country. We hold 85,000 lots in our portfolio, with a total end value of approximately $22.8 billion 5. Performance Residential Communities (, unless otherwise stated) 1H18 1H17 Change Total lots settled (lots) 3,210 2, % Total revenue % including superlot revenue % EBIT (before interest in COGS) % EBIT margin 26.7% 24.8% Operating profit (FFO) % Operating profit margin 20.9% 14.1% ROA total portfolio 22.5% 11.6% ROA core portfolio % 19.2% Our Residential business delivered exceptionally strong returns and settlements over the half. Operating profit grew over 80 per cent to $182 million in 1H18. We settled a record 3,210 lots, up 12.5 per cent on the corresponding period, and achieved a net operating profit margin of 20.9 per cent. We have intentionally increased our weighting to Sydney and Melbourne housing where the markets continue to be driven by structural undersupply. We expect the Queensland market to benefit from interstate migration and reasonable jobs growth and the Perth market to remain relatively flat in the short term as economic indicators continue to stabilise. Whilst changed macroprudential measures have seen a moderation in interest levels from offshore buyers and some investors over the past year, interest from owner occupiers and first home buyers has increased, with the 5 Excluding value on projects identified for disposal and assuming no material change in market conditions. 6 Core excludes workout projects. Interim Financial Report
17 Directors Report Half year ended 31 December Real Estate Institute of Australia recently announcing that the number of home loans to first home buyers is at its highest level since Around half of our residential customers are first home buyers and more than 75 per cent are owner occupiers, which places us in a preferred position in the current residential lending and regulatory environment. We launched our new project at Mt. Atkinson in Melbourne to record demand and strong pre-sales and we have a further four project launches in the second half of FY18, with initial releases planned for Truganina and Waterlea in Melbourne (Vic), and Paradise Waters in Brisbane (Qld). In December, we entered a conditional agreement to purchase 184 hectares of land for $398 million in Marsden Park (NSW), the heart of Sydney s strong north west growth centre and adjacent to one of our most successful projects, Elara. We also took a counter-cyclical opportunity to purchase three sites in Perth, on capital efficient terms, for medium to long term development. More than 95 per cent of our residential business earnings over FY18 FY20 will be generated by our masterplanned communities, and we continue to progress our disciplined re-entry into the apartment market. In line with guidance, approximately 6,500 residential settlements are expected for FY18. Operating profit margins are forecast at around 17 per cent in FY18 and for the next two to three years, subject to no material change in market conditions. Residential strategic priorities The Residential business is making good progress on its plans to make the portfolio more resilient and profitable in the future by continuing to focus on: (1) reshaping the portfolio actively manage the portfolio to improve returns and achieve and maintain an optimal pipeline with a preference to acquire land on capital efficient terms. (2) broaden our market reach increase revenue by creating a better community value proposition that drives high customer referrals and broaden market reach through a medium density/built form offering. (3) improving efficiency continue to manage costs and innovate to improve project delivery. Retirement Living is a top three retirement living operator within Australia, with over 9,600 established units in 65 established villages across five states and the ACT. The portfolio includes a development pipeline of over 3,100 units. Performance Retirement Living (, unless otherwise stated) 1H18 1H17 Change EBIT % Operating profit (FFO) % Occupancy 94.7% 94.6% Cash ROA 5.3% 6.4% Established Established settlements (units) % Withheld settlements (units) 23 9 Total sales volumes (units) % Average re-sale price $347k $325k 6.8% Turnover cash margin 26.2% 26.9% Reservations on hand (units) % Development Average price per unit $469k $449k 4.5% Average margin excludes DMF 19.5% 18.0% Development settlements (units) % Reservations on hand (units) % Interim Financial Report
18 Directors Report Half year ended 31 December Operating profit in Retirement Living was $18 million, down 29.7 per cent on the corresponding period. The Retirement Living business continues to be supported by the fundamentals of an ageing population, which continues to underpin this business segment. However, sales at both existing villages and new developments over the half have been affected by the increased media attention on the sector, which has influenced customer confidence. Sales over the period were also affected by lower volumes of new development stock due to project timing. During the half we completed 28 development units, compared to 80 in the prior period, resulting in lower development volumes available for reservation. The population of over 65s segment is growing at almost twice the rate of the rest of Australia and we expect market demand in this sector to continue to rise as the population ages. Our repositioning strategy and development pipeline reflects the changing preferences of retirees and our new contract choices and product offerings will continue to broaden our customer reach. At our new Retirement Living developments we continue to see growth in the average price per unit, at 4.5 per cent for the period, reflecting the quality of our villages. Resident satisfaction levels consistently rate above 84 per cent, and in response to customer preferences we have an increased focus on health and wellbeing. We are also partnering with service providers to assist our residents and pursuing development opportunities with aged care providers to deliver on-site continuity of care. We are looking forward to a number of new development launches this half, including the next stage of our very successful The Residences - Cardinal Freeman project in Sydney (NSW), and have commenced construction of our new village at Newport in Brisbane (Qld). We also entered into a long term development lease at Epping, Sydney, that will ultimately deliver 200 retirement living apartments integrated with 130 aged care units. We continue to focus on service and facility enhancements and seek opportunities to divest non-core retirement living assets. We expect 1H18 retirement living market conditions to continue into 2H18. Retirement Living strategic priorities The business remains focused on being a preferred operator and developer of retirement living villages. The business has a clear strategy to continue to improve its ROA by: (1) differentiating the customer experience through access to a range of resident care and other services; (2) actively managing the portfolio; and (3) growing development volumes. Interim Financial Report
19 Directors Report Half year ended 31 December Directors The Directors of the Company and of the Responsible Entity at any time during or since the end of the half year (collectively referred to as the Directors) were: Non-Executive Directors Mr Tom Pockett Chairman Ms Carolyn Hewson Mr Barry Neil Mr Stephen Newton Dr Nora Scheinkestel Ms Carol Schwartz Mr Andrew Stevens (appointed 1 July ) Executive Director Mr Mark Steinert Managing Director and Chief Executive Officer Lead auditor s independence declaration under section 307C of the Corporations Act 2001 The lead auditor s independence declaration is set out on page 17 and forms part of the Directors Report for the half year ended 31 December. Rounding off is an entity of the kind referred to in ASIC Corporations (Rounding in Financial/Directors Reports) Instrument 2016/191 and in accordance with that Instrument, amounts in the Financial Report and Directors Report have been rounded to the nearest million dollars, unless otherwise stated. Signed in accordance with a resolution of the Directors: Tom Pockett Chairman Mark Steinert Managing Director Dated at Sydney, 21 February 2018 Interim Financial Report
20 Lead Auditor s Independence Declaration under Section 307C of the Corporations Act 2001 Half year ended 31 December Auditor s Independence Declaration As lead auditor for the review of Corporation Limited and Trust for the half-year ended 31 December, I declare that to the best of my knowledge and belief, there have been: (a) no contraventions of the auditor independence requirements of the Corporations Act 2001 in relation to the review; and (b) no contraventions of any applicable code of professional conduct in relation to the review. This declaration is in respect of Corporation Limited and the entities it controlled during the period and Trust and the entities it controlled during the period. S J Hadfield Sydney Partner 21 February 2018 PricewaterhouseCoopers PricewaterhouseCoopers, ABN One International Towers Sydney, Watermans Quay, Barangaroo, GPO BOX 2650, SYDNEY NSW 2001 T: , F: , Level 11, 1PSQ, 169 Macquarie Street, Parramatta NSW 2150, PO Box 1155 Parramatta NSW 2124 T: , F: , Liability limited by a scheme approved under Professional Standards Legislation. Interim Financial Report
21 Consolidated Statements of Profit or Loss and Other Int eri mfi nancialstatements Comprehensive Income Half year ended 31 December Half year ended 31 December Section Revenue B1 1,337 1, Cost of property developments sold: land and development (595) (556) capitalised interest (57) (76) utilisation of provision for impairment of inventories Investment property expenses (131) (123) (125) (118) Share of profits of equity-accounted investments E Management, administration, marketing and selling expenses (142) (143) (17) (20) Net change in fair value of investment properties: Commercial Property C1b Retirement Living B2c Net change in fair value of Retirement Living resident obligations B2c (72) (37) Net gain on other financial assets D3 26 Net loss on sale of other non-current assets (2) (2) (2) Finance income D Finance expense D1 (37) (42) (91) (96) Profit before income tax Income tax benefit B3a Profit for the period Items that are or may be reclassified to profit or loss, net of tax Available for sale financial assets net change in fair value D3a 2 64 Available for sale financial assets reclassified to profit or loss D3a (17) Cash flow hedges net change in fair value of effective portion 6 (10) 6 (10) Cash flow hedges reclassified to profit or loss (1) (1) (1) (1) Other comprehensive income, net of tax (10) 53 5 (11) Total comprehensive income for the period Basic earnings per security (cents) F Diluted earnings per security (cents) F The above Consolidated Statements of Profit or Loss and Other Comprehensive Income should be read in conjunction with the accompanying notes Trust 2016 Interim Financial Report
22 Consolidated Balance Sheets Interim Financial Statement s As at 31 December Current assets Section 31 December 30 June Trust 31 December 30 June Cash and cash equivalents Trade and other receivables Inventories C1a Other financial assets D3, D4 23 Other assets ,261 1, Non-current assets held for sale C1d Total current assets 1,261 1, Non-current assets Trade and other receivables ,445 3,252 Inventories C1a 2,507 1,725 Investment properties Commercial Property C1b 9,647 9,285 9,537 9,186 Investment properties Retirement Living C1c 4,031 3,824 Equity-accounted investments E Other financial assets D3, D Property, plant and equipment Intangible assets Deferred tax assets B3b Other assets Total non-current assets 17,606 16,172 13,969 13,442 Total assets 18,867 17,495 14,160 13,721 Current liabilities Trade and other payables Interest-bearing loans and borrowings D Retirement Living resident obligations C1c 2,518 2,444 Development provisions Other financial liabilities D Other liabilities Total current liabilities 4,230 3,778 1, Non-current liabilities Trade and other payables Interest-bearing loans and borrowings D2 3,352 3,262 3,352 3,262 Retirement Living resident obligations C1c Development provisions Other financial liabilities D Other liabilities Total non-current liabilities 4,297 3,790 3,519 3,465 Total liabilities 8,527 7,568 4,533 4,234 Net assets 10,340 9,927 9,627 9,487 Securityholders equity Issued capital D5 8,849 8,790 7,537 7,480 Reserves Retained earnings/undistributed income 1,412 1,044 2,014 1,932 Total securityholders equity 10,340 9,927 9,627 9,487 The above Consolidated Balance Sheets should be read in conjunction with the accompanying notes. Interim Financial Report
23 Consolidated Statements of Changes in Equity Interim Financial Statements Half year ended 31 December Attributable to securityholders of Section Issued capital Executive remuneration Reserves Cash flow hedge Fair value Retained earnings Total equity Opening balance as at 1 July , ,254 Profit for the period Other comprehensive income, net of tax (11) Total comprehensive income for the (11) period Dividends and distributions D6 (303) (303) Securities issued under DRP D5a Expense relating to Share Plans, net of tax 9 9 Acquisition of treasury securities D5b (16) (16) Securities vested under Share Plans D5b 9 (9) Total of other movements 56 (303) (247) Balance as at 31 December , ,762 Opening balance as at 1 July 8, ,044 9,927 Profit for the period Other comprehensive income, net of tax 5 (15) (10) Total comprehensive income for the 5 (15) period Dividends and distributions D6 (316) (316) Securities issued under DRP D5a Expense relating to Share Plans, net of tax 8 8 Acquisition of treasury securities D5b (20) (20) Securities vested under Share Plans D5b 12 (12) Total of other movements 59 (4) (316) (261) Balance as at 31 December 8, ,412 10,340 The above Consolidated Statements of Changes in Equity should be read in conjunction with the accompanying notes. Interim Financial Report
24 Consolidated Statements of Changes in Equity Half year ended 31 December Attributable to securityholders of Trust Section Issued capital Reserves Executive remuneration Cash flow hedge Undistributed income Total equity Opening balance as at 1 July , ,575 9,052 Profit for the period Other comprehensive income (11) (11) Total comprehensive income for the period (11) Distributions D6 (303) (303) Securities issued under DRP D5a Expense relating to Share Plans, net of tax 9 9 Acquisition of treasury securities D5b (16) (16) Securities vested under Share Plans D5b 9 (9) Total of other movements 55 (303) (248) Balance as at 31 December , ,859 9,380 Opening balance as at 1 July 7, ,932 9,487 Profit for the period Other comprehensive income 5 5 Total comprehensive income for the period Distributions D6 (316) (316) Securities issued under DRP D5a Expense relating to Share Plans, net of tax 8 8 Acquisition of treasury securities D5b (19) (19) Securities vested under Share Plans D5b 12 (12) Total of other movements 57 (4) (316) (263) Balance as at 31 December 7, ,014 9,627 The above Consolidated Statements of Changes in Equity should be read in conjunction with the accompanying notes. Interim Financial Report
25 Consolidated Cash Flow Statements Interim Financial Statements Half year ended 31 December Half year ended 31 December Cash flows from operating activities Section Cash receipts in the course of operations (including GST) 1,510 1, Cash payments in the course of operations (including GST) (900) (924) (175) (197) Payments for land (392) (70) Distributions received from equity-accounted investments Receipts from Retirement Living residents Payments to Retirement Living residents, net of DMF (74) (78) Interest received Interest paid (98) (102) (98) (102) Net cash inflows from operating activities F2a Cash flows from investing activities Proceeds from sale of investment properties Payments for and development of investment properties: Commercial Property (262) (186) (280) (221) Retirement Living (96) (60) Payments for plant and equipment and software (32) (19) Proceeds from sale of/(capital returns from) investments (1) Payments for investments, including equity-accounted investments 2016 Trust 2016 (1) Net cash outflows from investing activities (286) (174) (212) (150) Cash flows from financing activities Payments for securities under Share Plans D5b (20) (16) (19) (16) Proceeds from borrowings F2b Repayments of borrowings F2b (681) (688) (681) (688) Loans to related entities (184) (10) Dividends and distributions paid (net of DRP) (245) (231) (245) (231) Net cash inflows/(outflows) from financing activities 44 (67) (139) (77) Net (decrease)/increase in cash and cash equivalents (64) 74 (36) 68 Cash and cash equivalents at the beginning of the period Cash and cash equivalents at the end of the period The above Consolidated Cash Flow Statements should be read in conjunction with the accompanying notes. Interim Financial Report
26 Consolidated Notes Interim Financial Statements Half year ended 31 December (A) Basis of preparation 24 (B) Results for the period 26 (B1) Revenue 26 (B2) Operating segments 26 (B3) Taxation 31 (C) Operating assets and liabilities 32 (C1) Real estate assets and liabilities 32 (D) Capital structure and financing costs 39 (D1) Net financing costs 39 (D2) Interest-bearing loans and borrowings 40 (D3) Other financial assets and liabilities 42 (D4) Fair value hierarchy 42 (D5) Issued capital 45 (D6) Dividends and distributions 46 (E) Group structure 47 (E1) Equity-accounted investments 47 (F) Other items 48 (F1) Earnings per security (EPS) 48 (F2) Notes to Consolidated Cash Flow Statements 49 (F3) Contingent liabilities 50 (F4) Commitments 50 (F5) Related party disclosures 50 (F6) Events subsequent to the end of the period 50 Interim Financial Report
27 Consolidated Notes Half year ended 31 December (A) Basis of preparation IN THIS SECTION This section sets out the basis upon which the Group s financial statements are prepared as a whole. All specific accounting policies applied by and the Trust in the interim financial statements are the same as those applied in the annual financial statements as at and for the year ended 30 June. A glossary containing acronyms and defined terms is included at the back of this Report. represents the consolidation of Corporation Limited and its controlled entities and Trust and its controlled entities. Corporation Limited and Trust are both for-profit entities that were incorporated or formed and are domiciled in Australia. is structured as a stapled entity: a combination of a share in Corporation and a unit in Trust that are together traded as one security on the Australian Securities Exchange. The constitutions of Corporation Limited and Trust provide that, for so long as the two entities remain jointly quoted, the number of shares in Corporation Limited and the number of units in Trust shall be equal and that the shareholders and unitholders be identical. Both Corporation Limited and the Responsible Entity of Trust must at all times act in the best interest of. The stapling arrangement will cease upon the earlier of either the winding up of Corporation Limited or Trust or either entity terminating the stapling arrangement. The Interim Financial Report as at and for the half year ended 31 December was authorised for issue by the Directors on 21 February (i) Statement of compliance The Interim Financial Report has been prepared in accordance with AASB 134 Interim Financial Reporting and the Corporations Act The Interim Financial Report does not include all of the information required for full annual financial statements, and should be read in conjunction with the annual financial statements of as at and for the year ended 30 June. (ii) Basis of preparation As permitted by Class Order 13/1050, issued by ASIC, these financial statements are combined financial statements that present the financial statements and accompanying notes of both and the Trust. The financial statements are presented in Australian dollars, which is Corporation Limited s and Trust s functional currency and the functional currency of the majority of and the Trust. The financial statements have been prepared on a going concern basis using historical cost conventions, except for investment properties (including non-current assets held for sale), derivative financial instruments and certain financial assets and liabilities which are stated at their fair value. In accordance with ASIC Corporations (Rounding in Financial/Directors Reports) Instrument 2016/191, amounts in the Interim Financial Report have been rounded to the nearest million dollars, unless otherwise stated. Certain comparative amounts have been restated to conform with the current period s presentation. Interim Financial Report
28 Consolidated Notes Half year ended 31 December (ii) Basis of preparation (continued) and Trust net current asset deficiency position and the Trust have a net current asset deficiency at 31 December. Based on the profits and net cash inflows from operating activities in the period and the forecast for the next 12 months, and the Trust will be able to pay their debts as and when they become due and payable. Undrawn bank facilities of $420 million (refer to section D2c) are also available should they need to be drawn down. In relation to, a number of liabilities are classified as current under Accounting Standards that are not expected to result in actual net cash outflows within the next 12 months (in particular Retirement Living resident obligations). Similarly, some assets held as non-current will generate cash income in the next 12 months (including Retirement Living DMF included within Retirement Living investment properties, development work in progress and vacant stock). In addition, current inventories are held on the balance sheet at the lower of cost and net realisable value, whereas some of these are expected to generate cash inflows above the carrying value. In relation to current Retirement Living resident obligations for existing residents (December : $2,512 million; June : $2,439 million), approximately 7% of residents are estimated to depart their dwelling each year and therefore it is not expected that the majority of the obligations to residents will fall due within one year. In the vast majority of transactions involving the turnover of units, the resident obligations will be repaid from receipts from incoming residents. However, resident obligations are classified as current under the definitions in the Accounting Standards as there is no unconditional contractual right to defer settlement for at least 12 months (residents may give notice of their intention to vacate their unit with immediate effect). In contrast, the corresponding Retirement Living assets are classified as non-current under the Accounting Standards as the majority are not expected to be realised within 12 months. The deficiency in the Trust primarily arises due to the requirement under the Accounting Standards to classify the at call intergroup loan receivable from the Company as a non-current asset. (iii) Critical accounting estimates and judgements The preparation of interim financial statements requires management to make judgements, estimates and assumptions that affect the application of accounting policies and the reported amount of assets and liabilities. The significant judgements made by management in applying the Group s accounting policies and the key sources of estimation uncertainty were the same as those applied to the annual financial statements as at and for the year ended 30 June. (iv) New and amended Accounting Standards The accounting policies applied in these interim financial statements are the same as those applied in the Group s financial statements as at and for the year ended 30 June. There have been no new or revised accounting standards or interpretations which are effective from the periods beginning on or after 1 July that impact the interim financial statements. Certain new accounting standards and interpretations have been published that are not mandatory for the half year ended 31 December. The Group s assessment of the impact of these new standards and interpretations was disclosed in the 30 June annual financial statements. At 31 December, there are no significant changes based on the Group s ongoing assessment. While the Group does not expect the impact of these changes to be material, it is not practical to disclose the financial impact until the assessment is further advanced. The Group expects to disclose quantitative information in the 30 June 2018 annual financial statements. Interim Financial Report
29 Consolidated Notes Half year ended 31 December (B) Results for the period IN THIS SECTION This section explains the results and performance of the Group. This section provides additional information about those individual line items in the financial statements that the Directors consider most relevant in the context of the operations of the entity, including: accounting policies that are relevant for understanding the items recognised in the financial statements; and analysis of the result for the period by reference to key areas, including revenue, results by operating segment and taxation. (B1) Revenue Revenue recognised in statutory profit during the period is set out below: Half year ended 31 December Property development sales Rent from investment properties DMF revenue Other revenue Total revenue 1,337 1, Rent from investment properties includes $2 million (December 2016: $3 million) contingent rents billed to tenants. Contingent rents are derived from the tenants revenues and represent 1% (December 2016: 1%) of gross lease income. (B2) Operating segments 2016 Trust 2016 KEEPING IT SIMPLE This section shows a reconciliation from FFO to statutory profit. FFO is the Group s key profit measure, which reflects the way the business is managed and how the Executive Director and Executive Committee assess performance. FFO is a non-ifrs measure that is designed to present, in the opinion of the Chief Operating Decision Makers (CODM), the results from ongoing operating activities in a way that appropriately reflects the Group s underlying performance. FFO is the basis on which dividends and distributions are determined and reflects the way the business is managed and how the CODM assess the performance of the Group. It excludes costs of a capital nature and profit or loss made from realised transactions occurring infrequently and those that are outside the course of s core ongoing business activities. FFO also excludes income tax items that do not represent cash payments. Profit or loss items excluded from FFO are outlined and explained in section B2b. Operating segments are reported in a manner that is consistent with the internal reporting provided to the Executive Director and the Executive Committee, who are the CODM. has four reportable segments, as listed below: Commercial Property invests in, develops and manages retail town centre, logistic and business park and office properties; Residential delivers a range of masterplanned and mixed use residential communities in growth areas and townhouses and apartments in general metropolitan areas; Retirement Living designs, develops and manages communities for retirees; and Other dividends/distributions from strategic investments and other items which are not able to be classified within any of the other defined segments. Interim Financial Report
30 Consolidated Notes Half year ended 31 December (B2) Operating segments (continued) The Trust has one reportable segment in which it operates, being Commercial Property, therefore no separate segment note has been prepared. There is no customer who accounts for more than 10% of the gross revenues of or the Trust. (B2a) Funds from operations (FFO) The following table shows the contribution to FFO by each reportable segment: Half year ended 31 December Commercial Property Residential Retirement Living Other Consolidated External segment revenue ,346 Total external segment revenue ,346 Segment EBIT 275 1, Amortisation of lease incentives and fees Straight-line rent adjustments (2) (2) Interest expense in cost of sales (7) (50) (57) Segment FFO Interest income 1 Interest expense Unallocated corporate and other expenses (30) FFO for the period 436 (37) Half year ended 31 December 2016 Commercial Property Residential Retirement Living Other Consolidated External segment revenue ,182 Total external segment revenue ,182 Segment EBIT 280 1, Amortisation of lease incentives and fees Straight-line rent adjustments (3) (3) Interest expense in cost of sales (76) (2) (78) Segment FFO Interest income 2 Interest expense (42) Unallocated corporate and other expenses (29) FFO for the period External segment revenue adds back $29 million (December 2016: $29 million) of amortisation of lease incentives and excludes $2 million (December 2016: $3 million) of straight-line rent adjustments. 2 External segment revenue and segment EBIT exclude $18 million (December 2016: $13 million) of unrealised DMF revenue. 3 Segment FFO includes share of profits from equity-accounted investments of $15 million (December 2016: $15 million) in Commercial Property. Interim Financial Report
31 Consolidated Notes Half year ended 31 December (B2b) Reconciliation of FFO to statutory profit FFO excludes adjustments such as unrealised fair value gains/losses, realised transactions occurring infrequently and those that are outside the course of the Group s core ongoing business activities Half year ended 31 December Note FFO Statutory adjustments Statutory results FFO Statutory adjustments Statutory results Revenue A, B 1,346 (9) 1,337 1,182 (13) 1,169 Cost of property developments sold: land and development (595) (595) (556) (556) capitalised interest (57) (57) (76) (76) utilisation of provision for impairment of inventories Investment property expenses C (124) (7) (131) (117) (6) (123) Share of profits of equity-accounted D 15 (3) investments Management, administration, marketing and selling expenses (142) (142) (143) (143) Net change in fair value of investment properties: Commercial Property D Retirement Living E Net change in fair value of Retirement E (72) (72) (37) (37) Living resident obligations Net gain on other financial assets Net loss on sale of other non-current assets (2) (2) (2) (2) Finance income F Finance expense F (37) (37) (42) (42) Profit before income tax Income tax benefit G Profit for the period Trust 2016 Half year ended 31 December Note FFO Statutory adjustments Statutory results FFO Statutory adjustments Statutory results Revenue B 412 (27) (26) 383 Investment property expenses C (119) (6) (125) (112) (6) (118) Share of profits of equity-accounted D 15 (3) investments Management, administration, marketing (17) (17) (20) (20) and selling expenses Net change in fair value of Commercial D Property Net loss on other financial assets (2) (2) Finance income F Finance expense F (91) (91) (96) (96) Profit before income tax Income tax benefit/(expense) Profit for the period Explanation of statutory adjustments ( and Trust) A DMF revenue of $18 million (December 2016: $13 million) has been excluded from FFO until it is realised in cash. Refer to section B2c. B Straight-line rent adjustments $2 million (December 2016: $3 million) are excluded from FFO, offset by amortisation of lease incentives of $29 million (December 2016: $29 million). C Amortisation of lease fees are excluded from FFO. D FFO excludes the net change in fair value of Commercial Property investment properties held by both directly and indirectly through equity-accounted investments. Refer to section C1b for further information on fair value adjustments. E FFO excludes the unrealised net change in fair value of Retirement Living investment properties. Similarly, the net change in fair value of Retirement Living resident obligations is excluded from FFO. Refer to section C1c for further information on fair value adjustments. F Net change in fair value of financial instruments and foreign exchange movements, classified as finance income/expense, are excluded from FFO. Refer to section D1. G FFO excludes income tax expenses or benefits that do not represent a cash settlement. Interim Financial Report
32 Consolidated Notes Half year ended 31 December (B2c) Retirement Living segment result KEEPING IT SIMPLE For most contracts, Retirement Living residents lend an amount equivalent to the value of the independent living unit (ILU) or serviced apartment (SA) in exchange for a lease to live in the ILU or SA and access to community facilities, which are owned and maintained. This loan is recorded as a resident obligation liability. For most contracts, during the resident s tenure, earns deferred management fees (DMF) revenue which is calculated based on the individual resident contract. The DMF provides customers with the ability to free up equity (usually from the sale of their previous home), giving them extra capital that they can access to fund their retirement lifestyle it allows them to defer part of the cost of living in one of the Group s retirement village homes. There are various contractual arrangements; however, a standard contract will typically provide for DMF to be earned at a rate of 8% in the first year and 3% in subsequent years, capped at 35%, with and the resident sharing in any net capital gain when the ILU or SA is re-leased to the next resident. The DMF on an individual ILU or SA covers, to a significant extent, the resident s share of up-front capital costs of building the common infrastructure of the village, which typically includes amenities such as a pool, bowling green and community hall, and allows the resident to pay for these at the end of their tenancy, instead of the start. DMF revenue is included in the Retirement Living FFO when receives the accumulated DMF in cash after a resident leaves and either a new resident enters the ILU or SA, or when a unit is withheld for development and there is an approved investment proposal for development in place. The Retirement Living segment result also includes the settled development margin associated with new villages and village expansions or redevelopments. This margin represents the unit price realised on first lease less the cost of development and is recognised in FFO on settlement of a newly developed unit. Unrealised fair value gains and losses from revaluations of investment property and resident obligations are excluded from FFO. Refer to section (C1c) for further information on the fair value measurement and valuation technique used for Retirement Living investment properties and resident obligations. has other Retirement Living contracts for the age exclusive villages where residents purchase the ILU outright. There is no DMF associated with these sales and the ILU is no longer owned or maintained by. Reconciliation of Retirement Living segment results to statutory profit Half year ended 31 December Note FFO 2016 Statutory adjustments Statutory results FFO Statutory adjustments Statutory results Total realised revenue Net DMF base fees earned, unrealised A DMF revenue Net change in fair value of Retirement Living investment properties: settled development margin operating villages and villages B under development Total net change in fair value of Retirement Living investment properties Net change in fair value of commercial C 4 4 investment properties Net change in fair value of Retirement B (72) (72) (37) (37) Living resident obligations Management, administration, marketing (19) (19) (19) (19) and selling expenses Other net expenses (3) (3) Retirement Living profit Explanation of statutory adjustments A DMF base fees earned comprise DMF which are calculated on the entry price of a unit. For statutory profit, these fees are accrued progressively as becomes entitled to the fee but is not recognised in FFO until the accumulated DMF is realised in cash. B FFO excludes the net change in fair value for operating villages, villages under development and Retirement Living resident obligations. Refer to section C1c. C The Retirement Living segment includes certain healthcare centres located adjacent to Retirement Living villages held to be rented out under commercial leases. Interim Financial Report
33 Consolidated Notes Half year ended 31 December (B2d) Balance sheet by operating segment 31 December Assets Commercial Property Residential Retirement Living Other Unallocated Consolidated Cash and cash equivalents Real estate related assets 1 10,500 3,373 4, ,985 Intangible assets Other financial assets Other assets Total assets 10,556 3,449 4, ,867 Liabilities Interest-bearing liabilities 3,794 3,794 Retirement Living resident obligations 2,693 2,693 Other financial liabilities Other liabilities 136 1, ,792 Total liabilities 136 1,189 2,699 4,503 8,527 Net assets/(liabilities) 10,420 2,260 1,465 (3,805) 10,340 Other items Acquisition of investment properties June Commercial Property Residential Retirement Living Other Unallocated Consolidated Assets Cash and cash equivalents Real estate related assets 1 10,218 2,453 3, ,556 Intangible assets Other financial assets Other assets Total assets 10,260 2,588 3, ,495 Liabilities Interest-bearing liabilities 3,529 3,529 Retirement Living resident 2,629 2,629 obligations Other financial liabilities Other liabilities ,169 Total liabilities ,644 4,238 7,568 Net assets/(liabilities) 10,143 2,019 1,298 (3,533) 9,927 Other items Acquisition of investment properties Includes non-current assets held for sale, inventories, investment properties, equity-accounted investments and certain other assets. Interim Financial Report
34 Consolidated Notes Half year ended 31 December (B3) Taxation (B3a) Income tax benefit/(expense) Half year ended 31 December Current tax benefit Current tax benefit Total current tax benefit 30 Deferred tax benefit/(expense) Tax losses recognised during the period Tax losses utilised during the period 1 (22) Origination and reversal of temporary differences (43) (58) Total deferred tax benefit/(expense) 74 (9) Total income tax benefit There is no current tax expense for the half year ended 31 December because tax losses of $22 million (net) have been utilised to offset the Group s taxable income for the period. Reconciliation of statutory profit before income tax to income tax benefit/(expense) Half year ended 31 December Profit before income tax Less: Trust profit before income tax (398) (587) Less: intergroup eliminations 3 1 Profit before income tax of Corporation Group Prima facie income tax expense calculated at 30% (65) (29) Decrease in income tax expense due to: Other non-assessable income 1 Tax losses recognised during the period Income tax benefit Effective tax benefit rate 34% 22% Effective tax (expense) rate (excluding tax losses recognised) (30%) (30%) Tax benefit/(expense) relating to items of other comprehensive income Half year ended 31 December Fair value reserve (6) Tax (expense) relating to items of other comprehensive income (6) (B3b) Deferred tax Recoverability of deferred tax assets An assessment of the recoverability of the net deferred tax asset has been made to determine if the carrying value should be reduced or more tax losses should be recognised with reference to the latest available profit forecasts, to determine the availability of suitable taxable profits or taxable temporary differences. The assessment for the current period determined that there is convincing evidence, based upon the profitability of Corporation Group during the first half and latest available profit forecasts, that $139 million of previously unrecognised tax losses are now fully recoverable; hence, these losses have been recognised as a deferred tax asset. Following this recognition, has no unrecognised deferred tax assets in relation to carry forward tax losses as at 31 December (June : $139 million unrecognised asset relating to $463 million of tax losses). At each reporting period end, the net deferred tax asset will be assessed for recoverability. Trust There are no deferred tax assets or liabilities in the Trust. As the Trust limits its activities to deriving income from renting commercial property, and distributes all of its taxable income each year to its investors, the Trust is not subject to tax. However, all of the annual taxable income is subject to tax in the hands of s investors. Interim Financial Report
35 Consolidated Notes Half year ended 31 December (C) Operating assets and liabilities IN THIS SECTION This section shows the real estate and other operating assets used to generate the Group s trading performance and the liabilities incurred as a result. (C1) Real estate assets and liabilities (C1a) Inventories Each reporting period, key estimates are reviewed including the costs of completion, dates of completion and revenue escalations. As a result of this review, no net impairment provisions have been recognised in profit or loss for the half year ended 31 December (December 2016: $nil). The composition of inventories is presented in the table below: Finished development stock held for sale 1 Current 31 December 30 June Noncurrent Total Current Noncurrent cost of acquisition development and other costs interest capitalised impairment provision (1) (1) (1) (1) Total finished development stock held for sale Development work in progress Residential communities under development: cost of acquisition 421 1,826 2, ,052 1,329 development and other costs interest capitalised impairment provision (29) (141) (170) (27) (146) (173) Total residential communities under development 671 2,443 3, ,664 2,182 Apartments: cost of acquisition 7 7 development and other costs interest capitalised 1 1 impairment provision Total apartments Logistics and business parks projects: cost of acquisition development and other costs interest capitalised impairment provision (9) (9) (21) (9) (30) Total logistics and business parks projects Age exclusive villages: cost of acquisition development and other costs interest capitalised impairment provision Total age exclusive villages Total development work in progress 695 2,507 3, ,725 2,267 Total inventories 887 2,507 3, ,725 2,481 1 Mainly comprises residential communities. Included within finished development stock held for sale are logistics and business parks of $2 million (June : $5 million). There are no apartments or age exclusive villages included in finished development stock held for sale (June : $nil). Total Interim Financial Report
36 Consolidated Notes Half year ended 31 December (C1a) Inventories (continued) The following impairment provisions are included in the inventories balance with movements for the period recognised in profit or loss: Residential communities Apartments Logistics and business parks Opening balance as at 1 July Amounts utilised (3) (21) 1 (24) Balance as at 31 December Relates to land sold at Waterside Corporate Park, NSW (first acquired in 2005). (C1b) Commercial properties Commercial properties comprise investment interests in land and buildings including integral plant and equipment held for the purpose of producing rental income, capital appreciation, or both. Commercial properties including s share of property held by equity-accounted investments 31 December 30 June Trust 31 December Total 30 June Retail Town Centres 7,229 7,017 7,173 6,961 Logistics and Business Parks 2,091 2,035 2,091 2,035 Office Retirement Living 1 10 Capital works in progress and sundry properties Book value of commercial properties 10,544 10,232 10,399 10,099 Less amounts classified as: property, plant and equipment (43) (43) non-current assets held for sale (71) (69) other assets (including lease incentives and fees) (237) (216) (241) (223) other assets (including lease incentives and fees) attributable to equity-accounted investments other receivables (straight-lining of operating lease rental income) other receivables (straight-lining of operating lease rental income) attributable to equity-accounted investments Total investment properties (including s share of investment properties held by equityaccounted investments) (7) (8) (7) (8) (69) (67) (73) (71) (12) (13) (12) (13) 10,176 9,814 10,066 9,715 Less: s share of investment properties held (529) (529) (529) (529) by equity-accounted investments Total investment properties 9,647 9,285 9,537 9,186 Investment property reconciliation Direct investments and controlled entities Balance at the beginning of the financial period/year 9,285 8,800 9,186 8,702 Acquisitions Expenditure capitalised Transfers to non-current assets held for sale (71) (69) Disposals (8) (8) Net change in fair value of investment properties Balance at the end of the financial period/year 9,647 9,285 9,537 9,186 1 The investment property balance at 31 December includes $10 million of healthcare centre commercial properties held by the Retirement Living business (June : $nil) to be leased to tenants under commercial leases. Interim Financial Report
37 Consolidated Notes Half year ended 31 December (C1b) Commercial properties (continued) Independent valuation Description Date Retail Town Centres Directly owned Independent valuer s cap rate 1 % 31 December 30 June Book value 31 December 30 June Shellharbour, Shellharbour NSW 2 Dec Wetherill Park, Western Sydney NSW Dec Green Hills, East Maitland NSW 3 Dec Merrylands, Merrylands NSW Dec Rockhampton, Rockhampton Qld Dec Glendale, Newcastle NSW Jun Point Cook, Point Cook Vic Dec Cairns, Cairns Qld Jun Townsville, Townsville Qld (50%) 1, 3, 4, 5 Dec Burleigh Heads, Burleigh Heads Qld 1, 3 Jun Baldivis, Baldivis WA Dec Hervey Bay, Hervey Bay Qld Jun The Pines, Doncaster East Vic Jun Forster, Forster NSW Dec Balgowlah, Balgowlah NSW Jun Baulkham Hills, Baulkham Hills NSW Jun Wendouree, Wendouree Vic 3 Dec Jesmond, Newcastle NSW Dec Caloundra, Caloundra Qld Dec Bundaberg, Bundaberg Qld Jun Gladstone, Gladstone Qld Dec Nowra, Nowra NSW 5 Jun Cleveland, Cleveland Qld Dec Traralgon, Traralgon Vic Jun Bull Creek, Bull Creek WA Dec Bathurst, Bathurst NSW Dec Wallsend, Wallsend NSW Dec Tooronga, Tooronga Vic Dec Shellharbour Retail Park, Shellharbour NSW Dec Harrisdale Complex, Harrisdale WA Dec Cammeray, Cammeray NSW Dec Highlands, Craigieburn Vic Dec Kensington, Kensington Qld 3 Jun North Shore Townsville, Townsville Qld Dec Merrylands Court, Merrylands NSW 3, 4 Dec Woolworths Toowong, Toowong Qld 3, 4, 6 Dec n/a n/a 7 7 Townsville Kingsvale Sunvale, Aitkenvale Qld (50%) 5, 7 Dec n/a n/a 3 3 Corrimal, Corrimal NSW Owned through equity-accounted investments Riverton, Riverton WA (50%) Dec Total Retail Town Centres 9 7,229 7,017 1 A range of cap rates are disclosed for a complex comprising of a number of properties. 2 Independent valuation excludes the adjacent property owned by. 3 Property is currently undergoing redevelopment. An external valuation will be obtained on completion of the redevelopment. 4 Property is not held by the Trust. 5 s share of this property is held through a direct interest in the asset. 6 Property is valued as land. 7 Independent valuation based on 100% ownership. 8 Property was disposed of during the period. 9 Totals may not add due to rounding. Interim Financial Report
38 Consolidated Notes Half year ended 31 December (C1b) Commercial properties (continued) Independent valuation Description Date Logistics and Business Parks Directly owned Independent valuer s cap rate 1 % 31 December 30 June Book value 31 December 30 June Yennora Distribution Centre, Yennora NSW Dec Triniti Business Park (previously Triniti Business Dec Campus), North Ryde NSW Waterloo Road, Macquarie Park NSW 1 Dec Ingleburn Logistics Park (previously Ingleburn Dec Distribution Centre), Ingleburn NSW 2 Hendra Distribution Centre, Brisbane Qld Jun Mulgrave Corporate Park (previously Dec Mulgrave), Mulgrave Vic Brooklyn Distribution Centre (previously Brooklyn Dec Estate), Brooklyn Vic Port Adelaide Distribution Centre, Port Adelaide SA Dec Forrester Distribution Centre, St Marys NSW Dec Granville Industrial Estate (previously 9-11a Ferndell Dec Street), Granville NSW 1 Oakleigh Industrial Estate (previously Dec Centre Road), Oakleigh South Vic 2 Macquarie Technology Business Park (previously Dec Macquarie Technology Centre), Macquarie Park NSW 1 Balcatta Distribution Centre, Balcatta WA 3 Dec Altona Distribution Centre (previously Toll Business Jun Park), Altona Vic 1 Somerton Distribution Centre (previously & Dec Fillo Drive and 10 Stubb Street), Somerton Vic 1 16 Giffnock Avenue, Macquarie Park NSW Jun Wonderland Drive, Eastern Creek NSW Dec Altona Industrial Estate (previously Altona Distribution Jun Centre), Altona Vic Cherry Lane, Laverton North Vic Dec Smeg Distribution Centre (previously 2-8 Baker Street), Dec Botany NSW Wetherill Park Distribution Centre (previously 2 Davis Jun Road), Wetherill Park NSW Erskine Park, Erskine Park NSW Dec Coopers Paddock, Warwick Farm NSW 2, Scanlon Drive, Epping Vic Dec Export Distribution Centre (previously Export Park, Jun Viola Place), Brisbane Airport Qld 5 M1 Yatala Enterprise Park, Yatala Qld Jun 6 n/a n/a 6 6 Owned through equity-accounted investments Optus Centre, Macquarie Park NSW (51%) Mar Total Logistics and Business Parks 6 2,091 2,035 1 A range of cap rates are disclosed for a complex comprising of a number of properties. 2 Property is currently undergoing redevelopment. An external valuation will be obtained on completion of the redevelopment. 3 Independent valuation excludes the adjacent property owned by. 4 The book value adopted is a result of a Directors valuation. 5 Property is a leasehold property. 6 Totals may not add due to rounding. Interim Financial Report
39 Consolidated Notes Half year ended 31 December (C1b) Commercial properties (continued) Independent valuation Independent valuer s cap rate 1 % Book value Description Date 31 December 30 June 31 December 30 June Office Directly owned Piccadilly, Castlereagh Street, Jun , 2, 3, 4, 5 Sydney NSW (50%) Durack Centre, 263 Adelaide Terrace, Perth WA 2 Jun Pacific Highway, St Leonards NSW Dec Pacific Highway, North Sydney NSW Dec Walker Street, North Sydney NSW Dec Cameron Avenue, Belconnen ACT 2 Jun Jephson Street, Toowong Qld 6, 7 Jun High Street, Toowong Qld 6, 7 Jun Owned through equity-accounted investments 135 King Street, Sydney NSW (50%) 1, 4 Jun Total Office A range of cap rates are disclosed for a complex comprising of a number of properties. 2 Property is a leasehold property. 3 s share of this property is held through a direct interest in the asset. 4 Book value includes the retail component of the property. 5 The book value excludes the revaluation relating to the area occupied by. This owner-occupied area is classified as property, plant and equipment and is recognised at historical cost. 6 Property is not held by the Trust. 7 Property is currently undergoing redevelopment. An external valuation will be obtained on completion of the redevelopment. 8 Totals may not add due to rounding. Fair value measurement, valuation techniques and inputs The techniques used to fair value the Group s commercial properties have not changed since 30 June. For further explanation of the techniques used and inputs applied, refer to the 30 June annual financial statements. (C1c) Retirement Living For information on results of the Retirement Living business, refer to section B2c. Investment properties Retirement Living investment properties comprise retirement villages (both operating villages and villages under development) held to earn revenue and capital appreciation over the long term. Retirement villages comprise ILUs, SAs, community facilities and integral plant and equipment. Net investment in Retirement Living 31 December 30 June Operating villages 3,756 3,622 Villages under development Total Retirement Living investment properties 4,031 3,824 Existing resident obligations (2,681) (2,616) Net carrying value of Retirement Living villages 1,350 1,208 Retirement Living net carrying value movement during the period/year Balance at the beginning of the financial period/year 1,208 1,162 Expenditure capitalised Realised fair value movements 6 28 Cash received on first sales (31) (146) Change in fair value of investment properties Other movements 4 (15) Balance at the end of the financial period/year 1,350 1,208 Interim Financial Report
40 Consolidated Notes Half year ended 31 December (C1c) Retirement Living (continued) Fair value measurement, valuation techniques and inputs The fair value of Retirement Living investment properties (including villages under development) is the value of the Retirement Living assets and the future cash flows associated with the contracts. Changes in fair value of investment properties are recognised in profit or loss. The techniques used to fair value the Group s Retirement Living assets have not changed since 30 June. For further explanation of the techniques used and inputs applied, refer to the 30 June annual financial statements. Resident obligations Resident obligations represent the net amount owed by to current and former residents. Resident obligations are non-interest bearing and recognised at fair value. Current resident obligations Based on actuarial turnover calculations, approximately 7% of residents are estimated to depart their dwelling each year and therefore it is not expected that the full obligation to residents will fall due within one year. In the vast majority of cases, the resident obligations are able to be repaid from receipts from incoming residents. Accounting Standards require that resident obligations are classified as current, unless has an unconditional contractual right to defer settlement for at least 12 months, because residents have the right to terminate their occupancy contract with immediate effect. Non-current resident obligations The non-current resident obligations relate to certain legacy contracts that give a right to defer settlement for up to eight years. Current Non-current 31 December Existing resident obligations 2, ,681 Former resident obligations Total resident obligations 2, , June Existing resident obligations 2, ,616 Former resident obligations Total resident obligations 2, ,629 Fair value measurement, valuation techniques and inputs The fair value of the resident obligations is the amount payable on demand to residents and comprises the initial loan amount plus the resident s share of any capital gains or losses in accordance with their contracts less DMF earned to date. Changes in fair value of resident obligations are recognised in profit or loss. The following inputs are used to measure the fair value of the investment property and resident obligations: Range of unobservable inputs Inputs 31 December 30 June Discount rate (p.a.) % (average: 13.0%) % (average: 13.0%) Average 20 year growth rate (p.a.) 3.6% 3.6% Average length of stay of existing and future residents 10.8 years 10.8 years Current market value of unit $ million $ million Renovation/reinstatement cost $4k 82k $5k 80k Renovation recoupment from residents 0 100% 0 100% Total Both the investment properties and resident obligations are considered to be level 3 in the fair value hierarchy. Refer to section D4. Interim Financial Report
41 Consolidated Notes Half year ended 31 December (C1c) Retirement Living (continued) Valuation process Resident obligations are calculated each reporting period based on the initial loan amount paid by the resident adjusted for DMF and their share of capital gains or losses arising on the unit depending on the contract type. It is impractical to have the resident obligations valued externally, therefore these are valued every six months by the Directors. Key assumptions used in these valuations are externally reviewed and assessed for reasonableness each reporting period. The techniques used to fair value the Group s resident obligations have not changed since 30 June. For further explanation of the techniques used and inputs applied, refer to the 30 June financial statements. Sensitivity information As the resident obligations are a financial liability, a quantitative sensitivity analysis has been disclosed. Sensitivity of the resident obligations to changes in the assumptions are shown in the table below: Significant input Change in assumption Increase/(decrease) in resident obligations Increase in input 31 December 30 June Decrease in input 31 December 30 June Current market value 10% (174) (167) For most contracts, the resident shares capital gains or losses with upon exit; therefore, current market value is the only input that significantly impacts the fair value of the resident obligation. (C1d) Non-current assets held for sale The following assets have been classified as held for sale: 31 December 30 June Trust 31 December 30 June Investment properties transferred from Commercial Property Total non-current assets held for sale During the current period, completed the sale of Corrimal, NSW and certain sundry properties previously classified as non-current assets held for sale at 30 June. In the prior year, these properties were revalued to their expected sale value. Interim Financial Report
42 Consolidated Notes Half year ended 31 December (D) Capital structure and financing costs IN THIS SECTION This section outlines how the Group manages its capital structure and related financing costs, including its balance sheet liquidity and access to capital markets. The Board determines the appropriate capital structure of the Group; specifically, how much is raised from securityholders (equity) and how much is borrowed from financial institutions and capital markets (debt), in order to finance the Group's activities both now and in the future. The Board considers the Group's capital structure and its dividend and distribution policy at least twice a year ahead of announcing results, in the context of its ability to continue as a going concern, to execute the strategy and to deliver its business plan. During, s S&P credit rating remained unchanged at A-/Stable. A comparable A3 Moody s credit rating was obtained in August. The Board continued to focus on maintaining the efficiency of the balance sheet. The Group is exposed to changes in interest rates on its net borrowings and to changes in foreign exchange rates on its foreign currency transactions and net assets. In accordance with risk management policies, the Group uses derivative instruments to hedge these underlying exposures. (D1) Net financing costs KEEPING IT SIMPLE This section details the interest income generated on the Group's cash and other financial assets and the interest expense incurred on borrowings and other financial assets and liabilities. The presentation of the net financing costs in this note reflects income and expenses according to the classification of the financial instruments. Mark to market movements reflect the change in value of the Group s derivative instruments between the later of inception or 1 July and 31 December. The value at period end is not necessarily the same as the value at which they will be settled at maturity. Net financing costs can be analysed as follows: Half year ended 31 December Interest income from related parties Interest income from other parties Interest income Net gain on fair value hedges Net gain on debt and derivatives Total net gain on hedges, debt and derivatives Total finance income Trust 2016 Interest expense relating to interest-bearing financial liabilities Interest paid or payable on other financial liabilities at amortised cost 11 5 Less: interest capitalised to inventories (62) (57) Less: interest capitalised to investment properties (9) (6) (6) (4) Interest expense Total finance expense The interest expense relating to interest-bearing financial liabilities includes $33 million (December 2016: $41 million) related to interest on financial liabilities carried at amortised cost, and not designated in a fair value hedge relationship. Interim Financial Report
43 Consolidated Notes Half year ended 31 December (D1) Net financing costs (continued) The table below shows the composition of gains and losses on interest-bearing liabilities, including those eligible and ineligible for hedge accounting: Half year ended 31 December Net (loss)/gain on fair value hedges Loss on net change in fair value of derivatives (37) (65) (37) (65) Gain on net change in fair value of interest-bearing liabilities Net gain on fair value hedges Net gain/(loss) on debt and derivatives Gain/(loss) on foreign exchange movements 6 (18) 6 (18) (Loss)/gain on fair value movement (2) 130 (2) 130 Net gain on debt and derivatives (D2) Interest-bearing loans and borrowings 2016 Trust 2016 KEEPING IT SIMPLE The Trust borrows money from financial institutions and debt investors in the form of bonds and other financial instruments. The Trust s bonds generally have fixed interest rates and are for a fixed term. The interest expense on these instruments is shown in section D1. and Trust Interest-bearing loans and borrowings are recognised initially at fair value less attributable transaction costs and subsequently are stated at amortised cost. Any difference between cost and redemption value is recognised in profit or loss over the period of the borrowings using the effective interest method. However, where an effective fair value hedge is in place, borrowings are carried at fair value and changes in the fair value are recognised in profit or loss. The table below shows the fair value of each of these instruments. Fair value reflects the principal amount and remaining duration of the notes based on current market interest rates and conditions at balance date. Carrying value Section Current Noncurrent Total Fair value 31 December Foreign medium term notes D2a 442 2,295 2,737 3,005 Domestic medium term notes D2b Bank facilities D2c Total 442 3,352 3,794 4, June Foreign medium term notes D2a 267 2,575 2,842 3,119 Domestic medium term notes D2b Bank facilities D2c Total 267 3,262 3,529 3,857 The difference of $312 million (June : $328 million) between the carrying amount and fair value of the foreign and domestic medium term notes is due to notes being carried at amortised cost under AASB 139 Financial Instruments: Recognition and Measurement, while the fair value represents the amount required to replicate at balance date the principal and duration of these notes based on current market interest rates and conditions. Interim Financial Report
44 Consolidated Notes Half year ended 31 December (D2) Interest-bearing loans and borrowings (continued) (D2a) Foreign medium term notes US private placements The Trust has issued fixed coupon notes in the US private placement market. Generally, notes are issued in United States dollars (USD) and converted back to Australian dollars (AUD or $) principal and AUD floating coupons through CCIRS. In the prior period ended 31 December 2016, the Trust settled new US private placement debt which was transacted in a previous year. The debt was equivalent to $398 million and comprised four tranches denominated in either USD or AUD with terms of between 10 and 15 years. In the prior period, the Trust also repaid USD 66 million ($89 million) of its notes that were issued in the US private placement market and matured in July 2016 and October During the current period, the Trust repaid USD 40 million ($61 million) of its notes that were issued in the US private placement market and matured in October. In December, the Trust contracted for new US private placement debt equivalent to AUD 286 million which comprises five tranches denominated in either USD or AUD. The debt was settled in January 2018 with terms of between 10 and 15 years. The fair value of the US private placements as at 31 December is $2,269 million (June : $2,384 million). Asian and European private placements The Trust has issued medium term notes into the Asian and European private placement markets with face values of Hong Kong dollars (HKD) 470 million ($62 million), HKD 400 million ($55 million), HKD 540 million ($100 million) and Euros (EUR) 300 million ($433 million). All notes are issued at a fixed coupon payable in HKD and EUR and converted back to AUD floating coupons through CCIRS. The fair value of the Asian and European private placements as at 31 December is $736 million (June : $735 million). (D2b) Domestic medium term notes Domestic medium term notes have been issued at either face value, or at a discount or premium to face value and are carried at amortised cost. The discount or premium is amortised to finance costs over the term of the notes. The medium term notes are issued on either fixed or floating interest rate terms. In the prior period, the Trust repaid $150 million of its medium term domestic notes that matured in July The fair value of the notes as at 31 December is $601 million (June : $608 million). (D2c) Bank facilities and Trust The bank facilities are multi-use facilities which may be used partially for bank guarantees. Bank facilities are unsecured and held at amortised cost. Details of maturity dates and security for facilities, excluding bank guarantee facilities (refer to section F3), are set out below: Maturity date 31 December 30 June Utilised Facility limit Utilised Facility limit December 100 July December August January January February November February November Interim Financial Report
45 Consolidated Notes Half year ended 31 December (D3) Other financial assets and liabilities KEEPING IT SIMPLE Investments in other financial assets are managed in accordance with the Group s documented risk policy. Based on the nature of the asset and its purpose, movements in the fair value of other financial assets are recognised either through profit or loss or other comprehensive income. (D3a) Return of capital from BGP Holdings Plc (BGP) BGP is a European (predominantly EUR denominated) real estate investment company. holds a 12.4% nontransferable, non-tradable investment in BGP. recognised this as an available for sale investment, in current other financial assets. In, BGP successfully completed the sale of its underlying property portfolio and advised shareholders of its intention to wind up the BGP group of companies and distribute the proceeds to shareholders. In November, received a $25 million return of capital from BGP. No further material distributions are expected from BGP, and the investment is held at $nil. has recognised a $25 million gain ($17 million net of tax) in profit or loss, including $23 million ($15 million net of tax) gain previously recognised in equity reserves recycled through profit or loss in the current period. Reconciliation from opening balance to closing balance for the fair value of the investment in BGP Opening balance as at 1 July 23 Net gain recognised in other comprehensive income 2 Return of capital reclassified to profit or loss (25) Balance as at 31 December (D3b) Investments made by CARE Foundation (CARE Foundation) The CARE Foundation is a charitable trust set up by. Under the Accounting Standards, the CARE Foundation is considered a subsidiary of. Included in other financial assets is $9 million of CARE Foundation investments (June : $8 million). This is comprised of an $8 million initial donation made by Trust in the prior years which the CARE Foundation has invested to fund its ongoing charitable projects. Investments gains of $1 million, net of donations made to charity partners, have been recognised in profit or loss. (D4) Fair value hierarchy KEEPING IT SIMPLE The financial instruments included on the balance sheet are measured at either fair value or amortised cost. The measurement of fair value may in some cases be subjective and may depend on the inputs used in the calculations. The Group generally uses external valuations based on market inputs or market values (e.g. external share prices). The different valuation inputs are called hierarchies and are described below: Level 1: quoted prices (unadjusted) in active markets for identical assets or liabilities; Level 2: inputs other than quoted prices included within Level 1 that are observable for the asset or liability, either directly (i.e. as prices) or indirectly (i.e. derived from prices); and Level 3: inputs for the asset or liability that are not based on observable market data (unobservable inputs). Determination of fair value The fair value of derivative financial instruments, including domestic and foreign medium term notes, interest rate derivatives and CCIRS, is determined in accordance with generally accepted pricing models by discounting the expected future cash flows using assumptions supported by observable market rates. While certain derivatives are not quoted in an active market, has determined the fair value of these derivatives using quoted market inputs (e.g. interest rates, volatility and exchange rates) adjusted for specific features of the instruments and debit or credit value adjustments based on the current credit worthiness of or the derivative counterparty. The fair value of forward exchange contracts is the quoted market price of the derivative at balance date, being the present value of the quoted forward price. The table overleaf sets out the financial instruments included on the balance sheet at fair value. Quantitative sensitivities required under AASB 13 Fair Value Measurement in relation to the Retirement Living resident obligations have been disclosed in section C1c. Interim Financial Report
46 Consolidated Notes Half year ended 31 December (D4) Fair value hierarchy (continued) 31 December Financial assets carried at fair value Level 1 Level 2 Level 3 Derivative assets Securities in unlisted entities 9 9 Other investments 9 9 Total financial assets carried at fair value Financial liabilities carried at fair value Derivative liabilities (248) (248) Retirement Living resident obligations (2,693) (2,693) Total financial liabilities carried at fair value (248) (2,693) (2,941) Net position 9 (6) (2,684) (2,681) 30 June Financial assets carried at fair value Derivative assets Securities in unlisted entities Other investments 8 8 Total financial assets carried at fair value Financial liabilities carried at fair value Derivative liabilities (241) (241) Retirement Living resident obligations (2,629) (2,629) Total financial liabilities carried at fair value (241) (2,629) (2,870) Net position 8 28 (2,597) (2,561) Trust 31 December Financial assets carried at fair value Level 1 Level 2 Level 3 Derivative assets Securities in unlisted entities 9 9 Total financial assets carried at fair value Financial liabilities carried at fair value Derivative liabilities (248) (248) Total financial liabilities carried at fair value (248) (248) Net position (6) June Financial assets carried at fair value Derivative assets Securities in unlisted entities 9 9 Total financial assets carried at fair value Financial liabilities carried at fair value Derivative liabilities (241) (241) Total financial liabilities carried at fair value (241) (241) Net position Total Total Interim Financial Report
47 Consolidated Notes Half year ended 31 December (D4) Fair value hierarchy (continued) Derivative financial assets and liabilities are not offset in the balance sheet as under agreements held with derivative counterparties, the Group does not have a legally enforceable right to set off the position payable/ receivable to a single counterparty. The following table shows a reconciliation from the opening balances to the closing balances for fair value measurements in Level 3 of the fair value hierarchy: Securities in unlisted entities Retirement Living resident obligations Opening balance as at 1 July 32 (2,629) (2,597) Total gains and losses recognised in: profit or loss (23) (23) other comprehensive income 2 2 Cash receipts from incoming residents on turnover (115) (115) Cash payments to outgoing residents on turnover, net of DMF Return of capital (25) (25) Balance as at 31 December 9 (2,693) (2,684) Total Opening balance as at 1 July (2,427) (2,391) Total gains and losses recognised in: profit or loss other comprehensive income Cash receipts from incoming residents on turnover (148) (148) Cash payments to outgoing residents on turnover, net of DMF Balance as at 31 December (2,484) (2,387) Trust Securities in unlisted entities Opening balance as at 1 July 9 9 Total gains and losses recognised in: profit or loss Total Balance as at 31 December 9 9 Opening balance as at 1 July Total gains and losses recognised in: profit or loss Balance as at 31 December Interim Financial Report
48 Consolidated Notes Half year ended 31 December (D5) Issued capital KEEPING IT SIMPLE This section explains material movements recorded in issued capital that are not explained elsewhere in the financial statements. The movements in equity of the Group and the balances are presented in the Consolidated Statements of Changes in Equity. Issued capital represents the amount of consideration received for stapled securities issued by the Group. Transaction costs of an equity transaction are accounted for as a deduction from equity, net of any related income tax benefit. For so long as remains jointly quoted, the number of shares in Corporation Limited and the number of units in Trust shall be equal and the shareholders and unitholders shall be identical. Unitholders of Trust are only entitled to distributions and voting rights upon stapling. The following table provides details of securities issued by the Group: Details Ordinary securities on issue and Trust Trust Number of securities 31 December Number of securities 30 June 31 December 30 June 31 December 30 June Issued and fully paid 2,434,469,276 2,418,400,142 8,884 8,817 7,571 7,507 Other equity securities Treasury securities (8,093,259) (6,002,501) (35) (27) (34) (27) Total issued capital 2,426,376,017 2,412,397,641 8,849 8,790 7,537 7,480 (D5a) Ordinary securities The following table provides details of movements in securities issued: Details Movement of securities issued and Trust Number of securities Opening balance as at 1 July 2,418,400,142 8,817 7,507 Securities issued under DRP 16,069, Balance as at 31 December 2,434,469,276 8,884 7,571 Trust Opening balance as at 1 July ,392,042,302 8,696 7,389 Securities issued under DRP 12,995, Balance as at 31 December ,405,037,771 8,759 7,451 Dividend/distribution reinvestment plan (DRP) In the current period, issued 16,069,134 securities under the DRP. On 21 February 2018 we announced the suspension of the DRP in respect of the half year distribution for the six months ended 31 December. The proposed DRP issue price of stapled securities announced on 16 February 2018 of $4.03 is below the Group s net tangible assets per security at 31 December of $4.18, and significantly below the closing price of $4.74 on 14 December, the day the operation of the DRP was announced. As a result, the Directors have formed the view that some securityholders may be disadvantaged if the issue were to proceed. The Group has sufficient capital to maintain its development and investment activity. Interim Financial Report
49 Consolidated Notes Half year ended 31 December (D5) Issued capital (continued) (D5b) Other equity securities Treasury securities Treasury securities are securities in that are held by the Employee Securities Plan Trust. Securities are held until the end of the vesting period affixed to the securities. As the securities are held on behalf of eligible employees, the employees are entitled to the dividends and distributions. Movement of other equity securities Details and Trust Number of securities Opening balance as at 1 July 6,002,501 (27) (27) Securities acquired 4,674,128 (20) (19) Securities transferred to employees on vesting (2,583,370) Balance as at 31 December 8,093,259 (35) (34) Securities acquired During the period, 4,674,128 securities were acquired on market for the purpose of issuing securities under the Share Plans. Securities transferred to employees on vesting During the period, 2,583,370 securities vested and were transferred to employees under the Share Plans. At 31 December, the Employee Securities Plan Trust is holding 8,093,259 securities. (D6) Dividends and distributions Dividends and distributions recognised in the financial period by the Group are detailed below: Corporation There were no dividends from Corporation Limited during the current, or previous, financial period. The dividend franking account balance as at 31 December is $14 million based on a 30% tax rate (June : $14 million). For the current period, the interim distribution is paid solely out of the Trust and therefore the franking percentage is not relevant. Trust Cents per security Trust Total amount Record date Date of payment Interim distribution: 31 December December 28 February 2018 Interim distribution: 31 December December February The tax preferred percentage will be determined at year end. Interim Financial Report
50 Consolidated Notes Half year ended 31 December (E) Group structure IN THIS SECTION This section provides information on changes to the Group structure. The Group includes entities that are classified as joint ventures, joint operations, associates and structured entities. Joint ventures and associates are accounted for using the equity method, while joint operations are proportionately consolidated and structured entities are recorded as investments at cost. (E1) Equity-accounted investments and the Trust have interests in a number of individually immaterial joint ventures that are accounted for using the equity method. The Group did not have investments in associates at 31 December or 30 June. Aggregate carrying amount of individually immaterial joint ventures 31 December 30 June Trust 31 December 30 June The ownership interest in each of these immaterial entities is presented below: Trust 31 December % 30 June % 31 December % 30 June % Investment in joint ventures: Brisbane Casino Towers Compam Property Management Pty Limited Eagle Street Pier Pty Limited Macquarie Park Trust Riverton Forum Pty Limited The King Trust Willeri Drive Trust Half year ended 31 December 2016 Trust Aggregate share of: profit from continuing operations other comprehensive income Total comprehensive income Interim Financial Report
51 Consolidated Notes Half year ended 31 December (F) Other items IN THIS SECTION This section includes information about the financial performance and position of the Group, that must be disclosed to comply with the Accounting Standards, the Corporations Act 2001 or the Corporations Regulations (F1) Earnings per security (EPS) KEEPING IT SIMPLE EPS is the amount of post-tax profit attributable to each security. Basic EPS is calculated on the Group s statutory profit for the period divided by the weighted average number of securities. Statutory profit is highly variable as it includes unrealised fair value movements in investment properties and financial instruments. Diluted EPS adjusts the basic EPS for the dilutive effect of any instruments, such as Share Plan rights, that could be converted into securities. Basic FFO per security is disclosed in the Directors Report on page 6 and more directly reflects the underlying income performance of the Group. Trust Half year ended 31 December Basic and diluted EPS cents 2016 cents cents Basic EPS Diluted EPS The calculation of basic EPS has been based on the following profit attributable to ordinary securityholders and weighted average number of ordinary securities outstanding: Reconciliation of earnings used in calculating EPS Half year ended 31 December Basic and diluted earnings Profit attributable to securityholders Weighted average number of securities used as the denominator Half year ended 31 December Weighted average number of securities (basic) 2016 Number of securities and Trust Trust 2016 cents Number of securities Weighted average number of securities 2,421,829,448 2,394,631,719 Weighted average number of securities (diluted) Weighted average number of securities (basic) 2,421,829,448 2,394,631,719 Effect of rights and securities granted under Share Plans 7,762,324 6,169,409 Weighted average number of securities (diluted) 2,429,591,772 2,400,801,128 Rights and securities granted under Share Plans are only included in diluted EPS where is meeting performance hurdles for contingently issuable share based payment rights. Interim Financial Report
52 Consolidated Notes Half year ended 31 December (F2) Notes to Consolidated Cash Flow Statements (F2a) Reconciliation of profit for the period to net cash inflows from operating activities Half year ended 31 December Profit for the period Add/(less) items classified as investing/financing activities: Net gain on fair value hedges (1) (14) (1) (14) Net gain on debt and derivatives (4) (112) (4) (112) Interest capitalised to investment properties (9) (6) (6) (4) Net loss on sale of other non-current assets Net gain on other financial assets (26) Add/(less) non-cash items: DMF base fees earned, unrealised (18) (13) Depreciation 9 7 Straight-line rent adjustments (3) (3) (3) (3) Net change in fair value of investment properties (214) (244) (101) (161) (including equity-accounted investments) Share of profits of equity-accounted investments, net of (3) 2 (3) 2 distributions received Equity-settled share based payments 8 9 Other items 4 (11) 5 4 Net cash inflows from operating activities before change in assets and liabilities Decrease/(increase) in receivables 49 1 (4) (5) Increase in other assets (17) (23) (14) (15) (Increase)/decrease in inventories (913) 26 Increase in deferred tax assets (74) (29) Increase in payables and other liabilities Increase in Retirement Living resident obligations Increase/(decrease) in other provisions 428 (63) Net cash inflows from operating activities Trust 2016 (F2b) Reconciliation of movement in financial liabilities arising from financing activities and Trust Non-cash movements Opening balance 1 July Net cash flows Foreign exchange movements Fair value changes Balance 31 December Interest-bearing loans and borrowings Foreign medium term notes 2,842 (61) (6) (38) 2,737 Domestic medium term notes Bank facilities Total 3, (6) (38) 3, Interest-bearing loans and borrowings Foreign medium term notes 2, (79) 3,220 Domestic medium term notes 705 (150) Bank facilities Total 3, (78) 3,916 Interim Financial Report
53 Consolidated Notes Half year ended 31 December (F3) Contingent liabilities KEEPING IT SIMPLE A contingent liability is a liability that is not sufficiently certain to qualify for recognition as a provision where uncertainty may exist regarding the outcome of future events. Contingent liabilities at 31 December comprise bank guarantees, letters of credit and insurance bonds. Guarantees Bank guarantees, letters of credit and insurance bonds issued to semi and local government and other authorities against performance contracts, maximum facility $560 million (June : $560 million) and Trust 31 December 30 June (F4) Commitments Capital expenditure commitments Commitments for acquisition of land and future development costs not recognised in the financial statements at balance date are as follows: 31 December 30 June Trust 31 December 30 June Inventory commitments Investment property commitments Total capital expenditure commitments Operating lease commitments Operating lease commitments not recognised in the financial statements at balance date are as follows: within one year 9 9 later than one year but not later than five years later than five years Total operating lease commitments During the period, $4 million was recognised as an expense in s profit or loss in respect of operating leases (December 2016: $4 million). No operating lease expense was recognised in the Trust s profit or loss. (F5) Related party disclosures There have been no significant changes to the nature of related parties that were disclosed in the 30 June annual financial statements. (F6) Events subsequent to the end of the period and Trust Other than disclosed elsewhere in this report, there has not arisen in the interval between the end of the current period and the date of this report any item, transaction or event of a material or unusual nature, likely, in the opinion of the Directors, to affect significantly the operations, the results of operations, or the state of the affairs in future years of and the Trust. Interim Financial Report
54 Directors Declaration Interim Financial Statements Half year ended 31 December In the opinion of the Directors of Corporation Limited, and the Directors of the Responsible Entity of Trust, Trust Management Limited (collectively referred to as the Directors): (a) the financial statements and notes of Corporation Limited and its controlled entities, including Trust and its controlled entities () and Trust and its controlled entities (Trust), set out on pages 18 to 50, are in accordance with the Corporations Act 2001, including: (i) giving a true and fair view of s and the Trust s financial position as at 31 December and of their performance, for the period ended on that date; and (ii) complying with Australian Accounting Standards and the Corporations Regulations 2001; and (b) there are reasonable grounds to believe that both and the Trust will be able to pay their debts as and when they become due and payable. Signed in accordance with a resolution of the Directors: Tom Pockett Chairman Mark Steinert Managing Director Dated at Sydney, 21 February 2018 Interim Financial Report
55 Independent Auditor s Review Report Interim Financial Statements Independent auditor's review report to the stapled securityholders of and unitholders of Trust Group Report on the Half-Year Financial Report We have reviewed the accompanying half-year financial report which comprises: the Consolidated Balance Sheet as at 31 December, the Consolidated Statement of Profit or Loss and Other Comprehensive Income, Consolidated Statement of Changes in Equity and Consolidated Cash Flow Statement for the half-year ended on that date, selected explanatory notes and the directors' declaration for, being the consolidated stapled entity ( ). The consolidated stapled entity, as described in Note A to the half-year financial report, comprises Corporation Limited and the entities it controlled during that half-year, including Trust and the entities it controlled during that half-year, and the Consolidated Balance Sheet as at 31 December, the Consolidated Statement of Profit or Loss and Other Comprehensive Income, Consolidated Statement of Changes in Equity and Consolidated Cash Flow Statement for the half-year ended on that date, selected explanatory notes and the directors' declaration for Trust Group, being the consolidated entity ( Trust Group ). The consolidated entity comprises Trust and the entities it controlled during that half-year. Directors' responsibility for the half-year financial report The directors of the Corporation Limited and the directors of Trust Management Limited, the Responsible entity for Trust (collectively referred to as the directors ) are responsible for the preparation of the half-year financial report that gives a true and fair view in accordance with Australian Accounting Standards and the Corporations Act 2001 and for such internal control as the directors determine is necessary to enable the preparation of the half-year financial report that is free from material misstatement whether due to fraud or error. Auditor s responsibility Our responsibility is to express a conclusion on the half-year financial report based on our review. We conducted our review in accordance with Australian Auditing Standard on Review Engagements ASRE 2410 Review of a Financial Report Performed by the Independent Auditor of the Entity, in order to state whether, on the basis of the procedures described, we have become aware of any matter that makes us believe that the half-year financial report is not in accordance with the Corporations Act 2001 including giving a true and fair view of the consolidated and Trust Group s financial position as at 31 December and their performance for the half-year ended on that date; and complying with Accounting Standard AASB 134 Interim Financial Reporting and the Corporations Regulations As the auditor of and Trust Group, ASRE 2410 requires that we comply with the ethical requirements relevant to the audit of the annual financial report. A review of a half-year financial report consists of making enquiries, primarily of persons responsible for financial and accounting matters, and applying analytical and other review procedures. A review is substantially less in scope than an audit conducted in accordance with Australian Auditing Standards and consequently does not enable us to obtain assurance that we would become aware of all significant matters that might be identified in an audit. Accordingly, we do not express an audit opinion. PricewaterhouseCoopers, ABN One International Towers Sydney, Watermans Quay, Barangaroo, GPO BOX 2650, SYDNEY NSW 2001 T: , F: , Level 11, 1PSQ, 169 Macquarie Street, Parramatta NSW 2150, PO Box 1155 Parramatta NSW 2124 T: , F: , Liability limited by a scheme approved under Professional Standards Legislation. Interim Financial Report
56 Independent Auditor s Review Report` Independence In conducting our review, we have complied with the independence requirements of the Corporations Act Conclusion Based on our review, which is not an audit, we have not become aware of any matter that makes us believe that the half-year financial report of and Trust Group is not in accordance with the Corporations Act 2001 including: 1. giving a true and fair view of the and Trust Group s financial position as at 31 December and of their performance for the half-year ended on that date; 2. complying with Accounting Standard AASB 134 Interim Financial Reporting and the Corporations Regulations PricewaterhouseCoopers S J Hadfield Partner N R McConnell Partner Sydney 21 February 2018 Interim Financial Report
57 Glossary Interim Financial Statements AASBs or Accounting Standards A-REIT ASIC ASX CCIRS CODM D-Life DCF DMF DRP DSTI EBIT EPS Executive Committee Executive Director FFO GST Australian Accounting Standards as issued by the Australian Accounting Standards Board Australian Real Estate Investment Trust Australian Securities and Investments Commission Australian Securities Exchange Cross currency interest rate swaps Chief Operating Decision Makers as defined by AASB 8 Operating Segments Project development lifecycle Discounted cash flow Deferred management fees earned from residents within the Retirement Living business Dividend/distribution reinvestment plan Deferred short term incentives Earnings before interest and tax Earnings per security Comprises the Executive Director and the Executive team of Mark Steinert, the Managing Director and Chief Executive Officer of Funds from operations Goods and services tax IFRS International Financial Reporting Standards as issued by the International Financial Reporting Standards Board ILU Independent living unit IRR Internal rate of return KPI Key performance indicators LTI Long term incentives MAT Moving annual turnover NRV Net realisable value Report This Interim Financial Report 2018 ROA Return on assets ROE Return on equity SA Serviced apartment SCPL Capital Partners Limited SDRT No. 1 Direct Retail Trust No. 1 Security An ordinary stapled security in, comprising of one share in Corporation and one unit in Trust Share plans Employee share plans which comprise the LTI, DSTI and $1,000 employee plans Statutory profit Profit as defined by Accounting Standards STI Short term incentives STML Trust Management Limited (ACN , AFSL ), the Responsible Entity of Trust or Group The consolidation of Corporation Group and Trust Group Corporation or Corporation Limited (ACN ) Company Corporation Group Corporation and its controlled entities Trust Trust (ARSN ) Trust Group or Trust Trust and its controlled entities TSR Total securityholder return WALE Weighted average lease expiry Interim Financial Report
58
For personal use only
 10 February 2016 133 Castlereagh Street Sydney NSW 2000 www.stockland.com T 02 9035 2000 F 02 8988 2552 For media enquiries Greg Spears Senior Manager Media Relations Stockland T +61 (0)2 9035 3263 M +61
Stockland Update RESULTS BUILT ON SUSTAINABLE COMMUNITIES. April Cardinal Freeman The Residences, Sydney
 Stockland Update RESULTS BUILT ON SUSTAINABLE COMMUNITIES April 2017 Cardinal Freeman The Residences, Sydney 1 Agenda Group Update 3 1H17 results and achievements 5 Commercial Property 9 Retirement Living
Vicinity announces FY19 interim results with strategy delivering benefits
 ASX Announcement 15 February 2019 Vicinity announces FY19 interim results with strategy delivering benefits KEY FINANCIAL AND OPERATING HIGHLIGHTS Statutory net profit after tax of $235.3 million for the
2017 Annual General Meeting Chairman and CEO Addresses
 ASX Announcement 27 October 2017 2017 Annual General Meeting Chairman and CEO Addresses In accordance with ASX Listing Rule 3.13, attached are the addresses and accompanying presentation slides to be given
FY14 Stockland Results Presentation A year in focus
 FY14 Stockland Results Presentation A year in focus Agenda 2 Topic Speaker Page Group Update Mark Steinert, Managing Director and CEO Financial Update Tiernan O Rourke, CFO 06 03 Commercial Property Residential
9 August 2018 MIRVAC GROUP FULL YEAR RESULTS 30 JUNE 2018
 9 August 2018 MIRVAC GROUP FULL YEAR RESULTS 30 JUNE 2018 Mirvac Group (Mirvac) [ASX: MGR] today announced its full-year results for the financial year ended 30 June 2018 (FY18), with the Group delivering
SCA PROPERTY GROUP ANNOUNCES FIRST HALF FY19 RESULTS
 MEDIA ANNOUNCEMENT 4 February 2019 SCA PROPERTY GROUP ANNOUNCES FIRST HALF FY19 RESULTS SCA Property Group (ASX: SCP) ( SCP or the Group ) is pleased to announce its results for the six months ended 31
MIRVAC GROUP 3 MAY Management Update INCLUDING 3Q16 HIGHLIGHTS
 MIRVAC GROUP 3 MAY 2016 Management Update INCLUDING 3Q16 HIGHLIGHTS URBAN FOCUS > We are an urban company, we create places for people to live, work and shop > We understand the fabric of cities and the
Corporate profile. Strong foundations Positive momentum. years being listed as Dexus
 Corporate profile Strong foundations Positive momentum years being listed as Dexus Company overview Dexus is a Top 50 entity by market capitalisation listed on the Australian Securities Exchange (trading
8 August Merrylands, NSW
 8 August 2012 Merrylands, NSW Agenda 1 Results summary: Matthew Quinn 2 Capital management: Tim Foster 3 Business commentary Retail: John Schroder Office & Industrial: John Schroder Residential Communities:
FY18 RESULTS PRESENTATION
 FY18 RESULTS PRESENTATION KEY PERFORMANCE METRICS FOR FY18 OPERATIONAL FINANCIAL CAPITAL MANAGEMENT STRATEGIC GROWTH 2,257 lots under contract with a value of $616m $49.1m FY18 operating profit after tax
by mirvac fy13 q operational update 25 october 2012 Artist s impression of old treasury building, perth, wa
 fy13 q operational update 25 october 2012 Artist s impression of old treasury building, perth, wa agenda FY13 Q1 Operational Update Introduction Q1 Operational Update Investment Division Update Development
Q3 operational update
 Q3 operational update 9 may 2013 Q3 key outcomes n FY13 operating guidance of 10.7 to 10.8cpss maintained n MPT continues to deliver strong metrics: 98.2% occupancy 1 5.3 year WALE 2 Strong MAT growth
ASX ANNOUNCEMENT. Abacus Property Group Full Year Results. Results highlights
 ASX ANNOUNCEMENT Abacus Property Group - 2017 Full Year Results Results highlights The Group s 1 consolidated AIFRS statutory profit is $285.1 million up 53% from $185.9 million in FY16 Abacus underlying
For personal use only
 ASX / MEDIA ANNOUNCEMENT 9 February 2015 SCA PROPERTY GROUP ANNOUNCES FIRST HALF FY15 RESULTS SCA Property Group (ASX: SCP) ( SCP or the Group ) announces its results for the six months ended 31 December
1 FY2014 Financial Highlights. 2 Operational Overview. 3 Market Conditions. 4 Company Outlook
 1 FY2014 Financial Highlights 2 Operational Overview 3 Market Conditions 4 Company Outlook Record full year profit of $40.3m, up 10.9% on pcp Final fully franked dividend of 15.5 cents declared; record
Offshore Investor Presentation April
 Offshore Investor Presentation April 2008 www.stockland.com.au Stockland s Position in the A-REIT Sector Stockland was formed in 1952 and pioneered the stapled security structure Stockland s current position*
operational update by mirvac 17 MAY Chifley Square, Sydney, NSW
 operational update by mirvac 17 MAY 2011 8 Chifley Square, Sydney, NSW Contents mirvac overview 2 investment 3 development 7 > Commercial > Residential sustainability update 11 GUIDANCE and outlook 12
q operational update 22 october 2013 by mirvac
 q operational update 22 october 2013 Q1 snapshot Q1 OPERATIONAL UPDATE I 22 OCTOBER 2013 I PAGE 1 FY14 operating EPS guidance of 11.7 to 12.0cpss maintained S&P credit rating upgrade from BBB to BBB+ Completed
For personal use only
 Good morning, and welcome to the GPT Metro Office Fund Annual Results for 2015. In recognition of GPT s commitment to a Reconciliation Action Plan, I would like to acknowledge and pay respect to the traditional
ASX/Media Announcement
 ASX/Media Announcement 13 February 2018 Propertylink delivers a strong HY18 result, well positioned to deliver FY18 guidance Propertylink Group (ASX:PLG) today announces strong financial and operational
For personal use only
 ASX ANNOUNCEMENT Abacus Property Group 2015 Full Year Results Results highlights The Group s consolidated AIFRS statutory profit is $133.5 million up 23.3% from $108.3 million in FY14 Abacus underlying
AGM PRESENTATION ǀ NOVEMBER 2017 ǀ PAGE 1 ANNUAL GENERAL MEETING
 AGM PRESENTATION ǀ NOVEMBER 2017 ǀ PAGE 1 ANNUAL GENERAL MEETING NOVEMBER 2017 KEY PERFORMANCE METRICS FOR FY17 OPERATIONAL FINANCIAL CAPITAL MANAGEMENT STRATEGIC GROWTH 3,077 settlements Up 7% $44.8m
OPERATIONAL HIGHLIGHTS
 Dexus (ASX:DXS) ASX release 14 February 2018 2018 Half year results Positive momentum Dexus today announced a strong result for the first six months of FY18 and upgraded its guidance for distribution per
THIRD PARTY FUNDS MANAGEMENT
 THIRD PARTY FUNDS MANAGEMENT DEXUS has attracted over $4.5 billion of third party equity since 2010 from wholesale investors seeking access to quality product and capability to drive portfolio performance.
Property Acquisitions
 Property Acquisitions 7 november 2013 Overview Property Acquisitions I 7 November 2013 I page 1 Strategic acquisitions of quality assets in core locations with value add potential Mirvac has entered into
For personal use only
 17 August 2016 2016 Annual results Positioned for future growth DEXUS Property Group (DEXUS) today posted a strong 2016 financial result, with Funds from Operations and distribution per security growth
ALE Property Group December 2015 Half Year Results 16 February 2016
 ALE Property Group December 2015 Half Year Results 16 February 2016 Somerville Hotel, Somerville, Melbourne, VIC Follow ALE Property on: 1 Contents Results Highlights December 2015 Half Year Results Properties
For personal use only 1H17 RESULTS PRESENTATION
 For personal use only 1H17 RESULTS PRESENTATION KEY PERFORMANCE METRICS FOR 1H17 OPERATIONAL FINANCIAL CAPITAL MANAGEMENT 1,408 settlements Up 10% $19.8m 1H17 operating profit after tax Up 7% 24.8% gearing
Level 7, 200 St Georges Terrace Perth WA 6000 Telephone (08) Facsimile (08)
 Facsimile (08)") 23 August Australian Stock Exchange Limited Exchange Centre Level 4 20 Bridge Street SYDNEY NSW 2000 Dear Sir / Madam Perth Level 7, 200 St Georges Terrace Perth WA 6000 Telephone (08) 9420 1111 Facsimile
23 August Australian Stock Exchange Limited Exchange Centre Level 4 20 Bridge Street SYDNEY NSW 2000 Dear Sir / Madam Perth Level 7, 200 St Georges Terrace Perth WA 6000 Telephone (08) 9420 1111 Facsimile
For personal use only
 Property Group (CMW) Appendix 4D Corporation Limited ABN 44 001 056 980 Half-Year Report Diversified Property Trust ARSN 102 982 598 Period ended CROMWELL PROPERTY GROUP Appendix 4D Half-Year Report For
For personal use only
 INGENIA COMMUNITIES GROUP 2018 Annual General Meeting 13 NOVEMBER 2018 Meeting outline 2 Chairman s welcome NON-EXECUTIVE DIRECTORS CHAIRMAN Jim Hazel DEPUTY CHAIRMAN Rob Morrison DIRECTOR Amanda Heyworth
ASX Announcement and Media Release 20 August 2014
 ASX Announcement and Media Release 20 August 2014 Cedar Woods Properties Limited ASX Code: CWP Cedar Woods FY2014 summary: Record full year profit of $40.3m, up 10.9% on pcp Final fully franked dividend
Federation Centres Information Booklet relating to the proposed
 Federation Centres Information Booklet relating to the proposed For personal use onlymerger with Novion Property Group Contents Letter from the Chairman of Federation Centres 1 Summary of the Merger 2
Please find attached Presenters Notes for the Presentation of Results for the financial half-year ended 31 December 2017.
 21 February 2018 Company Announcements Office Australian Securities Exchange Limited Level 6, 20 Bridge Street Sydney NSW 2000 By electronic lodgment Total Pages: 12 (including covering letter) Dear Sir
CEO Connect Alison Harrop, CFO 21 November Dexus Funds Management Limited ABN AFSL as responsible entity for Dexus
 Alison Harrop, CFO 21 November 2017 Dexus Funds Management Limited ABN 24 060 920 783 AFSL 238163 as responsible entity for Dexus Dexus Overview - Dexus is a top 50 entity on the ASX with a market capitalisation
CREATING NEW EXPERIENCES
 CREATING NEW EXPERIENCES ANNUAL REPORT 2016 ABOUT US From local shopping centres to premium retail destinations that compete on an international stage, we aim to enrich our communities by providing unique
ALE Property Group December 2014 Half Year Results 5 February 2015
 ALE Property Group December 2014 Half Year Results 5 February 2015 The Breakfast Creek Hotel, Brisbane, QLD New: Follow ALE Property on: 1 Contents Highlights December 2014 Half Year Results Properties
MIRVAC GROUP FINANCIAL RESULTS 30 JUNE Mirvac Group is pleased to release its financial results for the year ended 30 June 2010.
 24 August 200 MIRVAC GROUP FINANCIAL RESULTS 30 JUNE 200 Mirvac Group is pleased to release its financial results for the year ended 30 June 200. The financial results pack includes: > Appendix 4E > ASX
For personal use only
 GROWTHPOINT PROPERTIES AUSTRALIA TRUST ARSN 120 121 002 GROWTHPOINT PROPERTIES AUSTRALIA LIMITED ABN 33 124 093 901 AFSL 316409 ASX ANNOUNCEMENT GROWTHPOINT PROPERTIES AUSTRALIA (ASX Code: GOZ) RESULTS
Annual report - 30 June 2018
 Annual report - 30 June Contents Page FINANCIAL STATEMENTS Financial statements statement of comprehensive income 59 balance sheet 60 statement of changes in equity 61 statement of cash flows 62 63 Directors'
XX October 2012 MAY 2014 BRISBANE ACQUISITION AND EQUITY RAISING FINANCIAL RESULTS. For the Year Ended 30 June 2012
 XX October 2012 BRISBANE ACQUISITION 2012 AND EQUITY RAISING MAY 2014 FINANCIAL RESULTS For the Year Ended 30 June 2012 1 Presentation Outline Transaction Overview Strategic Rationale Brisbane Market Upper
For personal use only
 ASX ANNOUNCEMENT 26 AUGUST 2015 FOLKESTONE FY15 RESULTS STRONG RESULTS ACROSS FUNDS MANAGEMENT AND DEVELOPMENT Net profit after tax of $7.0 million 1, up 122.6% on FY14 Earnings per share of 1.1 cents,
Record after-tax profit delivered in strong year
 NZX RELEASE 16 May 2016 Record after-tax profit delivered in strong year Kiwi Property today announced a record result, delivering an after-tax profit of $250.8 million 1 for the year ended 31 March 2016,
HY17 Results Presentation
 Artist s impression of Ashfield Central residential development, Sydney NSW It s all about the property HY17 Results Presentation HY17 financial summary 14 Martin Place, Sydney NSW Statutory profit Underlying
For personal use only
 HFA Holdings Limited For the six months ended 31 December 2015 ASX Appendix 4D Results for announcement to the market (all comparisons to the six months ended 31 December 2014) Amounts in USD 000 31 December
The Directors of Keppel REIT Management Limited, as Manager of Keppel REIT, are pleased to announce
 MEDIA RELEASE Unaudited Results of Keppel REIT for the First Quarter Ended 31 March 2016 14 April 2016 The Directors of Keppel REIT Management Limited, as Manager of Keppel REIT, are pleased to announce
INTERIM RESULTS 31 DECEMBER 2016
 INTERIM RESULTS 31 DECEMBER 2016 BUILDING A HEALTHY FUTURE 23 February 2017 David Carr, Chief Executive Officer Stuart Harrison, Chief Financial Officer AGENDA Highlights Strategy Financials Portfolio
Australian Education Trust
 Australian Education Trust ASX ANNOUNCEMENT 18 February 2014 AET Results for the Half-Year Ended 31 December 2013 Folkestone Investment Management Limited (FIML) as the Responsible Entity of the Australian
Fund Update, Outlook and Liquidity Event
 24 December 2018 Fund Update, Outlook and Liquidity Event APN Funds Management Limited ACN 080 674 479 (APN FM) as responsible entity of the APN Regional Property Fund ARSN 110 488 821 (NSX:APR) (Fund)
NATIONAL STORAGE REIT (NSR) CONSOLIDATED FINANCIAL STATEMENTS FOR THE HALF-YEAR ENDED 31 DECEMBER 2018
 CONSOLIDATED FINANCIAL STATEMENTS FOR THE HALF-YEAR ENDED 31 DECEMBER 2018") NSR NATIONAL STORAGE REIT (NSR) CONSOLIDATED FINANCIAL STATEMENTS FOR THE HALF-YEAR ENDED 31 DECEMBER 2018 National Storage Holdings Limited ACN 166 572 845 National Storage Financial Services Limited
NSR NATIONAL STORAGE REIT (NSR) CONSOLIDATED FINANCIAL STATEMENTS FOR THE HALF-YEAR ENDED 31 DECEMBER 2018 National Storage Holdings Limited ACN 166 572 845 National Storage Financial Services Limited
September 2018 quarterly update Vicinity Centres September 2018 quarterly update 31 October 2018
 DFO Perth, WA September 2018 quarterly update 31 October 2018 Executing on strategy over the quarter Portfolio quality enhanced and active approach to capital management Advancing portfolio enhancement
Goldman Sachs Ninth Annual Mid-Cap Conference
 Presented by Simon Owen, CEO 17 APRIL 2018 INGENIA COMMUNITIES GROUP Goldman Sachs Ninth Annual Mid-Cap Conference Contents Business overview 3 1H18 results highlights 7 Capital management 8 Future growth
It is therefore pleasing to report that this evolution of BOQ has continued throughout this financial year.
 1 2 Good morning everyone. I will start with the highlights of the results. The strategy we have been implementing in the past few years has transformed BOQ into a resilient, multi-channel business that
development by mirvac 17 MAY 2011 era pacific place, chatswood, nsw
 development by mirvac 17 MAY 2011 era pacific place, chatswood, nsw agenda Introduction Development Strategy Presentation Residential Market Update nicholas Collishaw, Managing Director Brett Draffen,
ASX ANNOUNCEMENT GROWTHPOINT PROPERTIES AUSTRALIA (ASX Code: GOZ)
") ASX ANNOUNCEMENT GROWTHPOINT PROPERTIES AUSTRALIA (ASX Code: GOZ) Presentation to the combined Annual General Meeting and General Meeting Pursuant to ASX Listing Rule 3.13.3, the Chairman s and Managing
ASX ANNOUNCEMENT GROWTHPOINT PROPERTIES AUSTRALIA (ASX Code: GOZ) Presentation to the combined Annual General Meeting and General Meeting Pursuant to ASX Listing Rule 3.13.3, the Chairman s and Managing
Aveo Records Strong Performance in FY17 and Introduces New Initiatives
 16 August 2017 Aveo Records Strong Performance in FY17 and Introduces New Initiatives Australia s leading owner, operator and manager of retirement communities, Aveo Group (ASX: AOG) today released its
QUARTERLY UPDATE FOR PERIOD ENDING 30 JUNE 2018 FUND FACTS FUND HIGHLIGHTS PORTFOLIO UPDATE PORTFOLIO SUMMARY
 (ARSN 163 688 346) QUARTERLY UPDATE FOR PERIOD ENDING 30 JUNE 2018 All data is at 30 June 2018 unless otherwise stated. FUND HIGHLIGHTS Distribution of 2.10 cents per Unit Portfolio occupancy had a marginal
ANNUAL RESULTS 30 JUNE 2015
 ANNUAL RESULTS 30 JUNE 2015 SECURING TODAY, WITH A FOCUS ON TOMORROW 12 August 2015 David Carr, Chief Executive Officer Stuart Harrison, Chief Financial Officer AGENDA Result summary Financial summary
Annual report - 30 June 2017
 Annual report - 30 June 2017 Contents Page FINANCIAL STATEMENTS Financial statements statement of comprehensive income 57 balance sheet 58 statement of changes in equity 59 statement of cash flows 60 61
Not for distribution or release in the United States or to, or for the account or benefit of, US Persons
 3 December 2008 DEXUS Funds Management Limited ABN 24 060 920 783 AFSL: 238163 Level 9, 343 George Street Sydney NSW 2000 The Manager Australian Stock Exchange Limited 20 Bridge Street Sydney NSW 2000
For personal use only
 APPENDIX 4D Appendix 4D Half Year Report RESULTS FOR ANNOUNCEMENT TO THE MARKET Half Year Report For the period ended 31 December 2014 Name of Entity: (Group). The Group comprises the stapling of the units
2016 FINANCIAL YEAR RESULTS PRESENTATION
 2016 FINANCIAL YEAR RESULTS PRESENTATION 22 August 2016 www.industriareit.com.au ASX CODE: IDR Agenda 01 Highlights and Investment Proposition 02 Financial results 03 Portfolio performance 04 Capital management
HY18 Results Presentation Appendices
 187 Todd Road, Port Melbourne VIC HY18 Results Presentation Appendices Appendix A Segment balance sheet Abacus balance sheet Property Investment Property Development Unallocated HY18 FY17 ($m) ($m) ($m)
For personal use only
 22 August 2018 Company Announcements Office Australian Securities Exchange Limited 20 Bridge Street SYDNEY NSW 2000 By electronic lodgment Total Pages: 6 (including covering letter) Dear Sir / Madam APPENDIX
25 February The Manager Market Announcements Australian Securities Exchange Limited 20 Bridge Street SYDNEY NSW 2000.
 Level 1 157 Grenfell Street Adelaide SA 5000 GPO Box 2155 Adelaide SA 5001 Adelaide Brighton Ltd ACN 007 596 018 Telephone (08) 8223 8000 International +618 8223 8000 Facsimile (08) 8215 0030 www.adbri.com.au
DEXUS Property Group. Institutional placement 3 December m securities at $0.73 to $0.84 raising $286m - $329m
 DEXUS Property Group Institutional placement 3 December 2008 391.7m securities at $0.73 to $0.84 raising $286m - $329m DEXUS Funds Management Limited ABN 24 060 920 783 Australian Financial Services Licence
APPENDIX 4D. Industria Trust No. 1 (ARSN ) Half-Year Report. Half-year ended 31 December 2014
 Half-Year Report. Half-year ended 31 December 2014") Page 1 Appendix 4D Half Year Report Half-year ended 31 December 2014 APPENDIX 4D Industria Trust No. 1 (ARSN 125 862 875) Half-Year Report Half-year ended 31 December 2014 Note on Stapling Arrangement
Page 1 Appendix 4D Half Year Report Half-year ended 31 December 2014 APPENDIX 4D Industria Trust No. 1 (ARSN 125 862 875) Half-Year Report Half-year ended 31 December 2014 Note on Stapling Arrangement
Good morning and thank you for joining us for the 2012 GPT Annual Result presentation.
 1 Good morning and thank you for joining us for the 2012 GPT Annual Result presentation. Today I will talk about the performance of the business in 2012, as well as our strategy and outlook for 2013. Mark
Goldman Sachs JBWere Australasian Investment Forum
 Goldman Sachs JBWere Australasian Investment Forum March 2006 Matthew Quinn Managing Director Presentation Outline Australian REIT Sector & Stockland s Position Stockland s Business Model Financial Performance
Half Year Financial Results
 10 August 2017 Manager ASX Market Announcements Australian Securities Exchange Level 4, 20 Bridge Street Sydney NSW 2000 Client and Market Services Team NZX Limited Level 1, NZX Centre, 11 Cable Street
APPENDIX 4D. Half year Financial Report Half Year ended 31 December 2014
 P a g e 1 A p p e n d i x 4 D H a l f Y e a r R e p o r t H a l f Y e a r e n d e d 3 1 D e c e m b e r 2 0 1 4 APPENDIX 4D Half year Financial Report Half Year ended 31 December Name of Entity: Ingenia
Abacus Funds Management
 Abacus Funds Management FY10 First Half Review May 2010 Introduction After a very challenging year during 2009, I am pleased to be writing to you in early 2010 with positive signs emerging of improved
FKP Property Group 2013 Annual General Meeting. 1 November 2013
 FKP Property Group 2013 Annual General Meeting 1 November 2013 Agenda Aveo Oak Tree Hill Glen Waverly, VIC 1. Chairman s Address 2. Chief Executive Officer s Address 3. Securityholder Resolutions 4. Questions
INTERIM FINANCIAL REPORT
 INTERIM FINANCIAL REPORT 31 DECEMBER 2016 VILLA WORLD LIMITED ABN 38 117 546 326 CELEBRATING 30 YEARS SUCCESS THROUGH PROPERTY Villa World Limited ABN 38 117 546 326 Interim Financial Report - 31 December
GPT Quarterly Update SEPTEMBER 2012
 GPT Quarterly Update SEPTEMBER 2012 MICHAEL CAMERON CEO AND MANAGING DIRECTOR CALENDAR September quarter distribution payment: 16 November 2012 2012 Annual Result announcement: February 2013 December quarter
An investor/analyst briefing teleconference call, with a question and answer session, will be held on 4 August 2016 at 10:00am AEST (8.00am AWST).
.") 4 August 2016 The Manager Company Announcements Office Australian Securities Exchange Limited Level 4 20 Bridge Street SYDNEY NSW 2000 Dear Sir/Madam BWP results for the full-year ended 30 June 2016 In
4 August 2016 The Manager Company Announcements Office Australian Securities Exchange Limited Level 4 20 Bridge Street SYDNEY NSW 2000 Dear Sir/Madam BWP results for the full-year ended 30 June 2016 In
Australian Unity Office Fund
 Australian Unity Office Fund (ASX: AOF) 2018 Full Year Results Presentation 24 August 2018 Webcast: https://fnn.webex.com/fnn/onstage/g.php?mtid=e0f48b0535622fe807610ffb3ef1ac4ab Teleconference details:
Company Results Half Year ended 4 January 2009
 Michael Luscombe Chief Executive Officer Tom Pockett Finance Director Company Results Half Year ended 4 January 2009 Highlights Financial Half Year 09 This is a strong result reflecting increasing customer
For personal use only
 CPT Global Limited and Controlled Entities ABN 16 083 090 895 Financial Report for the half year ended 31 December 2017 cptglobal.com Contents Directors' Report 2 Auditor s Independence Declaration 5 Consolidated
Abacus Proper t y Group
 Abacus Proper t y Group SECURITYHOLDER REVIEW 2018 Contents 01 About Abacus 04 Financial highlights 06 Chairman and Managing Director s report 10 Group performance 12 Group performance office 13 Group
Overview & Development
 INGENIA COMMUNITIES GROUP Overview & Development 2018 Investor Tour Table of Contents 1 Simon Owen, CEO Business Overview Guidance Update Development Overview Latitude One Overview 2 Craig Shepherd, Project
Lifestyle Communities Limited ABN And Controlled Entities. Half Year Information For the six months ended 31 December 2011
 Lifestyle Communities Limited ABN 11 078 675 153 And Controlled Entities Half Year Information For the six months ended 31 December 2011 Provided to the ASX under Listing Rule 4.2A This half year financial
INTERIM RESULTS 31 DECEMBER 2014
 INTERIM RESULTS 31 DECEMBER 2014 DEVELOPING OUR PORTFOLIO DELIVERING ON STRATEGY 26 February 2015 David Carr, Chief Executive Officer Stuart Harrison, Chief Financial Officer AGENDA Result summary Financial
In accordance with the Listing Rules, I enclose a letter to Shareholders, for release to the market.
 16 February 2018 The Manager Market Announcements Office Australian Securities Exchange 4 th Floor, 20 Bridge Street SYDNEY NSW 2000 Office of the Company Secretary Level 41 242 Exhibition Street MELBOURNE
For personal use only
 Appendix 4D Results for announcement to the market (ACN 104 113 760) This half-year report is provided to the Australian Securities Exchange (ASX) under ASX listing Rule 4.2A.3. Current reporting period:
In accordance with ASX Listing Rule 4.2A, the following documents are attached for release to the market:
 7 February 2018 The Manager Market Announcements Office Australian Securities Exchange 20 Bridge St Sydney NSW 2000 Dear Sir BWP Trust results for the half year ended 31 December 2017 In accordance with
APPENDIX 4D. For the half-year ended 31 December 2017
 Appendix 4D Interim Report APPENDIX 4D Interim Report For the half-year ended 31 December 2017 Name of entity Aventus Retail Property Fund ARSN 608 000 764 Explanation of reporting periods The interim
Presented by Simon Owen 20 September Ingenia Lifestyle South West Rocks INGENIA COMMUNITIES GROUP ASX CEO SESSIONS
 Presented by Simon Owen 20 September 2016 Ingenia Lifestyle South West Rocks INGENIA COMMUNITIES GROUP ASX CEO SESSIONS Page 2 Business Overview Creating Australia s best lifestyle communities Over 5,000
2018 WA State Budget Analysis
 2018 WA State Budget Analysis Our Vision All people living in Western Australia have housing that enables them to thrive 17 th May 2018 Level 1, 33 Moore Street, East Perth 6000 08 9325 6660 www.shelterwa.org.au
Infratil Full Year Results Presentation 18 MAY 2016
 Infratil 2016 Full Year Results Presentation 18 MAY 2016 Full Year Overview Successful divestments lead to record net surplus and opportunity for renewal Record net parent surplus of $438 million boosted
11 February 2019 Charter Hall Long WALE REIT FY19 Half Year Results 6 months to 31 December 2018 Optima Centre, Perth, WA
 11 February 2019 Charter Hall Long WALE REIT FY19 Half Year Results 6 months to 31 December 2018 Optima Centre, Perth, WA 2019 half year results Agenda 1. FY19 half year highlights 3 2. Financial performance
Lloyds TSB Group plc. Results for half-year to 30 June 2007
 Lloyds TSB Group plc Results for half-year to 2007 CONTENTS Page Key operating highlights 1 Summary of results 2 Profit analysis by division 3 Group Chief Executive s statement 4 Group Finance Director
Affinity Education Group. Half Year Results
 Affinity Education Group Half Year Results 29 August 2014 Disclaimer This presentation contains general information in summary form which is current as at 29 August 2014. It presents financial information
Infratil 2017 Full Year Result. 18 May 2017
 Infratil 2017 Full Year Result 18 May 2017 Full Year Overview Capital deployment, new platforms and second-half tail winds feature in FY17 Net parent surplus for the year was $66.1 million compared to
Profit Announcement. For the six months ended 31 March 2007
 Profit Announcement For the six months ended 3 March 2007 Incorporating the requirements of Appendix 4D This interim profit announcement has been prepared for distribution in the United States of America
by mirvac 1H12 results 21 february 2012 artist impression of harold park, Glebe, nsw
 by mirvac 1H12 results 21 february 2012 artist impression of harold park, Glebe, nsw agenda mirvac s strategy Key 1H12 Achievements Financial Highlights and capital management Corporate Responsibility
2 November 2011 MIRVAC FIRST QUARTER OPERATIONAL UPDATE
 2 November 2011 MIRVAC FIRST QUARTER OPERATIONAL UPDATE Today, Mirvac Group ( Mirvac or the Group ) [MGR.ASX] held its FY12 Q1 Operational Update and reaffirmed its forecast operating EPS guidance of 10.5
Full Year Results 2016
 Full Year Results 2016 18 August 2016 Your Community Developer 2 Contents Highlights 3 Results and capital management 4 Business model and strategy 10 Project portfolio 20 Industry and company outlook
Good morning. I m delighted to be here in New York and to have the opportunity to
 Good morning. I m delighted to be here in New York and to have the opportunity to speak to you about Suncorp. Today, I ll Ill give you a quick overview of who we are and where we have come from. I ll briefly