Full-year results. 20 August 2014
|
|
|
- Horace Barton
- 5 years ago
- Views:
Transcription
1 Full-year results 20 August 2014
2 Overview & Results Highlights Tom Gorman, CEO 2
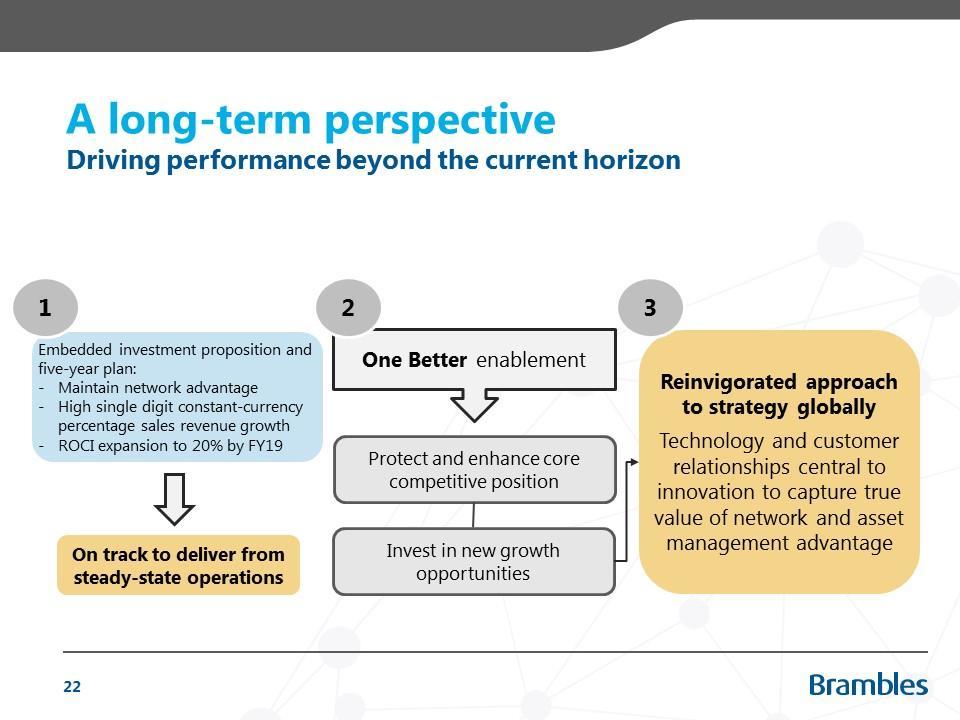
3 Key messages Strategy on track and positive outlook for FY15 Sales revenue growth and Underlying Profit delivered in line with guidance Pallets: constant-currency sales and profit growth across all regions with strong operational efficiencies delivered in Europe; on track for further growth and efficiencies RPCs: accelerated second-half sales revenue growth reflecting ongoing investment and improving momentum; return to profit growth in FY15 Containers: strong contribution from Pallecon acquisition and improved margin performance; outlook for continued improvement in FY15 Flat FY14 ROCI outcome but on track for FY19 target of at least 20% One Better program under way Reduction in overheads/sales ratio of at least 2 percentage points by FY19 Savings to drive re-investment in growth and innovation FY15 percentage growth in sales revenue consistent with five-year target at high single digits (constant currency) FY15 Underlying Profit guidance of US$1,030M to US$1,060M (at 30 June 2014 FX rates) reflecting 7% to 10% 1 growth 1 FY14 Underlying Profit of US$960M at actual rates translates to US$965M at 30 June 2014 foreign exchange rates 3
4 Key financials Solid underlying performance (Continuing operations) FY14 result Change vs. FY13 (Actual FX) (Constant FX) Sales revenue US$5,405M 6% 7% Operating profit US$930M 5% 5% Profit after tax US$585M 5% 4% Underlying Profit US$960M 5% 6% Underlying basic earnings per share US % 5% Return on Capital Invested 16.3% (0.1) pts - Brambles Value Added 1 US$267M US$20M Cash Flow from Operations US$828M US$131M Final dividends per share AU Calculated at 30 June 2013 foreign exchange rates. 4
5 Delivery scorecard Performance consistent with five-year targets Objective FY14 constant-currency sales revenue growth of 7% US$100M of Pallets efficiencies and IFCO synergies by FY15 Progress Delivered US$66M delivered to FY14 (below target); remainder to be delivered in FY15 Pallets EMEA Underlying Profit margins of 22-23% by FY14 FY14 Underlying Profit margin of 23% Underlying Profit: US$ M (30 June 2013 FX rates) Consistent improvement in Group ROCI to >20% by FY19 Dividends per share maintained at FY13 levels ex-recall FY14 Underlying Profit translates to US$947M (30 June 2013 FX rates) RPCs profitability impacts FY14 performance but on track for FY19 FY14 total dividends in line with FY13 FY19 Targets (prior to acquisitions/ divestments) Constant-currency sales revenue growth in high single digits (i.e. 7% to 9%) Average Capital Invested compound annual growth rate of 5% Consistent improvement in Group ROCI to at least 20% by FY19 5
6 Group sales revenue growth analysis Solid contribution from all segments (US$M) (31) ,436 5,405 5,083 FY13 Pallets: net new business Pallets: organic volume, price, mix RPCs Containers (excluding acquisitions) Acquisitions FY14 (constant FX) FX FY14 6
7 Constant-currency growth Net new business wins (Pallets) Momentum improving for FY15 7% Composition of Pallets sales revenue growth Implied forward contribution of prior year rollover (US$M) 6% 70 5% % 40 3% 30 2% 20 1% 10 0% FY12 FY13 FY14 0 FY13 FY14 FY15 estimate Organic volume, price, mix Net new business Americas EMEA Asia-Pacific Note: all growth shown pro forma to normalise for impact of acquisitions 7
8 Pallets segment result summary ROCI improvement and strong Europe performance US$M FY14 Change vs FY13 Actual FX Constant FX Americas 2,302 4% 6% EMEA 1,447 7% 5% Asia-Pacific 374 (4)% 4% Sales revenue 4,123 5% 5% Operating profit 822 8% 9% Underlying Profit 838 7% 9% ROCI 21.2% 0.8 pts 0.8 pts Improved North America and Europe underlying conditions Net new business wins contribution of 2% sales revenue growth Emerging markets constant-currency sales revenue up 14% Strong Europe result: efficiencies and pricing/mix benefits Higher US direct costs being driven by improved asset management Continued sales, profit and ROCI improvements in FY15 8
9 RPCs segment results summary Sales growth improving; one-offs and short-term profit impacts US$M FY14 Change vs FY13 Actual FX Constant FX Europe % 9% North America 174 7% 7% ANZ & South Africa 119 1% 12% South America 22-23% Sales revenue % 9% Operating profit 124 (10)% (10)% Underlying Profit 124 (10)% (10)% ROCI 7.9% (1.6) pts (1.4) pts Improved second-half sales momentum in North America Strong growth contribution from all other regions One-off impacts in first half as disclosed in February Higher depreciation and marketing costs, price/mix impacts Continued investment in North America to support scale and growth Confident of sales growth and return to profit growth in FY15 9
10 Containers segment result summary Improved margins with stronger sales growth outlook for FY15 US$M FY14 Change vs FY13 Actual FX Constant FX Automotive Solutions 162 8% 8% Pallecon Solutions % 52% Aerospace Solutions 65 10% 9% Catalyst & Chemical Containers 41 9% 11% Sales revenue % 19% Operating profit 36 28% 34% Underlying Profit 38 34% 39% ROCI 8.8% 0.5 pts 0.9 pts 7% constant-currency sales revenue growth without acquisitions Strong full-year growth performance from CCC Automotive Europe and China growth offsetting decline in Australia Modest growth in Aerospace expected to improve in FY15 Positive leverage of overheads across the segment FY15: Transpac contribution, continued improvement in existing businesses 10
11 Financial Analysis Zlatko Todorcevski, CFO 11
12 Group operating profit growth analysis Positive performance but cost challenges remain (US$M) (81) (39) (11) FY13 Volume, price, mix Acquisitions Operational efficiencies Direct costs Other Significant Items FY14 (constant FX) FX FY14 12
13 Total pooling equipment capex (US$M) DIN/sales revenue Pallets asset efficiency metrics Improving replacement capex trend sustained Replacement/growth capex (left-hand side) and DIN ratio (right-hand side) % % 12% % 500 8% % 4% 2% 200 FY10 FY11 FY12 FY13 FY14 Replacement Growth DIN/sales revenue 0% Note: DIN is depreciation, IPEP expense and net book value of compensated assets and scraps, which is used as a proxy for replacement capex; comparisons exclude IFCO Pallet Management Services business 13
14 Pallets plant cost ratio Efficiencies in Europe offset by high US repair costs 44% Plant costs to sales revenue 40% 36% 32% 28% 24% FY10 FY11 FY12 FY13 FY14 Americas Americas ex. PMS EMEA Asia-Pacific Total 14
15 Pallets Americas operating profit analysis Asset management improvement driving higher repair costs (US$M) (45) Reduced IPEP expense 9 (12) (9) Higher repair intensity Transport and depreciation 415 Profitable sales growth in CHEP Margin contraction in PMS FY13 Volume, price, mix Operational efficiencies Direct costs Other Significant Items FY14 (constant FX) FX FY14 15
16 Pallets EMEA operating profit analysis Strong result; positive operating leverage (US$M) Ahead of target with supply-chain efficiencies 41 8 (1) (8) 15 7 Impairments to enable introduction of German quarter pallet Positive operating leverage Stronger organic conditions Pricing and mix benefits FY13 Volume, price, mix Operational efficiencies Direct costs Other Significant Items FY14 (constant FX) FX FY14 16
17 RPCs operating profit analysis Second-half rebound in sales growth (US$M) Increased depreciation Higher plant and transport costs 26 (20) (19) <1 (1) 138 IFCO CEO/CFO retirement Higher marketing costs South America impairment Investment for growth Organic volume growth in all regions Strong roll-outs with new retailers FY13 Volume, price, mix Direct costs Other Significant Items FY14 (constant FX) FX FY14 17
18 Improved operating cash flow Solid result driven by EBITDA and working capital movement (US$M) FY14 FY13 Change EBITDA 1,488 1, Capital expenditure (854) (846) (8) Proceeds from sale of PP&E (22) Working capital movement 11 (49) 60 IPEP expense (14) Provisions/other 17 (19) 36 Cash Flow from Operations Significant Items (21) (42) 21 Discontinued operations (46) 160 (206) Financing costs and tax (330) (306) (24) Free Cash Flow (78) Dividends paid (394) (426) 32 Free Cash Flow after dividends (46) 18
19 Strong balance sheet position Supported by recent 500M European medium-term note issue June 2014 June 2013 Net debt (US$) 2,362 2,714 Average term of committed facilities (years) FY14 1 FY13 2 EBITDA/net finance costs (x) Net debt/ebitda (x) For FY14, based on continuing operations 2 For prior year comparative, based on continuing and discontinued operations 19
20 One Better program execution Three key streams driving a more sustainable business Better Buying ~30% of cost-outs delivered Aligning procurement activities Focus on both direct and indirect costs US$100M cost-outs delivered vs. FY14 At least 2 percentage point reduction in overheads to sales revenue ratio Better for our Business Simplifying internal reporting Aligning global functions One Finance, One HR, One IT, global strategy Better for our Customers Refining our customer value proposition Improving customer touch points Asset management as a competitive advantage Approximately US$80M combined opex and capex through life of program; opex to be taken as Significant Items FY15 FY16 FY17 FY18 FY19 20
21 Strategy & Outlook Tom Gorman, CEO 21
22 22
23 23
24 Outlook for FY15 1 Strong profitable growth with leverage to bottom line Sales revenue in line with five-year target High single digit percentage growth, at constant currency Underlying Profit of US$1,030M to US$1,060M (30 June 2014 FX rates) Equates to growth of 7% to 10% 2 Incremental improvement in ROCI in line with five-year targets Net finance costs broadly in line with FY14 Effective underlying tax rate of 29% (after finance costs) No change to progressive dividend policy Anticipating positive Free Cash Flow after dividends before Significant Items 1 All guidance is subject to the Disclaimer on Slide 26 2 On a comparable basis (i.e. at 30 June 2014 FX rates) FY14 underlying Profit of US$960M translates to US$965M 24
25 Q&A
26 Disclaimer The release, publication or distribution of this presentation in certain jurisdictions may be restricted by law and therefore persons in such jurisdictions into which this presentation is released, published or distributed should inform themselves about and observe such restrictions. This presentation does not constitute, or form part of, an offer to sell or the solicitation of an offer to subscribe for or buy any securities, nor the solicitation of any vote or approval in any jurisdiction, nor shall there be any sale, issue or transfer of the securities referred to in this presentation in any jurisdiction in contravention of applicable law. Persons needing advice should consult their stockbroker, bank manager, solicitor, accountant or other independent financial advisor. Certain statements made in this presentation are forward-looking statements. These forward-looking statements are not historical facts but rather are based on Brambles current expectations, estimates and projections about the industry in which Brambles operates, and beliefs and assumptions. Words such as "anticipates," "expects," "intends," "plans," "believes," "seeks, "estimates," and similar expressions are intended to identify forward-looking statements. These statements are not guarantees of future performance and are subject to known and unknown risks, uncertainties and other factors, some of which are beyond the control of Brambles, are difficult to predict and could cause actual results to differ materially from those expressed or forecasted in the forward-looking statements. Brambles cautions shareholders and prospective shareholders not to place undue reliance on these forward-looking statements, which reflect the view of Brambles only as of the date of this presentation. The forward-looking statements made in this presentation relate only to events as of the date on which the statements are made. Brambles will not undertake any obligation to release publicly any revisions or updates to these forward-looking statements to reflect events, circumstances or unanticipated events occurring after the date of this presentation except as required by law or by any appropriate regulatory authority. 26
27
Half-Year 2017 Results. 20 February 2017
 Half-Year 2017 Results 20 February 2017 Overview & Results Highlights Tom Gorman Key messages Sales revenue growth of 5% at constant currency, reflecting growth in every operating segment despite some
COPIES OF SLIDES FOR INVESTOR PRESENTATION AND WEBCAST
 Brambles Limited ABN 89 118 896 021 Level 40 Gateway 1 Macquarie Place Sydney NSW 2000 Australia GPO Box 4173 Sydney NSW 2001 Tel +61 2 9256 5222 Fax +61 2 9256 5299 www.brambles.com 16 August 2012 The
Financial Year 2015 Results. 20 August 2015
 Financial Year 2015 Results 20 August 2015 Overview and Results Highlights Tom Gorman, CEO 2 Key points: FY15 result In line with guidance amid challenging conditions Sales revenue up 8% and Underlying
Half-Year 2016 Results. 22 February 2016
 Half-Year 2016 Results 22 February 2016 Overview and Results Highlights Tom Gorman, CEO 2 Group safety performance 25 Brambles Injury Frequency Rate (per million man hours) 20 15 10 5 0 FY11 FY12 FY13
17 November The Manager-Listings Australian Securities Exchange Limited Exchange Centre 20 Bridge Street SYDNEY NSW 2000
 Brambles Limited ABN 89 118 896 021 Level 40 Gateway 1 Macquarie Place Sydney NSW 2000 Australia GPO Box 4173 Sydney NSW 2001 Tel +61 2 9256 5222 Fax +61 2 9256 5299 www.brambles.com 17 November 2015 The
Investor Information Pack. February 2015
 Investor Information Pack February 2015 Contents Overview Slide 3 Strategy Slide 13 1H15 results Slide 23 Appendices Slide 45 Contacts Slide 69 2 Overview Company profile Brambles Limited is a supply-chain
Full-Year 2016 Results. 18 August 2016
 Full-Year 2016 Results 18 August 2016 Overview Tom Gorman, CEO 2 Group safety performance 25 Brambles Injury Frequency Rate (per million man hours) 20 15 10 5 0 FY12 FY13 FY14 FY15 FY16 3 Key messages
Investor Information Pack August 2013
 Investor Information Pack August 2013 Contents Company Overview Slide 3 Pooling Solutions Overview Slide 7 Pallet Pooling Models Slide 24 FY13 Results Presentation Slide 29 Contacts Slide 86 2 Company
Brambles reports results for the half-year ended 31 December 2017
 Brambles Limited ABN 89 118 896 021 Level 10, 123 Pitt Street Sydney NSW 2000 Australia GPO Box 4173 Sydney NSW 2001 Tel +61 2 9256 5222 Fax +61 2 9256 5299 www.brambles.com 19 February 2018 The Manager
For personal use only
 Brambles Limited ABN 89 118 896 021 Level 40 Gateway 1 Macquarie Place Sydney NSW 2000 Australia GPO Box 4173 Sydney NSW 2001 Tel +61 2 9256 5222 Fax +61 2 9256 5299 www.brambles.com The Manager - Listings
Annual General Meeting. 11 October 2012
 Annual General Meeting 11 October 2012 Graham Kraehe AO Chairman FY12 results: guidance delivered; growth strategy momentum Sales revenue up 20% to US$5,625 million IFCO contribution, new customer wins,
Full-Year 2017 Results. 21 August 2017
 Full-Year 2017 Results 21 August 2017 Overview & Results Highlights Graham Chipchase Key messages Strong sales revenue growth in all operating segments Underlying Profit broadly in line with updated guidance,
Formation of Oil & Gas Containers Joint Venture. 5 August 2016
 Formation of Oil & Gas Containers Joint Venture 5 August 2016 Transaction rationale Ferguson Group and CHEP Catalyst & Chemical Containers (CCC) combined with Hoover Container Solutions to form HFG HFG
Annual General Meeting. 18 October 2017
 Annual General Meeting 18 October 2017 2 A poll is being held on all resolutions at this meeting. If leaving early, place completed voting cards in the ballot boxes by the exit doors. Stephen Johns Chairman
Half-Year 2019 Results. 18 February 2019
 Half-Year 2019 Results 18 February 2019 Results highlights Graham Chipchase Key messages Sales revenue growth of 7% 1 reflecting strong volume momentum across all segments and improved price realisation
Attached is an ASX and Media Release from Brambles Limited on its financial results for the year ended 30 June 2018.
 Brambles Limited ABN 22 000 129 868 Level 10 Angel Place 123 Pitt Street Sydney NSW 2000 Australia GPO Box 4173 Sydney NSW 2001 Tel +61 2 9256 5222 Fax +61 2 9256 5299 www.brambles.com 24 August 2018 The
Full-Year 2018 Results. 24 August 2018
 Full-Year 2018 Results 24 August 2018 Results highlights Graham Chipchase Key messages Strong revenue growth, dividends fully funded by Free Cash Flow Sales revenue growth of 6% 1 : Volume momentum in
Brambles reports results for the half-year ended 31 December 2014
 Brambles Limited ABN 89 118 896 021 Level 40 Gateway 1 Macquarie Place Sydney NSW 2000 Australia GPO Box 4173 Sydney NSW 2001 Tel +61 2 9256 5222 Fax +61 2 9256 5299 www.brambles.com 23 February 2015 The
INDEPTH RESEARCH NOTE Brambles Ltd Buy
 Phone 1300 980 849 Email research@tradingequities.com.au INDEPTH RESEARCH NOTE Brambles Ltd Buy Price: A$9.74 Price Target: A$10.65 ASX: BXB 20 February 2018 Brambles (BXB) 1H18 results were mixed in our
Brambles reports results for the half-year ended 31 December 2017
 Brambles Limited ABN 89 118 896 021 Level 10, 123 Pitt Street Sydney NSW 2000 Australia GPO Box 4173 Sydney NSW 2001 Tel +61 2 9256 5222 Fax +61 2 9256 5299 www.brambles.com 19 February 2018 The Manager
UBS Investment Research Brambles Limited
 UBS Investment Research Brambles Limited FY12 result: strong revenue momentum Result highlights strong revenue momentum Brambles FY12 result was slightly ahead of expectations, revealing 11% underlying
ANNUAL GENERAL MEETING
 ANNUAL GENERAL MEETING CEO Presentation 29 TH October 2018 Disclaimer The material in this presentation has been prepared by Bapcor Limited ( Bapcor ) ABN 80 153 199 912 and is general background information
BRAMBLES TO STRENGTHEN POSITION AS A GLOBAL LEADER IN POOLING SOLUTIONS THROUGH 923 MILLION ACQUISITION OF IFCO SYSTEMS
 Brambles Limited ABN 89 118 896 021 Level 40 Gateway 1 Macquarie Place Sydney NSW 2000 Australia GPO Box 4173 Sydney NSW 2001 Tel +61 2 9256 5222 Fax +61 2 9256 5299 www.brambles.com The Manager-Listings
15 February The Manager - Listings Australian Securities Exchange Limited Exchange Centre 20 Bridge Street SYDNEY NSW 2000
 Brambles Limited ABN 89 118 896 021 Level 40 Gateway 1 Macquarie Place Sydney NSW 2000 Australia GPO Box 4173 Sydney NSW 2001 Tel +61 2 9256 5222 Fax +61 2 9256 5299 www.brambles.com 15 February 2011 The
FOCUS ON CORE DRIVERS OF VALUE
 Annual Report 2017 FOCUS ON CORE DRIVERS OF VALUE www.brambles.com Contents Letter from the Chairman 2 Letter from the CEO 3 Operating & Financial Review 4 Board & Executive Leadership Team 17 Directors
For personal use only
 Brambles Limited ABN 89 118 896 021 Level 40 Gateway 1 Macquarie Place Sydney NSW 2000 Australia GPO Box 4173 Sydney NSW 2001 Tel +61 2 9256 5222 Fax +61 2 9256 5299 www.brambles.com 9 September 2014 The
Acquisition of Ferguson Group. 9 September 2014
 Acquisition of Ferguson Group 9 September 2014 Strategic highlights Continuing our expansion in specialist containers Ferguson Group is a leading provider of container solutions (mostly cargocarrying units)
Brambles announces decision to retain Recall and A$448M pro rata entitlement offer
 Brambles Limited ABN 89 118 896 021 Level 40 Gateway 1 Macquarie Place Sydney NSW 2000 Australia GPO Box 4173 Sydney NSW 2001 Tel +61 2 9256 5222 Fax +61 2 9256 5299 www.brambles.com The Manager - Listings
TI Fluid Systems plc Results Presentation for TI Fluid Systems plc 20 March 2018
 2017 Results Presentation for 20 March 2018 Disclaimer This presentation contains certain forward-looking statements with respect to the financial condition, results of operations and business of (the
Annual Report
 Annual Report 2013 www.brambles.com Brambles Annual Report 2013 - Page 1 Brambles Limited is a supply-chain logistics company operating in more than 50 countries, primarily through the CHEP and IFCO brands.
FY2018 Results Presentation
 FY2018 Results Presentation Disclaimer The material in this presentation has been prepared by Bapcor Limited ( Bapcor ) ABN 80 153 199 912 and is general background information about Bapcor s activities
For personal use only. F Y R e s u l t s P r e s e n t a t i o n
 F Y 2 0 1 6 R e s u l t s P r e s e n t a t i o n Our Brands 2 Disclaimer The material in this presentation has been prepared by Bapcor Limited ( Bapcor ) ABN 80 153 199 912 and is general background information
FLAT +3.8% YEAR-END REPORT JANUARY DECEMBER 2017 STRONG Q4 PUTS 2017 CASH FLOW WELL ABOVE EXPECTATIONS JOHAN DENNELIND PRESIDENT & CEO 2.
 YEAR-END REPORT JANUARY DECEMBER 2017 JOHAN DENNELIND PRESIDENT & CEO Q4 STRONG Q4 PUTS 2017 CASH FLOW WELL ABOVE EXPECTATIONS We said: cash flow above SEK 7.5 billion WE DID 9.7bn +0.8bn Q4 (+0.8bn Q4)
Q Results. Lars Brorsen (CEO) Christoph Hobo (CFO) November 22, 2018
 Christoph Hobo (CFO) November 22, 2018") Q3 2018 Results Lars Brorsen (CEO) Christoph Hobo (CFO) November 22, 2018 Agenda 1. Highlights Q3 2018 2. Market outlook 3. Detailed results review 4. Company outlook 5. Q&A Appendix 1 Business summary
Q3 2018 Results Lars Brorsen (CEO) Christoph Hobo (CFO) November 22, 2018 Agenda 1. Highlights Q3 2018 2. Market outlook 3. Detailed results review 4. Company outlook 5. Q&A Appendix 1 Business summary
Investor update Q3 2018
 Investor update Q3 2018 October 17, 2018 Spiced Honey has been unveiled by AkzoNobel as the Color of the Year for 2019. It was selected following expert research into global trends, insights and consumer
Investor & Analyst Presentation Ful YearResults 30 June2016 For personal use only 25th August 2016 Rebekah O Flaherty - CEO I Jonathan Kenny - CFO
 Investor & Analyst Presentation Full YearResults 30 June2016 25th August 2016 Rebekah O Flaherty - CEO I Jonathan Kenny - CFO Agenda 1 Overview 2 Strategic Priorities 3 FY16 Financial Results 4 FY17 Outlook
2Q 2017 Highlights and Operating Results
 2Q 2017 Highlights and Operating Results July 25, 2017 1 2Q 2017 Highlights and Operating Results Table of Contents Page(s) 1 Sales Overview and Highlights 4-5 2 NSS Overview 6-7 3 EES Overview 8-9 4 UPS
Q3 Fiscal Year 2013 Earnings Conference Call
 NASDAQ: CMCO Q3 Fiscal Year 2013 Earnings Conference Call January 25, 2013 Timothy T. Tevens President & Chief Executive Officer Gregory P. Rustowicz Vice President - Finance & Chief Financial Officer
FY18 - Half Year Investor Presentation 22 February 2018
 Who are we? FY18 - Half Year Investor Presentation 22 February 2018 Jonathan Rubinsztein CEO Richard Leon CFO Disclaimer Forward looking statements: All statements other than statements of historical fact
Q EARNINGS CALL FEBRUARY 20, 2018
 Q4 2017 EARNINGS CALL FEBRUARY 20, 2018 1 IMPORTANT INFORMATION Forward Looking Statements These slides contain (and the accompanying oral discussion will contain) forward looking statements. All statements
1Q 2018 Highlights and Operating Results
 1Q 2018 Highlights and Operating Results April 26, 2018 1 Table of Contents Page(s) 4 Announced Agreements to Acquire Australia and New Zealand Security Businesses 5-9 Sales Overview 10-17 Financial Performance
4Q 2018 Highlights and Operating Results. Products. Technology. Services. Delivered Globally.
 4Q 2018 Highlights and Operating Results Products. Technology. Services. Delivered Globally. Table of Contents Page 3 Safe Harbor Statement and Non-GAAP Financial Measures 4 Sales Overview 9 Overview of
Q4 & FY 2017 EARNINGS PRESENTATION MARCH 13, 2018
 Q4 & FY 2017 EARNINGS PRESENTATION MARCH 13, 2018 FORWARD-LOOKING STATEMENTS & NON-GAAP FINANCIAL INFORMATION 2 FORWARD-LOOKING STATEMENTS This presentation contains, and management may make on our call
Fiscal 2018 Fourth Quarter
 Fiscal 2018 Fourth Quarter If you can read this Click on the icon to choose a Results picture or Reset the slide. To Reset: Right click on the slide thumbnail and select reset slide or choose the Reset
XYLEM INC. Q EARNINGS RELEASE FEBRUARY 1, 2018
 XYLEM INC. Q4 2017 EARNINGS RELEASE FEBRUARY 1, 2018 Q4 2017 EARNINGS RELEASE FORWARD-LOOKING STATEMENTS This presentation contains information that may constitute forward-looking statements. Forward-looking
Investor Presentation
 14 MAR 2016 Investor Presentation 4Q and FY 2015 Results Hussein Hachem, CEO Bashar Obeid, CFO Management Update 4Q 2015 Results FY 2015 Results Long-term Performance Outlook & Guidance Page 1 Disclaimer
SECOND QUARTER RESULTS August 2018 Ashley Milton, CFO
 SECOND QUARTER RESULTS 2018 9 August 2018 Ashley Milton, CFO Disclaimer THIS PRESENTATION IS NOT AN OFFER OR SOLICITATION OF AN OFFER TO BUY OR SELL SECURITIES IN THE UNITED STATES OF AMERICA OR IN ANY
Q3 Fiscal Year 2018 Investor Presentation Financial Results Conference Call
 February Sept 6, 2018 2017 Q3 Fiscal Year 2018 Investor Presentation Financial Results Conference Call Mark D. Morelli President and Chief Executive Officer Gregory P. Rustowicz Vice President Finance
Brambles Limited 2017 AGM Chairman s and CEO s Addresses
 Brambles Limited ABN 89 118 896 021 Level 40 Gateway 1 Macquarie Place Sydney NSW 2000 Australia GPO Box 4173 Sydney NSW 2001 Tel +61 2 9256 5222 Fax +61 2 9256 5299 www.brambles.com 18 October 2017 The
Fiscal 2018 Third Quarter
 Fiscal 2018 Third Quarter If you can read this Click on the icon to choose a Results picture or Reset the slide. To Reset: Right click on the slide thumbnail and select reset slide or choose the Reset
Fiscal 2018 Second Quarter
 Fiscal 2018 Second Quarter If you can read this Click on the icon to choose a Results picture or Reset the slide. To Reset: Right click on the slide thumbnail and select reset slide or choose the Reset
XYLEM INC. Q EARNINGS RELEASE JULY 31, 2018
 XYLEM INC. Q2 2018 EARNINGS RELEASE JULY 31, 2018 Q2 2018 EARNINGS RELEASE FORWARD-LOOKING STATEMENTS This presentation contains information that may constitute forward-looking statements. within the meaning
INTERIM PRESENTATION Q October 2018
 INTERIM PRESENTATION 25 October JUAN VARGUES, PRESIDENT & CEO HIGHLIGTHS Organic growth Good organic growth in EMEA Flat organic growth in Americas despite -7% RV OEM APAC down due to softer market in
For personal use only. FY2017 Results Presentation
 FY2017 Results Presentation Disclaimer The material in this presentation has been prepared by Bapcor Limited ( Bapcor ) ABN 80 153 199 912 and is general background information about Bapcor s activities
Quarterly Update FY16 Fourth Quarter. November 8, 2016
 Quarterly Update FY16 Fourth Quarter November 8, 2016 Johnson Controls International plc Cautionary Statement Regarding Forward-Looking Statements Johnson Controls International plc has made statements
3Q 2018 Highlights and Operating Results. Products. Technology. Services. Delivered Globally.
 3Q 2018 Highlights and Operating Results Products. Technology. Services. Delivered Globally. Table of Contents Page 3 Safe Harbor Statement and Non-GAAP Financial Measures 4 Sales Overview 9 Overview of
H RESULTS 27 JULY 2017
 H1 2017 RESULTS 27 JULY 2017 STEFAN BOMHARD GROUP CHIEF EXECUTIVE H1 2017 HIGHLIGHTS Broad-based earnings growth Strong EM performance & return to profit growth in Asia Strong free cash flow generation
Q EARNINGS CALL
 Tom Goeke Chief Executive Officer Q2 2017 EARNINGS CALL JULY 27, 2017 IMPORTANT INFORMATION Forward Looking Statements These slides contain (and the accompanying oral discussion will contain) forward looking
Q Earnings. July 20, 2016
 Q3 2016 Earnings July 20, 2016 Forward-Looking Statements and Non-GAAP Measures Forward-Looking Statements This presentation contains certain forward-looking statements within the meaning of the U.S. Private
2017 Interim Results. Continuing Execution of Our Strategy. 3 August 2017
 2017 Interim Results Continuing Execution of Our Strategy 3 August 2017 0 Disclaimer THIS PRESENTATION IS NOT FOR RELEASE, PUBLICATION OR DISTRIBUTION, IN WHOLE OR IN PART, IN OR INTO THE UNITED STATES
Investor Presentation November 2011
 Investor Presentation November 2011 For further information contact: aston.swift@intertek.com +44 (0)20 7396 3400 1 Cautionary statement regarding forward-looking statements This presentation contains
Hero Acquisitions Ltd
 Hero Acquisitions Ltd (subsidiary of HSS Hire Group plc) FY17 Results APRIL 5 th 2018 Important notice By reading or reviewing this presentation, you agree to be bound by the following limitations: This
XYLEM INC. Q EARNINGS RELEASE MAY 1, 2018
 XYLEM INC. Q1 2018 EARNINGS RELEASE MAY 1, 2018 Q1 2018 EARNINGS RELEASE FORWARD-LOOKING STATEMENTS This presentation contains information that may constitute forward-looking statements. Forward-looking
Albemarle Corporation Second Quarter 2018 Earnings and Non-GAAP Reconciliations Conference Call/Webcast Wednesday, August 8 th, :00am ET
 Albemarle Corporation Second Quarter 2018 Earnings and Non-GAAP Reconciliations Conference Call/Webcast Wednesday, August 8 th, 2018 9:00am ET Forward-Looking Statements Some of the information presented
EARNINGS PRESENTATION
 EARNINGS PRESENTATION Fourth Quarter & Full Year 2017 Aleris Corporation March 19, 2018 Forward-Looking and Other Information IMPORTANT INFORMATION This information is current only as of its date and may
NUPLEX INDUSTRIES LIMITED RESULTS PRESENTATION FOR THE YEAR ENDED 30 JUNE 2012 PRESENTATION AGENDA
 NUPLEX INDUSTRIES LIMITED RESULTS PRESENTATION FOR THE YEAR ENDED 30 JUNE 2012 17 AUGUST 2012 Emery Severin, Chief Executive Officer Ian Davis, Chief Financial Officer PRESENTATION AGENDA 1. Group Overview
Axalta Coating Systems Ltd.
 Q1 2015 Conference Call May 6, 2015 Notice Regarding Forward Looking Statements, Non-GAAP Financial Measures and Defined Terms Forward-Looking Statements This presentation and the oral remarks made in
Creating Value by Accelerating Transformation & Growth
 Creating Value by Accelerating Transformation & Growth Univar Announces Agreement to Acquire Nexeo September 17, 2018 1 2018 Univar, Inc. All rights reserved. Forward-Looking Statements This communication
Safe Harbor and Non-GAAP Measures
 Safe Harbor and Non-GAAP Measures Forward-Looking Statements This presentation contains statements about future events and expectations that constitute forward-looking statements. Forward-looking statements
4 th quarter and annual results 2011 strong growth in North America, gradual slowdown in Europe revenue up 13% and diluted earnings per share up 8%
 4 th quarter and annual results 2011 strong growth in North America, gradual slowdown in Europe revenue up 13% and diluted earnings per share up 8% Ben Noteboom, CEO Robert-Jan van de Kraats, CFO Randstad
First Quarter Fiscal 2016 Earnings Conference Call
 First Quarter Fiscal 2016 Earnings Conference Call May 4, 2016 Forward-Looking Statements This presentation includes forward-looking statements, within the meaning of Section 27A of the Securities Act
Earnings Conference Call Q2 Fiscal Year September 4, 2018
 Earnings Conference Call Q2 Fiscal Year 2019 September 4, 2018 Forward-Looking Statements This presentation (including the accompanying oral presentation) contains forward-looking statements within the
Q Earnings Call. November 5, 2012
 Q4 2012 Earnings Call November 5, 2012 Forward-Looking Statements and Non-GAAP Measures Forward-Looking Statements -- This presentation contains certain forward-looking statements within the meaning of
XYLEM INC. Q EARNINGS RELEASE OCTOBER 30, 2018
 XYLEM INC. Q3 2018 EARNINGS RELEASE OCTOBER 30, 2018 Q3 2018 EARNINGS RELEASE FORWARD-LOOKING STATEMENTS This presentation contains information that may constitute forward-looking statements. within the
Aegis Group plc Half Year Results. 27 August 2010
 Aegis Group plc 2010 Half Year Results 27 August 2010 Agenda Introduction John Napier, Chairman Aegis Group overview Jerry Buhlmann, CEO Divisional review Aegis Media - Jerry Buhlmann, CEO Synovate Robert
H1 16 interim results. 22 September 2015
 H1 16 interim results 22 September 2015 Important notice 2 This presentation may include certain forward-looking statements, beliefs or opinions, including statements with respect to the Company s business,
DATATEC GROUP AUDITED PROVISIONAL RESULTS FOR THE YEAR ENDED 28 FEBRUARY 2018
 Technology Distribution Integration & Managed Services Consulting & Research AUDITED PROVISIONAL RESULTS FOR THE YEAR ENDED 28 FEBRUARY 2018 AGENDA Results summary, overview & strategic update Jens Montanana,
Quarterly update FY 2016 third quarter. July 21, 2016
 Quarterly update FY 2016 third quarter July 21, 2016 NO OFFER OR SOLICITATION This communication is not intended to and does not constitute an offer to sell or the solicitation of an offer to subscribe
FUCHS GROUP. Financial Results Q Analyst s Conference, 30 th October 2018 Dagmar Steinert, CFO
 FUCHS GROUP Financial Results Q1-3 2018 Analyst s Conference, 30 th October 2018 Dagmar Steinert, CFO Highlights Q1-3 2018 Sales +5% to 1,953 mn EBIT increase by 6% to 297 mn (including 12 mn one-off effect)
Q Financial Results. October 25, 2018
 Q3 2018 Financial Results October 25, 2018 Legal Notices Forward-Looking Statements This presentation and the oral remarks made in connection herewith may contain forward-looking statements within the
Full Year 2017 Results Presentation Bravura Solutions Limited
 Full Year 2017 Results Presentation Bravura Solutions Limited 23 rd August 2017 Important notice and disclaimer The information contained in this document (including this notice) or discussed at this presentation
A n n u a l G e n e r a l M e e t i n g C E O P r e s e n t a t i o n
 2 0 1 6 A n n u a l G e n e r a l M e e t i n g C E O P r e s e n t a t i o n Our Brands 2 Disclaimer The material in this presentation has been prepared by Bapcor Limited ( Bapcor ) ABN 80 153 199 912
Annual results Presentation 28 February M. Taylor, Chief Executive Officer B. García-Cos, Chief Financial Officer
 Annual results 2017 Presentation 28 February 2018 M. Taylor, Chief Executive Officer B. García-Cos, Chief Financial Officer Bekaert delivers 10% sales growth and 301 million underlying EBIT - Consolidated
Quarterly Update FY17 Fourth Quarter. November 9, 2017
 Quarterly Update FY17 Fourth Quarter November 9, 2017 1 Johnson Controls plc. November 9, 2017 Johnson Controls International plc Cautionary Statement Regarding Forward-Looking Statements Johnson Controls
FINANCIAL OVERVIEW AL MISTYSYN SENIOR VICE PRESIDENT, FINANCE & CHIEF FINANCIAL OFFICER FINANCIAL COMMUNITY PRESENTATION OCTOBER 3, 2017
 FINANCIAL OVERVIEW AL MISTYSYN SENIOR VICE PRESIDENT, FINANCE & CHIEF FINANCIAL OFFICER FINANCIAL COMMUNITY PRESENTATION OCTOBER 3, 2017 Forward Looking Statement The presentations today will contain certain
1H FY19 RESULTS PRESENTATION 25 February 2019
 RELIANCE WORLDWIDE CORPORATION LIMITED ACN 610855877 1H FY19 RESULTS PRESENTATION 25 February 2019 INVESTOR PRESENTATION 1H FY19 RESULTS PAGE 0 Important Notice This presentation contains general information
2012 Interim Results - Presentation ZURICH, 23 AUGUST 2012
 2012 Interim Results - Presentation ZURICH, 23 AUGUST 2012 Agenda - Highlights - Financials - Outlook 2 Strong position in Asia leads to improved operating results for HY 2012 Turnover +26.7% Negative
Puma Energy : Fourth quarter & full year 2018 results Thursday 28 th March Puma Energy
 Puma Energy : Fourth quarter & full year 2018 results Thursday 28 th March 2019 Puma Energy The opportunity for Puma Energy Unique footprint, great people & strong business fundamentals in high potential
Fiscal First Quarter 2017 Earnings Conference Call
 Fiscal First Quarter 2017 Earnings Conference Call May 5, 2017 Forward-Looking Statements This presentation includes certain statements relating to future events and our intentions, beliefs, expectations,
Forward-Looking Statements
 Fourth Quarter 2015 Conference Call February 9, 2016 Forward-Looking Statements Certain information contained in this presentation constitutes forward-looking statements for purposes of the safe harbor
2014 Interim Results Presentation. Mark Dixon, Chief Executive Officer Dominique Yates, Chief Financial Officer 26 August 2014
 2014 Interim Results Presentation Mark Dixon, Chief Executive Officer Dominique Yates, Chief Financial Officer 26 August 2014 2014 Interim Results Caution statement No representations or warranties, express
Gurit 1HY 2018 Results Rudolf Hadorn, CEO Angelo Quabba, CFO
 Gurit 1HY 2018 Results Rudolf Hadorn, CEO Angelo Quabba, CFO Zurich, August 17, 2018 This presentation may include forward-looking statements that reflect the intentions, beliefs or current expectations
Amcor Half Year Results
 Amcor Half Year Results Investor Presentation Ron Delia Managing Director & CEO Michael Casamento CFO Disclaimer Forward looking statements This presentation contains forwardlooking statements that involve
Brambles delivers another year of excellent results in 2007
 Brambles Limited ABN 89 118 896 021 Level 40 Gateway 1 Macquarie Place Sydney NSW 2000 Australia GPO Box 4173 Sydney NSW 2001 Tel +61 2 9256 5222 Fax +61 2 9256 5299 www.brambles.com 22 August 2007 The
Johnson Controls reports fiscal Q3 earnings with strong organic growth and underlying margin expansion
 FOR IMMEDIATE RELEASE CONTACT: Investors: Antonella Franzen (609) 720-4665 Ryan Edelman (609) 720-4545 Media: Fraser Engerman (414) 524-2733 Johnson Controls reports fiscal Q3 earnings with strong organic
First Quarter 2018 Conference Call
 First Quarter 2018 Conference Call Investor Presentation St. Paul, MN March 29, 2018 Safe Harbor & Regulation G 2 Safe Harbor Statement Certain matters discussed today may include 'forward looking statements'
Goldman Sachs Industrials Conference 2015
 Goldman Sachs Industrials Conference 2015 November 3, 2015 Forward-Looking Statements Certain information contained in this presentation constitutes forward-looking statements for purposes of the safe
FINANCIAL INFORMATION AS OF SEPTEMBER 30, 2015
 FINANCIAL INFORMATION AS OF SEPTEMBER 30, 2015 KEY MESSAGES Financial performance impacted by commodity price drop, partially offset by performance in fast growing markets and cost discipline Cash flow
Amcor & Bemis Combination Creating the Global Leader in Consumer Packaging. 6 August 2018
 Amcor & Bemis Combination Creating the Global Leader in Consumer Packaging 6 August 2018 Disclaimer Cautionary Statement Regarding Forward-Looking Statements This communication contains certain statements
Investors: Antonella Franzen (609) CONTACT: Ryan Edelman (609) Media: Fraser Engerman (414) FOR IMMEDIATE RELEASE
 CONTACT: Ryan Edelman (609) Media: Fraser Engerman (414) FOR IMMEDIATE RELEASE") FOR IMMEDIATE RELEASE CONTACT: Investors: Antonella Franzen (609) 720-4665 Ryan Edelman (609) 720-4545 Media: Fraser Engerman (414) 524-2733 Johnson Controls reports fiscal and full year earnings with
FOR IMMEDIATE RELEASE CONTACT: Investors: Antonella Franzen (609) 720-4665 Ryan Edelman (609) 720-4545 Media: Fraser Engerman (414) 524-2733 Johnson Controls reports fiscal and full year earnings with