Investor Presentation Global Telecom Holding S.A.E. 2014
|
|
|
- Byron Tyler
- 5 years ago
- Views:
Transcription

1 Investor Presentation March 2014
2 Disclaimer This presentation contains forward-looking statements about Global Telecom Holding ( GTH ). Such statements are not historical facts and include expressions about confidence and strategies of management and expectations of management about new and existing programs, technology and market conditions. Although GTH believes its expectations are based on reasonable assumptions, these forwardlooking statements are subject to numerous risks and uncertainties. These statements may not be regarded as a representation that anticipated events will occur or that expected objectives will be achieved. The forward-looking statements in this presentation are only valid until the date of this document and GTH does not undertake to update any forward-looking statement to reflect events or circumstances after the date hereof or to reflect the occurrence of unanticipated events. This presentation is not an offer to sell securities or the solicitation of an offer to buy securities, nor shall there be any offer or sale of securities in any jurisdiction in which such offer or sale would be unlawful prior to registration or qualification under the securities laws of such jurisdiction. 2

3 Agenda 4Q13 Highlights 4 Shareholder Structure 5 Global Presence 6 Market Position 7 GTH Operations 8 Appendix 22 3
4 4Q13 Highlights Customers 1&2 Total Revenues 3 Group EBITDA 3 & EBITDA Margin % 47.7% % Organic % 397 Organic 4Q12 4Q13 Djezzy 1 : Despite the on-going regulatory restrictions and limitations on 2G, Djezzy increased the customer base by 5% YoY to 17.6 million Mobilink: Customers grew 4% YoY to 37.6 million, as a result of continued churn management coupled with a focus on reactivation offers, the launch of competitive on-net bundles and data products banglalink: Customers base increased 11% YoY to 28.8 million customers, driven by high gross additions, following the launch of different attractive channel and customer promotions 4Q12 Group revenues were adversely impacted by the local currency devaluation against the USD, mainly in Pakistan and Algeria Djezzy: Revenue decreased 3% YoY in local currency, negatively impacted by the restrictions on Djezzy s commercial activities and propositions with the ongoing ban Mobilink: Revenue decreased 6% YoY in local currency, adversely affected by outages due to Mobilink s network swap, unstable security situation, higher withholding taxes, and government requested network shutdowns, and higher power outages banglalink: Revenue decreased 11% YoY in local currency, driven by unstable macro environment alongside the disconnection of suspected VoIP customers as per regulatory measures Reported EBITDA in US dollar decreased 7% YoY to USD 397 million Djezzy: EBITDA decreased 4% YoY in local currency, due to the continued lack of competitive pricing plans for B2B and high value customers, in parallel with the increase in network and IT costs Mobilink: EBITDA decreased 18% YoY in local currency, pressure on top line, higher tax absorption due to the increased sales of low price SIMs, partially offset by lower interconnect cost due to lower outgoing traffic to other operators as a result of attractive on-net offers banglalink: EBITDA decreased 20% YoY in local currency, mostly as result of revenue decline, higher customer acquisition costs and dealer commission on additions 1. As announced on July , during an internal investigation with regards to Djezzy s active customers, management found a technical bug that overstated Djezzy s customer base by 1.4 million. The customers base comparative figures for 4Q12 were adjusted accordingly. This event does not impact historical reported revenue or EBITDA, but positively affect MOU and ARPU 2. Total customers in Millions 3. Group indicators in USD Millions 4Q13 4Q12 4Q13 4
 43.0% (V) 9.2% (V) 100.0% 100.0% 100.0% 51.")
5 Shareholder Structure ALTIMO TELENOR VIMPELCOM FREE FLOAT 56.2% (Economic) 33.0% (E) 10.8% (E) 47.9% (Voting) 43.0% (V) 9.2% (V) 100.0% 100.0% 100.0% 51.9% GTH FREE FLOAT OJSC VIMPELCOM KYIVSTAR WIND ITALY GTH 48.1% 5


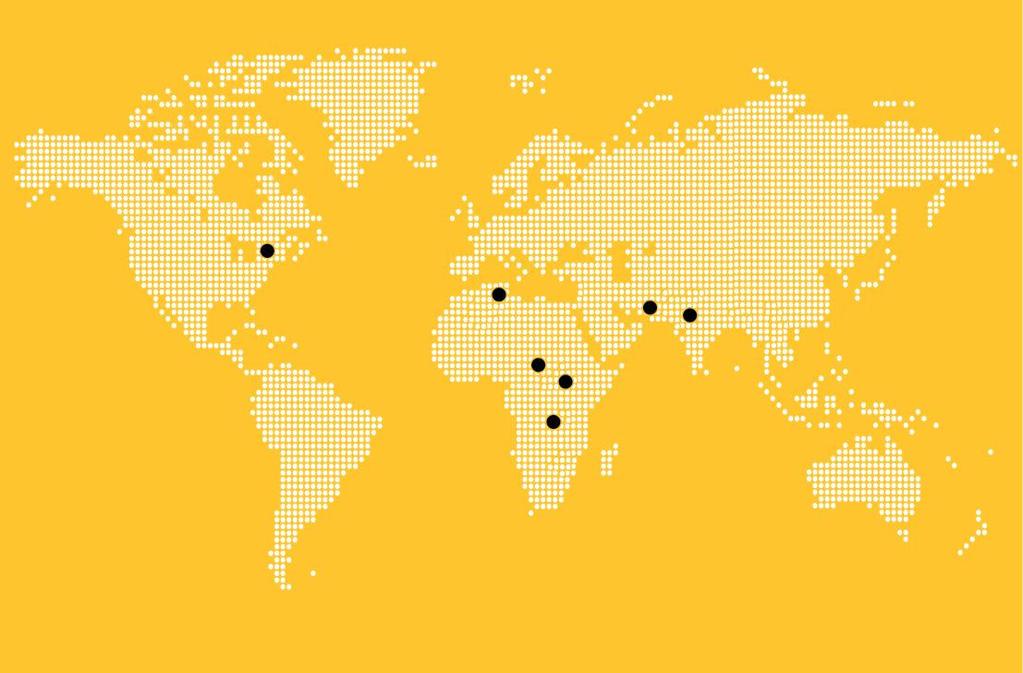
6 Global Presence 1 GTH serves a population of approximately 459 million with an average penetration of 57% CANADA 2 Population: 34.6 million GDP Growth: 1.7% GDP/Capita PPP: USD42,300 Pop. Under 15 years: 15% Mobile Penetration: 85% ALGERIA Population: 38.1 million GDP Growth: 3.3% GDP/Capita PPP: USD7,300 Pop. Under 15 years: 28% Mobile Penetration: 88% ZIMBABWE Population: 13.2 million GDP Growth: 4.4% GDP/Capita PPP: USD600 Pop. Under 15 years: 39% Mobile Penetration: 71% BANGLADESH Population: million GDP Growth: 6.1% GDP/Capita PPP: USD2,000 Pop. Under 15 years: 33% Mobile Penetration: 70% PAKISTAN Population: million GDP Growth: 4.4% GDP/Capita PPP: USD3,100 Pop. Under 15 years: 34% Mobile Penetration: 68% BURUNDI Population: 10.9 million GDP Growth: 4.0% GDP/Capita PPP: USD600 Pop. Under 15 years: 46% Mobile Penetration: 24% CENTRAL AFRICA REPUBLIC Population: 5.2 million GDP Growth: 4.1% GDP/Capita PPP: USD900 Pop. Under 15 years: 41% Mobile Penetration: 18% 1. Figures from CIA factbook. Mobile Penetration are based on December 31, 2013 customers figures and market share 2. GTH has 65% indirect economic ownership in Globalive Investment Holding Canada, but a minority voting stake 6
7 Market Position Algeria: Despite limitations, Djezzy remains a profitable market leader with significant mobile data potential Pakistan: Mobilink leads the market, and has great potential for revenue growth through mobile data, MFS and VAS Bangladesh: In a large market with low penetration levels, banglalink is a leading operator with strong focus on increasing value share in a rapidly growing market Telecel Globe: Leading positions in markets with low penetration levels, healthy APPM, and high growth potential. Internet is a mobile story in Africa Canada: WIND Mobile continues its "Value Plus" strategy execution, adding primarily postpaid subscribers while carefully managing prepaid economics for both voice and mobile broadband customers 7

8 Algeria 8
 Market shares 3 22% Djezzy 25% 53% Mobilis Ooredoo Macro environment GDP growth for FY 2012/2013 of ~2.")


9 Djezzy - Overview Population 1 : 38 million GDP/capita 1 : USD 7,300 Market size 2 : 33.4 million Penetration 2 : 88% Market players (subs): Djezzy (17.6 million) Mobilis (8.4 million) Ooredoo (7.4 million) Market shares 3 22% Djezzy 25% 53% Mobilis Ooredoo Macro environment GDP growth for FY 2012/2013 of ~2.5% Government, trade and agricultural sectors account for over 60% of GDP 28% of the population is under 15 years old Presidential elections expected to commence in April 2014 Competitive landscape Djezzy: high brand perception with solid market leadership with high control over distribution Mobilis: incumbent operator maintained by the government, has a strong relationship with the regulator and has been very active on the commercial front lately Ooredoo: seen as a multimedia operator that offers lower prices, more promotions, subsidies and higher incentives to the retail channel Regulatory environment Djezzy continues to face stringent conditions from regulator commercial activities and propositions Djezzy awarded a 3G license in December 2013 and received an exceptional approval from the Bank of Algeria for foreign payments for 3G equipment Government plans to list 10 public companies on ASE, including Mobilis Strategic direction Launch 3G services in 2Q14 targeting high value data users Maintain leadership in customer experience and NPS Emphasize Djezzy as the preferred Algerian mobile brand while launching 3G Maintain a solid network performance from 3G roll out and 2G network modernization and expansion 1. CIA factbook 2. Penetration figures are provided based on OTA closing base and our data warehouse (DWH) figures for competition 3. DWH market share 9
10 Djezzy - KPIs Mobile Customers 1 (Millions) Revenues (DZD Billions) EBITDA (DZD Billions) & EBITDA Margin % 54.0% 53.2% % 59.4% 58.7% CAPEX 2 (DZD Billions) & CAPEX/Revenue % Operating Cash Flow 3 (DZD Billions) % % % 2.2% 3.1% Note: Foreign exchange rate DZD / USD 1 1. As announced on July , during an internal investigation with regards to Djezzy s active customers, management found a technical bug that overstated Djezzy s customer base by 1.4 million. The customers base comparative figures were adjusted accordingly. This event does not impact historical reported revenue or EBITDA, but positively affect MOU and ARPU 2. CAPEX figures excluding license fees and may differ from previously released figures 3. Operating Cash Flow is EBITDA less CAPEX 10

11 Pakistan 11
 Zong (23.7 million) Warid (12.9 million) Market shares 2 10% Mobilink 18% 29% Telenor Ufone 19% 25% Zong Warid Macro environment GDP growth for FY 2012/2013 of ~3.")


12 Mobilink - Overview Population 1 : 193 million GDP/capita 1 : USD 3,100 Market size 2 : million Penetration: 68% Market players (subs): Mobilink (37.7 million) Telenor (33.0 million) Ufone (25.0 million) Zong (23.7 million) Warid (12.9 million) Market shares 2 10% Mobilink 18% 29% Telenor Ufone 19% 25% Zong Warid Macro environment GDP growth for FY 2012/2013 of ~3.7% Continued devaluation of the Rupee against the USD Power shortfalls persist 34% of the population under 15 years old New government elected and in place since May 2013, working on achieving political stability and economic reform Competitive landscape Mobilink: market leader in a five player market Telenor: value-driven operator with strong market position via youth, mobile data offers and MFS Ufone: positive mass market perception and aggressive pricing strategy Zong: aggressive on pricing and market share gain Warid: conducting due diligence to exit the market Regulatory environment New PTA chairman appointed in 4Q13 3G/4G auction planned in April 2014 Government increased withholding tax on recharge to 15% and also increased commercial electricity tariffs by 30% effective October 1, 2013 Trends of fewer forced network shutdowns Strategic direction Continued focus on network modernization to achieve 3G readiness Further enhance operational excellence initiatives Retain leadership in mobile data Capture market opportunity in MFS Enhance customer experience through better quality of service 1. CIA factbook 2. Market share as provided by the regulator as of November 30,
13 Mobilink - KPIs Mobile Customers (Millions) Revenues (PKR Billions) EBITDA (PKR Billions) & EBITDA Margin % 36.5% % 39.6% % 41.6% % CAPEX 1 (PKR Billions) & CAPEX/Revenue Operating Cash Flow 2 (PKR Billions) % 12.9% % % 18.4% Note: Foreign exchange rate PKR / USD 1 1. CAPEX figures excluding license fees and may differ from previously released figures 2. Operating Cash Flow is EBITDA less CAPEX 13


14 Bangladesh 14
 Airtel (8.3 million) CityCell (1.4 million) TeleTalk (2.")

15 banglalink - Overview Population 1 : 164 million GDP/capita 1 : USD 2,000 Market size 3 : million Penetration 2 : 70% Market players (subs): GP (47.6 million) banglalink (28.9 million) Robi (25.6 million) Airtel (8.3 million) CityCell (1.4 million) TeleTalk (2.8 million) Market shares 3 22% 1% 7% 3% 25% 42% bangalink Grameenphone Robi Airtel Citycell Teletalk Macro environment GDP growth for FY 2012/2013 of ~6% The world s highest population density 33% of the population under 15 years old BDT continued to appreciate against the USD Unstable macro environment Competitive landscape banglalink: 2 nd in a six player market with an innovative brand positioning among youth segment Grameenphone: largest network, perceived as best in quality and coverage Robi: aggressive on prices and communication Airtel: mainly focused on youth CityCell: CDMA operator TeleTalk: Run by national fixed incumbent BTCL Regulatory environment Four 3G licenses were awarded in September 2013 during an auction for 8 blocks of spectrum, each consisting of 5 MHz (uplink and downlink). 5 of the 8 blocks were awarded banglalink launched 3G services in October 2013 The government reduced SIM tax to BDT 300 from BDT 606 during 2Q13 Strategic direction Capitalize on introduction of 3G and maximize revenue from mobile data segment Improve Revenue Market Share Grow beyond the core and expand on MFS and VAS fronts Maintain price leadership strategy Focus on spectrum optimization, network sharing and modernization 1. CIA Factbook 2. Penetration figures are provided based on BTRC published figures 3. BTRC market share as at January 31,
16 banglalink - KPIs Mobile Subscribers (Millions) Revenues (BDT Billions) EBITDA (BDT Billions) & EBITDA Margin 29.2% % % % 37.1% % CAPEX 1 (BDT Billions) & CAPEX/Revenue Operating Cash Flow 2 (BDT Billions) % % % % % 26.3% Note: Foreign Exchange Rate BDT / USD 1 1. CAPEX figures excluding license fees and may differ from previously released figures 2. Operating Cash Flow is EBITDA less CAPEX 16
17 Appendix
18 Debt Profile Debt by Entity 1% 1% Debt by Entity Debt by Currency 4% 8% GTH Pakistan GTH 4,495 Pakistan 198 Bangladesh % 87% Bangladesh Algeria Others Algeria 47 Others 32 Total 5,184 89% USD Local Gross & Net Debt (USD Millions) 5,184 4,757 2,838 2,026 2,731 2,346 Gross Debt Cash Net Debt 4Q13 4Q12 18
19 Income Statement USD thousands 4Q13 4Q12 Change FY13 FY12 Change Revenue 833, ,345 (8%) 3,447,412 3,626,767 (5%) Other Income 12,889 16,062 23,050 33,933 Total Expense (448,931) (505,262) (1,813,862) (1,912,155) Net unusual Items - 6,358-6,113 EBITDA 1 397, ,503 (7%) 1,656,600 1,754,658 (6%) Depreciation and Amortization (270,108) (174,260) (772,986) (705,096) Impairment of Non-Current Assets 2,843 (6,979) (6,132) (12,269) Gain (Loss) on Disposal of Non- Current Assets (6,696) (12,722) (8,152) (17,862) Impairment of Assets Held for Sale 2 (10,687) - (57,964) - Operating Income 112, ,542 n.m. 811,366 1,019,431 n.m. Financial Expense (128,747) (124,726) (503,270) (457,858) Financial Income 11,344 21,433 42,872 77,090 Foreign Exchange Gain (Loss) 3 (23,023) (89,471) (269,406) (74,139) Share of Profit (Loss) from Associates (38,698) (26,234) (139,155) (103,279) Impairment of Financial Assets 4 (625,429) (339,126) (625,429) (339,126) Other non-operating cost - (74,399) - (74,399) Profit Before Tax (691,654) (400,981) n.m. (683,022) 47,720 n.m. Income Tax (57,125) (67,925) (241,300) (253,480) Profit from Continuing Operations (748,779) (468,906) n.m. (924,322) (205,760) n.m. Profit for the Period (748,779) (468,906) n.m. (924,322) (205,760) n.m. Attributable to: Equity Holders of the Parent 5 (754,048) (473,364) n.m. (944,320) (224,928) n.m. Earnings Per Share (USD/GDR) 6 (0.71) (0.45) n.m. (0.88) (0.20) n.m. Minority Interest 5,269 5,457 19,998 19,168 Net Income (748,779) (468,906) n.m. (924,322) (205,760) n.m. Footnotes: 1. Management presentation developed from IFRS financials 2. GTH fully impaired its assets in Canada by USD 619 million, mainly relating to the challenges the Group is facing in the country, which resulted in the strategic decision to withdraw from the 700 MHz spectrum auction and the reassessment of the prospects for continuing operations in the country 3. Impairment of assets held for sale by USD 58 million, as to reflect the fair value of our operations in CAR and Burundi, which amounted to USD 100 million 4. Foreign exchange loss incurred during 4Q13 is mainly driven by the unrealized foreign exchange losses resulting from the revaluation of the shareholder loan from VimpelCom, due to the appreciation of the US dollar against the Egyptian pound, which was offset against unrealized foreign exchange gains that resulted from the revaluation of Globalive (WIND Mobile Canada) loan receivable balance as of 4Q13 5. Equates to net income after minority interest. 6. Based on a weighted average for the outstanding number of GDRs of 1,049,138,124 19
20 Balance Sheet USD thousands 31 December December 2012 Assets Property and Equipment (net) 2,043,998 2,493,620 Intangible Assets 1,425,596 1,448,712 Other Non-Current Assets 88, ,099 Total Non-Current Assets 3,557,788 4,800,431 Cash and Cash Equivalents 2,838,448 2,025,844 Trade Receivables 225, ,477 Assets Held for Sale 170,380 - Other Current Assets 1,153,541 1,064,216 Total Current Assets 4,388,010 3,323,537 Total Assets 7,945,798 8,123,968 Equity Attributable to Equity Holders of the Company 801,168 1,572,681 Minority Share 95,214 74,492 Total Equity 896,382 1,647,173 Liabilities Long Term Debt 151,010 4,074,700 Other Non-Current Liabilities 189, ,956 Total Non-Current Liabilities 340,679 4,307,656 Short Term Debt 5,033, ,643 Trade Payables 814, ,624 Other Current Liabilities 861, ,872 Total Current Liabilities 6,708,737 2,169,139 Total Liabilities 7,049,416 6,476,795 Total Liabilities and Shareholder s Equity 7,945,798 8,123,968 Net Debt 1 2,345,653 2,731,499 Footnotes: 1. Net debt is calculated as a sum of short term debt, long term debt, less cash and cash equivalents 20
21 Cash Flow Statement USD thousands Cash Flows from Operating Activities 31 December December 2012 Loss for the Period (924,323) (205,760) Depreciation, Amortization and Impairment of Non-Current Assets 1,404, ,365 Income Tax Expense 241, ,480 Net Financial Charges 729, ,907 Share of Loss (Profit) of Associates 139, ,279 Impairment of Financial Assets 57, ,126 Other (44,236) 129,084 Changes in Assets Carried as Working Capital (241,863) 24,156 Changes in Other Liabilities Carried as Working Capital 169,868 (8,748) Income Tax Paid (252,560) (500,793) Interest Expense Paid (113,495) (114,911) Net Cash Generated by Operating Activities 1,166,161 1,191,185 Cash Flows from Investing Activities Cash Outflow for Investments in Property and Equipment, Intangible Assets, and Financial Assets and Consolidated Subsidiaries Proceeds from Disposal of Property and Equipment, Subsidiaries and Financial Assets (547,658) (412,481) 27,486 (16,478) Advances and Loans made to Associates and other parties - (161,313) Dividends and Interest Received 12,062 10,489 Net Cash Used in Investing Activities (508,110) (579,783) Cash Flows from Financing Activities Proceeds from loans, banks' facilities and bonds 1,282,929 1,300,806 Payments for loans, banks' facilities and bonds (1,152,367) (881,948) Net Payments from financial liabilities (2,386) (79,429) Net Change in Cash Collateral 30, ,964 Net Cash generated by Financing Activities 158, ,393 Net Increase in Cash and Cash Equivalents 817,045 1,071,795 Cash included in Assets Held for Sale (26,014) (7) Effect of Exchange Rate Changes on Cash and Cash Equivalents 21,628 (59,487) Cash and Cash Equivalents at the Beginning of the Period 2,025,773 1,013,543 Cash and Cash Equivalents at the End of the Period 2,838,432 2,025,844 21
22 Contacts For your inquiries, please contact: Mamdouh Abdel Wahab Head of Investor Relations E: T: /21 F: /54 W: 22
Content. 3Q13 Highlights 4. Shareholder Structure 5. Global Presence 6. Market Position 7. GTH Operations 8. Appendix 22. Page 3
 Investor Presentation November 2013 Disclaimer This presentation contains forward-looking statements about Global Telecom Holding ( GTH ). Such statements are not historical facts and include expressions
Orascom Telecom Holding
 Orascom Telecom Holding Investor Presentation September 2013 Disclaimer This presentation contains forward-looking statements about Orascom Telecom Holding ( OTH ). Such statements are not historical facts
Investor Presentation
 Investor Presentation November 2016 1 Disclaimer ThispresentationisforinformationpurposesonlyanddoesnotconstituteanoffertosellorthesolicitationofanoffertobuysharesinGlobalTelecomHolding(the "Company").Further,itdoesnotconstitutearecommendationbytheCompanyoranyotherpartytosellorbuysharesintheCompanyoranyothersecurities.This
Investor Presentation Global Telecom Holding S.A.E Disclaimer
 Investor Presentation February 2016 Disclaimer This presentation is for information purposes only and does not constitute an offer to sell or the solicitation of an offer to buy shares in Global Telecom
4Q13 and FY13. Global Telecom Holding 4Q13 0
 4Q13 and FY13 Global Telecom Holding 4Q13 0 4Q13 Highlights 1 Total customers 2 grew 7% YoY to exceed 89 million. Revenue of USD 834 million, an organic 3 decline of 6% YoY, negatively impacted by regulatory
Third Quarter Global Telecom Holding 3Q14 0
 Third Quarter 2014 Global Telecom Holding 3Q14 0 3Q14 Highlights 1 Total customers grew 5% YoY to reach 91.4 million, driven by strong growth in all operating units, particularly in Bangladesh. Revenue
GLOBAL TELECOM REPORTS 1Q15 RESULTS
 1Q15 HIGHLIGHTS 1 GLOBAL TELECOM REPORTS 1Q15 RESULTS Successfully closed transaction in Algeria and strengthened Djezzy s position and prospects for growth Revenue organically 2 declined 5% YoY due to
Investor Presentation
 Investor Presentation September 2017 1 Disclaimer This presentation is for information purposes only and does not constitute an offer to sell or the solicitation of an offer to buy shares in Global Telecom
9M18 9M17 Reported YoY Organic2 YoY Total customers (mln) % Organic 2 YoY
 % Organic 2 YoY") GLOBAL TELECOM REPORTS Q3 2018 RESULTS Q3 2018 HIGHLIGHTS 1 Total revenue increased organically 2 by 6.3% Mobile data revenue grew by 64.7% organically 2 Customer growth of 4.3% to 104 million, driven
GLOBAL TELECOM REPORTS Q3 2018 RESULTS Q3 2018 HIGHLIGHTS 1 Total revenue increased organically 2 by 6.3% Mobile data revenue grew by 64.7% organically 2 Customer growth of 4.3% to 104 million, driven
Orascom Telecom Fourth Quarter ORASCOM TELECOM HOLDING Fourth Quarter 2012
 ORASCOM TELECOM HOLDING Fourth Quarter 2012 P a g e 1 1. 2. 3. 4. 5. 6. 7. 8. 9. 10. 11. 12. 13. 14. 15. 16. 17. 18. 19. 20. 21. 22. 23. 24. 25. 26. 27. 28. 29. 30. 31. Content 1. 4Q12 Highlights 2 2.
GLOBAL TELECOM REPORTS Q RESULTS
 GLOBAL TELECOM REPORTS Q3 2016 RESULTS Q3 2016 HIGHLIGHTS 1 Reported revenue increased 8% due to consolidation of Warid Revenue organically stable due to: Double-digit growth in Pakistan Solid performance
GLOBAL TELECOM REPORTS Q RESULTS
 GLOBAL TELECOM REPORTS Q1 2017 RESULTS Q1 2017 HIGHLIGHTS 1 Reported service revenue increased 5% YoY Service revenue decreased organically 5% YoY mainly due to weak performance in Algeria and leap year
Investor Presentation Global Telecom Holding S.A.E Disclaimer
 Investor Presentation August 2016 Disclaimer This presentation is for information purposes only and does not constitute an offer to sell or the solicitation of an offer to buy shares in Global Telecom
Orascom Telecom Second Quarter ORASCOM TELECOM HOLDING Second Quarter 2012
 ORASCOM TELECOM HOLDING Second Quarter 2012 P a g e 1 1. 2. 3. 4. 5. 6. 7. 8. 9. 10. 11. 12. 13. 14. 15. 16. 17. 18. 19. 20. 21. 22. 23. 24. 25. 26. 27. 28. 29. 30. 31. Content 1. Highlights 2 2. Performance
Q results and business update
 Q1 2018 results and business update Amsterdam 14 May 2018 Vincenzo Nesci Chief Executive Officer Gerbrand Nijman Chief Financial Officer 1 Disclaimer This presentation is for information purposes only
VIMPELCOM REPORTS 1Q14 RESULTS
 VIMPELCOM REPORTS 1Q14 RESULTS KEY RESULTS AND DEVELOPMENTS IN 1Q14 Revenue declined organically 1 by 5% YoY to USD 5.0 billion EBITDA 2 declined organically 1 by 6% YoY to USD 2.1 billion Strong EBITDA
USD mln Pro forma Actual
 STRONG ORGANIC REVENUE AND EBITDA GROWTH IN 1Q12 KEY RESULTS AND DEVELOPMENTS IN 1Q12* Organic Revenue growth of 6% YoY; revenues of USD 5.6 billion Organic EBITDA growth of 5% YoY; EBITDA of USD 2.3 billion
VIMPELCOM REPORTS CONTINUED OPERATIONAL IMPROVEMENTS AND INCREASED EPS IN 1Q15 RESULTS - ON TRACK TO DELIVER 2015 TARGETS
 VIMPELCOM REPORTS CONTINUED OPERATIONAL IMPROVEMENTS AND INCREASED EPS IN 1Q15 RESULTS - ON TRACK TO DELIVER 2015 TARGETS KEY RESULTS AND DEVELOPMENTS IN 1Q15 Organic 1 results in line with management
Q results and business update
 Q3 2018 results and business update Amsterdam 8 November 2018 Vincenzo Nesci Chief Executive Officer Gerbrand Nijman Chief Financial Officer Disclaimer This presentation is for information purposes only
GLOBAL TELECOM REPORTS Q RESULTS
 GLOBAL TELECOM REPORTS Q4 2016 RESULTS Q4 2016 HIGHLIGHTS 1 Reported service revenue increased 7% due to the consolidation of Warid Service revenue decreased organically 2% mainly due to weak performance
GLOBAL TELECOM REPORTS Q RESULTS
 GLOBAL TELECOM REPORTS Q3 2017 RESULTS Q3 2017 HIGHLIGHTS 1 Reported service revenue decreased 3.3% YoY Service revenue decreased organically 2.3% YoY Mobile data organic revenue growth of 39.7% YoY Customer
22 F E B R U A R Y 2018 V E O N R E P O R T S F U L L Y E A R R E S U L T S W I T H R O B U S T F R E E
 22 F E B R U A R Y 2018 V E O N R E P O R T S F U L L Y E A R 2 0 1 7 R E S U L T S W I T H R O B U S T F R E E C A S H F L O W G E N E R A T I O N O F O V E R U S D 1 B I L L I O N A N D A N N O U N C
Orascom Telecom Third Quarter ORASCOM TELECOM HOLDING Third Quarter 2012
 ORASCOM TELECOM HOLDING Third Quarter 2012 P a g e 1 1. 2. 3. 4. 5. 6. 7. 8. 9. 10. 11. 12. 13. 14. 15. 16. 17. 18. 19. 20. 21. 22. 23. 24. 25. 26. 27. 28. 29. 30. 31. Content 1. 3Q12 Highlights 2 2. Performance
VIMPELCOM DELIVERS SOLID PROFITABLE ORGANIC GROWTH IN 2Q12
 VIMPELCOM DELIVERS SOLID PROFITABLE ORGANIC GROWTH IN 2Q12 KEY RESULTS AND DEVELOPMENTS IN 2Q12 * Revenues of USD 5.7 billion, with organic 1 growth of 4% YoY EBITDA of USD 2.5 billion, up 8% organically
8 N O V E M B E R 2018
 8 N O V E M B E R 2018 V E O N R E P O R T S G O O D R E V E N U E A N D E B I T D A G R O W T H G U I D A N C E U P D A T E D T O R E F L E C T G O O D P R O G R E S S T O W A R D S F Y 2 0 1 8 F I N
VIMPELCOM CONTINUES TO DELIVER ON STRATEGY WITH PROFITABLE ORGANIC GROWTH IN 3Q12
 VIMPELCOM CONTINUES TO DELIVER ON STRATEGY WITH PROFITABLE ORGANIC GROWTH IN 3Q12 KEY RESULTS AND DEVELOPMENTS IN 3Q12 Revenues of USD 5.7 billion; organic 1 growth of 3% YoY EBITDA of USD 2.5 billion,
Creating Value Investing in the Future
 Creating Value Investing in the Future Investor Presentation September 2014 www.vimpelcom.com ipad App 1 A well diversified leading international mobile operator Mobile customers 220 million 2 Population
25 F E B R U A R Y
 25 F E B R U A R Y 2 0 1 9 V E O N R E P O R T S G O O D F U L L Y E A R 2 0 1 8 R E S U L T S F Y 2 0 1 8 F I N A N C I A L T A R G E T S A C H I E V E D F I N A L D I V I D E N D O F US 17 C E N T S
Creating Value Investing in the Future
 Creating Value Investing in the Future www.vimpelcom.com ipad App 1 A well diversified leading international mobile operator Headquartered in Amsterdam Mobile customers 218 million2 Countries 14 Population
1 4 M A Y 2018 V E O N R E P O R T S G O O D Q R E S U L T S W I T H F Y T A R G E T S C O N F I R M E D
 1 4 M A Y 2018 V E O N R E P O R T S G O O D Q 1 2 0 1 8 R E S U L T S W I T H F Y 2 0 1 8 T A R G E T S C O N F I R M E D Amsterdam (14 May 2018) VEON Ltd. (NASDAQ: VEON, Euronext Amsterdam: VEON) a leading
Q R E S ULT S. A m s t e r d a m, 1 4 M a y
 Q 208 R E S ULT S A m s t e r d a m, 4 M a y 2 0 8 Disclaimer This presentation contains forward-looking statements, as the phrase is defined in Section 27A of the U.S. Securities Act of 933, as amended,
1Q 2014 Presentation. Amsterdam, May 14, Jo Lunder CEO Andrew Davies CFO. VimpelCom Ltd 2014
 1Q 2014 Presentation Amsterdam, May 14, 2014 Jo Lunder CEO Andrew Davies CFO 1 Disclaimer This presentation contains forward-looking statements, as the phrase is defined in Section 27A of the Securities
ORASCOM TELECOM HOLDING Third Quarter 2011
 ORASCOM TELECOM HOLDING Third Quarter Orascom Telecom Holding YE 2009 P a g e 1 CONTENT Highlights 3 Chairman s Comment 4 CEO s Comment 5 Operational Performance 6 Main Financial Events 10 Financial Review
Creating Value Profitable Growth Strategy
 Profitable Growth Strategy 2013-2015 London, January 16 th 2013 Jo Lunder CEO Delivering on the Value Agenda Objectives FY 11 Objectives 2012 2014 (announced 15 November 2011) YTD 3Q12 Revenue +5 % * CAGR
Telenor Fourth Quarter Jon Fredrik Baksaas, CEO
 Telenor Fourth Quarter 2011 Jon Fredrik Baksaas, CEO Disclaimer The following presentation is being made only to, and is only directed at, persons to whom such presentation may lawfully be communicated
Q Results And Business Update
 Q2 2017 Results And Business Update Amsterdam, 3 August 2017 Jean-Yves Charlier - Chief Executive Officer Andrew Davies - Chief Financial Officer Disclaimer This presentation contains forward-looking statements,
Hellas Group 3nd Quarter 2007 Results. November 15, 2007
 Hellas Group 3nd Quarter 2007 Results November 15, 2007 Forward looking statement This presentation includes forward-looking statements. These forward-looking statements include all matters that are not
Hellas Group 4th Quarter 2007 Results. February 19, 2008
 Hellas Group 4th Quarter 2007 Results February 19, 2008 Forward looking statement This presentation includes forward-looking statements. These forward-looking statements include all matters that are not
Disclaimer. Telenor Second Quarter 2010
 Telenor Second Quarter 2010 Jon Fredrik Baksaas, President and CEO Disclaimer The following presentation is being made only to, and is only directed at, persons to whom such presentation may lawfully be
ORASCOM TELECOM HOLDING First Quarter
 ORASCOM TELECOM HOLDING First Quarter - Orascom Telecom Holding YE P a g e 1 CONTENT Highlights 3 CEO s Comment 4 Operational Performance 5 Main Financial Events 9 Financial Review 13 Financial Statements
Investor Presentation FY 2017
 Investor Presentation FY 2017 1 1 Disclaimer This document has been prepared by Mobily (the Company ) solely for presentation purposes. The information contained in this document has not been independently
Q Interim report January June 2018
 Interim report January June Contents Highlights and Group performance 1 Outlook for 1 Interim report 5 Telenor s operations 5 Group performance 10 Interim condensed financial information 12 Notes to the
S T R AT E G IC FRAME W O R K A ND Q R E S ULT S. A m s t e r d a m, 2 A u g u s t
 S T R AT E G IC FRAME W O R K A ND Q 2 2018 R E S ULT S A m s t e r d a m, 2 A u g u s t 2 0 1 8 Agenda OPENING Richard James - Head of IR OVERVIEW AND PRIORITIES Ursula Burns - Executive Chairman COUNTRY
Positive trend confirmed
 Positive trend confirmed H1 2009 Results August 4, 2009 H1 2009 financial highlights Total Revenues up 5.7% over H1 2008 to 2,819 million Total Mobile revenues grow 2.6% YoY to 1,880 million Total Fixed-line
WIND. A good quarter, once again. Q Financial Results
 WIND A good quarter, once again Q3 2006 Financial Results November 22, 2006 The following presentation is provided to you (each referred to hereafter as a Recipient ) for information purposes only and
Orascom Telecom Holding Full Year 2008 Results
 Orascom Telecom Holding Full Year Results Cairo, March 16 th, 2009: Orascom Telecom Holding (OTH) (Ticker: ORTE.CA, ORTEq.L, ORAT EY, OTLD LI), announces its full year consolidated results. Highlights
MANAGEMENT S DISCUSSION AND ANALYSIS OF FINANCIAL CONDITION AND RESULTS OF OPERATIONS
 MANAGEMENT S DISCUSSION AND ANALYSIS OF FINANCIAL CONDITION AND RESULTS OF OPERATIONS TELEFONICA CELULAR DEL PARAGUAY S.A. As at and for the year ended 31 December 2016 1. Overview We are a leading multinational
ORASCOM TELECOM HOLDING Full Year
 ORASCOM TELECOM HOLDING Full Year - Orascom Telecom Holding YE P a g e CONTENT Highlights 3 Chairman s Comment 4 CEO s Comment 5 Operational Performance 6 Main Financial Events 0 Financial Review 2 Financial
Financial data prepared under IFRS
 First Quarter of Fiscal Year 2012 Earnings Results Conference Call Presentation Financial data prepared under IFRS Disclaimer This presentation is based on audited financial statements and may include
Fourth Quarter & Fiscal Year 2012 Earnings Results. Conference Call Presentation
 Fourth Quarter & Fiscal Year 2012 Earnings Results Conference Call Presentation Disclaimer This presentation is based on audited financial statements and may include statements that could constitute forward-looking
Disclaimer. Telenor Third Quarter 2012
 Telenor Third Quarter 2012 Jon Fredrik Baksaas, CEO Disclaimer The following presentation is being made only to, and is only directed at, persons to whom such presentation may lawfully be communicated
Conference Call Presentation
 Telecom Argentina Full-Year2014 PreliminaryResults Conference Call Presentation Disclaimer This presentation may include statements that could constitute forward-looking statements, including, but not
Etisalat Group. Aspire Forward. EFG Hermes 4 th London MENA Conference th September 2014, London
 Etisalat Group EFG Hermes 4 th London MENA Conference Aspire Forward 15-17th September 2014, London Disclaimer Emirates Telecommunications Corporation and its subsidiaries ( Etisalat or the Company ) have
Etisalat Group 4Q 2017 Results Presentation. 22 February 2018 Abu Dhabi, UAE
 Etisalat Group 4Q 2017 Results Presentation 22 February 2018 Abu Dhabi, UAE Disclaimer Emirates Telecommunications Group Company PJSC and its subsidiaries ( Etisalat Group or the Company ) have prepared
Etisalat Group Results Q March 2016 Abu Dhabi
 Etisalat Group Results Q4 2015 10 March 2016 Abu Dhabi Disclaimer Emirates Telecommunications Corporation and its subsidiaries ( Etisalat or the Company ) have prepared this presentation ( Presentation
Etisalat Group. BAML MENA & Frontier Markets Conference th November 2014, Dubai
 Etisalat Group BAML MENA & Frontier Markets Conference 2014 20 th November 2014, Dubai Disclaimer Emirates Telecommunications Corporation and its subsidiaries ( Etisalat or the Company ) have prepared
MANAGEMENT S DISCUSSION AND ANALYSIS OF FINANCIAL CONDITION AND RESULTS OF OPERATIONS
 MANAGEMENT S DISCUSSION AND ANALYSIS OF FINANCIAL CONDITION AND RESULTS OF OPERATIONS TELEFONICA CELULAR DEL PARAGUAY S.A. As at and for the three month period ended 31 March 2017 1. Overview We are a
MD&A. Executive Summary. Operational Summary MANAGEMENT DISCUSSION AND ANALYSIS FIRST QUARTER 2018
 MD&A Executive Summary In Q118, dtac reported strong EBITDA growth of 21% YoY and EBITDA margin of 43.8%, mainly driven by lower handset subsidies and regulatory cost, despite 1.1%YoY decline in service
Telenor Group. Marianne Moe, Head of Investor Relations
 Telenor Group Marianne Moe, Head of Investor Relations Disclaimer The following presentation is being made only to, and is only directed at, persons to whom such presentation may lawfully be communicated
Source: ACAML Research
 Grameenphone October 30, 2014 ACAML Research research@acaml.com.bd Grameenphone Q3 14 Earnings Release DSE & CSE Ticker: GP Short term business challenges tarnished top line growth while strong data sub
Financial Results Presentation Q1 FY13: Quarter ended 30 June Aug 2012 Chua Sock Koong Group CEO
 Financial Results Presentation Q1 FY13: Quarter ended 30 June 2012 14 Aug 2012 Chua Sock Koong Group CEO Forward looking statement important note The following presentation contains forward looking statements
Q4 & FY 2018 RESULTS. 30 January 2019
 Q4 & FY 2018 RESULTS 30 January 2019 Safe harbor Alternative performance measures and management estimates This financial report contains a number of alternative performance measures (non-gaap figures)
Annual results presentation
 Annual results presentation Disclaimer The following presentation is being made only to, and is only directed at, persons to whom such presentations may lawfully be communicated ( relevant persons ) ).
TELENOR GROUP THIRD QUARTER Sigve Brekke, CEO
 TELENOR GROUP THIRD QUARTER Sigve Brekke, CEO DISCLAIMER The following presentation is being made only to, and is only directed at, persons to whom such presentation may lawfully be communicated ( relevant
WIND. Pushing forward. Q Preliminary Financial Results Unaudited
 WIND Pushing forward Q2 2006 Preliminary Financial Results Unaudited August 3, 2006 1 The following presentation is provided to you (each referred to hereafter as a Recipient ) for information purposes
Axiata Group Berhad. 1Q 2017 Results. 25 May Tan Sri Jamaludin Ibrahim, President & Group CEO Vivek Sood, Group CFO
 Axiata Group Berhad 1Q 2017 Results 25 May 2017 Tan Sri Jamaludin Ibrahim, President & Group CEO Vivek Sood, Group CFO Executive summary: Financials YoY within guidance, QoQ encouraging signs. 1Q17 double
Telenor Third Quarter 2006
 Telenor Third Quarter Group Overview Jon Fredrik Baksaas President and CEO The following presentations are being made only to, and is only directed at, persons to whom such presentation may lawfully be
Grameenphone Ltd. Business highlights. Michael Patrick Foley, CEO
 Grameenphone Ltd. Business highlights Michael Patrick Foley, CEO Disclaimer The following presentation is being made only to, and is only directed at, persons to whom such presentation may lawfully be
Disclaimer. Telenor Fourth Quarter 2010
 Telenor Fourth Quarter 2010 Jon Fredrik Baksaas, President and CEO Disclaimer The following presentation is being made only to, and is only directed at, persons to whom such presentation may lawfully be
MOBILE MARKET LEADER IN A FAST-GROWING ECONOMY
 February, 2018 DISCLAIMER The following presentation is being made only to, and is only directed at, persons to whom such presentation may lawfully be communicated ( relevant persons ). Any person who
Orascom Telecom Holding First Half 2009 Results
 Orascom Telecom Holding H1 - Orascom Telecom Holding First Half Results Cairo, August 25 th, : Orascom Telecom Holding (OTH) (Ticker: ORTE.CA, ORTEq.L, ORAT EY, OTLD LI), announces its first half consolidated
TELENOR GROUP Sigve Brekke, CEO
 TELENOR GROUP Sigve Brekke, CEO DISCLAIMER The following presentation is being made only to, and is only directed at, persons to whom such presentation may lawfully be communicated ( relevant persons ).
Zain Group Financial Results Q1 2018
 Zain Group Financial Results Q1 2018 2 Disclaimer Mobile Telecommunications Company KSCP Zain Group has prepared this presentation to the best of its abilities, however, no warranty or representation,
Q Interim report January March 2018
 Q1 Interim report January March Contents Highlights and Group performance 1 Outlook for 1 Interim report 5 Telenor s operations 5 Group performance 10 Interim condensed financial information 12 Notes to
Results 3Q18. Investor Relations Telefônica Brasil S.A. October, 2018
 Results Investor Relations Telefônica Brasil S.A. October, 2018 Disclaimer This presentation may contain forwardlooking statements concerning future prospects and objectives regarding growth of the subscriber
PT Indosat Tbk 1Q 2013 Results. Indosat IR - New Template v pptx
 PT Indosat Tbk 1Q 2013 Results 1 Agenda Financial and Operational Results Management Focus Supplemental Information 2 2 Financial and Operational Highlights 3 YoY Overview Consolidated Revenue growth of
Results for the First Quarter Vienna, 10 May 2012
 Results for the First Quarter 2012 Vienna, 10 May 2012 1 Cautionary Statement This presentation contains certain forward-looking statements. Actual results may differ materially from those projected or
Grameenphone Ltd. Business highlights. Michael Patrick Foley, CEO
 Grameenphone Ltd. Business highlights Michael Patrick Foley, CEO Disclaimer The following presentation is being made only to, and is only directed at, persons to whom such presentation may lawfully be
N o v e m b e r
 INVESTO R PRESENTAT ION N o v e m b e r 2 0 8 Disclaimer This presentation contains forward-looking statements, as the phrase is defined in Section 27A of the U.S. Securities Act of 933, as amended, and
RESULTS 2Q16. Investor Relations Telefônica Brasil S.A. July, 2016
 RESULTS Investor Relations Telefônica Brasil S.A. July, 2016 DISCLAIMER This presentation may contain forward-looking statements concerning future prospects and objectives regarding growth of the subscriber
Financial results presentation Q3 FY11: Quarter ended 31 Dec February 2011
 Financial results presentation Q3 FY11: Quarter ended 31 Dec 2010 10 February 2011 Forward looking statements - important note The following presentation contains forward looking statements by the management
Grameenphone Ltd. The Year Vivek Sood, CEO
 Grameenphone Ltd. The Year 2012 Vivek Sood, CEO 2012: Stronger Economy Kept GDP Growth momentum ~6.3% Moderate single digit Inflation 2.5% currency appreciation Record high foreign currency reserve 31%
Etisalat Group. Aspire Forward. Investor Presentation. May 2016
 Etisalat Group Investor Presentation May 2016 Aspire Forward Disclaimer Emirates Telecommunications Group Company PJSC and its subsidiaries ( Etisalat Group or the Company ) have prepared this presentation
Annual Report VEON Ltd. Claude Debussylaan 88, 1082 MD Amsterdam
 Annual Report 2017 VEON Ltd. Claude Debussylaan 88, 1082 MD Amsterdam The Financial Statements are approved by the Audit Committee on behalf of the Supervisory Board on March 15, 2018 TABLE OF CONTENTS
Disclaimer. Telenor Second Quarter 2008
 Telenor Second Quarter Disclaimer The following presentation is being made only to, and is only directed at, persons to whom such presentation may lawfully be communicated ( relevant persons ). Any person
Expanding our growth platform. February 2011
 Expanding our growth platform 0 VimpelCom 2011 Forward-looking statements This presentation contains "forward-looking statements. Forward-looking statements provide VimpelCom Ltd.'s current expectations
Financial Results Presentation Q3 FY12: Quarter ended 31 December February 2012 Chua Sock Koong Group CEO
 Financial Results Presentation Q3 FY12: Quarter ended 31 December 2011 13 February 2012 Chua Sock Koong Group CEO Forward looking statement important note The following presentation contains forward looking
Telekom Austria Group Results for the 2nd Quarter August 26, 2003
 Telekom Austria Group Results for the 2nd Quarter 2003 August 26, 2003 1 Cautionary Statement This presentation contains certain forward-looking statements. Actual results may differ materially from those
Axiata Group Berhad. 3Q 2018 Results. 23 November Tan Sri Jamaludin Ibrahim, President & Group CEO. Vivek Sood, Group CFO 3Q18
 Axiata Group Berhad 3Q 2018 Results 23 November 2018 Tan Sri Jamaludin Ibrahim, President & Group CEO Vivek Sood, Group CFO Disclaimer The following presentation contain statements about future events
Q4FY17 Financial Results Presentation
 Q4FY17 Financial Results Presentation For the quarter ended 31 Mar 2017 Chua Sock Koong, Group CEO 18 May 2017 Forward looking statement Important note The following presentation contains forward looking
Q Interim report January December 2017
 Q4 Interim report January December Contents Highlights and Group performance 1 Outlook for 2018 1 Interim report 5 Telenor s operations 5 Group performance 11 Interim condensed financial information 14
Deutsche Bank 12 th Annual European Leveraged Finance Conference. London - June 12, 2008
 Deutsche Bank 12 th Annual European Leveraged Finance Conference London - June 12, 2008 1 Wind Q1 2008 highlights Q1 2008 Revenues 1,300 million Q1 2008 EBITDA 456 million Fixed line 32% Mobile 68% Fixed
Ooredoo Group 9M 2018 Results September 2018
 Ooredoo Group 9M 2018 September 2018 Disclaimer Ooredoo (parent company Ooredoo Q.P.S.C.) and the group of companies which it forms part of ( Ooredoo Group ) cautions investors that certain statements
Second Quarter 2014 results
 Second Quarter 2014 results KPN shows another quarter of good strategic progress. The outlook is maintained. Continued operational progress in The Netherlands High postpaid net adds in Consumer Mobile
Q Interim report January December 2018
 Q4 Interim report January December Contents Highlights and Group performance 1 Outlook for 2019 1 Interim report 5 Telenor s operations 5 Group performance 12 Interim condensed financial information 14
Wind Tre First Half 2018 Results. 1 August 2018
 Wind Tre First Half 2018 Results 1 August 2018 H1 2018 highlights External environment Market Persistent and intense competition in both mobile and fixed markets Pricing pressure led by new entrant, main
PT Indosat Tbk 9M 2010 Results. Indosat Presentation 9M 2010 page 1
 PT Indosat Tbk 9M 2010 Results Indosat Presentation 9M 2010 page 1 Disclaimer PT Indosat Tbk cautions investors that certain statements contained in this document state management's intentions, hopes,
ETISALAT GROUP Q RESULTS PRESENTATION - ABU DHABI, UAE
 ETISALAT GROUP Q4 2018 RESULTS PRESENTATION - ABU DHABI, UAE 20TH FEBRUARY 2019 1 DISCLAIMER Emirates Telecommunications Group Company PJSC and its subsidiaries ( Etisalat Group or the Company ) have prepared
Financial Results Presentation Q2 FY13: Quarter ended 30 September November 2012 Chua Sock Koong Group CEO
 Financial Results Presentation Q2 FY13: Quarter ended 30 September 2012 14 November 2012 Chua Sock Koong Group CEO Forward looking statement important note The following presentation contains forward looking
TIM Participações S.A. 9ª Conferência Anual Santander - Brasil Agosto/2008
 TIM Participações S.A. 9ª Conferência Anual Santander - Brasil Agosto/2008 Market overview Operation 2Q08 highlights 2H08 perspectives Financials 2 Telecom Industry Overview Mobile Fixed Broadband 56%