Earnings Presentation Fourth Quarter and Full Year March :00 noon UK time
|
|
|
- Albert Eaton
- 5 years ago
- Views:
Transcription
1 Earnings Presentation Fourth Quarter and Full Year March :00 noon UK time
2 Forward-looking statements Certain statements made in this announcement may include forward-looking statements. These statements may be identified by the use of words like anticipate, believe, could, estimate, expect, forecast, intend, may, might, plan, predict, project, scheduled, seek, should, will, and similar expressions. The forward-looking statements reflect our current views and are subject to risks, uncertainties and assumptions. The principal risks and uncertainties which could impact the Group and the factors which could affect the actual results are described but not limited to those in the Risk factors section in the Group s Annual Report and Consolidated Financial Statements for the year ended 31 December These factors, and others which are discussed in our public announcements, are among those that may cause actual and future results and trends to differ materially from our forward-looking statements: actions by regulatory authorities or other third parties; our ability to recover costs on significant projects; the general economic conditions and competition in the markets and businesses in which we operate; our relationship with significant clients; the outcome of legal and administrative proceedings or governmental enquiries; uncertainties inherent in operating internationally; the timely delivery of vessels on order and the timely completion of vessel conversion programmes; the impact of laws and regulations; and operating hazards, including spills and environmental damage. Many of these factors are beyond our ability to control or predict. Other unknown or unpredictable factors could also have material adverse effects on our future results. Given these factors, you should not place undue reliance on the forward-looking statements. 2
3 Q summary HIGHLIGHTS FINANCIAL OPERATIONAL ORDER IN-TAKE Underlying results in line with expectations Good project execution and progress Guará-Lula NE project achieved key operational milestones. Fulllife loss provision was increased by $49 million 15% Adjusted EBITDA margin, including further full-life loss provision on Guará-Lula NE Financial position remains strong; $500 million convertible notes redeemed or converted and $200 million share repurchase commenced Global vessel utilisation of 80% New vessel construction programme progressing in line with time and cost estimates CLOV hybrid riser towers installation completed according to plan Record $11.8bn backlog maintained, of which over 80% is SURF Awards announced in Q4 included TEN project, the first major award in Ghana, and two PLSV contract renewals in Brazil, bringing total PLSV renewals to five in the year 3
 11.8 11.8 10.2 10.4 7.9 7.9 8.")


4 Quality backlog - good spread by geography and contract mix Backlog progression ($ billions) Q1'11 Q2'11 Q3'11 Q4'11 Q1'12 Q2'12 Q3'12 Q4'12 Q1'13 Q2'13 Q3'13 Q4'13 Backlog by Award Date Backlog by Execution Date Backlog by Territory % < % % % % % % NSC 32% AFGOM 25% Brazil 37% APME 6% 4
5 Operational highlights AFGOM APME BRAZIL NSC CLOV progressed well; successful installation of two hybrid riser towers Block 31 PSVM project neared completion and Block 31 GES commenced its offshore phase L60 and L67 projects in Mexico made significant progress offshore AOM Gorgon Heavy Lift and Tie-ins prepared for its offshore phase Gumusut project in Malaysia was successfully completed Guará-Lula NE project achieved key milestones, including complete installation of the first buoy and submerging and temporary tethering of the second buoy; riser fabrication onshore was completed at Ubu spoolbase sssdd PLSVs performed well in the quarter Life-of-Field activities continued for Shell, BP, Total and DSVi The Otter project was completed and the Knarr and Oseberg Delta S2 projects progressed significantly Project management, engineering and procurement continued on Martin Linge, Aasta Hansteen, Western Isles and Montrose 5


6 Vessels under construction Ship Principal Details Mission Equipment Operational Seven Waves 149.5m x 29.9m x 13m Accommodation for 120 Service Speed 13 knots DP* II Long Term Petrobras Contract PLSVs 2, 3 & m x 29.9m x 13m Accommodation for 120 Service Speed 13 knots DP* II Long Term Petrobras Contract Seven Kestrel 123m x 24m x 10.5m Accommodation for 110 Service Speed 13 knots DP* II 550t Tiltable Lay System 400t Crane 2 x Work class ROV 1,500t Carousel 2,500t Carousel 550t Tiltable Lay System 100t Crane 2 x Work class ROV 1,500t Carousel 2,500t Carousel 18 Man Twin Bell Saturation Dive System 120t Crane 1 x Observation class ROV 2 nd Quarter th Quarter nd Quarter th Quarter th Quarter 2015 Seven Arctic 159.8m x 32m x 13.5m Accommodation for 132 Service Speed 15 knots DP* III 325t Vertical Lay System 900t Crane 100t Crane 7000t Carousel 2 x Work class ROV 1 st Quarter 2016 *DP Dynamic Positioning 6
7 Income statement key highlights In $ millions, unless otherwise indicated Three months ended Twelve months ended 31 Dec Dec Dec Dec 12 Revenue 1,586 1,611 6,297 6,297 Net operating income (NOI) Gain on sale of NKT Flexibles Income before taxes ,069 Taxation (42) (22) (161) (222) Net income Adjusted EBITDA ,139 Adjusted EBITDA margin 15.3% 16.8% 15.6% 18.1% Diluted earning per share 2 $0.22 $0.38 $0.99 $1.59 Weighted average number of common shares m 394.5m 374.7m 380.2m 1 Adjusted EBITDA defined in Appendix 2 EPS for 2012 adjusted to exclude gain on disposal of Group s share of NKT Flexibles 3 In Q4 13, the 2014 and 2017 convertible bonds were dilutive and the 2013 convertible notes were anti-dilutive up to the date of conversion/redemption 7
8 Territory performance Q AFGOM $673m Brazil $206m $89m Revenue NOI Revenue NOI ($13m) APME NSC $544m $160m $9m $63m Revenue NOI Revenue NOI Note: excludes contribution from Corporate segment 8
9 Territory performance full year 2013 AFGOM $2,454m Brazil $814m $402m Revenue NOI Revenue NOI ($318m) APME NSC $2,514m $498m $395m $86m Revenue NOI Revenue NOI Note: excludes contribution from Corporate segment 9
10 Income statement supplementary details In $ millions Three months ended Twelve months ended 31 Dec Dec Dec Dec 12 Administrative expenses (81) (106) (296) (373) Share of net income of associates and joint ventures Net operating income Finance costs net of finance income (9) (13) (49) (29) Other gains and losses 14 3 (14) 290 Income before taxes ,069 Taxation (42) (22) (161) (222) Non-controlling interests 7 (8) (2) (17) Net income after non-controlling interests
11 Overview of 2013 cash flow $ millions Cash and cash equivalents at 31 Dec ,288 Net cash generated from operating activities 981 Net cash used in investing activities (679) Net cash used in financing activities (915) Includes decrease in net operating assets of $330m Includes capital expenditure of $739m mainly on vessel construction programme Includes $337m for redemption for cash of convertible notes; $199m dividend paid to Subsea 7 S.A. shareholders; $158m repayment of Seven Havila loan; and $115m loan to JV to fund construction of Seven Viking Other movements (25) Cash and cash equivalents at 31 Dec
12 Summary balance sheet In $ millions Assets Non-current assets 31 Dec Dec 2012 Goodwill 2,585 2,575 Property, plant and equipment 4,098 3,748 Other non-current assets Total non-current assets 7,221 6,674 Current Assets Trade and other receivables 1,008 1,090 Assets classified as held for sale Construction contracts - assets Other accrued income and prepaid expenses Cash and cash equivalents 650 1,288 Other current assets Total current assets 3,136 3,821 Total Assets 10,357 10,495 In $ millions Equity & Liabilities 31 Dec Dec 2012 Total Equity 6,612 6,368 Non-current liabilities Non-current portion of borrowings 636 1,041 Other non-current liabilities Total non-current liabilities 895 1,258 Current Liabilities Trade and other liabilities 1,637 1,452 Current portion of borrowings Liabilities associated with assets held for sale Construction contracts - liabilities Deferred revenue 3 77 Other current liabilities Total current liabilities 2,850 2,869 Total liabilities 3,745 4,127 Total equity & liabilities 10,357 10,495 12
13 2014 financial guidance Group revenue expected to increase from 2013 level Adjusted EBITDA expected to increase moderately from that achieved in 2013 after adding back the $355 million full life loss provision recognised on the Guará-Lula NE project Capex: $900 million - $1.0 billion, comprising $ million for the six new-build vessels under construction $ million for operating capex to maintain the existing fleet $ million for vessel enhancements, i-tech ROVs, offshore equipment and onshore facilities Other net income related guidance Administrative expenses: $ million Net finance costs: less than $10 million Depreciation and amortisation expense: $ million Full year 2014 effective tax rate: 29-31% 13
14 2014 financial guidance (continued) Contribution from Seaway Heavy Lifting joint venture expected to decline, due to a multi-month in-shipyard life extension of the Stanislav Yudin; SapuraAcergy s contribution also expected to decline from record high level in 2013 Share repurchase programme continuing: $114.6 million of $200 million authorisation executed through 4 March 2014 (5.94 million shares repurchased) 14
15 Vessel new build programme: realised and projected capex 1 $millions Total (E) - $1.9 billion Up to 31 Dec E 2015 E 2016 E Notes: 1 Comprises four PLSVs being constructed for long-term contracts with Petrobras (including Seven Waves), and construction of the Seven Arctic and the Seven Kestrel. Amounts include an estimate for interest to be capitalised during construction. 2 Includes $185 million capitalised in 2012 on the six vessels. 15
16 Market overview and outlook Delays in project awards remain a feature of the industry, driven by clients capex constraints AFGOM Timing of future market awards uncertain but SURF tendering activity is good in West and East Africa Short-term softening in West Africa for Conventional services US Gulf of Mexico tendering is increasing from a low base APME A number of large SURF projects are being tendered in Asia; timing of awards is uncertain; Gendalo-Gehem in Indonesia in focus Project awards by clients in Australia impacted by costs; Life-of- Field work expected to increase 16
17 Market overview and outlook (continued) Brazil Benefits of PLSV renewals to be fully reflected from H onwards NSC Continuing strong demand for Life-of-Field work and our Bundle offering Market awards for some large SURF projects currently delayed in the UK and Norwegian sectors Seven Oceans and Skandi Acergy will be deployed outside North Sea throughout
18 Summary 2013 was another year of good performance for Subsea 7, marred by one challenging project Q saw solid results despite the additional $49 million full-life loss provision on Guará-Lula NE project Order intake expected to slow in the first half of 2014 Vessel construction programme on track with consequential increase in capex in 2014 The turnaround in Brazil on track supported by renewal of existing PLSV contracts and deployment of new-build Seven Waves For 2014, Group revenue is expected to increase from 2013 level; Adjusted EBITDA is expected to increase moderately from that achieved in 2013 after adding back the $355 million loss provision on the Guará-Lula NE project We remain positive about medium- and long-term market prospects 18

19 Appendix 19
20 Major project progression Continuing projects >$100m between 5% and 95% complete as at 31 Dec 2013 excl. long-term PLSV contracts and Life-of-Field day-rate contracts Line 60 (Mexico) West Franklin (North Sea) Laggan Tormore (North Sea) CLOV (Angola) G1 (APME) Guará-Lula NE (Brazil) Eldfisk (North Sea) Knarr (North Sea) Block 31 GES (Angola) Clair Ridge (North Sea) Enochdhu (North Sea) Ofon 2 (Nigeria) Delta S2 (North Sea) Lianzi SURF (Angola) Gorgon HLTI (Australia) Lianzi Topside (Angola) Erha North (Nigeria) Martin Linge (North Sea) Mariner (North Sea) Dana Western Isles (North Sea) Montrose (North Sea) Africa, Gulf of Mexico & Mediterranean (AFGOM) Asia Pacific & Middle East (APME) Brazil North Sea & Canada (NSC) 0% 20% 40% 60% 80% 100% 20
21 Segmental analysis For the three months ended 31 Dec 2013 In $ millions, Unaudited AFGOM APME BRAZIL NSC CORP TOTAL Revenue ,585.7 Net operating income/(loss) from ops (12.7) 63.3 (39.0) Finance income 3.5 Other gains and losses 13.6 Finance costs (12.7) Income before taxes For the three months ended 31 Dec 2012 In $ millions, Unaudited AFGOM APME BRAZIL NSC CORP TOTAL Revenue ,610.7 Net operating income/(loss) from ops (29.4) Finance income 6.1 Other gains and losses 2.7 Finance costs (18.6) Income before taxes
22 Adjusted EBITDA Adjusted earnings before interest, taxation, depreciation and amortisation ( Adjusted EBITDA ) is a non-ifrs measure that represents net income before additional specific items that are considered to impact the comparison of the Group s performance either year-on-year or with other businesses. The Group calculates Adjusted EBITDA as net income plus finance costs, taxation, depreciation, amortisation and mobilisation and adjusted to exclude finance income, other gains and losses and impairment charges or reversals. Adjusted EBITDA margin is defined as Adjusted EBITDA divided by revenue. The items excluded from Adjusted EBITDA represent items which are individually or collectively material but which are not considered representative of the performance of the business during the periods presented. Other gains and losses principally relate to disposals of investments, property, plant and equipment and net foreign exchange gains or losses. Impairments of assets represent the excess of the assets carrying amount over the amount that is expected to be recovered from their use in the future or their sale. Adjusted EBITDA and Adjusted EBITDA margin have not been prepared in accordance with IFRS as issued by the IASB as adopted for use in the EU. These measures exclude items that can have a significant effect on the Group s income or loss and therefore should not be considered as an alternative to, or more meaningful than, net income (as determined in accordance with IFRS) as a measure of the Group s operating results or cash flows from operations (as determined in accordance with IFRS) as a measure of the Group s liquidity. Management believes that Adjusted EBITDA and Adjusted EBITDA margin are important indicators of the operational strength and the performance of the business. These non-ifrs measures provide management with a meaningful comparative for its various Territories, as they eliminate the effects of financing, depreciation and taxation. Management believes that the presentation of Adjusted EBITDA is also useful as it is similar to measures used by companies within Subsea 7 s peer group and therefore believes it to be a helpful calculation for those evaluating companies within Subsea 7 s industry. Adjusted EBITDA margin may also be a useful ratio to compare performance to its competitors and is widely used by shareholders and analysts following the Group s performance. Notwithstanding the foregoing, Adjusted EBITDA and Adjusted EBITDA margin as presented by the Group may not be comparable to similarly titled measures reported by other companies. 22
23 Reconciliation of Adjusted EBITDA Net operating income to Adjusted EBITDA For the period (in $millions) Three Months Ended 31 Dec 2013 Unaudited Three Months Ended 31 Dec 2012 Unaudited Net operating income Depreciation, amortisation and mobilisation Impairment 36 3 Adjusted EBITDA Revenue 1,586 1,611 Adjusted EBITDA % 15.3% 16.8% Net income to Adjusted EBITDA For the period (in $millions) Three Months Ended 31 Dec 2013 Unaudited Three Months Ended 31 Dec 2012 Unaudited Net income Depreciation, amortisation and mobilisation Impairment 36 3 Finance income (4) (6) Other gains and losses (14) (3) Finance costs Taxation Adjusted EBITDA Revenue 1,586 1,611 Adjusted EBITDA % 15.3% 16.8% 23

, in water depths up to 1,300m Installation of the Gorgon (59km) and Jansz (136km)")
24 Gorgon Heavy Lift and Tie-ins, and Umbilicals - Australia Located 130km off the northwest coast of Western Australia The Gorgon project is one of the world's largest natural gas projects Heaviest and deepest subsea lifts in the history of Subsea 7 20 subsea structures and foundations (up to circa 1000Te), 15 heavy spools (up to circa 200Te), in water depths up to 1,300m Installation of the Gorgon (59km) and Jansz (136km) umbilicals 24


25 CLOV Block 17 - Angola Technology-rich SURF project High local content with Sonamet fabrication facility Successful deployment of Seven Borealis to install 40km of pipe-in-pipe production, 60km of water injection, 32km of gas export, and 37 spools and 15 jumpers Two Hybrid Riser Towers and a Single Hybrid Riser at the end of the gas export line using proprietary bundle/riser technology 25
 in the Norwegian Sea,")

26 Aasta Hansteen gas field - Norway Technology-rich SURF project 1200m water depth, deepest in North Sea 300km off northern Norway, harsh environment First SCRs (x4) in the Norwegian Sea, manufactured at Vigra spool base First installation of BUTTING Bubi mechanically lined pipe by reeling in the North Sea using the Seven Oceans New permanent office set up in Tromsø, Northern Norway 26
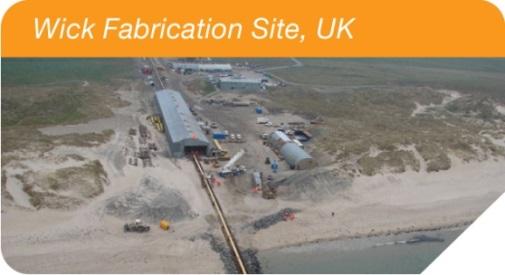
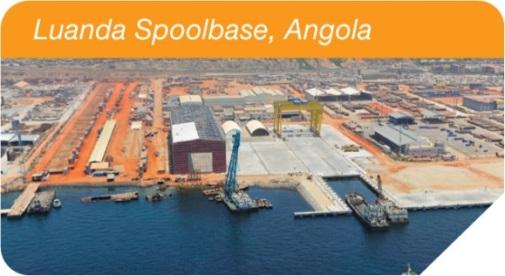


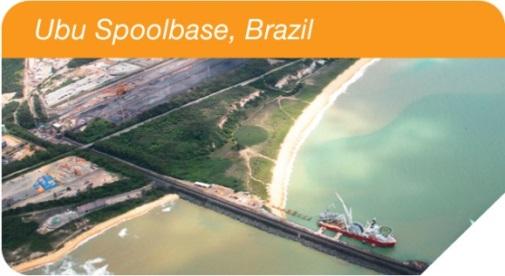


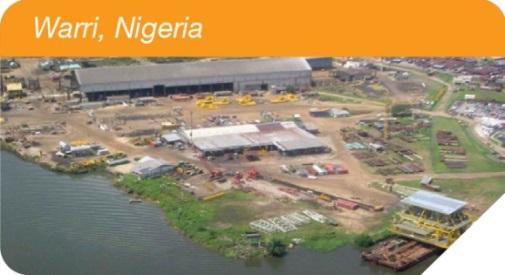
27 Operational facilities Spoolbases Fabrication Yards 27

28 Rigid pipelay/heavy lift assets 28

29 Diving Support Vessels 29
30 Construction/vertical flex-lay assets 30
31 Construction/horizontal flex-lay assets 31

32 Light construction/life-of-field assets 32

33 Other assets 33

34 Under construction

35 35
Earnings Presentation Second Quarter July :00 noon UK time
 Earnings Presentation Second Quarter 2015 29 July 2015 12:00 noon UK time Forward-looking statements Certain statements made in this announcement may include forward-looking statements. These statements
Third Quarter November 2, 2011
 Earnings Presentation Third Quarter 2011 November 2, 2011 12:00 200noon UK time Forward-looking statements Certain statements made in this announcement may include forward-looking statements within the
Earnings Presentation Second Quarter and Half Year August 10, :00 noon UK time
 Earnings Presentation Second Quarter and Half Year 2011 August 10, 2011 12:00 noon UK time Forwardlooking statements Certain statements made in this announcement may include forwardlooking statements within
Subsea 7 S.A. Announces Second Quarter & Half Year 2013 Results
 Subsea 7 S.A. Announces & 2013 Results Luxembourg 14 August 2013 Subsea 7 S.A. (the Group ) (Oslo Børs: SUBC) announced today results for the second quarter and first half 2013 which ended on 30 June 2013.
Subsea 7 S.A. Announces First Quarter 2016 Results
 Subsea 7 S.A. Announces First Quarter 2016 Results Luxembourg 28 April 2016 Subsea 7 S.A. (the Group) (Oslo Børs: SUBC, ADR: SUBCY) announced today results for the first quarter which ended 31 March 2016.
Subsea 7 S.A. Announces First Quarter 2013 Results
 Subsea 7 S.A. Announces First Quarter Results Luxembourg 16 May Subsea 7 S.A. (the Group ) (Oslo Børs: SUBC) announced today results for the first quarter which ended on ch. Unless otherwise stated, the
SUBSEA 7 INC. REPORT FOR THE THIRD QUARTER UNAUDITED. 26 October 2010
 SUBSEA 7 INC. REPORT FOR THE THIRD QUARTER 2010 - UNAUDITED 26 October 2010 Subsea 7 Inc. (Oslo Stock Exchange: SUB) today reports the third quarter results for 2010. PERFORMANCE SUMMARY Quarter Highlights
Subsea 7 S.A. Announces Third Quarter 2016 Results
 Subsea 7 S.A. Announces Third Quarter 2016 Results Luxembourg 10 November 2016 Subsea 7 S.A. (the Group) (Oslo Børs: SUBC, ADR: SUBCY) announced today results for the third quarter 2016 which ended 30
Earnings Presentation Fourth Quarter and Full Year March 2017
 Earnings Presentation Fourth Quarter and Full Year 2016 2 March 2017 1 Forward-looking statements Certain statements made in this announcement may include forward-looking statements. These statements may
Second Quarter 2017 Earnings Presentation
 Second Quarter 2017 Earnings Presentation 26 July 2017 1 Subsea 7-2017 Forward-looking statements Certain statements made in this presentation may include forward-looking statements. These statements may
Subsea 7 S.A. Announces Second Quarter & Half Year 2011 Results
 Subsea 7 S.A. Announces Second Quarter & Half Year 2011 Results Luxembourg August 10, 2011 Subsea 7 S.A. (formerly Acergy S.A.) (the Group ) (Oslo Børs: SUBC) announced today results for the second quarter
Subsea 7 Inc. Earnings Presentation Quarter Ended 30 September subsea partner of choice.
 Subsea 7 Inc. Earnings Presentation Quarter Ended 3 September 21 1 Highlights Strong project execution in all regions Announced major contracts with a value in excess of USD 4 million during the quarter
SUBSEA 7 INC. REPORT FOR THE SECOND QUARTER AND HALF YEAR UNAUDITED. 27 July 2010
 SUBSEA 7 INC. REPORT FOR THE SECOND QUARTER AND HALF YEAR 2010 - UNAUDITED 27 July 2010 Subsea 7 Inc. (Oslo Stock Exchange: SUB) today reports the second quarter and half year results for 2010. PERFORMANCE
Third Quarter 2017 Earnings Presentation
 Third Quarter 2017 Earnings Presentation 9 November 2017 1 Subsea 7-2017 Forward-looking statements Certain statements made in this presentation may include forward-looking statements. These statements
Subsea 7 S.A. Announces Third Quarter 2017 Results
 Subsea 7 S.A. Announces Third Quarter 2017 Results Luxembourg 9 November 2017 Subsea 7 S.A. (the Group) (Oslo Børs: SUBC, ADR: SUBCY, ISIN: LU0075646355) announced today results for the third quarter which
Third Quarter 2018 Earnings Presentation
 Third Quarter 2018 Earnings Presentation 8 November 2018 1 Subsea 7-2018 Forward-looking statements Certain statements made in this presentation may include forward-looking statements. These statements
Acergy S.A. Announces Third Quarter Results
 S.A. Announces Third Quarter Results London, England October 13, S.A. (NASDAQ-GS: ACGY; Oslo Stock Exchange: ACY), announced today results for the third quarter which ended on August 31,. Highlights -
SUBSEA 7 INC. THIRD QUARTER REPORT UNAUDITED. 27 October 2009
 SUBSEA 7 INC. THIRD QUARTER REPORT 2009 - UNAUDITED 27 October 2009 Subsea 7 Inc. (Oslo Stock Exchange: SUB) today reports the results for the third quarter of 2009. PERFORMANCE SUMMARY Quarter Highlights
SUBSEA 7 INC. REPORT FOR THE FOURTH QUARTER AND PRELIMINARY YEAR END RESULTS FOR UNAUDITED. 2 February 2010
 SUBSEA 7 INC. REPORT FOR THE FOURTH QUARTER AND PRELIMINARY YEAR END RESULTS FOR 2009 - UNAUDITED 2 February 2010 Subsea 7 Inc. (Oslo Stock Exchange: SUB) today reports the fourth quarter and preliminary
Subsea 7 S.A. Announces Third Quarter 2018 Results
 Subsea 7 S.A. Announces Third Quarter 2018 Results Luxembourg 8 November 2018 Subsea 7 S.A. (the Group) (Oslo Børs: SUBC, ADR: SUBCY, ISIN: LU0075646355) announced today results for the third quarter which
Investor Presentation. November 2016
 Investor Presentation November 2016 1 Index What we do Our differentiators Our priorities Our outlook Our financials Appendix 2 What we do Our differentiators Our priorities Our outlook Our financials
Subsea 7 S.A. Announces Fourth Quarter and Full Year 2017 Results
 Subsea 7 S.A. Announces Fourth Quarter and Full Year 2017 Results Luxembourg 1 March 2018 Subsea 7 S.A. (the Group) (Oslo Børs: SUBC, ADR: SUBCY, ISIN: LU0075646355) announced today results for the fourth
24 October 2006 Subsea 7 Inc. (Oslo Stock Exchange: SUB) today reports the results for the third quarter of 2006.
 today reports the results for the third quarter of 2006.") SUBSEA 7 INC. REPORT FOR THE THIRD QUARTER 2006 24 October 2006 Subsea 7 Inc. (Oslo Stock Exchange: SUB) today reports the results for the third quarter of 2006. PERFORMANCE SUMMARY Financial Results Quarter
SUBSEA 7 INC. REPORT FOR THE THIRD QUARTER 2006 24 October 2006 Subsea 7 Inc. (Oslo Stock Exchange: SUB) today reports the results for the third quarter of 2006. PERFORMANCE SUMMARY Financial Results Quarter
SUBSEA 7 INC. REPORT FOR THE FIRST QUARTER April 2009
 SUBSEA 7 INC. REPORT FOR THE FIRST QUARTER 2009 21 April 2009 Subsea 7 Inc. (Oslo Stock Exchange: SUB) today reports results for the first quarter of 2009. PERFORMANCE SUMMARY Quarter Highlights Good project
Q4 Financial Presentation 2015 DOF ASA
 Q4 Financial Presentation 2015 Highlights Main Highlights EBITDA Q4 MNOK 818 (operational EBITDA MNOK 814) EBITDA 2015 MNOK 3 719 (operational EBITDA MNOK 3 344) General good operational performance in
Quarterly Presentation Q DOF Subsea Group
 Quarterly Presentation Q2 2018 Group Group at a glance 2005 established NOK 1.2bn 1) Revenues Q2 18 NOK 15.9bn Firm backlog Q2 18 1 190 2) Subsea employees worldwide Q2 18 Integrated Supplier of subsea
SECOND QUARTER AND FIRST HALF 2003 RESULTS First Half EBITA Up 10% Offshore Order Intake Leads to Record Backlog
 PRESS RELEASE Paris, September 5, SECOND QUARTER AND FIRST HALF RESULTS First Half EBITA Up 10% Offshore Order Intake Leads to Record Backlog Euros in millions 2 nd Quarter 1 st Half June 30 Backlog 7,572
Quarterly Presentation Q DOF Subsea Group
 Quarterly Presentation Q3 2018 Group Group at a glance 2005 established NOK 1.2bn 1) Revenues Q3 18 NOK 15.1bn Firm backlog Q3 18 1 322 2) Subsea employees worldwide Q3 18 Integrated Supplier of subsea
2018 first quarter results
 First quarter 2018 review 2018 first quarter results Statoil reports adjusted earnings of USD 4.4 billion and USD 1.5 billion after tax in the first quarter of 2018. IFRS net operating income was USD 5.0
FIRST QUARTER the Clair Ridge platform in the UK around end of May.
 FIRST QUARTER 2018 EBITDA for the first quarter amounted to USD 49.2 million (USD 32.8 million). Despite lower vessels utilisation in the quarter, EBITDA is higher due to lower operating expenses from
OCEANTEAM SHIPPING ASA
 OCEANTEAM SHIPPING ASA An Oslo Stock Exchange listed shipping company Ticker: OTS CEO: Haico Halbesma CFO: Torbjørn Skulstad Q3 presentation Oslo 14th November 2011 1 Agenda Company Overview Financials
First Quarter Change Revenues 1, , % Operating Income from Recurring Activities
 PRESS RELEASE Paris, May 15, 2007 FIRST QUARTER 2007 RESULTS Operating income from recurring activities: + 237% Operating margin ratio from recurring activities: 6.1% Earnings per share: + 103% (except
FIRST QUARTER 2005 RESULTS Earnings per Share Up by One-Third Order Intake Doubles
 PRESS RELEASE Paris, May 19, 2005 FIRST QUARTER 2005 RESULTS Earnings per Share Up by One-Third Order Intake Doubles First Quarter IFRS (except EPS and E/ADS) 2005 2004 Change Backlog at March 31 7,184
PACC Offshore Services Holdings Ltd. Corporate Overview SGX-Goldman Marine Oil & Gas Corporate Day 3 March 2017
 PACC Offshore Services Holdings Ltd. Corporate Overview SGX-Goldman Marine Oil & Gas Corporate Day 3 March 2017 Overview 1. About POSH 2. Our Competitive Strengths 3. Our Fleet 4. Q4 and FY 2016 Financial
FOURTH QUARTER Highlights. Operations
 FOURTH QUARTER 2017 EBITDA for the fourth quarter amounted to USD 40.1 million (USD 78 million). This decline is mainly due to lower utilisation of the vessels. Cash flow from operations was USD 44.2 million
Saipem: Board of Directors approves six-month report at June 30, 2011 H1 PROFITS AT RECORD LEVELS
 Saipem: Board of Directors approves six-month report at June 30, H1 PROFITS AT RECORD LEVELS Net profit for the second quarter of amounted to Euro 225 million, a 13.6% increase compared to the second quarter
Technip Fourth Quarter and Full Year 2016 Results. February 24, 2017
 Technip Fourth Quarter and Full Year 2016 Results February 24, 2017 Safe Harbour This presentation contains both historical and forward-looking statements. These forward-looking statements are not based
First-quarter results 2014
 1Q First-quarter results 2014 April 30, 2014 2014 Aker Solutions www.akersolutions.com Financial highlights First-quarter Revenue (NOK million) 10,312 11,229 results 2014 1Q 2013 2Q 2013 3Q 2013 4Q 2013
Disclaimer Page 2
 Disclaimer This presentation should be read in conjunction with Vard Holdings Limited s results for the period ended 30 June 2015 in the SGXNet announcement. Financial figures are presented according to
BG Group plc 2015 FIRST QUARTER RESULTS 8 May 2015
 8 May 2015 Key Points Recommended cash and share offer for BG Group by Royal Dutch Shell Helge Lund joined BG Group as Chief Executive Commissioning of QCLNG progressing to plan; nine cargoes shipped Brazil
Presentation to the Financial Community. First Half 2011 Results
 Presentation to the Financial Community First Half 2011 Results July 2011 Forward-Looking Statements By their nature, forward-looking statements are subject to risk and uncertainty since they are dependent
OCEANTEAM SHIPPING ASA
 OCEANTEAM SHIPPING ASA Ticker: OTS CEO: Haico Halbesma CFO: Torbjørn Skulstad An Oslo Stock Exchange listed shipping company Q4 presentation Oslo 16th February 2012 1 Agenda Company Overview Financials
PREPARING FOR THE RECOVERY
 PREPARING FOR THE RECOVERY FINANCIAL REPORT Q3 2018 DOF Subsea AS Thormøhlens gate 53 C 5006 Bergen NORWAY www.dofsubsea.com Index Financial Report 3 rd quarter 2018... 4 Financial statements 3 rd quarter
SECOND QUARTER AND FIRST HALF REPORT Financials. New builds and projects
 SECOND QUARTER AND FIRST HALF REPORT 2014 Financials (Figures in brackets refer to the corresponding period of 2013) Second quarter Utilisation of the vessel fleet was 84 per cent (84 per cent) in the
THIRD QUARTER a one-month option, and is scheduled to commence mid-may 2019 following the completion of the Johan Sverdrup contract.
 THIRD QUARTER 2018 (Figures in brackets refer to the corresponding period of 2017) In the third quarter, Prosafe finalised the transforming agreements with COSCO and its lenders, secured several contracts
TGS EARNINGS RELEASE 1 st QUARTER RESULTS
 TGS EARNINGS RELEASE 25 APRIL 2013 TGS EARNINGS RELEASE 1 st QUARTER RESULTS 1 st QUARTER HIGHLIGHTS Consolidated net revenues were USD 211 million, an increase of 10% compared to Q1 2012. Net late sales
TechnipFMC Announces Fourth Quarter 2017 Results
 TechnipFMC Announces Fourth Quarter 2017 Results February 21, 2018 Successful first year; strong operational performance across all segments Full-year subsea orders of $5.1 billion increased 27% 1 over
UNAUDITED FINANCIAL STATEMENTS AND DIVIDEND ANNOUNCEMENT FOR THE SECOND QUARTER AND THE SIX MONTHS ENDED 30 JUNE 2018
 Registration Number: 200603185Z FOR THE SECOND QUARTER AND THE SIX MONTHS ENDED 30 JUNE 2018 Introduction PACC Offshore Services Holdings Ltd. ("POSH") is one of Asia s largest operators of offshore support
First Quarter 2014 Conference Call
 First Quarter 2014 Conference Call April 22, 2014 Forward-Looking Statements This presentation contains forward-looking statements that involve risks, uncertainties and assumptions that could cause our
SECOND QUARTER AND FIRST HALF REPORT 2018
 SECOND QUARTER AND FIRST HALF REPORT 2018 EBITDA for the second quarter amounted to USD 57.1 million (USD 26.4 million). Higher EBITDA is mainly due to better utilisation, higher average day rates, cost
TechnipFMC Announces Second Quarter 2018 Results
 Press Release TechnipFMC Announces Second Quarter 2018 Results Net income of $105.7 million and adjusted EBITDA of $377.2 million Inbound orders of $4.2 billion; orders exceeded revenue in all segments
FOURTH QUARTER Recent highlights
 FOURTH QUARTER 2018 (Figures in brackets refer to the corresponding period of 2017) In the fourth quarter, the fleet utilisation 1 reached its highest since Q3 2015 at 63 per cent. A further two contracts
Bibby Offshore Holdings Limited: Full Year 2016 Results
 23 March 2017 Bibby Offshore Holdings Limited: Full Year 2016 Results Bibby Offshore Holdings Limited ( Bibby Offshore or the Group or BOHL ), a leading provider of subsea installation, inspection, repair
Cowen and Company 4th Annual Ultimate Energy Conference. December 2, 20140
 Cowen and Company 4th Annual Ultimate Energy Conference December 2, 20140 Cautionary Statement Regarding Forward Looking Statements This presentation contains forward-looking statements. Forward-looking
Third quarter Financial statements and review
 Third quarter 2018 Financial statements and review Third quarter 2018 review Equinor third quarter 2018 and first nine months results Equinor reports adjusted earnings of USD 4.8 billion and USD 2.0 billion
Saipem: Board of Directors approves Interim Report as at March 31, 2011 IMPROVED RESULTS VERSUS Q1 2010
 Interim Report at March 31, 2011 Saipem: Board of Directors approves Interim Report as at March 31, 2011 IMPROVED RESULTS VERSUS Revenues amounted to Euro 2,954 million: +11.9% compared to the first quarter.
o1 OCEANTEAM SHIPPING ASA Q4 2012
 o1 OCEANTEAM SHIPPING ASA Q4 2012 INTERIM REPORT 4 th QUARTER 2012 OCEANTEAM SHIPPING ASA o2 OCEANTEAM SHIPPING ASA Q4 2012 OCEANTEAM SHIPPING ASA Q4 2012 INTERIM REPORT Issue date 21 st February 2013
UNAUDITED FINANCIAL STATEMENTS AND DIVIDEND ANNOUNCEMENT FOR THE FOURTH QUARTER AND THE YEAR ENDED 31 DECEMBER 2016
 Registration Number: 200603185Z Introduction PACC Offshore Services Holdings Ltd. ("POSH") is one of Asia s largest operator of offshore support vessels, with a diversified fleet servicing offshore oil
ASL Marine Corporate Presentation 1H FY2013
 ASL Marine Corporate Presentation 1H FY2013 Presentation Outline Group Overview 1H FY2013 Financial Review (6 months ended 31 December 2012) Operations Review Business Outlook 2 Group Overview 3 Company
January March 2010 Conference Call. Georg Denoke Member of the Executive Board & CFO 4 May 2010
 January March 2010 Conference Call Georg Denoke Member of the Executive Board & CFO 4 May 2010 Disclaimer This presentation contains forward-looking statements about Linde AG ( Linde ) and their respective
Q1 Financial Results
 Q1 Financial Results June 19, 2014 Stuart Bradie President and Chief Executive Officer Brian Ferraioli EVP and Chief Financial Officer Zachary Nagle VP Investor Relations Forward Looking Statements Forward
January June 2008 Conference Call. Georg Denoke, CFO August 1, 2008
 January June 2008 Conference Call Georg Denoke, CFO August 1, 2008 Disclaimer This presentation contains forward-looking statements about Linde AG ( Linde ) and their respective subsidiaries and businesses.
UNAUDITED FINANCIAL STATEMENTS AND DIVIDEND ANNOUNCEMENT FOR THE FOURTH QUARTER AND THE YEAR ENDED 31 DECEMBER 2017
 Registration Number: 200603185Z Introduction PACC Offshore Services Holdings Ltd. ("POSH") is one of Asia s largest operators of offshore support vessels, with a diversified fleet servicing offshore oil
On July 25, 2007, Technip s Board of Directors approved the second quarter and first half 2007 consolidated accounts.
 PRESS RELEASE Paris, July 26, 2007 SECOND QUARTER 2007 RESULTS Operating income from recurring activities: + 62% Operating margin ratio from recurring activities: 6.9% Earnings per share: + 62% Euros in
Wood Group Final Results March Energy Supporting Energy
 Wood Group 2011 Final Results March 2012 Energy Supporting Energy Important notice This document has been prepared p by the Company solely for use at presentations held in connection with the preliminary
UNAUDITED FINANCIAL STATEMENTS AND DIVIDEND ANNOUNCEMENT FOR THE THIRD QUARTER AND THE NINE MONTHS ENDED 30 SEPTEMBER 2018
 Registration Number: 200603185Z FOR THE THIRD QUARTER AND THE NINE MONTHS ENDED 30 SEPTEMBER 2018 Introduction PACC Offshore Services Holdings Ltd. ("POSH") is one of Asia s largest operators of offshore
EMGS THIRD QUARTER 2014.
 EMGS THIRD QUARTER 2014. Highlights in the third quarter 2014 Operational highlights Contracts signed with Petrobras, Statoil, OMV (Norge) and Norske Shell Commenced 3D multi-client survey offshore Canada
Fourth Quarter 2017 Results February 21, 2018
 Fourth Quarter 2017 Results February 21, 2018 Notice to Recipients This presentation is not a prospectus and is not an offer to sell, nor a solicitation of an offer to buy, securities. This presentation
Conference Call 3Q 2013 results. November 25, 2013
 Conference Call 3Q 2013 results November 25, 2013 Forward Looking Statements The statements described in this presentation that are not historical facts are forward-looking statements within the meaning
Second-Quarter Results 2014
 2Q Second-Quarter Results 214 Fornebu, July 17, 214 Øyvind Eriksen and Leif Borge 214 Aker Solutions Slide 1 July 17, 214 Second-quarter results 214 Agenda 2Q 214 Introduction Øyvind Eriksen Chairman Financials
Disclaimer Page 2
 Disclaimer This presentation should be read in conjunction with Vard Holdings Limited s results for the period ended 31 March 2014 in the SGXNet announcement. Financial figures are presented according
BUMI ARMADA BERHAD. 3Q 2011 Results 21 st November Knots Ahead of the Rest
 BUMI ARMADA BERHAD 3Q 2011 Results 21 st November 2011 Knots Ahead of the Rest Disclaimer This document may contain statements of future expectations and other forward-looking statements based on management
AGR Group ASA. Interim Report 2 nd quarter and 1 st half year of 2011
 AGR Group ASA Interim Report 2 nd quarter and 1 st half year of 2011 Petroleum Drilling Field Operations AGR Group consists of three business units with global reach, aligned with the trends in the global
o1 OCEANTEAM SHIPPING ASA Q1 2012
 o1 OCEANTEAM SHIPPING ASA Q1 2012 INTERIM REPORT 1 st QUARTER 2012 OCEANTEAM SHIPPING ASA o2 OCEANTEAM SHIPPING ASA Q1 2012 OCEANTEAM SHIPPING ASA Q1 2012 INTERIM REPORT Issue date 24 th May 2012 Ready
GulfMark Offshore, Inc. Lehman Brothers High Yield Conference
 GulfMark Offshore, Inc. Lehman Brothers High Yield Conference - 2005 Cautionary Statement Regarding Forward-Looking Statements This presentation includes forward-looking statements and projections, made
1Q 2018 Fornebu, April 27, 2018 Luis Araujo and Svein Stoknes
 1Q 2018 Fornebu, April 27, 2018 Luis Araujo and Svein Stoknes Agenda 1Q 2018 Answers Questions Introduction Luis Araujo Chief Executive Officer Financials Svein Stoknes Chief Financial Officer Q&A Session
Q Earnings Presentation. August 5, 20150
 Q2 2015 Earnings Presentation August 5, 20150 Q2 2015 Earnings Call Agenda I. Introduction Harmony Packard, Corporate Communications II. Operational Highlights Chris Bradshaw, President, CEO and CFO III.
Pareto Securities Oil and offshore Conference Oslo, September 2014 Presented by Atle Jacobsen (CEO)
") Pareto Securities Oil and offshore Conference Oslo, 10-11 September 2014 Presented by Atle Jacobsen (CEO) Disclaimer This presentation includes and is based, inter alia, on forward-looking information
Pareto Securities Oil and offshore Conference Oslo, 10-11 September 2014 Presented by Atle Jacobsen (CEO) Disclaimer This presentation includes and is based, inter alia, on forward-looking information
4Q 2018 Fornebu, February 8, 2019 Luis Araujo and Svein Stoknes
 4Q 2018 Fornebu, February 8, 2019 Luis Araujo and Svein Stoknes Agenda 4Q 2018 Answers Questions Introduction Luis Araujo Chief Executive Officer Financials Svein Stoknes Chief Financial Officer Q&A Session
Interim Report. First Quarter of Fiscal siemens.com. Energy efficiency. Intelligent infrastructure solutions. Next-generation healthcare
 Energy efficiency Next-generation healthcare Industrial productivity Intelligent infrastructure solutions Interim Report First Quarter of Fiscal 2014 siemens.com Key to references REFERENCE WITHIN THE
Interim Report Energy Supporting Energy
 Interim Report 2005 Energy Supporting Energy www.woodgroup.com John Wood Group PLC is a market leader in engineering design, production support and industrial gas turbine services for customers in the
On May 14, 2008, Technip s Board of Directors approved the non-audited first quarter 2008 consolidated accounts.
 PRESS RELEASE Paris, May 15, 2008 FIRST QUARTER 2008 Order intake up 7.5% yoy Revenue increased 2.4% yoy to 1.8 billion (+8.5% excluding exchange rates translation impact) Subsea EBITDA margin 23% and
Maersk Drilling Q May 2016
 Maersk Drilling Q1 2016 6 May 2016 page 2 Legal notice This presentation contains certain forward looking statements (all statements that are not entirely based on historical facts, among others expectations
Oceaneering Reports First Quarter 2018 Results
 PRESS RELEASE Oceaneering Reports First Quarter 2018 Results HOUSTON, April 25, 2018 Oceaneering International, Inc. ("Oceaneering") (NYSE:OII) today reported a net loss of $49.1 million, or $(0.50) per
January June 2010 Conference Call. Georg Denoke Member of the Executive Board & CFO 2 August 2010
 January June 2010 Conference Call Georg Denoke Member of the Executive Board & CFO 2 August 2010 Disclaimer This presentation contains forward-looking statements about Linde AG ( Linde ) and their respective
International revenue from Norwegian oil service companies
 International revenue from Norwegian oil service companies Excerpt in English from report to the Ministry of Petroleum and Energy October 31th, 2017 This document is the property of Rystad Energy. The
NOT FOR DISTRIBUTION IN THE US, CANADA OR JAPAN FOR IMMEDIATE RELEASE 3 FEBRUARY 1998
 NOT FOR DISTRIBUTION IN THE US, CANADA OR JAPAN FOR IMMEDIATE RELEASE 3 FEBRUARY 1998 SAIPEM ANNOUNCES 1997 RESULTS Today, the Board of Directors of Saipem S.p.A., the leading Italian oilfield services
TGS EARNINGS RELEASE 10 February 2011
 TGS EARNINGS RELEASE 10 February 2011 4 th QUARTER 2010 RESULTS 4 th QUARTER HIGHLIGHTS Consolidated net revenues were USD 177.6 million, an increase of 13% compared to Q4 2009. Net late sales totaled
22/02/2018 TechnipFMC Announces Fourth Quarter 2017 Results - RNS - London Stock Exchange
 Regulatory Story Go to market news section TechnipFMC - 0RMV TechnipFMC Announces Fourth Quarter 2017 Results Released 07:00 22-Feb-2018 Successful first year; strong operational performance across all
Presentation of 3Q 2018 results. 07 November 2018
 Presentation of 3Q 218 results 7 November 218 Company Status (reference to stock exchange release from 22 Oct 218) The Company sees signs of improvement in most markets, but market recovery is slow and
2009 SUBSEA 7 ANNUAL REPORT. 1 Subsea 7 Annual Report
 SUBSEA 7 ANNUAL REPORT 1 Subsea 7 Annual Report Who We Are Subsea 7 is one of the world s leading subsea engineering and construction companies servicing the oil and gas industry. Our skilled and experienced
2017 fourth quarter & year end results
 4th quarter 2017 review 2017 fourth quarter & year end results Statoil reports adjusted earnings of USD 4.0 billion and USD 1.3 billion after tax in the fourth quarter of 2017. IFRS net operating income
INTERIM FINANCIAL REPORT - FIRST HALF OF 2008
 2008 FIRST HALF INTERIM FINANCIAL REPORT - FIRST HALF OF 2008 Main figures, second quarter 2008 1 Operating revenues for the second quarter amounted to USD 23.4 million (USD 16.3 million). Operating profit
For personal use only
 2016 Full Year Results Presentation MATRIX COMPOSITES & ENGINEERING Aaron Begley Chief Executive Officer Peter Tazewell Chief Financial Officer 24 August 2016 Agenda Overview Financial results Strategy
FAIRSTAR HEAVY TRANSPORT NV BOARD OF DIRECTORS REPORT FIRST HALF YEAR OF 2010
 FAIRSTAR HEAVY TRANSPORT NV BOARD OF DIRECTORS REPORT FIRST HALF YEAR OF 2010 FAIRSTAR AWARDED USD 90M TRANSPORTATION CONTRACT FOR GORGON LNG PROJECT FAIRSTAR INITIATES FLEET EXPANSION STRATEGY WITH SUCCESSFUL
Tupperware Brands Reports First Quarter Results
 Tupperware Brands Corp. 14901 S. Orange Blossom Trail Orlando, FL 32837 Investor Contact: Teresa Burchfield (407) 826-4475 Tupperware Brands Reports First Quarter Results First quarter sales up slightly
CHEVRON REPORTS THIRD QUARTER NET INCOME OF $3.77 BILLION, DOWN FROM $3.83 BILLION IN THIRD QUARTER 2009
 Policy, Government and Public Affairs Chevron Corporation P.O. Box 6078 San Ramon, CA 94583-0778 www.chevron.com FOR RELEASE AT 5:30 AM PDT OCTOBER 29, 2010 CHEVRON REPORTS THIRD QUARTER NET INCOME OF
` ` PACC Offshore Services Holdings Ltd.
 ` ` PACC Offshore Services Holdings Ltd. Results Presentation Q4 & FY17 Results 20 February 2018 1 Agenda Page 1. Industry Outlook and Key Highlights 3 2. Financial Highlights 5 3. Business Strategy 17
Technip s First Quarter Results 2010 outlook confirmed
 PRESS RELEASE Paris, April 29, 2010 Technip s First Quarter Results 2010 outlook confirmed FIRST QUARTER 2010 RESULTS Revenue of 1,318 million, of which 632 million in Subsea Group operating margin of
Strong Improvement in CGGVeritas Third Quarter 2012 Results Acquisition of Fugro s Geoscience Division on Track
 Strong Improvement in CGGVeritas Third Quarter 2012 Results Acquisition of Fugro s Geoscience Division on Track PARIS, France November 5th 2012 CGGVeritas announced today its non-audited third quarter