Earnings Presentation Fourth Quarter and Full Year March 2017
|
|
|
- Arnold McDonald
- 6 years ago
- Views:
Transcription

1 Earnings Presentation Fourth Quarter and Full Year March
2 Forward-looking statements Certain statements made in this announcement may include forward-looking statements. These statements may be identified by the use of words like anticipate, believe, could, estimate, expect, forecast, intend, may, might, plan, predict, project, scheduled, seek, should, will, and similar expressions. The forward-looking statements reflect our current views and are subject to risks, uncertainties and assumptions. The principal risks and uncertainties which could impact the Group and the factors which could affect the actual results are described but not limited to those in the Risk Management section in the Group s Annual Report and Consolidated Financial Statements for the year ended 31 December These factors, and others which are discussed in our public announcements, are among those that may cause actual and future results and trends to differ materially from our forward-looking statements: actions by regulatory authorities or other third parties; our ability to recover costs on significant projects; general economic conditions and competition in the markets and businesses in which we operate; our relationship with significant clients; the outcome of legal and administrative proceedings or governmental enquiries; uncertainties inherent in operating internationally; the timely delivery of vessels on order; the impact of laws and regulations; and operating hazards, including spills and environmental damage. Many of these factors are beyond our ability to control or predict. Other unknown or unpredictable factors could also have material adverse effects on our future results. Given these factors, you should not place undue reliance on the forward-looking statements. 2
3 Jean Cahuzac CEO 3
4 2016 operational highlights Consistent and safe operational performance with several large projects successfully completed Vessel utilisation 66% full year and 65% fourth quarter Active vessel utilisation 80% full year, 78% fourth quarter $3.4 billion full year order intake, 0.9 book-to-bill ratio First SPS/SURF integrated project awarded to our Subsea Integration Alliance (1) Affirmed our position in offshore renewable energy with the award of Beatrice offshore wind farm project Delivered cost reduction and resizing programme Maintained differentiated expertise and capability (1) Subsea Integration Alliance is a global and exclusive alliance between Subsea 7 and OneSubsea (a Schlumberger company) to provide clients with fully integrated SPS and SURF solutions on an EPIC basis 4


5 2016 project highlights PLSVs (Brazil) TEN (Ghana) Montrose (UK) Aasta Hansteen (Norway) Hess Stampede (GOM) WND Ph. 1 (Egypt) EPRS (LoF) (Asia Pacific) Catcher (UK) Maria (Norway) Hebron (Canada) 5
6 2016 financial highlights Fourth quarter financial highlights Fourth quarter revenue $932m Adjusted EBITDA $288m, 31% margin Adjusted diluted earnings per share (1) of $0.27 Net cash of $1,249m at 31 December 2016 Impairment charges: $90m relating to goodwill, $147m relating to assets Full year financial highlights Full year revenue $3.6bn Adjusted EBITDA $1,142m, 32% margin Adjusted diluted earnings per share (1) of $1.54 NOK 5.00 per share special dividend recommended Impairment charges: $90m relating to goodwill, $158m relating to assets (1) Adjusted diluted earnings per share (EPS) excludes the $90m goodwill impairment charge 6
7 Positioning for the long-term Acted early to reduce our capacity and deliver strong performance though the downturn Protected our differentiated capability, positioning us to outperform over the long-term Industry conditions remain challenging in the near term The oil price has stabilised in recent months and clients are reviewing their plans to sanction projects This gives us cause to believe that there could be an increase in SURF project awards in the market within the next 12 months 7
8 Year end Backlog and Q4 order intake Backlog of $5.7 billion (1), as at 31 December 2016 $0.6 billion order intake, including announced awards: Atoll Development, offshore Egypt Greater Western Flank Phase 2, offshore Australia Oda, offshore Norway Dalmatian (a Subsea Integration Alliance award), US Gulf of Mexico Backlog by Execution Date Backlog by segment $0.9bn (16%) SURF and Conventional (2) $4.1bn (72%) 2018 $1.5bn (26%) 2017 $3.3bn (58%) i-tech Services 0.5bn (8%) Corporate (3) $1.1bn (20%) (1) $0.2 billion adverse impact from foreign currency movements (2) Included $1.8 billion related to 9 long-term contracts for PLSVs in Brazil, approximately 80% of which related to the four 550t PLSVs (Seven Waves, Seven Rio, Seven Sun and Seven Cruzeiro). Approximately $100m backlog included for Seven Mar which was cancelled in January (3) Corporate includes Renewables and Heavy Lifting 8
9 Business Unit outlook SURF and Conventional Remaining competitive, with the right project risk profile Active SURF project tenders include: Mad Dog 2 (US GoM) KG-D6, R-Cluster (India) Skarfjell (Norway) Pil (Norway) Liza (Guyana) Fortuna (Equatorial Guinea) Golfinho (Mozambique) KG-DWN, block 98/2 (India) Zinia (Angola) i-tech Services Frame agreement tenders in North Sea, Angola, Brazil and US GoM Renewables and Heavy Lifting Offshore wind farm installation remains an active market Decommissioning tendering activity on the increase 9
10 Ricardo Rosa CFO 10
11 Income statement key highlights Three months ended Twelve months ended In $ millions, unless otherwise indicated 31 Dec 16 Unaudited 31 Dec Dec 16 Unaudited Audited 31 Dec 15 Audited Revenue 932 1,025 3,567 4,758 Impairment of Goodwill (90) (521) (90) (521) Net operating (loss)/income (NOI) (45) (415) (Loss)/income before taxes (26) (404) Taxation 13 (17) (158) (222) Net (loss)/income (13) (421) 418 (37) Adjusted EBITDA (1) ,142 1,217 Adjusted EBITDA margin 31% 30% 32% 26% Adjusted diluted earning per share (2) Weighted average number of shares (millions) (1) Adjusted EBITDA defined in Appendix (2) Adjusted diluted earnings per share (EPS) is based on net income, excluding the $90 million goodwill impairment charge 11
12 Income statement supplementary details In $ millions Three months ended Twelve months ended 31 Dec 16 Unaudited 31 Dec Dec 16 Unaudited Audited 31 Dec 15 Audited Administrative expenses (58) (68) (242) (305) Share of net income of associates and joint ventures (7) Depreciation and amortisation (95) (108) (372) (416) Impairment of property, plant and equipment (147) (96) (158) (137) Impairment of goodwill (90) (521) (90) (521) Net operating (loss)/income (45) (415) Net finance income/(costs) 3 (1) 11 9 Other gains and losses (Loss)/income before taxes (26) (404) Taxation 13 (17) (158) (222) Net (loss)/income (13) (421) 418 (37) Net (loss)/income Attributable to: Shareholders of the parent company 3 (422) 436 (17) Non-controlling interests (16) 1 (18) (20) Twelve month net operating income included restructuring charges of $97 million (2015: $136 million) 12
 ($99m) $204m ($9m) ($90m) 2016 2015 2016 2015 SURF & Conventional i-tech Services Corporate (2) (includes")

13 Business Unit performance Q Revenue Q NOI Q (1) $932m $1,025m $46m $106m $142m $85m $705m $3m $99m $923m $153m ($9m) ($99m) $204m ($9m) ($90m) SURF & Conventional i-tech Services Corporate (2) (includes Renewables and Heavy Lifting) (1) Net operating income was adjusted to exclude goodwill impairment charge (2) Corporate net operating loss included an impairment charge related to property, plant and equipment of $100 million in Q (Q4 2015: $89 million) 13
14 Business Unit performance - Full Year 2016 Revenue Full Year 2016 NOI Full Year 2016 (1) $3,567m $178m $377m $4,758m $29m $446m $611m $665m $38m $22m $4,283m $717m $841m $3,011m ($144m) ($198m) SURF & Conventional i-tech Services Corporate (includes Renewables and Heavy Lifting) (1) Net operating income was adjusted to exclude charge for goodwill impairment (2) Corporate net operating loss included: restructuring charges of $97 million in 2016 (2015: $136 million) in relation to the resizing programmes an impairment charge related to property, plant and equipment of $100m in 2016 (2015: $129 million) 14
15 Our Adjusted EBITDA margin performance Adjusted EBITDA margin - Historical performance 32% 26% 21% 18% 18% 16% e Adjusted EBITDA percentage margin driven by: Alignment of capacity and cost with activity Project execution and de-risking Mix of activity and phasing of projects Market environment and competition for awards 15
16 2016 expenses overview $1.2 billion vessel and workforce cost savings since 2014 $ bn bn Vessels and other costs (2) : Including vessel costs, onshore facilities, IT infrastructure and other fixed overheads Depreciation and amortisation: Non-cash fixed cost, excluding non-recurring vessel impairment charges People (1) : Offshore and onshore personnel 4.2bn Procurement of materials and other direct project costs bn (1) Includes restructuring charges 2016: $97m, 2015: $136 million, 2014: nil (2) Includes impairment charges related to property, plant & equipment 2016: $158 million, 2015: $ 136 million, 2014: $89 million 16
17 Summary of full year 2016 cash flow $m 1, (300) (106) (18) (141) 112 1, Cash at 31 December 2015 EBITDA W/Cap Movement Capex Repurchase of Convertible Notes Acquisition of business Tax Paid Other Cash at 31 December 2016 Net cash of $1.2 billion as at 31 December 2016 compared to $423 million at 31 December 2015 Net cash generated from operating activities was $1.0 billion with $333 million generated in the fourth quarter 17
18 Our priorities for capital allocation 1. Invest to grow and strengthen our business Completion of new-build vessel programme Focused investment in technology and innovation Integrated solutions with OneSubsea Offered to acquire remaining 50% of SHL 2. Maintain an investmentgrade profile Net cash $1.2 billion at 31 December 2016 $113 million (par value) convertible bonds re-purchased in Return surplus cash to shareholders NOK 5.00 per share special dividend recommended to be paid in 2017 Over $1 billion cash returned since
19 Financial guidance 2017 Guidance Revenue Broadly in line with 2016 Adjusted EBITDA percentage margin Significantly lower than 2016 Administrative expense Net finance cost Depreciation and Amortisation $190 million - $210 million $10 million - $15 million $370 million - $390 million Full year effective tax rate 45% - 50% Capital expenditure $160 million - $180 million 19
20 Jean Cahuzac CEO 20
21 Our focus on performance We acted early to deliver through the downturn and position for long-term success in our core market segments: SURF and Conventional, i-tech Services and Renewables and Heavy Lifting Delivering through the downturn Act early Reduce capacity Reduce costs Maintain capability Positioning for the long term Innovation Investment Market focus Alliances 21
22 Delivering through the downturn Cost reduction and resizing actions taken early Centralised expertise in our Global Project Centre offices Workforce reduced by approximately 40% Six chartered vessels returned to owners Four owned vessels stacked Two owned vessels left the fleet, two more due to leave in Q4 '13 Q4 '14 Q4 '15 Q4 '16 Q1 '17E 44 5 Workforce ( 000s) Vessels Q4 '14 Q4 '15 Q4 '16 Q1 '17E Active fleet Stacked Under construction 22


23 Positioning for the long-term - Innovation Technology investment maintained Our five strategic technology programmes Invested through the cycle to develop new enabling and costreducing technologies Owns one of the largest and most recent groups of patents in our markets Acquired Swagelining in 2016: a leading polymer lining technologist Flowline Systems Subsea Processing Riser Systems Bundles LOF & remote intervention 23


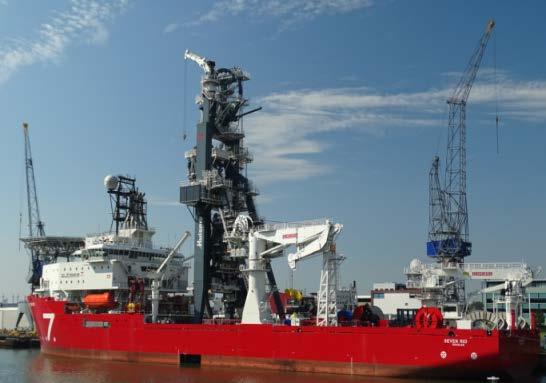
24 Positioning for the long-term - Investment New-build vessel programme Six vessel new-build programme completed in January 2017 Total cost $1.9 billion Four high-specification flex-lay vessels on long term contracts with Petrobras Seven Arctic and Seven Kestrel to commence operations in the North Sea first half 2017 Seven Waves Seven Sun Seven Arctic Seven Rio Seven Cruzeiro Seven Kestrel 24
 95% of SHL revenue in 2016 was on renewable energy projects January 2017: Subsea 7")

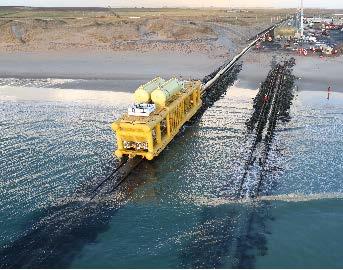
25 Positioning for the long-term Market focus Presence in Renewable and Heavy Lifting Renewables and Heavy Lifting are long-term growth markets In 2016, Subsea 7 was awarded the Beatrice project, to be delivered with SHL (1) 95% of SHL revenue in 2016 was on renewable energy projects January 2017: Subsea 7 offered to acquire the remaining 50% of SHL Beatrice offshore wind farm $1.3 billion EPCI contract, offshore N.E. Scotland 84 jacket-based wind turbine foundations 120,000t steel Fully integrated team of Subsea 7 and SHL personnel (1) Seaway Heavy Lifting (SHL) is a joint venture company 50% owned by Subsea 7 25

26 Positioning for the long term - Alliances Collaboration Alliances and Partnerships We are working collaboratively with industry partners and clients to develop and deliver optimal solutions Integrated solutions Early engagement Client partnerships 26
27 A gradual market recovery Industry conditions remain challenging in the near term We are investing strategically to enhance our differentiated offering We are innovating and working collaboratively to deliver optimal solutions for our clients The oil price has stabilised in recent months and clients are reviewing their project sanction plans A gradual market recovery is anticipated This gives us cause to believe that there could be an increase in SURF project awards in the market within the next 12 months 27
28 Q&A 28

29 Appendix Our global presence Major project progression Our fleet Adjusted EBITDA Segmental analysis Cash Flow Balance Sheet 29

 West Nile Delta Phase 1, BP West Nile Delta Phase 2, BP West Nile Delta, Burullus East Nile Delta, Pharonic Atoll, Pharonic")
30 Our global presence Beatrice Wind Farm, BOWL Catcher, Premier Culzean, Maersk Callater, Apache Western Isles, Dana USC & Pipelay, Shell SCIRM, BP DSVi, Various Martin Linge, Total Aasta Hansteen, Statoil Maria, Wintershall Mariner, Statoil Oda, Centrica Stampede, Hess Coulomb Ph2, Shell Holstein Deep, Freeport McMoRan Dalmation, Murphy PLSVs, Petrobras T.E.N., Tullow (JV Partner) West Nile Delta Phase 1, BP West Nile Delta Phase 2, BP West Nile Delta, Burullus East Nile Delta, Pharonic Atoll, Pharonic Lianzi, Chevron EPRS, INPEX/Chevron Persephone, Woodside Greater Western Flank, Woodside Sole, Cooper 30
31 Major project progression Continuing projects >$100m between 5% and 95% complete as at 31 December 2016 excluding PLSV and Life of Field day-rate contracts Mariner (UK/Norway) Clair Ridge (UK) Aasta Hansteen (Norway) Announced size of project SLMP (Norway) Catcher (UK) West Nile Delta P1 (Egypt) Stampede (GOM) Western Isles (UK) Sonamet (Angola) Maria (Norway) Culzean (UK) Beatrice Wind Farm (UK) Atoll (Egypt) Major (Over $750m) Very Large ($500-$750m) Large ($300-$500m) Substantial ($150-$300m) Sizeable ($50-$150m) West Nile Delta P2 (Egypt) 0% 20% 40% 60% 80% 100% 31
32 Our fleet as at 31 December vessels in the active fleet 7 Chartered: Skandi Acergy Grant Candies Normand Subsea Siem Stingray Subsea Viking Normand Oceanic (2) Seven Viking (2) 22 Owned: Seven Borealis Seven Oceans Seven Condor Seven Rio Seven Seas Sapura 3000 (1) Oleg Strashnov (1) Stanislav Yudin (1) Rockwater 2 Seven Atlantic Seven Falcon Seven Osprey Seven Pelican Kommandor 3000 Seven Eagle Seven Mar Simar Esperança 4 vessels stacked 3 Vessels under construction Seven Navica Seven Discovery Rockwater 1 Seven Inagha Seven Arctic Seven Kestrel Seven Cruzeiro No fleet changes during the fourth quarter 2016 Changes since 31 December 2016 Seven Antares Seven Waves Seven Pacific Seven Phoenix Seven Sun - Delivered January Delivered January Delivered and commenced long-term contract with Petrobras offshore Brazil January 2017 Seven Mar stacked following the early termination of its contract New-build programme completed in January 2017 with delivery of Seven Arctic, Seven Kestrel and Seven Cruzeiro (1) Owned and operated by a joint venture (2) Long-term charter from a vessel-owning joint venture 32
33 Adjusted EBITDA Adjusted earnings before interest, taxation, depreciation and amortisation ( Adjusted EBITDA ) is a non-ifrs measure that represents net income before additional specific items that are considered to impact the comparison of the Group s performance either period-on-period or with other businesses. The Group defines Adjusted EBITDA as net income adjusted to exclude depreciation, amortisation and mobilisation costs, impairment charges or impairment reversals, finance income, other gains and losses (including gain on disposal of subsidiary and gain on distribution), finance costs and taxation. Adjusted EBITDA margin is defined as Adjusted EBITDA divided by revenue, expressed as a percentage. The items excluded from Adjusted EBITDA represent items which are individually or collectively material but which are not considered representative of the performance of the business during the periods presented. Other gains and losses principally relate to disposals of investments, property, plant and equipment and net foreign exchange gains or losses. Impairments of assets represent the excess of the assets carrying amount over the amount that is expected to be recovered from their use in the future or their sale. Adjusted EBITDA and Adjusted EBITDA margin have not been prepared in accordance with IFRS as adopted by the EU. These measures exclude items that can have a significant effect on the Group s income or loss and therefore should not be considered as an alternative to, or more meaningful than, net income (as determined in accordance with IFRS) as a measure of the Group s operating results or cash flows from operations (as determined in accordance with IFRS) as a measure of the Group s liquidity. Management believes that Adjusted EBITDA and Adjusted EBITDA margin are important indicators of the operational strength and the performance of the business. These non-ifrs measures provide management with a meaningful comparative for its Business Units, as they eliminate the effects of financing, depreciation and taxation. Management believes that the presentation of Adjusted EBITDA is also useful as it is similar to measures used by companies within Subsea 7 s peer group and therefore believes it to be a helpful calculation for those evaluating companies within Subsea 7 s industry. Adjusted EBITDA margin may also be a useful ratio to compare performance to its competitors and is widely used by shareholders and analysts following the Group s performance. Notwithstanding the foregoing, Adjusted EBITDA and Adjusted EBITDA margin as presented by the Group may not be comparable to similarly titled measures reported by other companies. 33
34 Reconciliation of Adjusted EBITDA Net operating income to Adjusted EBITDA For the period (in $millions) Three Months Ended 31 Dec 2016 Three Months Ended 31 Dec 2015 Twelve Months Ended 31 Dec 2016 Twelve Months Ended 31 Dec 2015 Net operating (loss)/income (45) (415) Depreciation, amortisation and mobilisation Impairment of goodwill Impairment of Property, Plant and Equipment Adjusted EBITDA ,142 1,217 Revenue 932 1,025 3,567 4,758 Adjusted EBITDA % 30.9% 30.2% 32.0% 25.6% Net income to Adjusted EBITDA For the period (in $millions) Three Months Ended 31 Dec 2016 Three Months Ended 31 Dec 2015 Twelve Months Ended 31 Dec 2016 Twelve Months Ended 31 Dec 2015 Net loss (13) (421) 418 (37) Depreciation, amortisation and mobilisation Impairment of goodwill Impairment of Property, Plant and Equipment Finance income (7) (5) (18) (17) Other gains and losses (16) (12) (45) (33) Finance costs Taxation (13) Adjusted EBITDA ,142 1,217 Revenue 932 1,025 3,567 4,758 Adjusted EBITDA % 30.9% 30.2% 32.0% 25.6% 34
35 Segmental analysis For the three months ended 31 December 2016 In $ millions (unaudited) SURF & Conventional i-tech Services Corporate TOTAL Revenue Net operating income/(loss) excluding goodwill impairment 153 (9) (99) 46 Impairment of goodwill (90) - - (90) Net operating income/(loss) 63 (9) (99) (45) Finance income 7 Other gains and losses 16 Finance costs Loss before taxes (4) (26) For the three months ended 31 December 2015 In $ millions (unaudited) SURF & Conventional i-tech Services Corporate TOTAL Revenue ,025 Net operating income/(loss) excluding goodwill impairment 204 (9) (90) 105 Impairment of goodwill (521) - - (521) Net operating loss (317) (9) (90) (415) Finance income 5 Other gains and losses 12 Finance costs (5) Loss before taxes (404) 35
36 Summary of full year 2016 cash flow $ millions Cash and cash equivalents at 31 Dec Net cash generated from operating activities 1,046 Increase of $40 million in net operating liabilities Net cash flow used in investing activities (199) Net cash flow used in financing activities (121) Other movements 4 Cash and cash equivalents at 31 Dec ,676 Included capital expenditure of $300 million mainly on new-build vessel programme Included $106 million repurchase of convertible bonds Net cash of $1,249 million as at 31 December 2016 compared to $423 million at 31 December 2015 Fourth quarter net cash generated from operating activities was $333 million 36
37 Summary balance sheet In $ millions Assets Non-current assets 31 Dec 2016 Audited 31 Dec 2015 Audited Goodwill Property, plant and equipment 4,124 4,559 Other non-current assets Total non-current assets 5,238 5,828 Current assets Trade and other receivables Construction contracts - assets Other accrued income and prepaid expenses Cash and cash equivalents 1, Other current assets Total current assets 2,565 2,026 Total assets 7,803 7,854 In $ millions Equity & Liabilities 31 Dec 2016 Audited 31 Dec 2015 Audited Total equity 5,537 5,346 Non-current liabilities Non-current portion of borrowings Other non-current liabilities Total non-current liabilities Current liabilities Trade and other liabilities 824 1,123 Current portion of borrowings Construction contracts liabilities Deferred revenue 6 10 Other current liabilities Total current liabilities 2,062 1,774 Total liabilities 2,266 2,508 Total equity & liabilities 7,803 7,854 37
38 1-Mar-17 Page 38
Second Quarter 2017 Earnings Presentation
 Second Quarter 2017 Earnings Presentation 26 July 2017 1 Subsea 7-2017 Forward-looking statements Certain statements made in this presentation may include forward-looking statements. These statements may
Investor Presentation. November 2016
 Investor Presentation November 2016 1 Index What we do Our differentiators Our priorities Our outlook Our financials Appendix 2 What we do Our differentiators Our priorities Our outlook Our financials
Third Quarter 2017 Earnings Presentation
 Third Quarter 2017 Earnings Presentation 9 November 2017 1 Subsea 7-2017 Forward-looking statements Certain statements made in this presentation may include forward-looking statements. These statements
Earnings Presentation Second Quarter July :00 noon UK time
 Earnings Presentation Second Quarter 2015 29 July 2015 12:00 noon UK time Forward-looking statements Certain statements made in this announcement may include forward-looking statements. These statements
Third Quarter 2018 Earnings Presentation
 Third Quarter 2018 Earnings Presentation 8 November 2018 1 Subsea 7-2018 Forward-looking statements Certain statements made in this presentation may include forward-looking statements. These statements
Subsea 7 S.A. Announces First Quarter 2016 Results
 Subsea 7 S.A. Announces First Quarter 2016 Results Luxembourg 28 April 2016 Subsea 7 S.A. (the Group) (Oslo Børs: SUBC, ADR: SUBCY) announced today results for the first quarter which ended 31 March 2016.
Subsea 7 S.A. Announces Third Quarter 2016 Results
 Subsea 7 S.A. Announces Third Quarter 2016 Results Luxembourg 10 November 2016 Subsea 7 S.A. (the Group) (Oslo Børs: SUBC, ADR: SUBCY) announced today results for the third quarter 2016 which ended 30
Earnings Presentation Fourth Quarter and Full Year March :00 noon UK time
 Earnings Presentation Fourth Quarter and Full Year 2013 5 March 2014 12:00 noon UK time Forward-looking statements Certain statements made in this announcement may include forward-looking statements. These
Subsea 7 S.A. Announces Third Quarter 2017 Results
 Subsea 7 S.A. Announces Third Quarter 2017 Results Luxembourg 9 November 2017 Subsea 7 S.A. (the Group) (Oslo Børs: SUBC, ADR: SUBCY, ISIN: LU0075646355) announced today results for the third quarter which
Earnings Presentation Second Quarter and Half Year August 10, :00 noon UK time
 Earnings Presentation Second Quarter and Half Year 2011 August 10, 2011 12:00 noon UK time Forwardlooking statements Certain statements made in this announcement may include forwardlooking statements within
Subsea 7 S.A. Announces Fourth Quarter and Full Year 2017 Results
 Subsea 7 S.A. Announces Fourth Quarter and Full Year 2017 Results Luxembourg 1 March 2018 Subsea 7 S.A. (the Group) (Oslo Børs: SUBC, ADR: SUBCY, ISIN: LU0075646355) announced today results for the fourth
Third Quarter November 2, 2011
 Earnings Presentation Third Quarter 2011 November 2, 2011 12:00 200noon UK time Forward-looking statements Certain statements made in this announcement may include forward-looking statements within the
Subsea 7 S.A. Announces Third Quarter 2018 Results
 Subsea 7 S.A. Announces Third Quarter 2018 Results Luxembourg 8 November 2018 Subsea 7 S.A. (the Group) (Oslo Børs: SUBC, ADR: SUBCY, ISIN: LU0075646355) announced today results for the third quarter which
SUBSEA 7 INC. REPORT FOR THE THIRD QUARTER UNAUDITED. 26 October 2010
 SUBSEA 7 INC. REPORT FOR THE THIRD QUARTER 2010 - UNAUDITED 26 October 2010 Subsea 7 Inc. (Oslo Stock Exchange: SUB) today reports the third quarter results for 2010. PERFORMANCE SUMMARY Quarter Highlights
Acergy S.A. Announces Third Quarter Results
 S.A. Announces Third Quarter Results London, England October 13, S.A. (NASDAQ-GS: ACGY; Oslo Stock Exchange: ACY), announced today results for the third quarter which ended on August 31,. Highlights -
Subsea 7 Inc. Earnings Presentation Quarter Ended 30 September subsea partner of choice.
 Subsea 7 Inc. Earnings Presentation Quarter Ended 3 September 21 1 Highlights Strong project execution in all regions Announced major contracts with a value in excess of USD 4 million during the quarter
SUBSEA 7 INC. REPORT FOR THE SECOND QUARTER AND HALF YEAR UNAUDITED. 27 July 2010
 SUBSEA 7 INC. REPORT FOR THE SECOND QUARTER AND HALF YEAR 2010 - UNAUDITED 27 July 2010 Subsea 7 Inc. (Oslo Stock Exchange: SUB) today reports the second quarter and half year results for 2010. PERFORMANCE
Subsea 7 S.A. Announces Second Quarter & Half Year 2013 Results
 Subsea 7 S.A. Announces & 2013 Results Luxembourg 14 August 2013 Subsea 7 S.A. (the Group ) (Oslo Børs: SUBC) announced today results for the second quarter and first half 2013 which ended on 30 June 2013.
SUBSEA 7 INC. REPORT FOR THE FOURTH QUARTER AND PRELIMINARY YEAR END RESULTS FOR UNAUDITED. 2 February 2010
 SUBSEA 7 INC. REPORT FOR THE FOURTH QUARTER AND PRELIMINARY YEAR END RESULTS FOR 2009 - UNAUDITED 2 February 2010 Subsea 7 Inc. (Oslo Stock Exchange: SUB) today reports the fourth quarter and preliminary
Subsea 7 S.A. Announces Second Quarter & Half Year 2011 Results
 Subsea 7 S.A. Announces Second Quarter & Half Year 2011 Results Luxembourg August 10, 2011 Subsea 7 S.A. (formerly Acergy S.A.) (the Group ) (Oslo Børs: SUBC) announced today results for the second quarter
SUBSEA 7 INC. THIRD QUARTER REPORT UNAUDITED. 27 October 2009
 SUBSEA 7 INC. THIRD QUARTER REPORT 2009 - UNAUDITED 27 October 2009 Subsea 7 Inc. (Oslo Stock Exchange: SUB) today reports the results for the third quarter of 2009. PERFORMANCE SUMMARY Quarter Highlights
Subsea 7 S.A. Announces First Quarter 2013 Results
 Subsea 7 S.A. Announces First Quarter Results Luxembourg 16 May Subsea 7 S.A. (the Group ) (Oslo Børs: SUBC) announced today results for the first quarter which ended on ch. Unless otherwise stated, the
24 October 2006 Subsea 7 Inc. (Oslo Stock Exchange: SUB) today reports the results for the third quarter of 2006.
 today reports the results for the third quarter of 2006.") SUBSEA 7 INC. REPORT FOR THE THIRD QUARTER 2006 24 October 2006 Subsea 7 Inc. (Oslo Stock Exchange: SUB) today reports the results for the third quarter of 2006. PERFORMANCE SUMMARY Financial Results Quarter
SUBSEA 7 INC. REPORT FOR THE THIRD QUARTER 2006 24 October 2006 Subsea 7 Inc. (Oslo Stock Exchange: SUB) today reports the results for the third quarter of 2006. PERFORMANCE SUMMARY Financial Results Quarter
SUBSEA 7 INC. REPORT FOR THE FIRST QUARTER April 2009
 SUBSEA 7 INC. REPORT FOR THE FIRST QUARTER 2009 21 April 2009 Subsea 7 Inc. (Oslo Stock Exchange: SUB) today reports results for the first quarter of 2009. PERFORMANCE SUMMARY Quarter Highlights Good project
Q Earnings Call Presentation. July 27 th, 2017
 Q2 2017 Earnings Call Presentation July 27 th, 2017 Disclaimer Forward-looking statements We would like to caution you with respect to any forward-looking statements made in this commentary as defined
Q4 Financial Presentation 2015 DOF ASA
 Q4 Financial Presentation 2015 Highlights Main Highlights EBITDA Q4 MNOK 818 (operational EBITDA MNOK 814) EBITDA 2015 MNOK 3 719 (operational EBITDA MNOK 3 344) General good operational performance in
Quarterly Presentation Q DOF Subsea Group
 Quarterly Presentation Q3 2018 Group Group at a glance 2005 established NOK 1.2bn 1) Revenues Q3 18 NOK 15.1bn Firm backlog Q3 18 1 322 2) Subsea employees worldwide Q3 18 Integrated Supplier of subsea
Quarterly Presentation Q DOF Subsea Group
 Quarterly Presentation Q2 2018 Group Group at a glance 2005 established NOK 1.2bn 1) Revenues Q2 18 NOK 15.9bn Firm backlog Q2 18 1 190 2) Subsea employees worldwide Q2 18 Integrated Supplier of subsea
FIRST QUARTER the Clair Ridge platform in the UK around end of May.
 FIRST QUARTER 2018 EBITDA for the first quarter amounted to USD 49.2 million (USD 32.8 million). Despite lower vessels utilisation in the quarter, EBITDA is higher due to lower operating expenses from
Q Earnings Call Presentation. February 22, 2018
 Q4 2017 Earnings Call Presentation February 22, 2018 Disclaimer Forward-looking statements We would like to caution you with respect to any forward-looking statements made in this presentation as defined
Second-Quarter Results 2014
 2Q Second-Quarter Results 214 Fornebu, July 17, 214 Øyvind Eriksen and Leif Borge 214 Aker Solutions Slide 1 July 17, 214 Second-quarter results 214 Agenda 2Q 214 Introduction Øyvind Eriksen Chairman Financials
FOURTH QUARTER Highlights. Operations
 FOURTH QUARTER 2017 EBITDA for the fourth quarter amounted to USD 40.1 million (USD 78 million). This decline is mainly due to lower utilisation of the vessels. Cash flow from operations was USD 44.2 million
Technip Fourth Quarter and Full Year 2016 Results. February 24, 2017
 Technip Fourth Quarter and Full Year 2016 Results February 24, 2017 Safe Harbour This presentation contains both historical and forward-looking statements. These forward-looking statements are not based
Wood Group Final Results March Energy Supporting Energy
 Wood Group 2011 Final Results March 2012 Energy Supporting Energy Important notice This document has been prepared p by the Company solely for use at presentations held in connection with the preliminary
SECOND QUARTER AND FIRST HALF 2003 RESULTS First Half EBITA Up 10% Offshore Order Intake Leads to Record Backlog
 PRESS RELEASE Paris, September 5, SECOND QUARTER AND FIRST HALF RESULTS First Half EBITA Up 10% Offshore Order Intake Leads to Record Backlog Euros in millions 2 nd Quarter 1 st Half June 30 Backlog 7,572
ELECTROMAGNETIC GEOSERVICES ASA FIRST QUARTER 2014 RESULTS. CEO, Roar Bekker CFO, Svein Knudsen 8 May 2014
 ELECTROMAGNETIC GEOSERVICES ASA FIRST QUARTER 2014 RESULTS CEO, Roar Bekker CFO, Svein Knudsen 8 May 2014 DISCLAIMER This quarterly presentation includes and is based, inter alia, on forward-looking information
1Q 2018 Fornebu, April 27, 2018 Luis Araujo and Svein Stoknes
 1Q 2018 Fornebu, April 27, 2018 Luis Araujo and Svein Stoknes Agenda 1Q 2018 Answers Questions Introduction Luis Araujo Chief Executive Officer Financials Svein Stoknes Chief Financial Officer Q&A Session
Bibby Offshore Holdings Limited: Full Year 2016 Results
 23 March 2017 Bibby Offshore Holdings Limited: Full Year 2016 Results Bibby Offshore Holdings Limited ( Bibby Offshore or the Group or BOHL ), a leading provider of subsea installation, inspection, repair
Presentation to the Financial Community. First Half 2011 Results
 Presentation to the Financial Community First Half 2011 Results July 2011 Forward-Looking Statements By their nature, forward-looking statements are subject to risk and uncertainty since they are dependent
Maersk Drilling Q November 2015
 Maersk Drilling Q3 2015 9 November 2015 page 2 Legal notice This presentation contains certain forward looking statements (all statements that are not entirely based on historical facts, among others expectations
EMGS THIRD QUARTER 2014.
 EMGS THIRD QUARTER 2014. Highlights in the third quarter 2014 Operational highlights Contracts signed with Petrobras, Statoil, OMV (Norge) and Norske Shell Commenced 3D multi-client survey offshore Canada
TechnipFMC Third Quarter 2017 Earnings Call Presentation
 TechnipFMC Third Quarter 2017 Earnings Call Presentation LONDON & PARIS & HOUSTON (BUSINESS WIRE) 25 October 2017 TechnipFMC plc ( TechnipFMC ) (NYSE: FTI) (Paris: FTI) (ISIN: GB00BDSFG982) announces the
Ocean Rig UDW Inc. NASDAQ: ORIG August 9, nd Quarter Ended June 30, 2018 Earnings Presentation
 Ocean Rig UDW Inc. NASDAQ: ORIG August 9, 2018 2 nd Quarter Ended June 30, 2018 Earnings Presentation Forward Looking Statements Matters discussed in this presentation may constitute forward-looking statements
SIEM OFFSHORE INC. REPORT FOR THE FOURTH QUARTER AND FISCAL YEAR 2015
 SIEM OFFSHORE INC. REPORT FOR THE FOURTH QUARTER AND FISCAL YEAR 2015 25 February 2016 Siem Offshore Inc. (the Company ; Oslo Stock Exchange: SIOFF) reports results for the fourth quarter and fiscal year
AGR Group ASA. Interim Report 2 nd quarter and 1 st half year of 2011
 AGR Group ASA Interim Report 2 nd quarter and 1 st half year of 2011 Petroleum Drilling Field Operations AGR Group consists of three business units with global reach, aligned with the trends in the global
DOF ASA Swedbank 20 March 2014
 DOF ASA Swedbank 20 March 2014 Agenda Highlights Overview Group Financials DOF Subsea update Outlook DOF ASA - Presentation 2014 Highlights so far in 2014 Positive start in the North Sea spot market, especially
Seadrill Partners LLC Conference Call Fourth Quarter 2013 Results. February 25, 2014
 Seadrill Partners LLC Conference Call Fourth Quarter 2013 Results February 25, 2014 Forward Looking Statements This presentation includes forward looking statements. Such statements are generally not historical
SIEM OFFSHORE INC. REPORT FOR THE THIRD QUARTER 2016
 SIEM OFFSHORE INC. REPORT FOR THE THIRD QUARTER 2016 27 October 2016 Siem Offshore Inc. (the Company ; Oslo Stock Exchange: SIOFF) reports results for the third quarter and first nine months ended 30 September
THIRD QUARTER a one-month option, and is scheduled to commence mid-may 2019 following the completion of the Johan Sverdrup contract.
 THIRD QUARTER 2018 (Figures in brackets refer to the corresponding period of 2017) In the third quarter, Prosafe finalised the transforming agreements with COSCO and its lenders, secured several contracts
Q Presentation
 Q1 2015 Presentation Contents Highlights and material events Segment reporting Financial information Summary Page 2 Group Financial performance Q1 2015 highlights: Operating revenue of USD 240 million
Q Earnings Call Presentation. October 25, 2018
 Q3 2018 Earnings Call Presentation October 25, 2018 Disclaimer Forward-looking statements We would like to caution you with respect to any forward-looking statements made in this presentation as defined
PREPARING FOR THE RECOVERY
 PREPARING FOR THE RECOVERY FINANCIAL REPORT Q3 2018 DOF Subsea AS Thormøhlens gate 53 C 5006 Bergen NORWAY www.dofsubsea.com Index Financial Report 3 rd quarter 2018... 4 Financial statements 3 rd quarter
SEACOR Marine Announces Second Quarter 2018 Results
 August 9, 2018 SEACOR Marine Announces Second Quarter 2018 Results Continued Improvement in Operating Performance Strengthened Balance Sheet HOUMA, La.--(BUSINESS WIRE)-- SEACOR Marine Holdings Inc. (NYSE:SMHI)
2018 first quarter results
 First quarter 2018 review 2018 first quarter results Statoil reports adjusted earnings of USD 4.4 billion and USD 1.5 billion after tax in the first quarter of 2018. IFRS net operating income was USD 5.0
Oceaneering Reports First Quarter 2018 Results
 PRESS RELEASE Oceaneering Reports First Quarter 2018 Results HOUSTON, April 25, 2018 Oceaneering International, Inc. ("Oceaneering") (NYSE:OII) today reported a net loss of $49.1 million, or $(0.50) per
Maersk Drilling Q May 2016
 Maersk Drilling Q1 2016 6 May 2016 page 2 Legal notice This presentation contains certain forward looking statements (all statements that are not entirely based on historical facts, among others expectations
John Wood Group PLC Half Year Report 2017
 John Wood Group PLC Half Year Report 2017 Contents 01 Highlights 02 Business review 07 Financial review 10 Group income statement 11 Group statement of comprehensive income 12 Group balance sheet 13 Group
Archer Fourth Quarter John Lechner CEO Dag Skindlo CFO
 Archer Fourth Quarter 217 John Lechner CEO Dag Skindlo CFO 27 February 218 Disclaimer forward looking statements Cautionary Statement Regarding Forward-Looking Statements In addition to historical information,
Presentation of 3Q 2018 results. 07 November 2018
 Presentation of 3Q 218 results 7 November 218 Company Status (reference to stock exchange release from 22 Oct 218) The Company sees signs of improvement in most markets, but market recovery is slow and
For personal use only
 2016 Full Year Results Presentation MATRIX COMPOSITES & ENGINEERING Aaron Begley Chief Executive Officer Peter Tazewell Chief Financial Officer 24 August 2016 Agenda Overview Financial results Strategy
Statoil's second quarter 2012 net operating income was NOK 62.0 billion, a 2% increase compared to NOK 61.0 billion in the second quarter of 2011.
 Press release 26 July 2012 2012 SECOND QUARTER RESULTS Statoil's second quarter 2012 net operating income was NOK 62.0 billion, a 2% increase compared to NOK 61.0 billion in the second quarter of 2011.
Conference. May 21, President and CEO
 UBS Global Oil and Gas Conference May 21, 2013 Rob Saltiel l President and CEO 1 Forward Looking Statements Statements contained in this report with respect to the future are forward-looking statements.
2 November Q results and market update
 2 November 2017 Q3 2017 results and market update Disclaimer All statements in this presentation other than statements of historical fact are forward-looking statements, which are subject to a number of
GulfMark Offshore, Inc. Lehman Brothers High Yield Conference
 GulfMark Offshore, Inc. Lehman Brothers High Yield Conference - 2005 Cautionary Statement Regarding Forward-Looking Statements This presentation includes forward-looking statements and projections, made
Q Earnings Presentation. August 5, 20150
 Q2 2015 Earnings Presentation August 5, 20150 Q2 2015 Earnings Call Agenda I. Introduction Harmony Packard, Corporate Communications II. Operational Highlights Chris Bradshaw, President, CEO and CFO III.
HESS CORPORATION HESS REPORTS ESTIMATED RESULTS FOR THE SECOND QUARTER OF Key Highlights: Second Quarter Financial and Operating Highlights:
 HESS CORPORATION HESS REPORTS ESTIMATED RESULTS FOR THE SECOND QUARTER OF 2018 Key Highlights: Estimate of gross discovered recoverable resources on the Stabroek Block, offshore Guyana (Hess 30 percent),
Pareto Securities Oil and offshore Conference Oslo, September 2014 Presented by Atle Jacobsen (CEO)
") Pareto Securities Oil and offshore Conference Oslo, 10-11 September 2014 Presented by Atle Jacobsen (CEO) Disclaimer This presentation includes and is based, inter alia, on forward-looking information
Pareto Securities Oil and offshore Conference Oslo, 10-11 September 2014 Presented by Atle Jacobsen (CEO) Disclaimer This presentation includes and is based, inter alia, on forward-looking information
FOURTH QUARTER Operations. Financials
 FOURTH QUARTER 2016 Operations (Figures in brackets refer to the corresponding period of 2015) Fleet utilisation 1 in the fourth quarter was 43 per cent (62 per cent). Safe Boreas continued the contract
BIBBY OFFSHORE HOLDINGS LIMITED
 Company Registration No. 07188049 BIBBY OFFSHORE HOLDINGS LIMITED Report and Condensed Financial Statements for the period ended 2015 Report and Condensed Financial Statements Page Management report 1
First Quarter Change Revenues 1, , % Operating Income from Recurring Activities
 PRESS RELEASE Paris, May 15, 2007 FIRST QUARTER 2007 RESULTS Operating income from recurring activities: + 237% Operating margin ratio from recurring activities: 6.1% Earnings per share: + 103% (except
TGS EARNINGS RELEASE 1 st QUARTER RESULTS
 TGS EARNINGS RELEASE 25 APRIL 2013 TGS EARNINGS RELEASE 1 st QUARTER RESULTS 1 st QUARTER HIGHLIGHTS Consolidated net revenues were USD 211 million, an increase of 10% compared to Q1 2012. Net late sales
Financial statements and review 2nd quarter 2012
 2012 Financial statements and review 2nd quarter 2012 2012 SECOND QUARTER RESULTS Statoil's second quarter 2012 net operating income was NOK 62.0 billion, a 2% increase compared to NOK 61.0 billion in
Oil Report 2Q 2017 Earnings Summary for International Oil Companies (IOCs) & Outlook
 & Outlook") August 9, 2017 2Q 2017 Earnings Summary for IOCs & Outlook Page 1 Quarterly Chart Summary (Aggregate of IOCs) Pages 2-3 Earnings Side Notes Page 4-6 Results by IOC Pages 7-10 Oil Report 2Q 2017 Earnings
August 9, 2017 2Q 2017 Earnings Summary for IOCs & Outlook Page 1 Quarterly Chart Summary (Aggregate of IOCs) Pages 2-3 Earnings Side Notes Page 4-6 Results by IOC Pages 7-10 Oil Report 2Q 2017 Earnings
TechnipFMC Announces Fourth Quarter 2017 Results
 TechnipFMC Announces Fourth Quarter 2017 Results February 21, 2018 Successful first year; strong operational performance across all segments Full-year subsea orders of $5.1 billion increased 27% 1 over
Seadrill Investor Presentation Pareto Securities Oil & Offshore Conference, Oslo 12 September 2018
 Seadrill Investor Presentation Pareto Securities Oil & Offshore Conference, Oslo 12 September 2018 Disclaimer We have prepared this document solely for informational purposes. You should not definitively
Fourth quarter results 2014
 Fourth quarter results 2014 Highlights Fourth quarter 2014 Offshore hook-up of Eldfisk being completed Impairment on goodwill New corporate organisational structure Order backlog of NOK 16.5* billion Subsequent
Seadrill Partners LLC. Morgan Stanley Midstream MLP & Diversified Natural Gas Corporate Access Event March 2014
 Seadrill Partners LLC Morgan Stanley Midstream MLP & Diversified Natural Gas Corporate Access Event March 2014 Forward Looking Statements This presentation includes forward looking statements. Such statements
2007 INTERIM RESULTS. September 2007
 2007 INTERIM RESULTS September 2007 Headlines Focus on operational delivery producing strong financial performance Significant growth in profits with interim dividend more than doubled Substantial backlog
ANALYSTS PRESENTATION March 11, T. Mace, CEO and M. Miles, CFO
 ANALYSTS PRESENTATION March 11, 2009 T. Mace, CEO and M. Miles, CFO DISCLAIMER Some of the statements contained in this presentation that are not historical facts are statements of future expectations
FOURTH QUARTER Recent highlights
 FOURTH QUARTER 2018 (Figures in brackets refer to the corresponding period of 2017) In the fourth quarter, the fleet utilisation 1 reached its highest since Q3 2015 at 63 per cent. A further two contracts
Q trading update: continued strong revenue growth and improved EBIT Driven by early cyclical marine site characterisation market
 Leidschendam, the Netherlands, 26 October 208 Q3 208 trading update: continued strong revenue and improved EBIT Driven by early cyclical marine site characterisation market Revenue of 29.% on basis, mainly
North Atlantic Drilling Ltd.
 North Atlantic Drilling Ltd. Fourth quarter 2013 results February 25, 2014 Forward-Looking Statements The statements described in this presentation that are not historical facts are forwardlooking statements
Fourth quarter results February 2018
 Fourth quarter results 2017 8 February 2018 Fourth quarter 2017 Highlights Strong performance and results Projects being completed New contracts secured: White Rose marine operations Yme support structure
2009 SUBSEA 7 ANNUAL REPORT. 1 Subsea 7 Annual Report
 SUBSEA 7 ANNUAL REPORT 1 Subsea 7 Annual Report Who We Are Subsea 7 is one of the world s leading subsea engineering and construction companies servicing the oil and gas industry. Our skilled and experienced
TechnipFMC Announces Second Quarter 2018 Results
 Press Release TechnipFMC Announces Second Quarter 2018 Results Net income of $105.7 million and adjusted EBITDA of $377.2 million Inbound orders of $4.2 billion; orders exceeded revenue in all segments
Conference Call 3Q 2013 results. November 25, 2013
 Conference Call 3Q 2013 results November 25, 2013 Forward Looking Statements The statements described in this presentation that are not historical facts are forward-looking statements within the meaning
First-quarter results 2014
 1Q First-quarter results 2014 April 30, 2014 2014 Aker Solutions www.akersolutions.com Financial highlights First-quarter Revenue (NOK million) 10,312 11,229 results 2014 1Q 2013 2Q 2013 3Q 2013 4Q 2013
FAIRSTAR HEAVY TRANSPORT NV BOARD OF DIRECTORS REPORT FIRST HALF YEAR OF 2010
 FAIRSTAR HEAVY TRANSPORT NV BOARD OF DIRECTORS REPORT FIRST HALF YEAR OF 2010 FAIRSTAR AWARDED USD 90M TRANSPORTATION CONTRACT FOR GORGON LNG PROJECT FAIRSTAR INITIATES FLEET EXPANSION STRATEGY WITH SUCCESSFUL
Archer First Quarter John Lechner CEO Dag Skindlo CFO
 Archer First Quarter 218 John Lechner CEO Dag Skindlo CFO 8 May 218 Disclaimer forward looking statements Cautionary Statement Regarding Forward-Looking Statements In addition to historical information,
John Wood Group PLC Half Year Report 2015
 John Wood Group PLC Half Year Report 2015 Contents 02 Highlights 03 Business review 06 Financial review 09 Group income statement 10 Group statement of comprehensive income 11 Group balance sheet 12 Group
Fugro HY 2018: strong revenue growth and improved EBIT Continued competitive offshore market conditions
 Leidschendam, the Netherlands, 1 August 2018 Fugro HY 2018: strong revenue growth and improved EBIT Continued competitive offshore market conditions Revenue growth of 16.6% on comparable basis mainly driven
SECOND QUARTER AND FIRST HALF REPORT 2018
 SECOND QUARTER AND FIRST HALF REPORT 2018 EBITDA for the second quarter amounted to USD 57.1 million (USD 26.4 million). Higher EBITDA is mainly due to better utilisation, higher average day rates, cost
1Q 2016 Earnings Call Presentation
 1Q 2016 Earnings Call Presentation Valmont Industries. Inc. 2016 Investor Day Forward-looking Statement Disclosure These slides contain (and the accompanying oral discussion will contain) forwardlooking
Presentation at Swedbank s Nordic Energy Summit - 20 March Atle Sæbø EVP & CFO
 Presentation at Swedbank s Nordic Energy Summit - 20 March 2014 Atle Sæbø EVP & CFO Our people Our assets Our clients ~3,100 employees worldwide Modern and high capability assets Long term relationships
Cowen and Company 4th Annual Ultimate Energy Conference. December 2, 20140
 Cowen and Company 4th Annual Ultimate Energy Conference December 2, 20140 Cautionary Statement Regarding Forward Looking Statements This presentation contains forward-looking statements. Forward-looking
Presentation of Q results August 23 rd
 Presentation of Q2 218 results August 23 rd Quarter highlights 217 218 Revenues increased by MNOK 484 in Q2 218 vs Q1 218 Opex per day per active vessel reduced by approximately 8% compared to Q1 218 EBITDA
Fiscal Year 2015 Second Quarter Results
 Fiscal Year 2015 Second Quarter Results APRIL 20, 2015 Today s Agenda Highlights & Market Review Financial Results & Outlook Q&A Tom Gendron Bob Weber PAGE 2 Cautionary Statement Information in this presentation
Deep Sea Supply PLC. Quarter Financial Report
 Deep Sea Supply PLC Quarter 4 2016 Financial Report 1 Deep Sea Supply Plc 4Q 2016 Financial Report BOARD OF DIRECTORS REPORT Deep Sea Supply ( DESS or Company ) reports unaudited results for 4Q 2016. Highlights
FOURTH QUARTER 2016 RESULTS. Oslo, 9 February 2017 CEO Christiaan Vermeijden, CFO Hege A. Veiseth
 FOURTH QUARTER 2016 RESULTS. Oslo, 9 February 2017 CEO Christiaan Vermeijden, CFO Hege A. Veiseth Disclaimer This quarterly presentation includes and is based, inter alia, on forward-looking information
Disclaimer Page 2
 Disclaimer This presentation should be read in conjunction with Vard Holdings Limited s results for the period ended 30 June 2014 in the SGXNet announcement. Financial figures are presented according to