Federal Grid Company of Unified Energy System
|
|
|
- Hillary Cox
- 5 years ago
- Views:
Transcription


1 Federal Grid Company of Unified Energy System 2009 IFRS Results Andrey Kazachenkov, CFO July 21 st, 2010
 (220 kv and higher) Over 121 thousand km of transmission lines and 305 GW of")

: FEES Key indicators (IFRS) 2009 Revenues, RUR mln 87,580 EBITDA, RUR mln*")

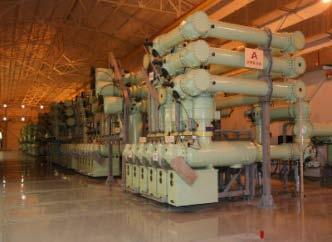
2 Federal Grid Company: Overview Federal Grid Company natural monopoly in electic power transmission, owns and operates the Unified National Electric Grid (UNEG) (220 kv and higher) Over 121 thousand km of transmission lines and 305 GW of installed transformer capacity, spanning 73 Russian regions From January 1 st, 2010, the Company transferred to a new tariff regulation system based on RAB methodology Regions covered by the Company Shareholder structure Russian Federation: 79.11% Free float: 20.89% Number of staff: 21,500 Market capitalization As of : RUR 412 bln Ticker symbol (MICEX): FEES Key indicators (IFRS) 2009 Revenues, RUR mln 87,580 EBITDA, RUR mln* 43,788 Net profit, RUR mln* 16,101 Number of substations 797 Installed transformer capacity, kv, MVA 305,459 Overall length of lines, thousand km 121 Electricity output from the UNEG, bln kwh 466 Electricity losses, bln kwh 22 * excluding one-time write-offs and revaluations Page 1


3 Schedule of IFRS Reporting Disclosure date: Disclosure date: Disclosure date: Expected disclosure date: Page 2
4 Изменения Changes in Accounting в учетной политике Policy 2009 Combined and Consolidated Financial Statements were prepared in accordance with International Financial Reporting Standards and interpretations accepted by the Committee of International Financial Reporting Standards, as well as the accounting policy according to which the financial statements for the year ended December 31 st, 2008 were prepared Some parts of accounting policy were changed to conform with new and adjusted standards and interpretations that came into effect for financial periods starting January 1 st, 2009, (IFRS 8 «Operational Segments», IAS 23 «Borrowing Costs», IAS 1 «Presentation of Financial Statements», IFRS 7 «Financial Instruments: Disclosures») Page 3
5 2009 Key Financial Results Revenues increased 26.5% to RUR 87,580 mln EBITDA increased 31% to RUR 43,788 mln EBITDA margin increased 1.6% to 50% Operating profit was RUR 12,868 mln* Net profit stood at RUR 16,101 mln* * Excluding PP&E revaluation Page 4
6 Combined and Consolidated Statement of Financial Position as at December 31st, 2009 Indicator, RUR mln Change,% Assets 697, , Non-current assets 584, , Property, plant and equipment (PP&E) Financial investments 467, , , ,632 (4) Current assets 112, , Liabilities 697, , Equity 592, , Non-current liabilities 57,030 93, Current liabilities 48,648 81, Page 5
7 2009 Combined and Consolidated Statement of Comprehensive Income Indicator, RUR mln Change, % Revenues 69,251 87, Other operating income 6,587 4,287 (35) Operating expenses (68,175) (78,216) 15 Gross profit* 7,663 13, Operating profit (loss) from current activity* 10,035 12, EBITDA** 33,508 43, Net profit (loss) (23,837) 16,101* - * excluding PP&E revaluation ** excluding one-time accounts and PP&E revaluation Page 6
8 Key Efficiency Indicators (1) Indicator Change, % 1. Profitability ratios EBIT margin*, % EBITDA margin*, % ROA**, % 0.48 (1.06) 1.54 ROE**, % 0.58 (1.36) Liquidity ratios Current liquidity Cash liquidity Financial Stability ratios Equity ratio (0,03) * was used the indicator Revenues ** the loss in 2008 was caused by the financial investment impairment Page 7
9 Key Efficiency Indicators (2) Indicator Change, % 4. Operational Efficiency indices Revenues*/Grid length, RUR/km 742, , % Revenues*/Transformers capacity, RUR/MVA 293, , % FCF, RUR mln 18,014 (55) - Net Debt, RUR mln (79,022) (41,793) - EPS**, RUR (0.031) - * was used the indicator Revenues **excluding PP&E revaluation Page 8
10 Cash Flow Structure Indicator, RUR mln Cash and cash equivalents at the beginning of the period 15,685 15,740 Net cash generated by operating activities 32,455 19,820 Net cash used in investing activities: (32,473) (110,390) Net change in financial investments 53,442 3,350 Interest and dividends received 5,019 4,688 Purchases of PP&E and intangible assets (90,934) (118,428) Net cash generated by financing activities: 18,032 90,515 Proceeds from shares issuance 40,178 20,425 Net change in borrowings (19,985) 2,968 Interest and dividends paid (2,61) (3,210) Financial lease payments - (1,951) Cash received as a result of the merger, net of payments on behalf of the predecessor - 72,283 Net increase in cash and cash equivalents 18,014 (55) Cash and cash equivalents as of the end of the period 33,699 15,685 Page 9
11 Operating Expense Structure Indicator, RUR mln Depreciation of PP&E 16,216 16,740 Employee benefit expenses and payroll taxes 13,680 15,904 Purchased electricity 12,924 15,431 Repair and maintenance services 7,955 9,029 Accrual of allowance for doubtful debtors 1,872 5,527 Rent 1,575 1,435 Loss on disposal of PP&E 1,488 1,413 Consulting, legal and auditing services 1,025 1,293 Business trips and transportation expenses 996 1,251 Insurance 1,211 1,153 Amortization of intangible assets Others 8,782 8,110 Total 68,175 78,216 Page 10

12 Revenue Structure Revenues Indicator, RUR mln Transmission fee 66,229 80,242 Electricity sales 2,516 3,348 Technological connection services 49 3,053 Grids repair and technical maintenance services Total revenues 69,251 87,580 Other operating income Indicator, RUR mln Design works 357 1,033 Communication services Rental services Other revenues 5,222 2,469 Total other operational revenues 6,587 4,287 Page 11

13 Contacts Federal Grid Company of Unified Energy System 5А Akademika Chelomeya Street, Moscow, Investor Relations Department Tel: Mobile: Alexander Duzhinov Nadezhda Sukhova Olga Ovchinnikova Tatiana Mayba Page 12
14 Appendix Page 13
15 Combined and Consolidated Statement on Financial Position as at December 31 st, 2009 (IFRS) RUR mln Non-current assets 850, ,914 Property, plant and equipment 740, ,349 Intangible assets 6,392 6,933 Investments in associated companies 58,451 44,632 Available-for-sale investments 35,229 11,774 Long-term promissory notes 8,952 51,010 Other non-current assets 959 3,216 Current assets 126, ,827 Cash and cash equivalents 33,699 15,685 Bank deposits 10,187 2,386 Short-term promissory notes 48,681 57,251 Accounts receivable and prepayments 29,248 31,076 Profit tax prepayments 988 3,635 Inventories 3,271 2,767 Other current assets Total assets 976, ,741 Page 14
16 Combined and Consolidated Statement on Financial Position as at December 31 st, 2009 (IFRS) RUR mln Equity 801, ,063 Share equity: ordinary shares 576, ,757 Treasury shares (6,864) (6,864) Share premium 10,347 10,347 Reserves 267,533 (2,860) Retained earnings (47,795) 13,337 Minority interest 1,570 1,346 Non-current liabilities 93,079 57,030 Deferred profit tax liabilities 83,640 36,779 Non-current debt 6,000 17,318 Retirement benefit obligations 3,439 2,933 Current liabilities 81,797 48,648 Accounts payable to the shareholders of FGC UES 40,178 - Current debt and current portion of non-current debt 7,545 16,211 Accounts payable and accrued charges 32,938 31,456 Other taxes payable 1, Total equity and liabilities 976, ,741 Page 15

17 Combined and Consolidated Statement of Comprehensive Income for the year ended 31 (IFRS) RUR mln Revenues 87,580 69,251 Other operating income 4,287 6,587 Operating expenses (78,216) (68,175) Gain on sale of available-for-sale investments 1,504 2,563 Reversal of impairment provision for property, plant and equipment Specific impairment provision for property, plant and equipment and intangible assets 9,642 - (2,287) (191) Revaluation loss on property, plant and equipment (105,693) - Operating (loss)/ profit (83,183) 10,035 Finance income 10,000 8,483 Finance costs (1,484) (7,119) Impairment of available-for-sale investments and associates ( 2,018) (45,107) Share of result of associates 1,893 (1,372) Loss before profit tax (74,792) (35,080) Profit tax 13,347 11,243 Loss for the period (61,445) (23,837) Page 16
18 Combined and Consolidated Statement of Comprehensive Income for the year ended 31 (IFRS) RUR mln Other comprehensive income Change in revaluation reserve for property, plant and equipment 297,862 - Share of other comprehensive income of associates 13, Foreign currency translation difference 9 61 Available-for-sale investments 25,032 - Effect of change in tax rate on revaluation of property, plant and equipment - 2,717 Profit tax recorded directly in other comprehensive income (65,366) (82) Other comprehensive income for the period, net of profit tax 270,930 3,038 Total comprehensive income for the period 209,485 (20,799) Loss attributable to: Shareholders of FGC UES (61,196) (23,784) Minority interest (249) (53) Total comprehensive income attributable to: Shareholders of FGC UES 209,261 (20,753) Minority interest 224 (46) Loss per ordinary share attributable to the shareholders of FGC UES, basic and diluted (in RUR) (0.053) (0.031) Page 17
19 Financial Investments Indicator, RUR mln December 2008 December 2009 Investments in associated companies 44,632 58,451 Available-for-sale investments 11,774 35,229 Long-term promissory notes 51,010 8,952 Short-term promissory notes 57,251 48,681 Total 164, ,313 Page 18
Federal Grid Company of Unified Energy System
 Federal Grid Company of Unified Energy System 1H2010 RAS Results Andrey Kazachenkov, CFO August 10 th, 2010 Federal Grid Company: Overview Federal Grid Company a natural monopoly in electric power transmission,
2017 IFRS OPERATIONAL AND FINANCIAL RESULTS
 2017 IFRS OPERATIONAL AND FINANCIAL RESULTS March 2018 Key financial figures Key events in 2017 and after the reporting period Starting 1 July 2017, the tariff for electricity transmission on the UNEG
PJSC FGC UES CONDENSED CONSOLIDATED INTERIM FINANCIAL STATEMENTS PREPARED IN ACCORDANCE WITH IAS 34 INTERIM FINANCIAL REPORTING
 CONDENSED CONSOLIDATED INTERIM FINANCIAL STATEMENTS PREPARED IN ACCORDANCE WITH IAS 34 INTERIM FINANCIAL REPORTING AS AT AND FOR THE THREE AND SIX MONTHS ENDED 30 JUNE 2018 (UNAUDITED) CONTENTS Report
INTERREGIONAL DISTRIBUTION GRID COMPANY OF CENTRE, PUBLIC JOINT-STOCK COMPANY. Performance of IDGC of Centre, PJSC for 2017 Moscow, March 2018
 INTERREGIONAL DISTRIBUTION GRID COMPANY OF CENTRE, PUBLIC JOINT-STOCK COMPANY Performance of IDGC of Centre, PJSC for 2017 Moscow, March 2018 DISCLAIMER This presentation does not constitute or form part
key figures q , 2
 key figures q1 2013 1, 2 unaudited; in millions of, except where otherwise stated orders continuing operations 19,141 19,792 Volume (5)% 3 Actual % Change Adjusted 3 Continuing operations Orders 19,141
DIXY GROUP ANNOUNCES CONSOLIDATED UNAUDITED IFRS RESULTS FOR THE FIRST HALF OF 2011
 PRESS RELEASE DIXY GROUP ANNOUNCES CONSOLIDATED UNAUDITED IFRS RESULTS FOR THE FIRST HALF OF 2011 Moscow, September 20, 2011 DIXY Group (RTS, MICEX: DIXY) one of Russia s leading retailers of foods and
Summary of Consolidated Financial Results of Taiheiyo Cement Corporation for the Fiscal 2018 Ended March 31, 2018 May 10, 2018
 Summary of Consolidated Financial Results of Taiheiyo Cement Corporation for the Fiscal 2018 Ended March 31, 2018 May 10, 2018 Company: Taiheiyo Cement Corporation Fiscal 2017: April 1, 2016-March 31,
Summary of Consolidated Financial Results of Taiheiyo Cement Corporation for the Fiscal 2016 Ended March 31, 2016 May 12, 2016
 Summary of Consolidated Financial Results of Taiheiyo Cement Corporation for the Fiscal 2016 Ended March 31, 2016 May 12, 2016 Company: Taiheiyo Cement Corporation Fiscal 2015: April 1, 2014-March 31,
Financial Statements for Fiscal 2003 (April 1, 2003 to March 31, 2004) Nippon Steel Chemical Co., Ltd.
 Nippon Steel Chemical Co., Ltd.") Financial Statements for Fiscal 2003 (April 1, 2003 to March 31, 2004) Nippon Steel Chemical Co., Ltd. 1 Consolidated Operating Performances 2004 2003 Increase or decrease 2004 from previous term Net sales
Financial Statements for Fiscal 2003 (April 1, 2003 to March 31, 2004) Nippon Steel Chemical Co., Ltd. 1 Consolidated Operating Performances 2004 2003 Increase or decrease 2004 from previous term Net sales
ORIENTAL UNION CHEMICAL CORPORATION AND SUBSIDIARIES
 CONSOLIDATED BALANCE SHEETS June 30, 2016 (Reviewed) December 31, 2015 (Audited) June 30, 2015 (Reviewed) ASSETS Amount % Amount % Amount % CURRENT ASSETS Cash and cash equivalents $ 1,520,270 4 $ 2,639,717
ELNA CO.,LTD. Non-Consolidated Balance Sheets As of December 31,2007 and 2006
 Non-Consolidated Balance Sheets As of and 2006 Thousands of Millions of Yen (1US$= 114.15) Assets 2006 2007 2007 Current assets: Cash on hand and in banks 4,312 874 $7,663 Notes and accounts receivable
GROUP EBITDA UP 256% IN 1H 2009 VERSUS 1H 2008
 PRESS-RELEASE FOR IMMEDIATE DISTRIBUTION OJSC PHARMACY CHAIN 36.6 REPORTS Q2 AND 1H 2009 UNAUDITED IFRS RESULTS GROUP EBITDA UP 256% IN 1H 2009 VERSUS 1H 2008 September 24, 2009, MOSCOW OJSC Pharmacy Chain
11-Year Consolidated Financial Highlights
 11-Year Consolidated Financial Highlights As of March 31, 2017 2007.3 2008.3 2009.3 2010.3 Net Sales ( million) 1,376,958 1,487,496 1,660,162 1,415,718 Operating Profit ( million) 162,315 70,048 65,204
Unappropriated retained earnings (accumulated deficit) Total unappropriated retained earnings (accumulated deficit) 676, ,797 Total retained ear
 Total unappropriated retained earnings (accumulated deficit) 676, ,797 Total retained ear") Financial Statement Balance Sheet Accounting Title 2014/12/31 2013/12/31 Balance Sheet Assets Current assets Cash and cash equivalents Total cash and cash equivalents 1,183,185 1,177,682 Current bond investment
Financial Statement Balance Sheet Accounting Title 2014/12/31 2013/12/31 Balance Sheet Assets Current assets Cash and cash equivalents Total cash and cash equivalents 1,183,185 1,177,682 Current bond investment
Consolidated Balance Sheets Consolidated Balance Sheet
 Consolidated Balance Sheets Consolidated Balance Sheet As of 2017 2016 Current Assets Cash and cash equivalents $ 12,681 $ 9,968 Short-term investments 30,338 18,664 Trade receivables 30,662 19,788 Other
POU CHEN CORPORATION AND SUBSIDIARIES
 CONSOLIDATED BALANCE SHEETS March 31, 2013 December 31, 2012 March 31, 2012 January 1, 2012 ASSETS Amount % Amount % Amount % Amount % CURRENT ASSETS Cash and cash equivalents (Notes 4 and 6) $ 29,346,249
OJSC «VEROPHARM» ANNOUNCES FINANCIAL RESULTS OF 2013
 PRESS-RELEASE FOR IMMEDIATE DISTRIBUTION APRIL 30, 2014 OJSC «VEROPHARM» ANNOUNCES FINANCIAL RESULTS OF 2013 April 30, 2014, MOSCOW OJSC «VEROPHARM» [RTS:VRPH, MICEX:VFRM] announces its audited financial
LENENERGO. THE RUSSIA FORUM February, 2011
 LENENERGO THE RUSSIA FORUM 2011 2-4 February, 2011 DISCLAIMER The information contained herein has been prepared by the Company. The opinions presented herein are based on general information gathered
Consolidated Statement of Profit or Loss (in million Euro)
") Consolidated Statement of Profit or Loss (in million Euro) Unaudited, consolidated figures following IFRS accounting policies. Q2 2017 Q2 2018 H1 2017 H1 2018 Revenue 622 559 1,210 1,108 Cost of sales
Consolidated Statement of Profit or Loss (in million Euro) Unaudited, consolidated figures following IFRS accounting policies. Q2 2017 Q2 2018 H1 2017 H1 2018 Revenue 622 559 1,210 1,108 Cost of sales
Total assets 22,581 21,030 $186,107
 Non-Consolidated Balance Sheets As of December 31,2017 and 2016 Thousands of U.S.Dollars Millions of Yen (1US$=\113.00) Assets 2016 2017 2017 Current assets: Cash on hand and in banks 826 1,395 $12,348
The Requirements require the information to be disclosed in the manner it is presented.
 THE POWER COMPANY LIMITED LINE BUSINESS FINANCIAL STATEMENTS FOR THE YEAR ENDED 31 MARCH Prepared for the Purposes of the Electricity Information Disclosure Requirements 2004. INFORMATION DISCLOSURE DISCLAIMER
1Q2014 IFRS Consolidated Financial Results. September 11, 2014
 1Q214 IFRS Consolidated Financial Results September 11, 214 Andrey Kruglov Deputy Chairman of Gazprom Management Committee Head of the Department for Finance and Economics 1 Summary of Financial Results
ASSETS Amount % Amount % LIABILITIES AND STOCKHOLDERS EQUITY Amount % Amount %
 BALANCE SHEETS March 31, 2011 AND 2010 ASSETS Amount % Amount % LIABILITIES AND STOCKHOLDERS EQUITY Amount % Amount % CURRENT ASSETS CURRENT LIABILITIES Cash and cash equivalents $ 715,241 1 $ 748,927
Interregional Distribution Grid (IDG) Company of North-West. Consolidated Financial Statements for the year ended 31 December 2010
 Company of North-West. Consolidated Financial Statements for the year ended 31 December 2010") Interregional Distribution Grid (IDG) Company of North-West Consolidated Financial Statements for the year ended 31 December 2010 Contents INDEPENDENT AUDITORS REPORT 3 CONSOLIDATED STATEMENT OF COMPREHENSIVE
Interregional Distribution Grid (IDG) Company of North-West Consolidated Financial Statements for the year ended 31 December 2010 Contents INDEPENDENT AUDITORS REPORT 3 CONSOLIDATED STATEMENT OF COMPREHENSIVE
Financial Section. 57 Consolidated Balance Sheets. 59 Consolidated Statements of Operations. 60 Consolidated Statements of Comprehensive Income
 Financial Section 57 Consolidated Balance Sheets 59 Consolidated Statements of Operations 60 Consolidated Statements of Comprehensive Income 61 Consolidated Statements of Changes in Net Assets 63 Consolidated
RBC Information Systems. Consolidated Financial Statements for the year ended 31 December 2003
 Consolidated Financial Statements for the year ended 31 December 2003 Contents Independent Auditor s Report 3 Consolidated Income Statement 4 Consolidated Balance Sheet 5 Consolidated Statement of Cash
Alternative Performance Measures 2017
 Alternative Performance Measures 2017 The Group s reporting uses alternative performance measures (APMs) that are not defined according to IFRS. They should not be considered in isolation and should not
Consolidated Balance Sheet - 1/2
 Consolidated Balance Sheet March 31, 212 ASSETS CURRENT ASSETS: Cash and cash equivalents (Notes 8 and 19) Time deposits over three months (Note 19) Receivables (Note 19): Trade notes (Note 11) Trade accounts
Consolidated Statement of Profit or Loss (in million Euro)
") Consolidated Statement of Profit or Loss (in million Euro) Q1 2016 Q1 2017 % change Revenue 603 588-2.5% Cost of sales (408) (396) -2.9% Gross profit 195 192-1.5% Selling expenses (84) (86) 2.4% Research
Consolidated Statement of Profit or Loss (in million Euro) Q1 2016 Q1 2017 % change Revenue 603 588-2.5% Cost of sales (408) (396) -2.9% Gross profit 195 192-1.5% Selling expenses (84) (86) 2.4% Research
Three Months Ended Twelve Months Ended 12/31/ /31/ /31/ /31/
 Consolidated Statements of Operations (In thousands, except share and per share data) TABLE 1 Software licenses $11,336 $8,901 $37,859 $30,709 Support and maintenance 12,631 12,194 49,163 45,591 Professional
Consolidated Statement of Profit or Loss (in million Euro)
") Consolidated Statement of Profit or Loss (in million Euro) Q3 2015 Q3 2016 % change 9m 2015 9m 2016 % change Revenue 661 625-5.4% 1,974 1,873-5.1% Cost of sales (453) (415) -8.4% (1,340) (1,239) -7.5%
Consolidated Statement of Profit or Loss (in million Euro) Q3 2015 Q3 2016 % change 9m 2015 9m 2016 % change Revenue 661 625-5.4% 1,974 1,873-5.1% Cost of sales (453) (415) -8.4% (1,340) (1,239) -7.5%
Consolidated financial statements Joint Stock Company Russian Grids and its subsidiaries for the year ended 31 December 2014
 Consolidated financial statements Joint Stock Company Russian Grids and its subsidiaries for the year ended 31 December 2014 with independent auditor s report Consolidated financial statements Joint Stock
NORWEGIAN CRUISE LINE HOLDINGS LTD. CONSOLIDATED STATEMENTS OF OPERATIONS (Unaudited) (in thousands, except share and per share data)
 (in thousands, except share and per share data)") CONSOLIDATED STATEMENTS OF OPERATIONS (in thousands, except share and per share data) Revenue Passenger ticket $ 659,117 $ 583,923 $ 1,655,666 $ 1,400,470 Onboard and other 247,900 213,962 681,306 569,479
CONSOLIDATED STATEMENTS OF OPERATIONS (in thousands, except share and per share data) Revenue Passenger ticket $ 659,117 $ 583,923 $ 1,655,666 $ 1,400,470 Onboard and other 247,900 213,962 681,306 569,479
5. Consolidated Financial Statements (1) Consolidated Balance Sheets
 Consolidated Balance Sheets") 5. Consolidated Financial Statements (1) Consolidated Balance Sheets March 31, 2008 Assets Current assets Cash and deposits 84,224 89,218 Notes and accounts receivable-trade 230,156 234,862 Lease receivables
5. Consolidated Financial Statements (1) Consolidated Balance Sheets March 31, 2008 Assets Current assets Cash and deposits 84,224 89,218 Notes and accounts receivable-trade 230,156 234,862 Lease receivables
OJSC VOLGA TGC COMBINED AND CONSOLIDATED FINANCIAL STATEMENTS, PREPARED IN ACCORDANCE WITH INTERNATIONAL FINANCIAL REPORTING STANDARDS (IFRS) FOR THE
 FOR THE") OJSC VOLGA TGC COMBINED AND CONSOLIDATED FINANCIAL STATEMENTS, PREPARED IN ACCORDANCE WITH INTERNATIONAL FINANCIAL REPORTING STANDARDS (IFRS) FOR THE YEARS ENDED 31 DECEMBER 2006 AND 2005 Independent Auditors
OJSC VOLGA TGC COMBINED AND CONSOLIDATED FINANCIAL STATEMENTS, PREPARED IN ACCORDANCE WITH INTERNATIONAL FINANCIAL REPORTING STANDARDS (IFRS) FOR THE YEARS ENDED 31 DECEMBER 2006 AND 2005 Independent Auditors
The Requirements require the information to be disclosed in the manner it is presented.
 ELECTRICITY INVERCARGILL LIMITED LINE BUSINESS FINANCIAL STATEMENTS FOR THE YEAR ENDED 31 MARCH Prepared for the Purposes of the Electricity Information Disclosure Requirements 2004. INFORMATION DISCLOSURE
DELL INC. Condensed Consolidated Statement of Financial Position (in millions) (unaudited)
 (unaudited)") Condensed Consolidated Statement of Financial Position Assets: Cash & cash equivalents $ 13,913 $ 14,061 $ 14,623 $ 13,293 $ 13,852 $ 10,635 $ 13,913 $ 13,852 Short-term investments 452 418 509 545 966
Condensed Consolidated Statement of Financial Position Assets: Cash & cash equivalents $ 13,913 $ 14,061 $ 14,623 $ 13,293 $ 13,852 $ 10,635 $ 13,913 $ 13,852 Short-term investments 452 418 509 545 966
Public Joint Stock Company. Federal Grid Company of Unified Energy System ANNUAL FINANCIAL REPORT FOR 2015
 Public Joint Stock Company Federal Grid Company of Unified Energy System ANNUAL FINANCIAL REPORT FOR 2015 In accordance with the UK Disclosure and Transparency Rules April 2016 Moscow CONTENTS 1. ABOUT
Digital River, Inc. Fourth Quarter Results (In thousands, except share data) Subject to reclassification
 Subject to reclassification") (In thousands, except share data) Consolidated Balance Sheets (Unaudited) 2012 2011 Assets Current assets Cash and cash equivalents $ 542,851 $ 497,193 Short-term investments 162,794 223,349 Accounts receivable,
(In thousands, except share data) Consolidated Balance Sheets (Unaudited) 2012 2011 Assets Current assets Cash and cash equivalents $ 542,851 $ 497,193 Short-term investments 162,794 223,349 Accounts receivable,
GILAT SATELLITE NETWORKS LTD. CONDENSED CONSOLIDATED STATEMENTS OF OPERATIONS U.S. dollars in thousands (except share and per share data)
") CONDENSED CONSOLIDATED STATEMENTS OF OPERATIONS (except share and per share data) 2016 2015 2016 2015 Audited Revenues $ 279,551 $ 197,543 $ 80,345 $ 67,682 Cost of revenues 204,061 143,318 56,147 47,181
CONDENSED CONSOLIDATED STATEMENTS OF OPERATIONS (except share and per share data) 2016 2015 2016 2015 Audited Revenues $ 279,551 $ 197,543 $ 80,345 $ 67,682 Cost of revenues 204,061 143,318 56,147 47,181
Balance Sheets (Quarterly)
") Balance Sheets (Quarterly) Assets SHOWA DENKO K.K. (Unit:millions of yen) 2017 2018 2018 2018 Q3 Q1 Q2 Q3 Current assets Cash and deposits 89,291 82,745 89,278 138,208 Notes and accounts receivable - trade
Balance Sheets (Quarterly) Assets SHOWA DENKO K.K. (Unit:millions of yen) 2017 2018 2018 2018 Q3 Q1 Q2 Q3 Current assets Cash and deposits 89,291 82,745 89,278 138,208 Notes and accounts receivable - trade
st IFRS Consolidated Financial Statements
 2461 2018 1st IFRS Consolidated Financial Statements Balance Sheet Balance Sheet Unit: NT$ thousand Accounting Title 2018/03/31 2017/12/31 2017/03/31 Assets Current assets Cash and cash equivalents 1,552,283
Via Technologies, Inc. and Subsidiaries Consolidated Financial Statements for the Six Months Ended June 30, 2015 and 2014
 Via Technologies, Inc. and Subsidiaries Consolidated Financial Statements for the Six Months Ended June 30, 2015 and 2014-1 - CONSOLIDATED BALANCE SHEETS June 30, 2015 (Reviewed) December 31, 2014 (Audited)
Novorossiysk Commercial Sea Port. Interim Condensed Consolidated Financial Statements For the Six Months Ended 30 June 2016
 Novorossiysk Commercial Sea Port Interim Condensed Consolidated Financial Statements For the Six Months Ended TABLE OF CONTENTS Page STATEMENT OF MANAGEMENT S RESPONSIBILITIES FOR THE PREPARATION AND APPROVAL
C o n d e n s e d C o n s o l i d a t e d F i n a n c i a l I n f o r m a t i o n P r e s e n t a t i o n. Moscow, August 28, 2013.
 O J S C C o m p a n y M. v i d e o H 1 2013 C o n d e n s e d C o n s o l i d a t e d F i n a n c i a l I n f o r m a t i o n P r e s e n t a t i o n Moscow, August 28, 2013. Content and liability disclaimer
Digital River, Inc. First Quarter Results (In thousands, except share data) Subject to reclassification
 Subject to reclassification") (In thousands, except share data) Consolidated Balance Sheets (Unaudited) December 31, Assets Current assets Cash and cash equivalents $ 500,742 $ 542,851 Short-term investments 144,615 162,794 Accounts
(In thousands, except share data) Consolidated Balance Sheets (Unaudited) December 31, Assets Current assets Cash and cash equivalents $ 500,742 $ 542,851 Short-term investments 144,615 162,794 Accounts
Consolidated Balance Sheet - 1/2
 Consolidated Balance Sheet March 31, ASSETS CURRENT ASSETS (Note 3): Cash and cash equivalents (Notes 9 and 21) Time deposits over three months (Note 21) Receivables (Note 21): Trade notes (Note 13) Trade
Mar. 31, Jun. 30, 2017
 Consolidated GAAP Statements of Operations ($ in thousands, except EPS) March 31, ended Net Revenues $921,580 $1,059,429 $1,134,224 $191,972 $209,032 $195,443 $593,755 $1,190,202 $199,725 Consumer 870,959
Consolidated income statement
 Consolidated income statement 2013 2012 Restated* Net sales 3,412 3,577 Metal price effect** (1,061) (1,179) Sales at constant metal prices** 2,351 2,398 Cost of sales (3,016) (3,170) Cost of sales at
PDF created with pdffactory Pro trial version
 CONSOLIDATED BALANCE SHEETS DECEMBER 31, 2011 AND 2010 Unit:NT$ thousand 2011/12/31 2010/12/31 Amount % Amount % ASSESTS Current Assets Cash and cash equivalents $8,096,620 16.82 $8,700,536 17.29 Financial
JSC INTER RAO UES Consolidated financial statements
 JSC INTER RAO UES Consolidated financial statements For the year ended with report of independent auditors Consolidated financial statements Contents Independent auditors report Consolidated financial
Consolidated Balance Sheet
 Consolidated Balance Sheet Provided by: RUENTEX INDUSTRIES LIMITED Financial year: Yearly Unit:NT$ thousand Assets Current Assets Cash and cash equivalents 2,867,017.00 6.18 1,894,507.00 7.22 Financial
Accounting Title 2014/3/ /12/ /3/31 Balance Sheet
 Financial Statement Balance Sheet Accounting Title 2014/3/31 2013/12/31 2013/3/31 Balance Sheet Assets Current assets Cash and cash equivalents Total cash and cash equivalents 7,974,989 6,997,862 6,433,466
Consolidated Financial Statements (1) Consolidated Balance Sheet
 Consolidated Balance Sheet") Consolidated Financial Statements (1) Consolidated Balance Sheet As of March As of March Assets Current assets Cash and deposits 18,229 18,673 Notes and accounts receivable - trade 24,077 25,891 Merchandise
Consolidated Financial Statements (1) Consolidated Balance Sheet As of March As of March Assets Current assets Cash and deposits 18,229 18,673 Notes and accounts receivable - trade 24,077 25,891 Merchandise
OGK-1 Group Consolidated financial statements
 Consolidated financial statements Consolidated financial statements Contents Independent auditors report... 1 Consolidated financial statements Consolidated statement of financial position... 3 Consolidated
THE POWER COMPANY LIMITED LINE BUSINESS STATEMENT OF FINANCIAL PERFORMANCE FOR THE YEAR ENDED 31 MARCH 2004
 THE POWER COMPANY LIMITED LINE BUSINESS STATEMENT OF FINANCIAL PERFORMANCE FOR THE YEAR ENDED 31 MARCH 2004 Note 31 March 2004 31 March 2003 Operating Revenue (2) 25,128 23,341 Operating Expenses (3) 21,149
NORWEGIAN CRUISE LINE HOLDINGS LTD. CONSOLIDATED STATEMENTS OF OPERATIONS (unaudited, in thousands, except share and per share data)
") CONSOLIDATED STATEMENTS OF OPERATIONS (unaudited, in thousands, except share and per share data) Revenue Passenger ticket $ 415,399 $ 346,692 $ 1,815,869 $ 1,604,563 Onboard and other 184,946 156,479 754,425
CONSOLIDATED STATEMENTS OF OPERATIONS (unaudited, in thousands, except share and per share data) Revenue Passenger ticket $ 415,399 $ 346,692 $ 1,815,869 $ 1,604,563 Onboard and other 184,946 156,479 754,425
th IFRS Consolidated Financial Statements
 2461 2017 4th IFRS Consolidated Financial Statements Balance Sheet Balance Sheet Unit: NT$ thousand Accounting Title 2017/12/31 2016/12/31 Assets Current assets Cash and cash equivalents Total cash and
JOINT STOCK COMPANY TELASI
 JOINT STOCK COMPANY TELASI ANNUAL REPORT according to the results of works performed in 2009 Chairman of the Supervisory Board А.Zavrazhnov Director General ЮY. Pimonov 1 СONTENT Page Chapter I. General
ON SEMICONDUCTOR CORPORATION AND SUBSIDIARIES UNAUDITED CONSOLIDATED STATEMENT OF OPERATIONS (in millions, except per share data)
") UNAUDITED CONSOLIDATED STATEMENT OF OPERATIONS (in millions, except per share data) March 28, 2014 Quarter Ended December 31, 2013 March 29, 2013 Revenues $ 706.5 $ 718.0 $ 661.0 Cost of revenues 455.7
UNAUDITED CONSOLIDATED STATEMENT OF OPERATIONS (in millions, except per share data) March 28, 2014 Quarter Ended December 31, 2013 March 29, 2013 Revenues $ 706.5 $ 718.0 $ 661.0 Cost of revenues 455.7
OAO Mosenergo. Consolidated Financial Statements for the year ended 31 December 2006
 Consolidated Financial Statements for the year ended 31 December 2006 1 Background (a) and its operations ( or the Group) is a regional utility generating electric power and heat and also providing
RUSHYDRO GROUP. Condensed Consolidated Interim Financial Information (Unaudited) prepared in accordance with IAS 34
 prepared in accordance with IAS 34") RUSHYDRO GROUP Condensed Consolidated Interim Financial Information (Unaudited) prepared in accordance with IAS 34 As at and for the three and six months ended 2018 CONTENTS REPORT ON REVIEW Condensed
RUSHYDRO GROUP Condensed Consolidated Interim Financial Information (Unaudited) prepared in accordance with IAS 34 As at and for the three and six months ended 2018 CONTENTS REPORT ON REVIEW Condensed
Corrections of Annual Report 2011 (Year ended March 31, 2011)
") (Year ended March 31, 2011) MEITEC CORPORATION (the Company ) submitted corrections pertaining to errors on certain items of its annual securities report for the year ended March 31, 2011 on November 8,
(Year ended March 31, 2011) MEITEC CORPORATION (the Company ) submitted corrections pertaining to errors on certain items of its annual securities report for the year ended March 31, 2011 on November 8,
Interregional Distribution Grid (IDG) Company of North-West
 Company of North-West") Interregional Distribution Grid (IDG) Company of North-West Consolidated Interim Condensed Financial Statements for the nine months ended 30 September 2015 (Unaudited) Contents CONSOLIDATED CONDENSED STATEMENT
Interregional Distribution Grid (IDG) Company of North-West Consolidated Interim Condensed Financial Statements for the nine months ended 30 September 2015 (Unaudited) Contents CONSOLIDATED CONDENSED STATEMENT
DANA HOLDING CORPORATION Quarterly Financial Information and Reconciliations of Non-GAAP Financial Measures
 Quarterly Financial Information and Reconciliations of Non-GAAP Financial Measures Non-GAAP Financial Measures Adjusted EBITDA is a non-gaap financial measure which we have defined as earnings from continuing
OTAGONET JOINT VENTURE LINES BUSINESS STATEMENT OF FINANCIAL PERFORMANCE FOR THE YEAR ENDED 31 MARCH 2005
 OTAGONET JOINT VENTURE LINES BUSINESS STATEMENT OF FINANCIAL PERFORMANCE FOR THE YEAR ENDED 31 MARCH 2005 Note 31 March 2005 31 March 2004 Operating Revenue (1) 13,559 13,524 Operating Expenses (2) (10,809)
TGC-1 9M 2016 IFRS Results. November 21, 2016 Saint Petersburg
 TGC-1 9M 2016 IFRS Results November 21, 2016 Saint Petersburg Disclaimer The information contained herein has been prepared using information available to Public Joint Stock Company Territorial generating
ST IFRS Consolidated Financial Statements Document Preview
 2642 2018 1ST IFRS Consolidated Financial Statements Document Preview Unit: NT$ thousand Accounting Title 2018/03/31 2017/12/31 2017/03/31 Balance Sheet Assets Current assets Description of type of hedge
November 8, 2016 CONSOLIDATED FINANCIAL RESULTS for the First Six Months of the Fiscal Year Ending March 31, 2017 <under Japanese GAAP>
 Translation Notice: This English version is a translation of the original Japanese document and is only for reference purposes. In the case where any differences occur between the English version and the
Financial Results For the Fiscal Year 2016 ending January 31, 2016
 Financial Results For the Fiscal Year 2016 ending January 31, 2016 March 16, 2016 Balance Sheets (Consolidated) Thousands of Yen 31 Jan., 2016 Assets Current assets: Cash & Cash equivalents 1,984,469 Accounts
AS Silvano Fashion Group
 AS Silvano Fashion Group Consolidated Interim Financial Report for Q2 and 6 months of 2017 (unaudited) (translation of the Estonian original)* Beginning of the reporting period 1 January 2017 End of the
September 30 September ASSETS Amount % Amount % LIABILITIES AND STOCKHOLDERS EQUITY Amount % Amount %
 CHINA STEEL CORPORATION BALANCE SHEETS (In Thousands of New Taiwan Dollars, Except Par Value) (Reviewed, Not Audited) September 30 September 30 ASSETS Amount % Amount % LIABILITIES AND STOCKHOLDERS EQUITY
FAR EASTERN NEW CENTURY CORPORATION AND SUBSIDIARIES
 CONSOLIDATED BALANCE SHEETS (In Thousands of New Taiwan Dollars) June 30, 2015 (Reviewed) December 31, (Audited after Restated) June 30, January 1, (Audited after Restated) ASSETS Amount % Amount % Amount
Semi-annual financial information 2006
 Semi-annual financial information 2006 Kuraray Co., Ltd CONSOLIDATED BALANCE SHEETS Thousands of U.S. dollars March 31, 2004 ASSETS Current assets: Cash and cash equivalents 11,523 16,743 12,584 $101,973
Novorossiysk Commercial Sea Port. Consolidated Financial Information For the Nine Months Ended 30 September 2018
 Novorossiysk Commercial Sea Port Consolidated Financial Information For the Nine Months Ended INTERIM CONDENSED CONSOLIDATED STATEMENT OF COMPREHENSIVE INCOME (in thousands of US Dollars, except for earnings
Taxes. Financial Statements: Things to Keep in Mind. Cash Flow and Taxes. BUSI 7110/7116 Yost
 Cash Flow and Taxes Financial Statements: Things to Keep in Mind Backward vs. Forward Looking Book Values vs. Market Values Accounting Numbers vs. Cash Flows Tax Deductible vs. Taxable Notes to Financial
Globaltrans Investment PLC. Condensed consolidated interim financial information (unaudited) for the six months ended 30 June 2018
 for the six months ended 30 June 2018") Condensed consolidated interim financial information (unaudited) for the six months ended 30 June 2018 Contents Condensed consolidated interim financial information (unaudited) for the six months ended
Condensed consolidated interim financial information (unaudited) for the six months ended 30 June 2018 Contents Condensed consolidated interim financial information (unaudited) for the six months ended
KCE Electronics Public Company Limited and its subsidiaries
 Statements of financial position Consolidated financial Separate financial 31 December 31 December 31 December 31 December Assets Note 2014 2013 2014 2013 Current assets Cash and cash equivalents 7 463,016,990
MOSENERGO. Investor Presentation
 MOSENERGO Investor Presentation March, 207 Disclaimer The information contained herein has been prepared using information available to JSC Mosenergo (hereinafter - Mosenergo or the Company) at the time
NOT FOR RELEASE, PUBLICATION OR DISTRIBUTION IN THE UNITED STATES, AUSTRALIA, CANADA OR JAPAN
 PRESS RELEASE ROSINTER INCREASED REVENUE AND EBITDA BY 7.3% IN FINANCIAL STATEMENTS FOR 1H 2018 PREPARED IN ACCORDANCE WITH IFRS Moscow, August 29, 2018: PJSC Rosinter Restaurants Holding (Rosinter, Rosinter
November 7, 2017 CONSOLIDATED FINANCIAL RESULTS for the First Six Months of the Fiscal Year Ending March 31, 2018 <under Japanese GAAP>
 Translation Notice: This English version is a translation of the original Japanese document and is only for reference purposes. In the case where any differences occur between the English version and the
ACER INCORPORATED Non-Consolidated Balance Sheets September 30, 2005 and 2004 (Expressed in thousands of New Taiwan dollars) Unaudited
 Unaudited") Non-Consolidated Balance Sheets September 30, 2005 and 2004 Assets 2005.9.30 2004.9.30 Current assets: Cash and cash equivalents 10,331,478 2,619,008 Short-term investments 2,464,748 3,313,834 Notes and
Non-Consolidated Balance Sheets September 30, 2005 and 2004 Assets 2005.9.30 2004.9.30 Current assets: Cash and cash equivalents 10,331,478 2,619,008 Short-term investments 2,464,748 3,313,834 Notes and
ACER INCORPORATED Non-Consolidated Balance Sheets December 31, 2005 and 2004 (Expressed in thousands of New Taiwan dollars)
") Non-Consolidated Balance Sheets December 31, 2005 and 2004 Assets 2005.12.31 2004.12.31 Current assets: Cash and cash equivalents 10,918,662 1,683,755 Short-term investments 3,726,081 9,453,202 Notes and
Non-Consolidated Balance Sheets December 31, 2005 and 2004 Assets 2005.12.31 2004.12.31 Current assets: Cash and cash equivalents 10,918,662 1,683,755 Short-term investments 3,726,081 9,453,202 Notes and
Consolidated Balance Sheets
 Consolidated Balance Sheets March 31 2015 2016 2016 Assets: Current assets Cash and cash equivalents 726,888 600,897 $ 5,317,673 Marketable securities 19,033 28,012 247,894 Notes and accounts receivable:
Digital River, Inc. Second Quarter Results (Unaudited, in thousands) Subject to reclassification
 Subject to reclassification") (Unaudited, in thousands) Condensed Consolidated Balance Sheets As of December 31, 2008 2007 Assets: Current assets Cash and cash equivalents $ 276,927 $ 381,788 Short-term investments 201,297 315,636
(Unaudited, in thousands) Condensed Consolidated Balance Sheets As of December 31, 2008 2007 Assets: Current assets Cash and cash equivalents $ 276,927 $ 381,788 Short-term investments 201,297 315,636
Marel Food Systems hf. Consolidated Financial Statements for the year 2009
 Marel Food Systems hf. Consolidated Financial Statements for the year 2009 Index Pages Consolidated Statement of Comprehensive Income... 1 Consolidated Statement of Financial Position... 2 Consolidated
ROYAL EXCHANGE PLC. Total Assets 22,259,117 26,013,462 8,870,960 8,793,967
 UNAUDITED CONSOLIDATED STATEMENTS OF FINANCIAL POSITION for the Quarter ended 31 March 2015 Note 31-Mar-15 31-Dec-14 31-Mar-15 31-Dec-14 ASSETS Cash and cash equivalents 5 2,057,451 6,622,345 18,035 36,411
Selected Financial Data Five Years Ended December 30, 2006
 Selected Financial Data Five Years Ended December 30, 2006 Net Gross Research & Operating Net (In Millions) Revenue Margin Development Income Income 2006 $ 35,382 $ 18,218 $ 5,873 $ 5,652 $ 5,044 2005
CONSOLIDATED BALANCE SHEET
 CONSOLIDATED BALANCE SHEET December 31, 2018 A S S E T S CURRENT ASSETS: Cash and time deposits 51,215 Accounts receivable-trade 95,065 Inventories 5,405 Short-term loans receivable 43,021 Deferred tax
CommScope Holding Company, Inc. Condensed Consolidated Statements of Operations (Unaudited -- In thousands, except per share amounts)
") Condensed Consolidated Statements of Operations (Unaudited -- In thousands, except per share amounts) Three Months Ended March 31, 2018 2017 Net sales $ 1,120,517 $ 1,137,285 Operating costs and expenses:
Condensed Consolidated Statements of Operations (Unaudited -- In thousands, except per share amounts) Three Months Ended March 31, 2018 2017 Net sales $ 1,120,517 $ 1,137,285 Operating costs and expenses:
ITURAN LOCATION AND CONTROL LTD. Consolidated Interim Financial Statements as of March 31, 2014
 Consolidated Interim Financial Statements as of March 31, 2014 Consolidated Financial Statements as of March 31, 2014 Table of Contents Page Consolidated Financial Statements: Balance Sheets 2-3 Statements
1. Financial Highlights 1 2. Consolidated Balance Sheets 2 3. Consolidated Statements of Income and
 June 14, 2012 CONTENTS Page 1. Financial Highlights 1 2. Consolidated Balance Sheets 2 3. Consolidated Statements of Income and Consolidated Statements of Comprehensive Income 4 4. Consolidated Statements
2017Q3 Financial Results
 2017Q3 Financial Results Operating revenues in 2017Q3 were NT$578,957 thousand, a QoQ growth of 19 and a YoY growth of 2 versus same period last year. Summary Financial Results for the Third Quarter of
ITURAN LOCATION AND CONTROL LTD. Consolidated Interim Financial Statements as of March 31, 2013
 Consolidated Interim Financial Statements as of March 31, 2013 Consolidated Financial Statements as of March 31, 2013 Table of Contents Page Consolidated Financial Statements: Balance Sheets 2-3 Statements
FINANCIAL STATEMENTS OF TRADING COMPANIES
 FINANCIAL STATEMENTS OF TRADING COMPANIES QUESTION ONE The trial balance of Beta Limited as at 31 st December, 2016 is as follows: Dr Cr GH GH Sales and Purchases 20,000 50,000 Inventory 8,000 Distribution
OGK-1 GROUP Interim consolidated financial statements Prepared in accordance with International financial reporting standards (IFRS)
") Interim consolidated financial statements Prepared in accordance with International financial reporting standards (IFRS) For the six months ended 30 June 2011 (unaudited) Interim consolidated financial
Interim consolidated financial statements Prepared in accordance with International financial reporting standards (IFRS) For the six months ended 30 June 2011 (unaudited) Interim consolidated financial
F2 Revisions. Raising Finance. Long Term Financing. Term loans. Rights issue of shares. New issue of shares. Conventional bonds
 F2 Revisions Raising Finance Long Term Financing Equity Debt Rights issue of shares New issue of shares Initial public offering (IPO) or stock market launch Placement (non-public offering) Term loans Conventional
MOSENERGO Presentation of 1q 2010 IFRS Results
 MOSENERGO Presentation of 1q 2010 IFRS Results June 15, 2010 Disclaimer The information contained herein has been prepared using information available to Mosenergo at the time of preparation of the presentation.
Cash and cash equivalents 8, 9 1,199,381,498 2,131,096, ,435,381 1,870,320,961
 Statements of financial position As at 31 December 2011 and 2010 Note 2011 2010 2011 2010 Assets Current assets Cash and cash equivalents 8, 9 1,199,381,498 2,131,096,112 883,435,381 1,870,320,961 Trade
Public Joint Stock Company Long-Distance and International Telecommunications Rostelecom and its subsidiaries
 Report on Review of Interim Financial Information Public Joint Stock Company Long-Distance and International Telecommunications Rostelecom and its subsidiaries for the six-month period ended 30 June 2017