Lloyd Lynford CEO Reis, Inc.
|
|
|
- Lily Douglas
- 5 years ago
- Views:
Transcription

1 Presented by: Lloyd Lynford CEO Reis, Inc. Presented at: 28 TH Annual ROTH Conference Dana Point, CA March 15, 2016
2 DRAFT Disclaimer This presentation may include forward looking statements which involve a number of risks and uncertainties that could cause actual results to differ materially from those described or implied in those forward looking statements. These statements are based on currently available information and current management outlook or expectations. In addition, we do not plan to update any forward looking statements to reflect subsequent events or circumstances or if our expectations change. For more information relating to the risks and uncertainties involved in our forward looking statements and Reis generally, please see the Risk Factors and Cautionary Statement Regarding Forward Looking Statements sections of our recent filing with the SEC, including our 2015 Annual Report on Form 10 K filed on March 3,

3 DRAFT Executive Summary Reis is a leading provider of U.S. commercial real estate ( CRE ) market and transaction support information. Unique Proprietary Databases Diversified Customer Base Significant Growth Opportunities Subscription Business Model Attractive Financial Profile Compelling Industry Dynamics Strong Platform to Execute Growth Strategy 3
4 4 4

5 5

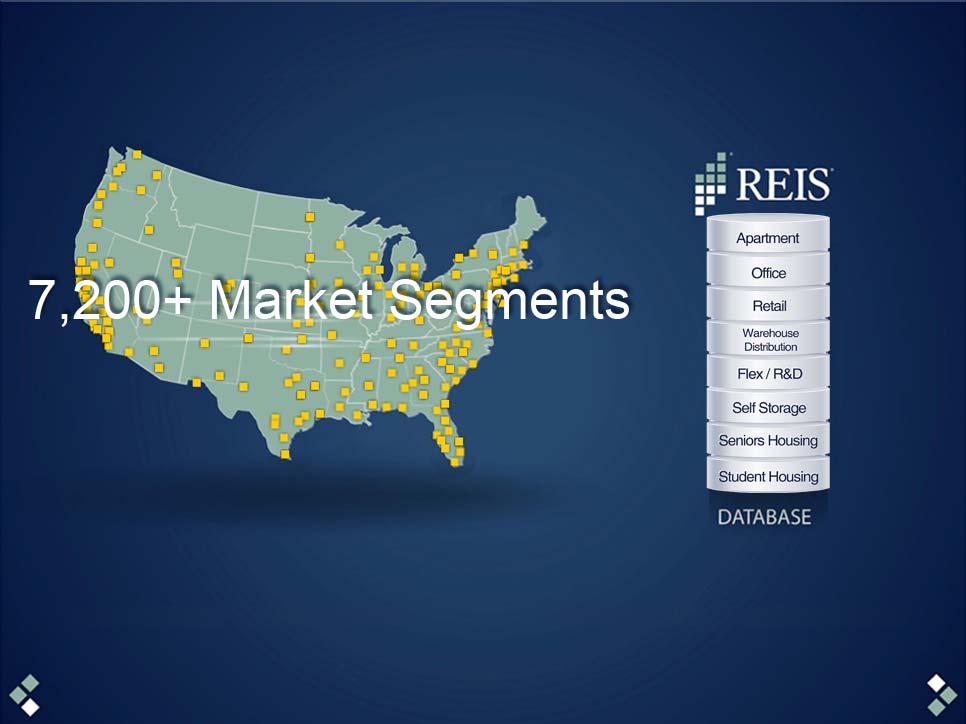
6 DRAFT Executive Summary Subscription based business model with high revenue visibility, significant cash generation and substantial growth potential. Delivers proprietary CRE market information and analytics. Unrivaled depth of proprietary data on over 7,200 market areas and segments. 36 year history of data collection and aggregation; difficult to replicate. Blue chip client base across wide spectrum of CRE and financial sectors. Outstanding platform to capture logically adjacent opportunities (space leasing and marketplace sectors). 6


7 Products DESCRIPTION Primary delivery platform Data on rents, vacancy rates, absorption, lease terms, property sales and new construction activity Market based trends, comparable properties, valuation and credit analysis Repurposes Reis SE market data to prosumers and smaller businesses Provides subset of information available to Reis SE subscribers Property and loan level analyses of cash flows, collateral values and default risk Property valuation, credit analysis, recurring stress testing and benchmarking CUSTOMERS Property owners, developers, managers, banks and nonbank lenders, equity investors and service providers Smaller enterprises and individuals, professional investors, brokers, appraisers and other service providers Available to new and existing customers as an add on to Reis SE Banks and lending institutions seeking CRE risk Management tools CMBS and equity investors PRICING / CONTRACT Annual and multi year subscriptions ($1,000 $1 million+) with an average of approximately $43,000 Prices of individual reports typically range up to $999 Monthly subscriptions in the low hundreds of dollars Annual subscriptions are also available Varies by client and usage Annual and multi year subscriptions Low tens of thousands of dollars into the hundreds of thousand of dollars per year 7
8 Key Databases Property Data Physical Attributes Geocoding Performance Data Up to 36 year Time Series New Construction Planned Proposed Under Construction Sales Comps 277 Markets 14 year history Cap Rate Trends $250K+ Transactions Trends 275 Markets 7,200+ Submarkets/Segments Up to 36 year Time Series Forecasts 5 year Forecasts 275 Markets and Thousands of Submarkets Property Type Markets Apartment 275 Office 190 Retail 190 Warehouse/Distribution 47 Flex/R&D 47 Self Storage 50 Seniors Housing 110 Student Housing 200 Totals 1,109 8

9 Curated Databases Curated databases for CRE professionals Reis s databases are carefully constructed and maintained. Competitive inventories are coded and sub property types are defined. Historical property level performance data is archived at the record level. Consistent samples ensure disciplined market trends. Not repositories of land use records of low value to CRE professionals. Only precisely designed and populated databases will succeed in the emerging analytics marketplace... 9
 List processing of brokerage feeds Websites and internet")
10 Data Collection Thousands of sources are accessed on an ongoing basis. Primary Research Methodologies Proprietary lists of brokers, managers and owners Individual telephonic surveys (1M+ calls placed annually) List processing of brokerage feeds Websites and internet searches Extensive database of market sources must be maintained Other Research Sources Utilized Planning and Zoning Boards Public Records (Deed recorders and Tax assessors) Building Directories Business and Trade Press Visiting selected markets 10


11 Premier Brand Name Reis is a trusted source for many of the nation s most well respected news organizations. 11

12 12
13 Reis SE Product Overview Product Overview Reis Subscriber Edition (Reis SE) is our primary web based delivery platform for market and property level reports. Reis SE currently has approximately 1,000 enterprise subscribers. The average annual subscription fee is approximately $43,000. Annual and multi year subscriptions range from $1K to $1M+ depending on anticipated usage and what the subscriber is entitled to. The product can be entitled at the user or account level to support customized access by selected markets, property and report types and analytical modules. 13
14 Reis SE Report Types Report Types Market and Submarket Reports: Provide trends and forecasts on critical performance criteria such as rent, vacancy, inventory, class cuts and eco/demo variables at the metro and submarket levels. Rent Comparables: Property level performance data such as rents and vacancies, as well as comp group summary statistics and geocode mapping. Sales Transactions: Timely tracking of sales transactions (including Hotels) along with buyer, seller, price and pro forma cap rates in over 277 metropolitan areas. New Construction: Tracking of all planned, proposed, and under construction projects as well as lease up velocity for newly completed construction. Executive Briefing Reports: Instantly translate key conclusions from Reis data and charts into a straightforward narrative that takes the form of an analyst s report. 14


15 Reis SE Key Features Key Features Single Property Valuation: Automated Valuation model (AVM) utilizes three valuation methods discounted cash flow, direct capitalization and sales price per square foot. Transaction Analytics: CRE capital market trends, including market level trend information on buyers, sellers, transaction prices and cap rates. Property Sales Real Estate News and Commentary: Executive Briefings, the Reis Observer and news stories selected by Reis analysts. Alerts: Customizable alerts that let users receive proactive updates on changing market conditions, transactions of interest and new construction projects. Translation into Six Languages: Reis SE is available in six languages to assist our many non U.S. clients as their non English speaking employees work with Reis data. Languages include: Chinese, French, German, Japanese, Russian and Spanish. 15

16 Client Composition 52% Debt Banks Non Bank Lenders Investment Banks and Conduits Insurance Companies Government As of December 31, 2015: Approximately 1,000 Reis SEsubscribers Overall TTM renewal rate = 88% 86% Capital Providers 14% Service Providers 34% Equity Developers Real Estate Investment Trusts Investment Managers Opportunity Funds Pension Funds Private Investors Service Providers Appraisers Brokers Accountants Consultants Academia Government Note: Percentages in chart based on an analysis of Reis customers at December 31,
17 Growth Opportunities Content Expansion Apartment Expansion Feb 2016 Next Asset Class: Affordable Housing (2016) Medical Office (2017) Potential additions: Data Centers Hotel Land Sales Comps Expansion Greater granularity in existing sectors International markets Analytical Tools CRE Portfolio monitoring CRE backed Securities: REITs CMBS Reis timates summary values for millions of CRE properties Distribution Channels ReisReports Data redistribution Custom data/feeds Acquisitions Regional data vendors (roll up strategy) Software providers: Property Mgmt. Cash flow Budgeting Valuation Appraisers 17
18 Financial Performance 18

19 Historical Reis Services Performance Fiscal Years 2006 to 2015 (in millions) $55 $50 $45 $40 $35 $30 $25 $20 $15 $10 $5 $ % % % 44.9% 39.3% 39.9% 40.9% % 40.8% EBITDA Revenue Margin % % 90% 80% 70% 60% 50% 40% 30% 20% 10% 0% Note: Results relate to the Reis Services segment. Please see Reis s SEC filings for information relating to Reis s consolidated results. 19
20 Financial Performance Metrics Reis Services Segment Fourth Quarter For the Years Ended December 31, ($ in thousands) (Unaudited) Reis Services: Increase Increase (1) Revenue $ 14,206 $ 10,726 $ 3, % $ 50,890 $ 41,335 $ 9, % EBITDA $ 6,477 $ 4,410 $ 2, % $ 22,074 $ 16,852 $ 5, % EBITDA Margin 45.6% 41.1% 43.4% 40.8% (1) Growth rates and margins during the year ended December 31, 2015 were influenced by revenue recognized during the year related to separate contracts for custom portfolio and advisory services for a major financial services firm in the U.S. Revenue and EBITDA in the period were positively impacted by incremental revenue, as more fully described in our Form 10 K and earnings press release issued on March 3, On a pro forma basis, the revenue growth rate was 14.9% and the Reis Services EBITDA growth rate was 17.3% for the year ended December 31, Note: EBITDA and Adjusted EBITDA are non GAAP measures that senior management of Reis uses to measure operational and management performance, and may be appropriate for investors to use as a supplement to reported GAAP basis financial information for the Reis Services segment and on a consolidated basis. Please see our December 31, 2015 Annual Report on Form 10 K, filed with the SEC on March 3, 2016, for cautionary language about the use of EBITDA and Adjusted EBITDA and reconciliations of income from continuing operations to EBITDA and Adjusted EBITDA for the Reis Services segment and on a consolidated basis. 20
21 Financial Performance Metrics Consolidated Fourth Quarter For the Years Ended December 31, ($ in thousands) (Unaudited) Increase Increase (1) Consolidated, excluding discontinued operations: Revenue $ 14,206 $ 10,726 $ 3, % $ 50,890 $ 41,335 $ 9, % Adjusted EBITDA $ 5,929 $ 3,889 $ 2, % $ 19,481 $ 14,325 $ 5, % Adjusted EBITDA Margin 41.7% 36.3% 38.3% 34.7% (1) Growth rates and margins during the year ended December 31, 2015 were influenced by revenue recognized during the year related to separate contracts for custom portfolio and advisory services for a major financial services firm in the U.S. Revenue and Adjusted EBITDA in the period were positively impacted by incremental revenue, as more fully described in our Form 10 K and earnings press release issued on March 3, On a pro forma basis, the revenue growth rate was 14.9% and the consolidated Adjusted EBITDA growth rate was 20.6% for the year ended December 31, Note: EBITDA and Adjusted EBITDA are non GAAP measures that senior management of Reis uses to measure operational and management performance, and may be appropriate for investors to use as a supplement to reported GAAP basis financial information for the Reis Services segment and on a consolidated basis. Please see our December 31, 2015 Annual Report on Form 10 K, filed with the SEC on March 3, 2016, for cautionary language about the use of EBITDA and Adjusted EBITDA and reconciliations of income from continuing operations to EBITDA and Adjusted EBITDA for the Reis Services segment and on a consolidated basis. 21
22 (In thousands) Condensed Balance Sheet Data Consolidated Balance Sheets December 31, 2015 December 31, 2014 Assets Cash $ 28,658 $ 17,745 Accounts Receivable, Net 13,741 12,627 Prepaid and Other Current and Non Current Assets 1,858 1,573 Goodwill and Intangible Assets Deferred Tax Assets, Net 70,512 18,430 69,506 22,437 Total Assets $ 133,199 $ 123,888 Liabilities and Stockholders Equity Debt (A) $ $ Deferred Revenue (B) 25,291 22,885 Other Liabilities 6,329 4,890 Total Liabilities 31,620 27,775 Stockholders Equity 101,579 96,113 Total Liabilities and Stockholder s Equity Common Shares Outstanding $ 133,199 11,256 $ 123,888 11,157 (A) (B) The Company previously had a $10 million credit revolving facility with an interest at a rate of LIBOR % per annum, which was set to expire on October 16, 2015; however, the expiration dates were extended to January 31, On January 28, 2016, the Company entered into a new three year agreement to renew and expand the revolving credit facility to $20 million, with terms substantially similar to the previous agreement and with an expiration date on January 28, Aggregate Revenue Under Contract (which is deferred revenue, plus future revenue under non cancellable contracts for which we do not have the contractual right to bill) aggregated $48,014 and $45,402 at December 31, 2015 and December 31, 2014, respectively. At December 31, 2015, $33,822 relates to amounts under contract that will turn into revenue in the forward twelve month period through December 31, Please see our December 31, 2015 Annual Report on Form 10 K, filed with the SEC on March 3, 2016, for reconciliations to the most comparable GAAP financial measure. 22
23 DRAFT Investor Highlights Executive Summary Unique Proprietary Databases: Continuing development of three curated databases with a 36 year history of data. Growth Opportunities: The addition of new property types, the introduction of narrative reports at the property level and the expansion of our sales comparables database will drive growth in 2016 and beyond. Excellent Revenue Visibility: Recurring revenue, digital delivery, subscription model (not ad based). Strong Business Fundamentals: Our high renewal rates, enviable EBITDA margins and cost structure fuel significant cash flow creation. Predictable Dividend: Commenced a quarterly dividend program in May 2014 at $0.11 per common share which was increased 27.3% in the first quarter of 2015 to $0.14 per common share and then further increased by 21.4% in the first quarter of 2016 to $0.17 per common share. Significant Management Focus: Management and board members own approximately 23% of the Company. 23
24 Reis, Inc. 530 Fifth Avenue, 5th Floor New York, NY (212) Lloyd Lynford, CEO Mark P. Cantaluppi, CFO
Presented by: Presented at: Lloyd Lynford CEO Reis, Inc. Canaccord Genuity Growth Conference 2015 Boston, MA August 12, 2015
 Presented by: Lloyd Lynford CEO Reis, Inc. Presented at: Canaccord Genuity Growth Conference 2015 Boston, MA August 12, 2015 DRAFT Disclaimer This presentation may include forward looking statements which
Presented at: B. Riley & Co. s 17 th Annual Investor Conference Los Angeles, California May 25, 2016
 Presented by: Lloyd Lynford, CEO Mark P. Cantaluppi, CFO Reis, Inc. Presented at: B. Riley & Co. s 17 th Annual Investor Conference Los Angeles, California May 25, 2016 DRAFT Disclaimer This presentation
Presented by: Lloyd Lynford CEO Reis, Inc. Presented at: B. Riley & Co. 15 th Annual Investor Conference Santa Monica, CA May 20, 2014
 Presented by: Lloyd Lynford CEO Reis, Inc. Presented at: B. Riley & Co. 15 th Annual Investor Conference Santa Monica, CA May 20, 2014 DRAFT Disclaimer This presentation may include forward-looking statements
Presented by: Mark P. Cantaluppi, CFO Reis, Inc. Canaccord Genuity 37 th Annual Growth Conference Boston, MA August 9, 2017
 Presented by: Mark P. Cantaluppi, CFO Reis, Inc. Canaccord Genuity 37 th Annual Growth Conference Boston, MA August 9, 2017 DRAFT Disclaimer This presentation may include forward-looking statements which
ServiceNow, Inc. Condensed Consolidated Statements of Operations (in thousands, except share and per share data)
") Condensed Consolidated Statements of Operations (in thousands, except share and per share data) December 31, 2015 December 31, 2014 December 31, 2015 December 31, 2014 Revenues: Subscription $ 244,702
Condensed Consolidated Statements of Operations (in thousands, except share and per share data) December 31, 2015 December 31, 2014 December 31, 2015 December 31, 2014 Revenues: Subscription $ 244,702
ServiceNow, Inc. Condensed Consolidated Statements of Operations (in thousands, except share and per share data) (unaudited)
 (unaudited)") Condensed Consolidated Statements of Operations (in thousands, except share and per share data) Revenues: Subscription $ 166,751 $ 104,878 $ 567,217 $ 349,804 Professional services and other 31,253 20,352
Condensed Consolidated Statements of Operations (in thousands, except share and per share data) Revenues: Subscription $ 166,751 $ 104,878 $ 567,217 $ 349,804 Professional services and other 31,253 20,352
CPI Card Group Inc. Reports Fourth Quarter and Full Year 2016 Results
 NEWS RELEASE CPI Card Group Inc. Reports Fourth Quarter and Full Year 2016 Results 3/1/2017 Q4 Net Sales of $67.4 million, Full Year 2016 Net Sales of $308.7 million Full Year Net Income from Continuing
Dealertrack Technologies Reports Record Revenue for Fourth Quarter and Full Year 2014
 Dealertrack Technologies Reports Record Revenue for Fourth Quarter and Full Year 2014 Page 1 MEDIA CONTACT: Alison von Puschendorf (877) 327-8422 x7366 alison.vonpuschendorf@dealertrack.com INVESTOR CONTACT:
ServiceNow, Inc. Condensed Consolidated Statements of Operations (in thousands, except share and per share data) (Unaudited)
 (Unaudited)") Condensed Consolidated Statements of Operations (in thousands, except share and per share data) Revenues: Subscription $ 179,907 $ 117,375 Professional services and other 32,057 21,715 Total revenues 211,964
Condensed Consolidated Statements of Operations (in thousands, except share and per share data) Revenues: Subscription $ 179,907 $ 117,375 Professional services and other 32,057 21,715 Total revenues 211,964
Paylocity Announces First Quarter Fiscal Year 2018 Financial Results
 November 2, 2017 Paylocity Announces First Quarter Fiscal Year 2018 Financial Results Q1 2018 Total Revenue of $81.5 million, up 25% year-over-year Q1 2018 Recurring Revenue of $78.9 million, up 26% year-over-year
ServiceNow, Inc. Condensed Consolidated Statements of Operations (in thousands, except share and per share data) (Unaudited)
 (Unaudited)") Condensed Consolidated Statements of Operations (in thousands, except share and per share data) September 30, 2016 September 30, 2015 September 30, 2016 September 30, 2015 Revenues: Subscription $ 318,934
Condensed Consolidated Statements of Operations (in thousands, except share and per share data) September 30, 2016 September 30, 2015 September 30, 2016 September 30, 2015 Revenues: Subscription $ 318,934
ASSETS As of March 31, 2014 (000's Except shares and per share amounts)
") Exhibit 99.3 UNAUDITED PRO FORMA CONDENSED CONSOLIDATED FINANCIAL STATEMENTS ASSETS As of March 31, 2014 (000's Except shares and per share amounts) GPS SecureAlert Global Adjustments Consolidated CURRENT
Exhibit 99.3 UNAUDITED PRO FORMA CONDENSED CONSOLIDATED FINANCIAL STATEMENTS ASSETS As of March 31, 2014 (000's Except shares and per share amounts) GPS SecureAlert Global Adjustments Consolidated CURRENT
Commercial Real Estate Services
 GROUP, GROUP, INC. INC. Global Global Market Market Leader Leader in in Integrated Integrated Commercial Real Estate Services JUNE 2016 NOVEMBER 2016 FORWARD-LOOKING STATEMENTS This presentation contains
Important Information for Investors and Stockholders
 March 1, 2010 Important Information for Investors and Stockholders This presentation does not constitute an offer to sell or the solicitation of an offer to buy any securities or a solicitation of any
HD Supply Holdings, Inc. Announces 2017 Second-Quarter Results and Reaffirms Full-Year Guidance
 Investor Contact: Charlotte McLaughlin HD Supply Investor Relations 770-852-9100 InvestorRelations@hdsupply.com Media Contact: Quiana Pinckney HD Supply Public Relations 770-852-9057 Quiana.Pinckney@hdsupply.com
Etsy, Inc. Reports Fourth Quarter and Full Year 2018 Financial Results
 NEWS RELEASE Etsy, Inc. Reports Fourth Quarter and Full Year 2018 Financial Results 2/25/2019 Strong Fourth Quarter Year-Over-Year GMS Growth of 22.3% and Growth of 46.8% Issues 2019 Financial Guidance
RADIANT LOGISTICS ANNOUNCES RESULTS FOR THE FOURTH FISCAL QUARTER AND YEAR ENDED JUNE 30, 2018
 RADIANT LOGISTICS ANNOUNCES RESULTS FOR THE FOURTH FISCAL QUARTER AND YEAR ENDED JUNE 30, 2018 Reports record quarterly results with revenues of $233.8 million, up $32.0 million or 15.9%; Net revenues
Social Reality Reports 1,014% Year-Over-Year Revenue Growth for Q3 2015
 marketwired.com http://www.marketwired.com/press-release/social-reality-reports-1014-year-over-year-revenue-growth-for-q3-2015-otcqb-scri- 2074098.htm Social Reality Reports 1,014% Year-Over-Year Revenue
Groupon Announces First Quarter 2015 Results
 May 5, 2015 Groupon Announces First Quarter 2015 Results Gross billings of $1.6 billion Revenue of $750.4 million Adjusted EBITDA of $72.4 million GAAP loss per share of $0.02; non-gaap earnings per share
Dealertrack Technologies Reports Third Quarter 2014 Financial Results
 November 5, 2014 Dealertrack Technologies Reports Third Quarter 2014 Financial Results Reports 87% Year over Year Revenue Growth Updates 2014 Revenue Guidance Based on Solid Third Quarter Performance and
Q2 Fiscal 2018 Earnings Presentation. July 26, 2018
 Q2 Fiscal 2018 Earnings Presentation July 26, 2018 FORWARD LOOKING STATEMENTS AND OTHER IMPORTANT CAUTIONS This presentation contains certain forward-looking statements within the meaning of the Private
For Immediate Release:
 For Immediate Release: FirstCash Reports Record Second Quarter Results; Announces 62 Store Acquisition in Mexico, Opens 16 New LatAm Stores; Completes Share Repurchases, Adds New $100 Million Repurchase
UNITED STATES SECURITIES AND EXCHANGE COMMISSION Washington, D.C FORM 8-K
 UNITED STATES SECURITIES AND EXCHANGE COMMISSION Washington, D.C. 20549 FORM 8-K Current Report Pursuant to Section 13 or 15(d) of the Securities Exchange Act of 1934 Date of Report (date of earliest event
AFFINION GROUP HOLDINGS, INC
 More information: Torrey Martin SVP, Communications and Corporate Development 203.956.8746 tmartin@affiniongroup.com AFFINION GROUP HOLDINGS, INC. ANNOUNCES RESULTS FOR THE FOURTH QUARTER AND YEAR ENDED
Lamar Advertising Company Announces Fourth Quarter and Year End 2015 Operating Results
 5321 Corporate Boulevard Baton Rouge, LA 70808 Lamar Advertising Company Announces Fourth Quarter and Year End 2015 Operating Results Three Month Results Net revenue increased 5.7% to $356.0 million Adjusted
Endurance International Group Reports 2017 Fourth Quarter and Full Year Results
 Endurance International Group Reports 2017 Fourth Quarter and Full Year Results Fiscal Year 2017 GAAP revenue of $1.177 billion Net loss of $99.8 million Adjusted EBITDA of $350.8 million Cash flow from
Performance Food Group Company Reports Third-Quarter Fiscal 2016 Results: Provides Full-Year Fiscal 2016 Adjusted EBITDA Growth Outlook of 10% to 12%
 NEWS RELEASE For Immediate Release May 4, 2016 Investors: Michael D. Neese VP, Investor Relations (804) 287-8126 michael.neese@pfgc.com Media: Joe Vagi Manager, Corporate Communications (804) 484-7737
ACQUISITION OF THOMSON REUTERS CORPORATE SERVICES DECEMBER 12, 2012
 ACQUISITION OF THOMSON REUTERS CORPORATE SERVICES DECEMBER 12, 2012 Cautionary Note Regarding Forward-Looking Statements Information set forth in this communication contains forward-looking statements
SUPPLEMENTAL FINANCIAL INFORMATION FOR THE SIX MONTH PERIODS ENDED SEPTEMBER 30, 2018 AND 2017
 SUPPLEMENTAL FINANCIAL INFORMATION FOR THE SIX MONTH PERIODS ENDED SEPTEMBER 30, 2018 AND 2017 November 1, 2018 The following presentation provides supplemental financial information for the six month
AFFINION GROUP HOLDINGS, INC. ANNOUNCES RESULTS FOR THE THIRD QUARTER ENDED SEPTEMBER 30, 2017 GLOBAL LOYALTY REVENUE INCREASES 36% YEAR OVER YEAR
 More information: Torrey Martin SVP, Communications and Corporate Development 203.956.8746 tmartin@affiniongroup.com ANNOUNCES RESULTS FOR THE THIRD QUARTER ENDED SEPTEMBER 30, 2017 GLOBAL LOYALTY REVENUE
Web.com Reports Fourth Quarter and Full Year 2017 Financial Results
 Web.com Reports Fourth Quarter and Full Year 2017 Financial Results Strong financial and operating performance in the fourth quarter Significant progress on strategic priorities for the year Generated
Web.com Reports Fourth Quarter and Full Year 2009 Financial Results
 Web.com Reports Fourth Quarter and Full Year 2009 Financial Results JACKSONVILLE, Fla., Feb. 9, 2010 (GLOBE NEWSWIRE) -- Web.com Group, Inc. (Nasdaq:WWWW), a leading provider of online marketing for small
Paylocity Announces Fourth Quarter and Fiscal Year 2018 Financial Results
 Paylocity Announces Fourth Quarter and Fiscal Year 2018 Financial Results August 9, 2018 Q4 2018 Total Revenue of $96.6 million, up 27% year-over-year FY 2018 Total Revenue of $377.5 million, up 26% year-over-year
NLSN 4Q and FY 2011 Investor Presentation
 NLSN 4Q and FY 2011 Investor Presentation Forward Looking Statements The following discussion contains forward-looking statements, including those about Nielsen s outlook and prospects, in the meaning
AFFINION GROUP HOLDINGS, INC. ANNOUNCES RESULTS FOR THE SECOND QUARTER ENDED JUNE 30, 2017 GLOBAL LOYALTY REVENUE INCREASES 39% YEAR OVER YEAR
 More information: Torrey Martin SVP, Communications and Corporate Development 203.956.8746 tmartin@affiniongroup.com AFFINION GROUP HOLDINGS, INC. ANNOUNCES RESULTS FOR THE SECOND QUARTER ENDED JUNE 30,
LPL Financial Announces Fourth Quarter and Full-Year 2010 Financial Results
 February 7, 2011 LPL Financial Announces Fourth Quarter and Full-Year Financial Results Record Levels of Advisory and Brokerage Assets Help Fuel Record Full Year Profitability Strong Net New Advisor Growth
Acquisition of Dealer Inspire and Launch Digital Marketing
 Acquisition of Dealer Inspire and Launch Digital Marketing Investor Presentation February 14, 2018 Forward Looking Statements This presentation contains forward looking statements within the meaning of
Groupon Announces Fourth Quarter and Fiscal Year 2013 Results
 February 20, 2014 Groupon Announces Fourth Quarter and Fiscal Year 2013 Results Fourth quarter gross billings of $1.6 billion, $5.8 billion for the full year Fourth quarter revenue of $768.4 million, $2.6
APX GROUP HOLDINGS, INC. REPORTS SECOND QUARTER 2015 RESULTS
 APX GROUP HOLDINGS, INC. REPORTS SECOND QUARTER 2015 RESULTS Second Quarter 2015 Financial and Portfolio Highlights Total Revenue of $157.9 Million, up 17.7% Year over Year Adjusted EBITDA 1 $93.4 Million,
Commercial Real Estate Services
 GROUP, GROUP, INC. INC. Global Global Market Market Leader Leader in in Integrated Integrated Commercial Real Estate Services JUNE 2016 JUNE 2016 FORWARD-LOOKING STATEMENTS This presentation contains statements
Colony NorthStar Credit Real Estate, Inc. Supplemental Financial Report First Quarter 2018 May 8, 2018
 Colony NorthStar Credit Real Estate, Inc. Supplemental Financial Report First Quarter 2018 May 8, 2018 Cautionary Statement Regarding Forward-Looking Statements This presentation may contain forward-looking
CarGurus Announces Third Quarter 2018 Results
 CarGurus Announces Third Quarter 2018 Results November 7, 2018 Third Quarter Highlights: Total revenue of $119.0 million, an increase of 43% year-over-year operating income of $3.6 million; non- operating
Q1 Fiscal 2018 Earnings Presentation. May 1, 2018
 Q1 Fiscal 2018 Earnings Presentation May 1, 2018 FORWARD LOOKING STATEMENTS AND OTHER IMPORTANT CAUTIONS This presentation contains certain forward-looking statements within the meaning of the Private
CPI Card Group Inc. Reports Fourth Quarter and Full Year 2015 Results
 CPI Card Group Inc. Reports Fourth Quarter and Full Year 2015 Results Fourth Quarter Net Sales of $93.6 million and Pro Forma Adjusted Diluted EPS of $0.16 Initiates Quarterly Dividend Announces 2016 Financial
CORELOGIC REPORTS FOURTH QUARTER AND FULL-YEAR 2015 FINANCIAL RESULTS Record Full-Year Revenues, Operating and Net Income, Free Cash Flow and EPS
 NEWS FOR IMMEDIATE RELEASE CORELOGIC REPORTS FOURTH QUARTER AND FULL-YEAR 2015 FINANCIAL RESULTS Record Full-Year Revenues, Operating and Net Income, Free Cash Flow and EPS Full-Year Highlights Revenues
AGILYSYS FISCAL 2019 SECOND QUARTER REVENUE RISES 14% TO RECORD $34.2 MILLION
 AGILYSYS FISCAL 2019 SECOND QUARTER REVENUE RISES 14% TO RECORD $34.2 MILLION Recurring Revenue Increases 10% to Record $18.9 Million, Inclusive of 27% Growth in SaaS Revenue Third Consecutive Quarter
Wix Reports Strong Third Quarter 2016 Results, Exceeding Expectations Leading to Significant Increase in Full Year Outlook
 Wix Reports Strong Third Quarter 2016 Results, Exceeding Expectations Leading to Significant Increase in Full Year Outlook Exceeded High End of Guidance Range with Strong Top-Line Growth and Record Adjusted
Snap Interactive Reports Results for the Quarter Ended June 30, 2015
 August 13, 2015 Snap Interactive Reports Results for the Quarter Ended June 30, 2015 NEW YORK, NY--(Marketwired - Aug 13, 2015) - Snap Interactive, Inc. ("SNAP," the "Company," "we," "our" or "us") (OTCQB:
Q4 & Full Year 2017 Earnings Presentation. February 13, 2018
 Q4 & Full Year 2017 Earnings Presentation February 13, 2018 FORWARD LOOKING STATEMENTS AND OTHER IMPORTANT CAUTIONS This presentation contains certain forward-looking statements within the meaning of the
APX Group Holdings, Inc.
 APX Group Holdings, Inc. Financial and Operating Highlights Fourth Quarter and Full Year 2013 Forward-Looking Statements This presentation contains forward looking statements, including but not limited
CDW Reports Third Quarter 2015 Results
 November 4, 2015 CDW Reports Third Quarter 2015 Results Record Third Quarter Net Sales, Adjusted EBITDA and Non-GAAP Net Income Per Share (Dollars in millions, except per share amounts) Three Months Ended
Bottomline Technologies Reports Fourth Quarter and Fiscal Year 2016 Results
 Bottomline Technologies Reports Fourth Quarter and Fiscal Year 2016 Results Strong Growth in Subscription and Transaction Revenue Highlights Fourth Quarter PORTSMOUTH, N.H. August 25, 2016 Bottomline Technologies
LPL Financial Announces Second Quarter 2018 Results
 Investor Relations - Chris Koegel, (617) 897-4574 For Immediate Release Media Relations - Jeff Mochal, (704) 733-3589 investor.lpl.com/contactus.cfm LPL Financial Announces Second Quarter 2018 Results
CBRE GROUP, INC. Global Market Leader in Integrated Commercial Real Estate Services
 CBRE GROUP, INC. Global Market Leader in Integrated Commercial Real Estate Services March 2016 FORWARD-LOOKING STATEMENTS This presentation contains statements that are forward looking within the meaning
HD Supply Holdings, Inc. Announces 2017 Third-Quarter Results, Raises Full-Year Guidance
 Investor Contact: Charlotte McLaughlin HD Supply Investor Relations 770-852-9100 InvestorRelations@hdsupply.com Media Contact: Quiana Pinckney, APR HD Supply Public Relations 770-852-9057 Quiana.Pinckney@hdsupply.com
ServiceNow, Inc. Condensed Consolidated Statements of Operations (in thousands, except share and per share data) (unaudited)
 (unaudited)") Condensed Consolidated Statements of Operations (in thousands, except share and per share data) December 31, 2017 December 31, 2016 December 31, 2017 December 31, 2016 Revenues: Subscription $ 497,232
Condensed Consolidated Statements of Operations (in thousands, except share and per share data) December 31, 2017 December 31, 2016 December 31, 2017 December 31, 2016 Revenues: Subscription $ 497,232
Web.com Reports Record Fourth Quarter and Full Year 2012 Financial Results
 February 7, 2013 Web.com Reports Record Fourth Quarter and Full Year 2012 Financial Results Fourth quarter revenue and profitability exceed high end of Web.com's guidance Successful integration of Network
IAC REPORTS Q4 RESULTS
 Page 1 of 20 IAC REPORTS Q4 RESULTS NEW YORK February 6, 2007 IAC (Nasdaq: IACI) released fourth quarter 2006 results today, reporting $1.8 billion in revenue, an 8% rate of growth over the prior year,
Blue Apron Holdings, Inc. Reports First Quarter 2018 Results
 Key Highlights: Blue Apron Holdings, Inc. Reports First Quarter 2018 Results Net revenue increased 5% sequentially from the fourth quarter of 2017 as Blue Apron methodically reaccelerated its marketing
HD Supply Holdings, Inc. Announces Fiscal 2016 Third-Quarter Results
 Investor Contact: Charlotte McLaughlin HD Supply Investor Relations 770-852-9100 InvestorRelations@hdsupply.com Media Contact: Quiana Pinckney, APR HD Supply Public Relations 770-852-9057 Quiana.Pinckney@hdsupply.com
Investor Contact: Charlotte McLaughlin HD Supply Investor Relations
 Investor Contact: Charlotte McLaughlin HD Supply Investor Relations 770-852-9100 InvestorRelations@hdsupply.com Media Contact: Quiana Pinckney, APR HD Supply Public Relations 770-852-9057 Quiana.Pinckney@hdsupply.com
ON SEMICONDUCTOR CORPORATION AND SUBSIDIARIES UNAUDITED CONSOLIDATED STATEMENT OF OPERATIONS (in millions, except per share data)
") UNAUDITED CONSOLIDATED STATEMENT OF OPERATIONS (in millions, except per share data) March 28, 2014 Quarter Ended December 31, 2013 March 29, 2013 Revenues $ 706.5 $ 718.0 $ 661.0 Cost of revenues 455.7
UNAUDITED CONSOLIDATED STATEMENT OF OPERATIONS (in millions, except per share data) March 28, 2014 Quarter Ended December 31, 2013 March 29, 2013 Revenues $ 706.5 $ 718.0 $ 661.0 Cost of revenues 455.7
AFFINION GROUP HOLDINGS, INC. ANNOUNCES RESULTS FOR THE FOURTH QUARTER AND YEAR ENDED DECEMBER 31, 2014 ACHIEVES FULL YEAR ADJUSTED EBITDA OF $281
 More information: Torrey Martin SVP, Communications and Corporate Development 203.956.8746 tmartin@affiniongroup.com AFFINION GROUP HOLDINGS, INC. ANNOUNCES RESULTS FOR THE FOURTH QUARTER AND YEAR ENDED
Blue Apron Holdings, Inc. Reports Third Quarter 2018 Results
 Key Highlights: Blue Apron Holdings, Inc. Reports Third Quarter 2018 Results Net loss improved 61% or $53.3 million year-over-year from $87.2 million to $33.9 million; adjusted EBITDA improved 61% or $29.2
Q1 FY2015 Earnings Presentation May 5, 2015
 Q1 FY2015 Earnings Presentation May 5, 2015 FORWARD LOOKING STATEMENTS AND OTHER IMPORTANT CAUTIONS Statements in this presentation which are not statements of historical fact, including but not limited
Builders FirstSource Reports Fourth Quarter and Full Year 2018 Results
 Builders FirstSource Reports Fourth Quarter and Full Year 2018 Results February 28, 2019 Disciplined execution and ongoing initiatives result in record profit, strong cash flow and significant debt reduction
COMPANY CONTACTS: Jay S. Hennick President & CEO (416)
") FOR: FIRSTSERVICE CORPORATION COMPANY CONTACTS: Jay S. Hennick President & CEO (416) 960-9500 John B. Friedrichsen Senior Vice President & CFO (416) 960-9500 FOR IMMEDIATE RELEASE FIRSTSERVICE REPORTS
FOR: FIRSTSERVICE CORPORATION COMPANY CONTACTS: Jay S. Hennick President & CEO (416) 960-9500 John B. Friedrichsen Senior Vice President & CFO (416) 960-9500 FOR IMMEDIATE RELEASE FIRSTSERVICE REPORTS
Investor Overview Presentation. July 26, 2018
 Investor Overview Presentation July 26, 2018 FORWARD LOOKING STATEMENTS AND OTHER IMPORTANT CAUTIONS This presentation contains certain forward-looking statements within the meaning of the Private Securities
Company Highlights: Financial Highlights: Exhibit 99.1
 Exhibit 99.1 Track Group, Inc. Reports Q1 FY2016 Quarterly Results Revenue Increases 37% Adjusted EBITDA margin improves Cash burn from operations decreases 82% Reaffirms FY2016 2017 Outlook SALT LAKE
Bottomline Technologies Reports Second Quarter Results
 Bottomline Technologies Reports Second Quarter Results Strong Growth in Subscription and Transaction Revenue Highlights Second Quarter PORTSMOUTH, N.H. February 1, 2017 Bottomline Technologies (NASDAQ:
Colliers International reports strong fourth quarter and full year results
 COMPANY CONTACTS: Jay S. Hennick Chairman & Chief Executive Officer John B. Friedrichsen Chief Financial Officer (416) 960-9500 FOR IMMEDIATE RELEASE Colliers International reports strong fourth quarter
Morningstar s monitoring services provide the following features:
 CMBS Products Morningstar Credit Ratings, LLC is a nationally recognized statistical rating organization, or NRSRO, that has earned a reputation for innovation and excellence. Morningstar s goal is to
More information: James Hart, (O) (M)
 (M)") More information: James Hart, 203.956.8746(O) 203.339.2578(M) AFFINION GROUP, INC. ANNOUNCES RESULTS FOR THE QUARTER ENDED SEPTEMBER 30, 2013 REPORTS $83.4 MILLION IN QUARTERLY ADJUSTED EBITDA ADJUSTED
More information: James Hart, 203.956.8746(O) 203.339.2578(M) AFFINION GROUP, INC. ANNOUNCES RESULTS FOR THE QUARTER ENDED SEPTEMBER 30, 2013 REPORTS $83.4 MILLION IN QUARTERLY ADJUSTED EBITDA ADJUSTED
Web.com Reports Fourth Quarter and Full Year 2016 Financial Results
 Web.com Group, Inc. 12808 Gran Bay Parkway West Jacksonville, FL 32258 T: (904) 680-6600 F: (904) 880-0350 NASDAQ: WEB Web.com Reports Fourth Quarter and Full Year 2016 Financial Results Solid progress
Supplemental Financial Report Second Quarter August 7, 2018
 Supplemental Financial Report Second Quarter 2018 August 7, 2018 1 CAUTIONARY STATEMENT REGARDING FORWARD-LOOKING STATEMENTS This presentation may contain forward-looking statements within the meaning
Investor Contact: Charlotte McLaughlin HD Supply Investor Relations
 Investor Contact: Charlotte McLaughlin HD Supply Investor Relations 770-852-9100 InvestorRelations@hdsupply.com Media Contact: Quiana Pinckney, APR HD Supply Public Relations 770-852-9057 Quiana.Pinckney@hdsupply.com
August 8, Conduent Q Earnings Results
 August 8, 2018 Conduent Q2 2018 Earnings Results Cautionary Statements Forward-Looking Statements This report contains forward-looking statements, as defined in the Private Securities Litigation Reform
More information: Torrey Martin SVP, Communications and Corporate Development
 More information: Torrey Martin SVP, Communications and Corporate Development 203.956.8746 tmartin@affiniongroup.com AFFINION GROUP, INC. ANNOUNCES RESULTS FOR THE SECOND QUARTER ENDED JUNE 30, AND UPDATES
AFFINION GROUP HOLDINGS, INC. ANNOUNCES RESULTS FOR THE THIRD QUARTER ENDED SEPTEMBER 30, 2015 REPORTS $75
 More information: Torrey Martin SVP, Communications and Corporate Development 203.956.8746 tmartin@affiniongroup.com AFFINION GROUP HOLDINGS, INC. ANNOUNCES RESULTS FOR THE THIRD QUARTER ENDED SEPTEMBER
More information: James Hart, (O) (M)
 (M)") More information: James Hart, 203.956.8746 (O) 203.339.2578 (M) AFFINION GROUP, INC. ANNOUNCES RESULTS FOR THE SECOND QUARTER ENDED JUNE 30, LOYALTY AND INTERNATIONAL APPROACHING HALF A BILLION IN LTM
More information: James Hart, 203.956.8746 (O) 203.339.2578 (M) AFFINION GROUP, INC. ANNOUNCES RESULTS FOR THE SECOND QUARTER ENDED JUNE 30, LOYALTY AND INTERNATIONAL APPROACHING HALF A BILLION IN LTM
Bottomline Technologies Reports Fourth Quarter Results
 Bottomline Technologies Reports Fourth Quarter Results 20% Growth in Subscription and Transaction Revenue Highlights Fourth Quarter PORTSMOUTH, N.H. August 9, 2018 Bottomline Technologies (NASDAQ:EPAY),
Endurance International Group Reports 2016 Third Quarter Results
 Endurance International Group Reports 2016 Third Quarter Results Revenue of $291.2 million Net loss of $(29.8) million Adjusted EBITDA of $85.2 million Cash flow from operations of $36.2 million Free cash
Sales $ 407,444 $ 396,064 $ 1,602,580 $ 1,515,608 Cost of sales (258,660) (242,460) (1,021,230) (952,221)
 (242,460) (1,021,230) (952,221)") CONSOLIDATED STATEMENTS OF INCOME (Unaudited) (Dollar amounts in thousands, except per share data) 2018 2017 2018 2017 Sales $ 407,444 $ 396,064 $ 1,602,580 $ 1,515,608 Cost of sales (258,660) (242,460)
CONSOLIDATED STATEMENTS OF INCOME (Unaudited) (Dollar amounts in thousands, except per share data) 2018 2017 2018 2017 Sales $ 407,444 $ 396,064 $ 1,602,580 $ 1,515,608 Cost of sales (258,660) (242,460)
Supplemental Financial Report Fourth Quarter February 28, 2019
 Supplemental Financial Report Fourth Quarter 2018 February 28, 2019 1 CAUTIONARY STATEMENT REGARDING FORWARD-LOOKING STATEMENTS This presentation may contain forward-looking statements within the meaning
December 4, Business Unit Performance. Facilities Maintenance
 HD Supply Holdings, Inc. Announces Fiscal Third-Quarter Results, Raises Full-Year Guidance Midpoint and Announces an Additional $500 million Share Repurchase Authorization December 4, ATLANTA, Dec. 04,
EARNINGS PRESENTATION Third Quarter 2018
 EARNINGS PRESENTATION Third Quarter 2018 DISCLAIMER 2 Discussion of Forward-Looking Statements by Newmark Group, Inc. and BGC Partners, Inc. Statements in this document regarding BGC and Newmark that are
SS&C Technologies Holdings, Inc. and Subsidiaries Condensed Consolidated Statements of Operations (in thousands, except per share data) (unaudited)
 (unaudited)") SS&C Technologies Holdings, Inc. and Subsidiaries Condensed Consolidated Statements of Operations (in thousands, except per share data) (unaudited) 2018 2017 Revenues: Software-enabled services $ 294,803
SS&C Technologies Holdings, Inc. and Subsidiaries Condensed Consolidated Statements of Operations (in thousands, except per share data) (unaudited) 2018 2017 Revenues: Software-enabled services $ 294,803
APX Group Holdings, Inc.
 APX Group Holdings, Inc. Financial and Operating Highlights Three and Nine Months ended September 30, 2013 Forward-Looking Statements This presentation contains forward looking statements, including but
Deutsche Bank 24 th Annual Media, Internet & Telcom Conference. March 8, 2016
 Deutsche Bank 24 th Annual Media, Internet & Telcom Conference March 8, 2016 Safe Harbor for Forward-Looking Statements Certain statements in this presentation are forward-looking statements within the
LPL Financial Announces Second Quarter 2017 Results
 Investor Relations - Chris Koegel, (617) 897-4574 For Immediate Release Media Relations - Jeff Mochal, (704) 733-3589 investor.lpl.com/contactus.cfm LPL Financial Announces Second Quarter 2017 Results
Endurance International Group Reports 2018 Second Quarter Results
 Endurance International Group Reports 2018 Second Quarter Results GAAP revenue of $287.8 million Net loss of $2.0 million Adjusted EBITDA of $85.0 million Cash flow from operations of $29.9 million Free
Weakening foreign currencies accounted for a reduction in emerging markets revenue of 4.9%.
 , Exhibit 99.1 Contact Evan Goad TransUnion E-mail investor.relations@transunion.com Telephone 312 985 2860 TransUnion Reports Fourth Quarter & Full Year 2012 Results CHICAGO, Feb. 25, 2013 TransUnion
ServiceNow, Inc. Condensed Consolidated Statements of Operations (in thousands, except share and per share data) (unaudited)
 (unaudited)") ServiceNow, Inc. Condensed Consolidated Statements of Operations (in thousands, except share and per share data) (unaudited) Revenues: Three Months Ended March 31, 2018 March 31, 2017 *As Adjusted Subscription
ServiceNow, Inc. Condensed Consolidated Statements of Operations (in thousands, except share and per share data) (unaudited) Revenues: Three Months Ended March 31, 2018 March 31, 2017 *As Adjusted Subscription
Management Discussion & Analysis of Financial Condition and Results of Operations
 Management Discussion & Analysis of Financial Condition and Results of Operations As of and for the nine months ended September 30, 2017 December 22, 2017-4- Consolidated Balance Sheet as at 30 September
APX GROUP HOLDINGS, INC. REPORTS 4 th QUARTER and FULL YEAR 2017 RESULTS. 4 th Quarter 2017 Highlights. Full Year 2017 Highlights
 APX GROUP HOLDINGS, INC. REPORTS 4 th QUARTER and FULL YEAR 2017 RESULTS 4 th Quarter 2017 Highlights Total revenues increased 15.3% year over year to $235.8 million Net loss of $135.4 million; $125.9
Credit Suisse Global Services Conference. February 25, 2008
 Credit Suisse Global Services Conference February 25, 2008 Safe Harbor Certain statements found in this document constitute forward-looking statements within the meaning of the Private Securities Litigation
Bottomline Technologies Reports Second Quarter Results
 Bottomline Technologies Reports Second Quarter Results Strong Growth in Subscription and Transaction Revenue Highlights Second Quarter PORTSMOUTH, N.H. February 1, 2018 Bottomline Technologies (NASDAQ:EPAY),
AFFINION GROUP HOLDINGS, INC. ANNOUNCES RESULTS FOR THE FOURTH QUARTER AND YEAR ENDED DECEMBER 31, 2015 ACHIEVES FULL YEAR ADJUSTED EBITDA OF $268
 More information: Torrey Martin SVP, Communications and Corporate Development 203.956.8746 tmartin@affiniongroup.com AFFINION GROUP HOLDINGS, INC. ANNOUNCES RESULTS FOR THE FOURTH QUARTER AND YEAR ENDED
MDC PARTNERS INC. REPORTS RESULTS FOR THE THREE AND NINE MONTHS ENDED SEPTEMBER 30, 2018
 FOR IMMEDIATE ISSUE FOR: MDC Partners Inc. CONTACT: Erica Bartsch 745 Fifth Avenue, 19 th Floor Sloane & Company New York, NY 10151 212-446-1875 IR@mdc-partners.com REPORTS RESULTS FOR THE THREE AND NINE
MERGE REPORTS THIRD QUARTER FINANCIAL RESULTS
 News Release Media Contact: Steven Tolle Chief Strategy Officer 312.946.2503 Steven.Tolle@merge.com MERGE REPORTS THIRD QUARTER FINANCIAL RESULTS Company delivers GAAP net income and doubles prior year