SALES AND RESULTS 1 st Half 2018
|
|
|
- Marianna Jodie Burns
- 5 years ago
- Views:
Transcription
1 SALES AND RESULTS 1 st Half 2018 July 26 th,
2 H Main Financial Aspects Revenue growth of +3.9% (+5.8% at constant exchange rates) reaching 785m (+ 30m) in the first six months of the year. In the like-for-like ("LFL") perimeter, excluding refurbishments and perimeter changes, revenue grew +2.9% (+5.3% at a constant exchange rate): - Strong performance in Benelux (+7.4%) and Italy (+5.7%). Spain (+2.7%) and Central Europe (+2.2%) affected by the holiday calendar and lower activity of congresses in Q2. - Latin America negatively affected by currency evolution (+11.9% at a constant exchange rates). Above-market relative RevPAR growth of +0.7 p.p. in the top cities due to a relative increase in ADR (+1.0 p.p.) and a slightly lower relative occupancy (-0.3 p.p.), supported by the improvement in perceived quality. Q2: revenue growth of +3.2% (+5.0% at constant exchange rates) amounting to 445m (+ 14m). In the reported LFL growth of +1.9%, the good performance of Benelux (+6.9%) and Italy (+3.2%) is remarkable. Central Europe (+0.5%) was affected by the fewer working days in May and Spain (+0.2%) felt the impact of the low flow of domestic customers to certain destinations during the May holidays and a relevant congress in June 2017 in Madrid. +2.2% increase in RevPAR in the first semester through a combined growth strategy of ADR (+1.3%; + 1.3) and occupancy (+0.8%). The growth in ADRs accounted for 62% of the increase in RevPAR. RevPAR growth in all markets except Latin America (negative currency impact), with the growth of Benelux (+7.7%) and Italy (+5.5%) standing out. Q2: +1.3% growth in RevPAR with a 70% contribution through prices (ADR +0.9%) and a nearly stable occupancy level (+0.4%). RevPAR growth in all markets except Spain (negative in Barcelona in May and in Madrid in June due to the 2017 congress) and Latin America (impact of the exchange rate). Revenue growth together with cost control allowed to close the semester with Recurring EBITDA (1) growth of +12% reaching 115m, an increase of + 12m and reaching a margin of 14.6% (+1.0 p.p.). The conversion ratio of incremental revenues into EBITDA is 40%. Excluding perimeter changes and refurbishments, the LFL conversion ratio reached 61%. Q2: +7.5% growth in EBITDA, implying an increase of + 7m up to 99m. EBITDA margin improved by +0.9 p.p. reaching 22.3%. Significant increase in Net Recurring Profit (+ 14.3m and higher than EBITDA growth) reaching 23.0m in the first half, explained by improved business and lower financial costs. Total Net Profit reached 64.3m, up by m compared to the first half of The comparison is positively affected by the higher contribution of net capital gains from asset rotation. Reduction in net financial debt to 229m ( 655m at 31 Dec. 2017), following the early redemption of the Convertible Bond ( 250m) in June 2018, the favourable operating cash flow generation and the contribution of the asset rotation activity. Rating upgrade in May: Moody s improved the Company's rating from B2 to B1 with a stable outlook, reflecting some excellent results, a significant improvement in indebtedness and greater liquidity. Moody's also confirmed the rating of the guaranteed senior bonds as Ba3. 2
3 Approved dividend: The gross dividend, approved at the AGM in June, regarding 2017 fiscal year and equivalent to 0.10 per outstanding share, will be paid on 27 th July, representing a disbursement of 39m. Minor International Group Tender Offer: Tender Offer authorization for 100% of NH shares: 10 th July. The transaction is conditioned to get the approval from Minor s EGM (August 9 th, 2018) and the authorizations in matters of competition. On July 20 th, Minor obtained authorization from the competition authorities of Spain and Portugal. Offer price: 6.40 per share, ( 6.30 after the dividend payment of 0.10 expected for 27 th July). The NH Board of Directors has hired financial and legal advisers and will issue an opinion report in due course, in accordance with market regulation Outlook The EBITDA (1) target of 260m and the reduction of the net financial debt ratio to x after the early redemption of the 250m convertible bond is maintained. (1) Recurring EBITDA before onerous reversal and capital gains from asset disposals Other Highlights Repositioning Plan: In the first half of 2018 the following hotels are affected by refurbishments: NHC Palacio de Castellanos, NH Málaga, NH Plaza de Armas, NH Balboa and NH Jolly Madison Towers in the BU of Spain. NHC Milano Porta Nuova, NH Pontevecchio and NHC Roma Centro in Italy. NH Schiphol in Benelux and NH Berlin Alexanderplatz, NHC Frankfurt City, NHC München Bavaria and NH Viena Airport, in Central Europe. The opportunity cost, defined as the reduction in revenue due to the refurbishments, was - 7.0m compared to H1 2017, mainly due to the refurbishments of hotels in New York, Italy and Germany. Brand: NH had 385 hotels and 59,682 rooms at 30 th June 2018, of which 78 hotels and 12,344 rooms are NH Collection (21% of the portfolio), showing in the first half of the year their potential both in terms of prices (+38% higher price; ADR NH Collection 123 vs ADR NH 89) and quality (with improvements also in non-refurbished hotels). NH Hotel Group focuses on quality measurement using new sources of information and surveys, thus significantly increasing both the volume of reviews and the evaluations received. 3
4 Pricing & Revenue Management: Higher growth of relative RevPAR of +0.7 p.p. in the main cities compared to its competitors, through a higher ADR (+1.0 p.p.) and a slightly lower relative occupancy (-0.3 p.p.): Remarkable growth in Italy with a relative RevPAR of +4.4 p.p. due to higher ADR and occupancy driven by the excellent performance of Rome. Good result in Benelux with a +1.2 p.p. increase in relative RevPAR. Central Europe: -0.2 p.p. variation in relative RevPAR with main cities showing a positive evolution, except for Dusseldorf where the location of our hotels depends more on trade fairs. Spain: Relative ADR increase of +0.6 p.p. Relative RevPAR affected by the superior performance achieved last year (+5 p.p.) in secondary destinations such as Seville and Valencia. H ADR % var. Relative ADR Relative Occupancy RevPAR % var. Relative RevPAR NH Compset Var. Var. NH Compset Var. Total NH 3.0% 2.0% 1.0 p.p p.p. 5.0% 4.3% 0.7 p.p. Spain -0.2% -0.8% 0.6 p.p p.p. 1.4% 2.5% -1.1 p.p. Italy 6.8% 3.3% 3.5 p.p. 0.8 p.p. 9.8% 5.3% 4.4 p.p. Benelux 6.1% 5.2% 0.8 p.p. 0.3 p.p. 10.0% 8.8% 1.2 p.p. Central Europe 0.7% 0.3% 0.4 p.p p.p. 1.1% 1.3% -0.2 p.p. Asset Rotation: In February 2018, the sale and leaseback of the NH Collection Amsterdam Barbizon Palace Hotel was recorded for a gross amount of 155.5m and an estimated net post-tax cash of c. 122m. Taxes will be paid during the course of On the other hand, 2 hotels were signed in the first half of 2018, 1 under management in La Habana with the NH Collection brand and 1 leased in Hannover under the NH brand, with a total of 120 rooms. 4
5 Q2 RevPAR Evolution: Note: The Like for Like plus Refurbishments (LFL&R) criteria includes hotels renovated in 2017 and 2018 NH HOTEL GROUP REVPAR Q2 2018/2017 AVERAGE ROOMS OCCUPANCY % ADR REVPAR % Var % Var % Var Spain & Others LFL & R 11,052 11, % 79.8% 0.3% % % Total B.U. Spain 11,746 11, % 79.7% -0.4% % % Italy LFL & R 7,156 7, % 75.7% 0.8% % % Total B.U. Italy 7,258 7, % 75.7% 0.3% % % Benelux LFL & R 8,214 8, % 75.3% 3.0% % % Total B.U. Benelux 8,979 8, % 75.4% 2.2% % % Central Europe LFL & R 11,908 11, % 76.8% -0.5% % % Total B.U. Central Europe 12,034 11, % 76.6% -0.2% % % Total Europe LFL & R 38,330 38, % 77.1% 0.7% % % Total Europe Consolidated 40,017 39, % 77.1% 0.3% % % Latinamerica LFL & R 5,236 5, % 61.9% -1.8% % % Latinamerica Consolidated 5,571 5, % 59.9% 0.0% % % NH Hotels LFL & R 43,566 43, % 75.3% 0.4% % % Total NH Consolidated 45,589 44, % 74.9% 0.4% % % +1.3% increase in RevPAR with a 70% contribution through prices (ADR +0.9%) with a practically stable occupancy level (+0.4%). RevPAR growth in all markets except Spain and Latin America (negative currency impact). Remarkable RevPAR growth in: Benelux: +6.5% due to a higher level of prices (+4.2%) and activity (+2.2%), explained by the excellent LFL evolution of Brussels (+17%, higher occupancy and ADR), secondary cities in Holland (+11%) and Amsterdam (+4%). Italy: +2.8%, with an increase in prices (+2.4%) and occupancy (+0.3%), driven by the good LFL performance of Rome (+6%), Milan (+5%) and secondary cities (+3%). Central Europe: +2.7% with a price increase of +2.9% despite the fewer working days in May, with a higher impact on secondary cities. Spain is showing a -3.0% decline in consolidated RevPAR, explained by the low flow of domestic customers to certain destinations during the May holidays and the celebration of a relevant congress in Madrid in June 2017, in both cases explaining a negative evolution of LFL RevPAR (Barcelona -6% and Madrid -3%). Secondary cities grew by +4%. With respect to the Group's level of activity in the second quarter, occupancy grew by +0.4% (+0.3 p.p.), with all regions being practically stable except Benelux (+2.2%; +1.7 p.p.) due to the recovery in Brussels. 5
6 H1 RevPAR Evolution: +2.2% increase in RevPAR through a combined growth strategy in ADR (+1.3%; + 1.3) and occupancy, which grew by +0.8%. In the first half, the growth in prices accounted for 62% of the increase in RevPAR. RevPAR growth in all markets except Latin America (negative currency impact), with the growth of Benelux (+7.7%) and Italy (+5.5%) standing out. NH HOTEL GROUP REVPAR 6M 2018/2017 AVERAGE ROOMS OCCUPANCY % ADR REVPAR % Var % Var % Var Spain & Others LFL & R 11,011 11, % 73.4% 1.2% % % Total B.U. Spain 11,613 11, % 73.5% 0.4% % % Italy LFL & R 7,138 7, % 68.3% 1.8% % % Total B.U. Italy 7,190 7, % 68.3% 1.6% % % Benelux LFL & R 8,212 8, % 68.7% 2.9% % % Total B.U. Benelux 8,887 8, % 68.6% 2.5% % % Central Europe LFL & R 11,936 11, % 71.1% 0.2% % % Total B.U. Central Europe 12,062 11, % 71.0% 0.3% % % Total Europe LFL & R 38,297 38, % 70.7% 1.3% % % Total Europe Consolidated 39,752 39, % 70.8% 1.0% % % Latinamerica LFL & R 5,236 5, % 62.0% -1.1% % % Latinamerica Consolidated 5,549 5, % 60.6% -1.2% % % NH Hotels LFL & R 43,533 43, % 69.7% 1.0% % % Total NH Consolidated 45,301 44, % 69.5% 0.8% % % Consolidated Ratios Evolution by Quarter: Consolidated Ratios Occupancy ADR RevPAR % Var Q2 17 Q3 17 Q4 17 Q1 18 Q2 18 Q2 17 Q3 17 Q4 17 Q1 18 Q2 18 Q2 17 Q3 17 Q4 17 Q1 18 Q2 18 Spain 3.6% 2.2% 3.0% 1.2% -0.4% 14.4% 13.3% 5.7% 4.8% -2.6% 18.5% 15.8% 8.9% 6.1% -3.0% Italy 5.8% -2.6% 2.6% 3.2% 0.3% 6.3% 8.7% 7.5% 6.5% 2.4% 12.5% 5.9% 10.3% 9.9% 2.8% Benelux 3.0% 5.2% 5.6% 2.6% 2.2% 9.4% 7.4% 5.4% 6.4% 4.2% 12.7% 13.0% 11.3% 9.1% 6.5% Central Europe 1.9% 4.7% 1.8% 2.1% -0.2% -2.9% -2.9% -2.9% -2.6% 2.9% -1.0% 1.7% -1.2% -0.6% 2.7% TOTAL EUROPE 3.3% 2.8% 3.1% 2.0% 0.3% 6.7% 5.7% 3.4% 3.4% 1.7% 10.3% 8.7% 6.6% 5.5% 2.0% Latin America real exc. rate -1.1% -1.4% 2.8% -1.9% 0.0% 5.5% -2.8% -5.9% -13.1% -8.1% 4.3% -4.2% -3.3% -14.8% -7.9% NH HOTEL GROUP 2.8% 2.3% 3.0% 1.6% 0.4% 6.6% 5.0% 2.4% 1.7% 0.9% 9.6% 7.4% 5.5% 3.3% 1.3% 6
7 ( million) RECURRING HOTEL ACTIVITY 2018 Q Q2 (3) DIFF. 18/17 %DIFF M M (3) DIFF. 18/17 %DIFF. SPAIN (1) (2.2) (1.9%) % ITALY % % BENELUX % % CENTRAL EUROPE % % AMERICA (2.5) (7.5%) (6.2) (9.2%) TOTAL RECURRING REVENUE LFL&R % % OPENINGS, CLOSINGS & OTHERS % % RECURRING REVENUES % % % SPAIN (1) (1.1) (1.6%) (0.7) (0.6%) ITALY (1.2) (2.5%) % BENELUX % % CENTRAL EUROPE % % AMERICA (2.7) (10.9%) (5.3) (10.7%) RECURRING OPEX LFL&R (2.2) (0.9%) % OPENINGS, CLOSINGS & OTHERS % % RECURRING OPERATING EXPENSES (2) % % SPAIN (1) (1.1) (2.2%) % ITALY % % BENELUX % % CENTRAL EUROPE % % AMERICA % (0.9) (5.1%) RECURRING GOP LFL&R % % OPENINGS, CLOSINGS & OTHERS % % RECURRING GOP % % SPAIN (1) (0.2) (0.8%) % ITALY % % BENELUX % % CENTRAL EUROPE % % AMERICA (0.2) (7.6%) (0.7) (10.4%) RECURRING LEASES&PT LFL&R % % OPENINGS, CLOSINGS & OTHERS % % RECURRING RENTS AND PROPERTY TAXES % % SPAIN (1) (0.9) (3.4%) % ITALY % % BENELUX % % CENTRAL EUROPE % (0.5) (5.8%) AMERICA % (0.2) (2.0%) RECURRING EBITDA LFL&R % % OPENINGS, CLOSINGS & OTHERS % % RECURRING EBITDA EX. ONEROUS PROVISION % % (1) The New York hotel and France are included in the Business Unit of Spain (2) For the allocation of central costs, the distribution criterion used is the GOP level of each business unit (3) From Q2 2018, rebates from procurement have been reclassified as less cost of procurement instead of an income in the total revenue figure (Q and 2017 figures also reclassified for comparison purposes) 7
8 Recurring Results by Business Unit (LFL&R basis) Spain B.U. (*): Q2: -2.3% decline in RevPAR in Q2, explained by the low flow of domestic customers to certain destinations during the May holidays and the celebration of a relevant congress in Madrid in June H1: +1.6% growth in RevPAR (+1.8% in Spain isolated), with an ADR that grew by +0.4% and occupancy by +1.2%. The evolution of LFL RevPAR in Madrid (+2.3%), secondary cities (+5.4%) and France (+5.9%) stands out. LFL revenue achieved growth of +2.7% excluding refurbishments (mainly New York with an opportunity cost of - 4.1m). Including these refurbishments, LFL&R growth is +0.8% (+ 1.5m). Madrid grew by +2.7% affected by a relevant congress in June 2017, whereas Barcelona showed negative growth (-2.3%) due to the lower domestic demand during the May holidays. Slight decrease in operating expenses, which fell by -0.6% (- 0.7m) in the semester. In the first half, GOP reached 76.4m, increasing by +3.1% (+ 2.3m). The rent increase in the period is + 0.4m (+0.9%), explained by the variable component. With all this, half-year EBITDA increased by 6.5% (+ 1.9m) reaching 30.8m with a margin improvement of +0.8 p.p. to 15.2%. (*) Includes the New York hotel and France Italy B.U.: Q2: RevPAR growth of +3.0% in the second quarter with an increase of +2.3% in prices (74% weight) and +0.8% in occupancy, achieving a +1.9% growth in revenues. H1: RevPAR grew by +5.5% in the semester with an ADR that grew by +3.7% (+ 4.2) and occupancy by +1.8%. Excellent performance of RevPAR LFL in Rome (+10.6%), Milan (+8.3%) and secondary cities (+4.7%). All this allows for a +5.7% growth in LFL revenue with a good performance in Rome (+9.7%) and Milan (+8.0%). Including the - 2.8m opportunity cost for the refurbishment of a hotel in Rome and another in Milan, the growth in LFL&R revenue is +4.5% (+ 6.1m). Operating expenses remained nearly stable in the first half (+0.4%; + 0.3m). The GOP grew by +11.4% (+ 5.8m) to 56.4m. As a result, half-year EBITDA improved by + 5.4m (+21.5%) to reach 30.7m, with a margin that improved by +3.0 p.p. to 21.5%. Benelux B.U.: Q2: RevPAR growth of +8.0% in Q2 with an increase of +4.8% in prices and +3.0% in occupancy. +6.8% revenue growth due to the excellent performance of Brussels, Amsterdam and secondary cities in Holland. H1: RevPAR grew by +8.4% with a price increase of +5.4% (64% weight) and an occupancy increase of +2.9%. Remarkable is the RevPAR LFL growth in Brussels (+14.9%, due to higher occupancy and prices), Amsterdam (+7.8%) and secondary cities of Holland (+8.9%). This led to a growth in LFL&R revenue of +7.3% (+ 11.5m) driven by the strong performance of Brussels (+13.3%) and Amsterdam (+7.5%). The operating expenses for the first half increased by +4.4% (+ 4.5m) due to the higher activity level and higher fees due to the change in segmentation. 8
9 With all of this, the half-year GOP grew by +13.0% (+ 7.0m) and EBITDA increased by +14.4% (+ 4.1m) to 32.2m, implying an EBITDA margin of 19.1% (+1.2 p.p.). Central Europe B.U.: Q2: +2.3% RevPAR growth in the second quarter with a price increase of +2.8% and an occupancy decrease of -0.5% to 76.4%, slightly affected by the larger number of holidays during May. LFL revenue grew +0.5% in the quarter, affected by the lower number of working days in May Including the hotels refurbished in 2017 and the - 1.1m opportunity cost of 3 hotels under refurbishment in 2018, revenue grew +2.4% (+ 2.3m) in LFL&R. H1: RevPAR grew +0.9% in the first half with an ADR that grew +0.7% (80% in weight) and a practically stable occupancy (+0.2%). Strong performance in the main cities and a greater negative impact from the holidays in May in the secondary cities. This led to an increase in LFL&R revenue of +2.8% (+ 4.9m). Operating expenses increased by +2.8% in the semester (+ 3.4m). Almost 50% of the increase in operating expenses is explained by the hotels refurbished in The GOP grew +2.6% (+ 1.6m) to 61.4m. Rents increased by +4.1% (+ 2.1m), 60% of this being explained by the hotels that were under refurbishment in As a consequence of this, the half-year EBITDA fell by -5.8% (- 0.5m) to 8.5m. Americas B.U.: Q2: RevPAR decrease of -8.9% in the second quarter is fully explained by the negative currency evolution in Argentina (-61%), Colombia (-6%) and Mexico (-13%). At constant exchange rates the growth of the BU's LFL&R revenue is +13.0% in the quarter and at real exchange rates revenue fell by -7.5%. H1: RevPAR fell -11.2% in the semester, explained by the negative impact of exchange rates. By region, Mexico shows revenue growth of +3.4% in the local currency. Including currency evolution (-10%), revenue fell by -5.8% at real exchange rates. In Argentina, revenue grew +43.1% at constant exchange rates, explained mainly by an increase in average prices. Including the negative currency evolution (-53%), reported income is -6.6%. In Hoteles Royal, revenue fell by -0.7% in local currency and including the -9% devaluation of the currency, revenue fell -8.8%. 9
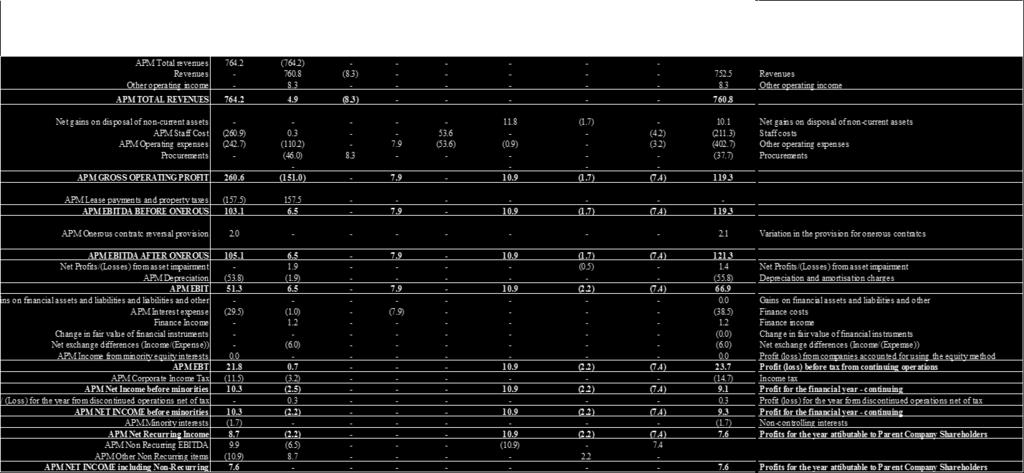
10 Consolidated Income Statement NH HOTEL GROUP P&L ACCOUNT ( million) Q Q Var. ( 3 ) 6M M 2017 ( 3 ) m. m. m. % m. m. m. % TOTAL REVENUES % % Staff Cost (137.3) (136.1) (1.2) 0.9% (267.3) (262.4) (4.8) 1.8% Operating expenses (125.1) (123.2) (2.0) 1.6% (237.7) (232.9) (4.8) 2.0% GROSS OPERATING PROFIT % % Lease payments and property taxes (83.6) (79.7) (3.9) 4.9% (165.5) (157.5) (8.1) 5.1% EBITDA BEFORE ONEROUS % % Margin % of Revenues 22.3% 21.4% 0.9p.p. N/A 14.6% 13.6% 1.0% Onerous contract reversal provision (0.4) (38.8%) (0.8) (37.2%) EBITDA AFTER ONEROUS % % Depreciation (27.2) (28.1) 0.8 (2.9%) (54.6) (53.8) (0.7) 1.4% EBIT % % Interest expense (9.7) (15.4) 5.7 (37.0%) (20.3) (29.5) 9.2 (31.2%) Income from minority equity interests (0.1) 0.1 (0.2) N/A (0.0) 0.0 (0.1) N/A EBT % % Corporate income tax (16.0) (12.5) (3.4) 27.5% (16.9) (11.5) (5.4) 47.3% NET INCOME before minorities % % Minority interests (1.0) (1.1) 0.1 (11.8%) (1.5) (1.7) 0.2 (12.4%) NET RECURRING INCOME % % Var. Non Recurring EBITDA (1) (2.7) N/A % Other Non Recurring items (2) (3.5) (6.8) 3.3 N/A (45.0) (10.9) (34.1) 0.0% NET INCOME including Non-Recurring % N/A (1) Includes gross capital gains from asset rotation (2) Includes taxes from asset rotation (3) From Q2 2018, rebates from procurement have been reclassified as less cost of procurement instead of an income in the total revenue figure (Q and 2017 figures also reclassified for comparison purposes) H Comments: Revenue growth of +3.9% (+5.8% at constant exchange rates) reaching 785m (+ 30m) in the first semester. In the LFL perimeter, excluding refurbishments and perimeter changes, revenue grew +2.9%: - Strong performance in Benelux (+7.4%) and Italy (+5.7%). Spain (+2.7%) and Central Europe (+2.2%) affected by holiday and congress calendars in Q2. - Latin America negatively impacted by currency evolution (+11.9% at a constant exchange rate). Evolution of costs: cost control in the half year despite the growth in occupancy (+0.8%). Staff costs rose +1.8% (- 4.8m). Change of perimeter (openings and closings) accounts for 89% of the increase. Other direct management costs grew by +2.0% (- 4.8m) mainly due to increased levels of activity and increased commissions due to the evolution of the sales channels mix. Perimeter changes due to openings and closings accounts for 66% of the increase. 10
11 Improvement of m (+7.7%) at GOP level. GOP margin improved by +1.2 p.p. in the semester reaching 35.7%, with a conversion ratio of 68%. Leases and property taxes increased by - 8.1m (+5.1%). The changes to the perimeter for openings and closings explains 37% of the total increase and the hotels refurbished in 2017 explains 24%. In turn, the variable components of the contracts explain 23% of the total. Revenue growth together with cost control allowed to close the semester with Recurring EBITDA (1) growth of +12% reaching 115m, an increase of + 12m and reaching a margin of 14.6% (+1.0 p.p.). The conversion ratio of incremental revenues into EBITDA is 40% despite the higher occupancy level (+0.8%) and new openings. Excluding perimeter changes and refurbishments, the LFL conversion ratio reached 61%. Depreciation: - 0.7m increase due to the impact of repositioning investments in 2017 and Financial Costs: the - 9.2m reduction is explained mainly by: April 2017 refinancing (Tap of 115m 2023 Bond & 150m repayment 2019 Bond): + 1.7m net coupon saving + 3.2m saving in arrangement costs. Repayment of 2019 Bond in Nov ( 100m): net coupon saving + 3.4m. Early redemption of the Convertible Bond: coupon saving (+ 1.4m) and partially compensating the temporary increase due to the accounting write-off of the equity portion & arrangement costs reported as a financial cost (- 3.5m). Annual cash flow saving of 10m from Income tax: the higher Income Tax (- 5.4m) is mainly due to the improved evolution of EBT. Significant increase in recurring Net Profit (+ 14.3m and higher than EBITDA growth) reaching 23.0m in the first semester, explained by improved business and lower financial costs. Total Net Profit reached 64.3m, up by m compared to the first half of The comparison is positively affected by the higher contribution of net capital gains from asset rotation. Q Comments: Revenue growth of +3.2% (+5.0% at constant exchange rates) reaching 445m (+ 14m). In the reported LFL growth of +1.9%, the good performance of Benelux (+6.9%) and Italy (+3.2%) is remarkable. Central Europe (+0.5%) was affected by the fewer working days in May and Spain (+0.2%) felt the impact of the low flow of domestic customers to certain destinations during the May holidays and a relevant congress in June 2017 in Madrid. Cost control allows to report a Recurring EBITDA growth of 7.5% up to 99.3m, meaning a + 7.0m increase with a margin of 22.3% (+0.9 p.p.). Significant growth in Net Recurring Profit of + 9.6m (higher than EBITDA growth) reaching 45.9m, explained by improved business and lower financial costs. The Total Net Profit amounted to 42.6m in the second quarter, affected by the accelerated depreciation related to the repositioning CapEx investments (mainly NY). 11
12 Financial Debt and Liquidity As of 30/06/2018 Maximum Repayment schedule Data in Euro million Available Availability Drawn Rest Senior Credit Facilities Senior Secured Notes due Senior Secured RCF due in Total debt secured by the same Collateral Other Secured loans (1) Total secured debt Unsecured loans and credit facilities (2) Subordinated loans Total unsecured debt Total Gross Debt Cash and cash equivalents (3) (251.7) Net debt Arranging loan expenses (16.5) (1.5) (3.1) (3.3) (3.2) (2.8) (2.3) (0.0) (0.0) (0.3) Accrued interests IFRS 9 (4) (8.0) (0.6) (1.2) (1.4) (1.6) (1.8) (1.5) Total adjusted net debt (1) Bilateral mortgage loans (2) Comprises debt facilities with amortization schedule (3) Not included in cash position. As of June 30, 2018, the Company had 600,000 treasury shares in its balance sheet. Treasury stock calculated with the price as of June 30, 2018 ( 6.33 per share) totals 3,8M (4) The new IFRS 9 regulation about Accounting Treatment of Financial Assets and Liabilities has become enforceable on the 1st of January The application of this accounting rule has involved an impact in the Balance of NH Hotel Group on the 1st of January of 8.6 million, as lower debt amount (registered against the Reserves, according to the rule), as a consequence of 2017 improved refinancing conditions, compared to the ones previously exiting ( 8.0M by 30/06/18 as per the financial expense). Reduction in net financial debt to 229m ( 655m at 31 Dec. 2017), following the early redemption of the Convertible Bond ( 250m) in June 2018, the favourable operating cash flow generation and the contribution of the asset rotation activity. The redemption of the Convertible Bond took place through the delivery of 8.6m treasury shares and 41.9m newly issued shares to bondholders who requested the early conversion ( 248.3m of the total nominal amount of 250m). Moreover, the bondholders who did not request the conversion received 1.7m plus the corresponding accrued interest. With all of this, the total number of shares in circulation is set at 392,180,243. At 30 th June 2018, the Company had cash amounting to 251.7m and available credit facilities amounting to 312.8m, of which 250m relate to the long-term syndicated credit facility signed in September 2016 (current maturity in 2021). On 23 rd March 2018, S&P Global Ratings improved NH Hotel Group's outlook from stable to positive, mainly due to the reduction in expected debt and significant cash generation. On 28 th March 2018, Fitch Ratings improved NH Hotel Group s corporate rating from 'B' to 'B+' and confirmed the positive outlook. In addition, Fitch improved the rating of senior secured bonds from 'BB-' to 'BB'. The improvement in the rating reflects the positive evolution of the Group's operations and leverage ratios. On 11 th May 2018 Moody s improved the Company's rating from B2 to B1 with a stable outlook, reflecting some excellent results, a significant improvement in indebtedness and greater liquidity. Moody's also confirmed the rating of the guaranteed senior bonds as Ba3. 12
 at 30 th June 2018 and ( 637m) at 31 st December 2017.")

13 H Net Financial Debt Evolution (1) Net Financial Debt excluding accounting adjustments arrangement expenses ( 16.5m), accrued interest (- 3.9m) and (2) IFRS 9 adjustment ( 8.0m). Including these accounting adjustments, the adjusted net debt would be ( 208m) at 30 th June 2018 and ( 637m) at 31 st December (2) The new IFRS 9 regulation about Accounting Treatment of Financial Assets and Liabilities has become enforceable on the 1 st January The application of this accounting rule as a result of the better refinancing conditions achieved in 2017, compared with the previous conditions, has involved an impact in NH Hotel Group of 8.6m as of the 1 st January 2018 ( 8.0m as of 30 th June 2018 as per the financial expense). Generation of cash flow in the first half of the year: (+) Operating cash flow: m, including - 8.2m of credit card expenses, and taxes paid by m (excluding m of Barbizon Income Tax). (+) Working capital: Significant recovery of accounts receivable in the first quarter of 2018, offset by a solid growth in sales. (-) CapEx payments: m in the first half of 2018 due to the planning of refurbishments throughout the year (guidance 2018 c. 140m). (+) Acquisitions & Disposals: m for the Barbizon Sale & Lease-back transaction in Q1, net of taxes ( 14.7m paid in the first half and 18m pending payment in the second half). Second payment of - 10m for the Hesperia contract. (-) Other: payment of legal provisions. (-) Net financial payments and Dividends: m that includes m of net financial costs and - 1.1m of dividend payments to minority shareholders. (+) Early redemption of Convertible Bond ( 250m) in June m paid in cash. 13
14 Appendix 15
, below it has been defined and reconciled the APMs used by the Group within the Results")
15 Appendix I: Important note: The consolidated financial statements have been affected by the implementation of the IFRS 9 accounting standard. In accordance with the Directives published by the ESMA in relation to Alternative Performance Measures (APMs), below it has been defined and reconciled the APMs used by the Group within the Results Publication of 1st Half of In addition, the abridged consolidated financial statements as at 30 June 2018 are shown below: 15

16 16

17 NH HOTEL GROUP, S.A. AND SUBSIDIARIES ABRIDGED CONSOLIDATED STATEMENTS OF CHANGES IN EQUITY FOR THE 1st HALF PERIOD ENDED 30 JUNE 2018 AND 30 JUNE 2017 (Thousands of euros) (*) Presented for comparison purpose only. Unaudited Balances. 17

18 NH HOTEL GROUP, S.A. AND SUBSIDIARIES ABRIDGED CONSOLIDATED CASH FLOW STATEMENTS PRODUCED IN THE FIRST HALF PERIOD ENDED 30 JUNE 2018 AND 2017 (Thousands of euros) 18
19 A) Definitions EBITDA: Result before tax of continuing operations and before: net result from the disposal of non-current assets, depreciation, net loss from asset impairment, the result on disposal of financial investments, the result of entities valued by the equity method, financial income, change in the fair value of financial instruments, financing costs (except for credit card costs, which are considered to be operating cost) and net exchange differences. This APM is used to measure the purely operating results of the Group. RevPAR: The result of multiplying the average daily price for a specific period by the occupancy in that period. This APM is used for comparison of average income per hotel room with other companies in the sector. Average Daily Rate (ADR): The ratio of total room revenue for a specific period divided by the rooms sold in that specific period. This APM is used to compare average hotel room prices with those of other companies in the sector. LFL&R (Like for like with refurbishments): We define LFL with refurbishments as the group of fully operated hotels in a 24-month period plus the refurbishments made in the last two years. It excludes those hotels that have just been opened or closed and that have therefore not been fully operational for 24 months. This APM is used to analyse operating results for the year in a manner comparable with those of previous periods excluding the impact of hotel refurbishments. Below it has been provided a breakdown of the Total Revenues line split into LFL and refurbishments and Openings, closings and other effects to illustrate the above explanation: H H M. M. Total revenues A+B Total recurring revenue LFL & Refurbishment A Openings, closing & others B It has been provided a reconciliation for the Total Revenues line in Point II for the period of 1st half ended 30 June Net Financial Debt: Gross financial debt less cash and other equivalent liquid assets, excluding accounting adjustments for the portion of the convertible bond treated as equity, arrangement expenses and accrued interest. Gross financial debt includes both non-current liabilities and current obligations for bonds and other negotiable securities and debt to lending institutions. Capex: Investments made on assets for improvement and development that have meant a cash outflow during the year. Obtained from the investments in fixed and intangible assets and property investments shown on the statement of cash flows on the consolidated financial statements. GOP (Gross operating profit): The gross operating profit obtained from EBITDA plus costs of leases and property taxes, as follows: Conversion Rate: This measures the proportion of revenue that has been transferred to EBITDA. It is calculated by dividing the change in EBITDA by the change in total revenue. 19
20 B) Reconciliation of the APM to the most directly reconcilable item, subtotal or total in the financial statements: The following significant APMs are contained in the Earnings Report of 1st half of 2018: I. ADR y RevPAR Earnings Report of 1st half of 2018 details the cumulative evolution of RevPAR and ADR in the following tables: NH HOTEL GROUP REVPAR 2T 2018/2017 AVERAGE ROOMS OCCUPANCY % ADR REVPAR % Var % Var % Var Spain & Others LFL & R 11,011 11, % 73.4% 1.2% % % Total B.U. Spain 11,613 11, % 73.5% 0.4% % % Italy LFL & R 7,138 7, % 68.3% 1.8% % % Total B.U. Italy 7,190 7, % 68.3% 1.6% % % Benelux LFL & Refur. 8,212 8, % 68.7% 2.9% % % Total B.U. Benelux 8,887 8, % 68.6% 2.5% % % Central Europe LFL & R 11,936 11, % 71.1% 0.2% % % Total B.U. Central Europe 12,062 11, % 71.0% 0.3% % % Total Europe LFL & R 38,297 38, % 70.7% 1.3% % % Total Europe Consolidated 39,752 39, % 70.8% 1.0% % % Latinamerica LFL & R 5,236 5, % 124.7% -1.1% % % Latinamerica Consolidated 5,549 5, % 122.0% -1.4% % % NH Hotels LFL & R 43,533 43, % 69.7% 1.0% % % Total NH Consolidated 45,301 44, % 69.5% 0.8% % % Below it is explained how the aforementioned data has been calculated: H H Thousand Thousand A Room revenues 555, ,760 Other revenues 225, ,705 Revenues according to profit & loss statement 781, ,465 B Thousand of room nights 5,737 5,579 A / B = C ADR D Occupancy 70.0% 69.5% C x D RevPAR II. INCOME STATEMENT 1 st HALF OF 2018 AND 2017 The Earnings Report of first half breaks down the table entitled Recurring hotel activity obtained from the Consolidated Income Statement appearing in the same Earnings Report. Below it has been provided a conciliation between the consolidated income statement and the abridged consolidated comprehensive income statements. 20


21 H

22 H


23 III. DEBT AND STATEMENT OF CASH FLOWS AS AT JUNE 2018 AND DECEMBER 2017 III.1 Debt presented in the earnings report of 1st Half The above debt table has been obtained from the consolidated financial statements that have been filed. III.2 Statement of cash flows included in the earnings report of 1st Half of Net financial debt 30 June 2018 and 31 December 2017 has been obtained from the consolidated balance sheet at 30 June 2018 and from the consolidated financial statements for 31 December 2017 and is as follows: The following chart reconciles the change in net financial debt shown in the earnings report of 1st half of 2018: 23

24 H Net Financial Debt Evolution A B To do so, it has been taken each heading from the statement of cash flows in the financial statements and shown the grouping: All of the aforementioned information has been obtained from the condensed consolidated statement of cash flows from 30 June 2018 which we include at the beginning of this document. The aforementioned APMs have been defined and used from the standpoint of analyzing the management of the business and the sector; the measures arising from the financial statements can be interpreted and are directly comparable to those of other groups in the sector and, therefore, APMs are not more relevant than the financial statements themselves. The earnings report, which includes the aforementioned APMs, is published at the end of each quarter to provide periodic information on the business evolution and management to investors and analysts. In addition, half-yearly and annual financial statements are published complying with the filing requirements established in the applicable accounting regulations. 24
25 Appendix II: Portfolio changes & Current portfolio New Agreements, Openings and Exists Hotels Signed from 1st January to 30 th June 2018 City / Country Contract # Rooms Opening La Habana / Cuba Management Hannover / Germany Leased Total Signed Hotels 120 Hotels Opened from 1 st January to 30 th June 2018 Hotels City / Country Contract # Rooms NH Collection Victoria La Habana La Habana / Cuba Management 31 NH Collection Marseille Marseille / France Leased 176 NH Brussels Bloom Brussels / Belgium Leased 305 NH Brussels EU Berlaymont Brussels / Belgium Leased 214 NH Monterrey La Fe Monterrey / Mexico Leased 152 NH Venezia Rio Novo Venice / Italy Leased 144 NH Collection Madrid Gran Vía Madrid / Spain Leased 94 Total Openings 1,116 Hotels exiting from 1 st January to 30 th June 2018 Hotels City / Country Month Contract # Rooms NH Lingotto Tech Turin / Italy January Management 140 NH Shijiazhuang Financial Center Shijiazhuang / China January Management 78 NH Puerto de Sagunto Valencia / Spain February Franchised 99 NH Collection Royal La Merced Cartagena / Colombia May Leased 9 Total Exits
26 HOTELS OPENED BY COUNTRY AT 30 th JUNE 2018 Business Unit Country TOTAL Leased Owned Management Franchised Hotels Rooms Call Option Hotels Rooms Hotels Rooms Hotels Rooms Hotels Rooms BU Benelux Belgium 13 2, , ,117 Luxembourg South Africa The Netherlands 36 6, , , United Kingdom BU Benelux 52 9, , , BU Central Europe Austria 6 1, ,183 Czech Republic Germany 57 10, , ,000 Hungary Poland Romania Slovakia Switzerland BU Central Europe 75 13, , , BU Italy Italy 51 7, , , BU Italy 51 7, , , BU Spain Spain , , , , Portugal Andorra France USA BU Spain , , , , BU America Argentina 15 2, , Brasil Colombia 14 1, ,691 Cuba Chile Dominican Republic 6 2, ,503 Ecuador Haiti Mexico 16 2, ,136 Uruguay Venezuela 5 1, ,285 BU America 66 11, , , ,867 TOTAL OPEN , , , ,
27 SIGNED PROJECTS AS OF 30 th JUNE 2018 After the latest negotiations and cancellation of signed projects, the following hotels and rooms are still to be opened: Business Unit Country TOTAL Leased Owned Management Hotels Rooms Hotels Rooms Hotels Rooms Hotels Rooms BU Benelux Belgium The Netherlands United Kingdom BU Benelux 3 1, BU Central Europe Austria Germany 6 1, ,497 BU Central Europe 7 1, ,654 BU Italy Italy BU Italy BU Spain Spain France BU Spain BU America Chile Mexico Panama Peru BU America 11 1, TOTAL SIGNED 27 4, , ,477 Details of committed investment for the hotels indicated above by year of execution: Expected Investment ( millions)

28 28
Q SALES AND RESULTS
 Q1 2018 SALES AND RESULTS 9 th May 2018 1 Q1 2018 Main Financial Aspects Solid revenue growth of +4.9% (+6.8% at constant exchange rates) reaching 345m (+ 16m) in the first quarter of the year. In the
SALES AND RESULTS Third Quarter 2018
 SALES AND RESULTS Third Quarter 2018 12 th November 2018 1 9M 2018 Main Financial Aspects (1) Revenue growth of +3.6% (+5.5% at constant rates), reaching 1.197m (+ 41m) in the first nine months of the
SALES AND RESULS 2017
 SALES AND RESULS 2017 28 th February 2018 1 2017 Main Financial Aspects Solid revenue growth of +6.5% (+7.0% at constant exchange rates) reaching 1,571m (+ 97m) in the year. In the like-for-like ("LFL")
SALES AND RESULTS Third quarter 2017
 SALES AND RESULTS Third quarter 2017 15 th November 2017 1 9M 2017 Main Financial Aspects Solid revenue growth of +6.7% (+6.8% at constant exchange rates) reaching 1.169m (+ 73m) in the first nine months
Report on six months ended June 30, 2016 for NH Hotel Group, S.A.
 Report on six months ended June 30, 2016 for NH Hotel Group, S.A. 1 Table of Contents Summary consolidated financial statements...1 Information regarding forward-looking statements...8 Presentation of
Report on three months ended March 31, 2018 for NH Hotel Group, S.A.
 Report on three months ended March 31, 2018 for NH Hotel Group, S.A. 1 Table of Contents Summary financial and other information...1 Information regarding forward-looking statements...7 Presentation of
Report on six months ended June 30, 2018 for NH Hotel Group, S.A.
 Report on six months ended June 30, 2018 for NH Hotel Group, S.A. 1 Table of Contents Summary consolidated financial statements...1 Information regarding forward-looking statements...8 Presentation of
Q RESULTS BRUSSELS, 25 OCTOBER 2018
 Q3 2018 RESULTS BRUSSELS, 25 OCTOBER 2018 FEDERICO J. GONZÁLEZ, PRESIDENT & CEO KNUT KLEIVEN, DEPUTY PRESIDENT & CFO Radisson Blu Hotel, Lyon, France Q3 Key Highlights Q3-2017 Best EBITDA financial in
Q & Full Year RESULTS BRUSSELS, 22 nd February 2019
 Q4 2018 & Full Year RESULTS BRUSSELS, 22 nd February 2019 FEDERICO J. GONZÁLEZ, PRESIDENT & CEO KNUT KLEIVEN, DEPUTY PRESIDENT & CFO Radisson Collection Strand Hotel, Stockholm Q4 Key developments Radisson
NH Hotel Group posts ebitda growth of 37% and a net profit increase of 135% excluding the impact of recognised capital gains in 2016
 NH Hotel Group posts ebitda growth of 37% and a net profit increase of 135% excluding the impact of recognised capital gains in 2016 Highlights: revenue growth in all markets, efficiency gains and deleveraging
NH Hoteles Presentation. 27 February 2008
 NH Hoteles Presentation 27 February 2008 1 Executive Summary 2007 Highlights Strong growth in LFL hotel revenue, +8%, with accelerating trend in Q407 Hotel margins increase 1.5 p.p. driven by improving
Q RESULTS BRUSSELS, 26 JULY 2018
 Q2 2018 RESULTS BRUSSELS, 26 JULY 2018 FEDERICO J. GONZÁLEZ, PRESIDENT & CEO KNUT KLEIVEN, DEPUTY PRESIDENT & CFO Radisson Blu Hotel, Lyon, France Q2 Key Highlights Q3-2017 Very encouraging financial quarter:
FINANCIAL RESULTS Pierre-Jean SIVIGNON
 August 30 th, 2012 FINANCIAL RESULTS Pierre-Jean SIVIGNON 2 H1 2012 Preliminary Remarks The H1 2012 accounts fully consolidate Guyenne & Gascogne as of June 1, 2012 following the successful tender offer
METRO COMBINED QUARTERLY STATEMENT 9M/Q3 2016/17
 ! " Preliminary note On 6 February 2017, the Annual General Meeting of METRO AG (registered in the trade register of the Local Court of Düsseldorf under HRB 39473) decided on the demerger of METRO GROUP
GrandVision Half Year 2016 Financial Report
 GrandVision Half Year 2016 Financial Report GrandVision N.V. WTC Schiphol, G-5, Schiphol Boulevard 117, 1118 BG Schiphol PO Box 75806, 1118 ZZ Schiphol, The Netherlands W www.grandvision.com T +31 88 887
Samsonite International S.A Avenue de la Liberte, L-1931, Luxembourg RCS Luxembourg: B (Incorporated under the laws of Luxembourg with
 Samsonite International S.A. 13 15 Avenue de la Liberte, L-1931, Luxembourg RCS Luxembourg: B159469 (Incorporated under the laws of Luxembourg with limited liability) Consolidated financial statements
EU Report. Europe NOVEMBER 2018
 H EU Report Europe NOVEMR 2018 ANALYSIS OF HOTEL RULTS NOVEMR 2018 Europe s hospitality industry holds its course Apart from a few incidents for some, indicators have been on a positive trend since June
9M 2018 Earnings Results. November 13,
 9M 2018 Earnings Results November 13, 2018 www.grupocodere.com 1 Table of Contents Financial and Operating Overview... 3 Consolidated Income Statement... 4 Revenue and Adjusted EBITDA... 6 Earnings per
2014 Full year results. INVESTOR CALL 26 March 2014
 2014 Full year results INVESTOR CALL 26 March 2014 AGENDA DISCLAIMER 2014 FOURTH QUARTER 2014 FULL YEAR CAPITAL STRUCTURE OUTLOOK APPENDIX 2 DISCLAIMER Any information in this presentation that is not
FOREIGN ACTIVITY REPORT
 FOREIGN ACTIVITY REPORT SECOND QUARTER 2012 TABLE OF CONTENTS Table of Contents... i All Securities Transactions... 2 Highlights... 2 U.S. Transactions in Foreign Securities... 2 Foreign Transactions in
FY2017 RESULTS. 1 February 2017 to 31 January Inditex continues to roll out its global, fully integrated store and online platform.
 FY2017 RESULTS 1 February 2017 to 31 January 2018 Inditex continues to roll out its global, fully integrated store and online platform. Strong operating performance: Net sales for FY2017 reached 25.3 billion,
An Inflexion Point in the Company 1H 2015 RESULTS PRESENTATION. Madrid, 22 nd July 2015
 An Inflexion Point in the Company 1H 2015 RESULTS PRESENTATION Madrid, 22 nd July 2015 Disclaimer In addition to figures prepared in accordance with IFRS, PRISA presents non-gaap financial performance
[1.1] [Takko Unaudited Interim Report FY Q2.pdf] [Page 1 of 42] UNAUDITED INTERIM REPORT
![[1.1] [Takko Unaudited Interim Report FY Q2.pdf] [Page 1 of 42] UNAUDITED INTERIM REPORT](/thumbs/75/72014162.jpg "[1.1] [Takko Unaudited Interim Report FY Q2.pdf] [Page 1 of 42] UNAUDITED INTERIM REPORT") [1.1] [Takko Unaudited Interim Report FY2017-18 Q2.pdf] [Page 1 of 42] UNAUDITED INTERIM REPORT Q2 2017 / 2018 Overview & figures in EUR k 1 May 2017 1 May 2016 1 Feb 2017 1 Feb 2016 304,424 296,923 545,405
[1.1] [Takko Unaudited Interim Report FY2017-18 Q2.pdf] [Page 1 of 42] UNAUDITED INTERIM REPORT Q2 2017 / 2018 Overview & figures in EUR k 1 May 2017 1 May 2016 1 Feb 2017 1 Feb 2016 304,424 296,923 545,405
METRO QUARTERLY STATEMENT 9M/Q3 2017/18
 CONTENT 2 Overview 4 Sales, earnings and financial position 5 Earnings position of the sales lines 5 8 Real 9 Others 10 Outlook 11 Store network 12 Income statement 13 Balance sheet 15 Cash flow statement
REZIDOR HOTEL GROUP AB (PUBL.)
") REZIDOR HOTEL GROUP AB (PUBL.) YEAR END FINANCIAL REPORT 1 ST JANUARY 31 ST DECEMBER Full year Revenue increased to MEUR 707.3 (587.0). Profit after tax of MEUR 29.0 (23.2) Earnings Per Share amounts to
REZIDOR HOTEL GROUP AB (PUBL.) YEAR END FINANCIAL REPORT 1 ST JANUARY 31 ST DECEMBER Full year Revenue increased to MEUR 707.3 (587.0). Profit after tax of MEUR 29.0 (23.2) Earnings Per Share amounts to
1H17 Results 21 July 2017
 1H17 Results 21 July 2017 Disclaimer This document has been prepared by NATURHOUSE HEALTH S.A. ( NATURHOUSE or the Company ) for its exclusive use during the presentations announcing the Company s results
FINAL RESULTS ANNOUNCEMENT FOR THE YEAR ENDED 31 MARCH 2010 FINANCIAL HIGHLIGHTS. Own stores number reached 764, increased by 11.
 Hong Kong Exchanges and Clearing Limited and The Stock Exchange of Hong Kong Limited take no responsibility for the contents of this announcement, make no representation as to its accuracy or completeness
PROSEGUR COMPAÑÍA DE SEGURIDAD, S.A. AND SUBSIDIARIES
 COMPAÑÍA DE SEGURIDAD, S.A. AND SUBSIDIARIES QUARTERLY FINANCIAL INFORMATION Interim Statement for first quarter of financial year 2014 RESULTS FOR PERIOD JANUARY TO MARCH 2014 Millions of euros CONSOLIDATED
Q4 and Full-Year 2013 Results
 Q4 and Full-Year 2013 Results Wolfgang M. Neumann, President & CEO Knut Kleiven, Deputy President & CFO February 7, Amsterdam / Radisson Blu Hotel Amsterdam, Netherlands An expanding portfolio in the Netherlands
INDRA POSTED NET PROFIT OF 70 MILLION EUROS IN 2016
 In 2015, Indra posted losses of -641m, due to extraordinary adjustments INDRA POSTED NET PROFIT OF 70 MILLION EUROS IN 2016 It s worth highlighting the strong cash generation ( +184m) thanks to the improvement
Prosegur 1H 2014 Results
 Prosegur 31 st July 2014 20140731ACD INVESTOR RELATIONS 1 Highlights Organic growth Improvement of more than 50% over the same period in 2013 Incremental EBIT improvement Continuing with the trend initiated
H FINANCIAL RESULTS. August 30,
 August 30, 2017 1 Disclaimer This presentation contains both historical and forward-looking statements. These forward-looking statements are based on Carrefour management's current views and assumptions.
INDRA S NET PROFIT INCREASED BY +23% IN 1H17, TO REACH 38 MILLION EUROS
 Revenues increased by +4% and EBITDA increased by +7% after Tecnocom s integration INDRA S NET PROFIT INCREASED BY +23% IN 1H17, TO REACH 38 MILLION EUROS Revenues in 1H17 totaled 1,379m, growing by +4%
GrandVision reports 2018 Revenue 3,721 million and adjusted EBITDA of 576 million
 GrandVision reports 2018 Revenue 3,721 million and adjusted EBITDA of 576 million Schiphol, the Netherlands 27 February 2019. GrandVision NV (EURONEXT: GVNV) publishes Full Year and Fourth Quarter 2018
H RESULTS PRESENTATION
 H1 2018 RESULTS PRESENTATION 03.09.2018 H1 2018 RESULTS PRESENTATION DISCLAIMER This presentation (the "Presentation") has been prepared and is issued by, and is the sole responsibility of Telepizza Group,
Interim Financial Report as at 30 September 2017
 Interim Financial Report as at 30 September 2017 Interim Report as at 30 September 2017 TRANSLATION FROM THE ORIGINAL ITALIAN TEXT INDEX PREFACE... 4 INTERIM MANAGEMENT REPORT AS AT 30 SEPTEMBER 2017...
Total tax contribution in 2012 A report on the economic contribution made by BBVA Group to public finances
 1 Index 1 Introduction 2 Distribution of BBVA Group's tax payments by geographical area 3 Tax responsibility 4 5 Tax charged in the financial statements in 2012 6 Main conclusions 2 1 Introduction Tax
QUARTERLY STATEMENT Q3 / 9M 2016 / 17
 QUARTERLY STATEMENT Q3 / 9M 2016 / 17 2 3 Split of METRO GROUP completed 3 About us 3 Acquisition of around 24% of FNAC DARTY S.A. 3 Positive sales and profit performance in Q3 4 Overview 5 INTERIM GROUP
Carrefour: 2012 Full-Year Results Growth in sales and net income, Group share Strengthened financial structure
 Carrefour: 2012 Full-Year Results Growth in sales and net income, Group share Strengthened financial structure 2012 key figures Growth in sales: +0.9% to 76.8bn, driven by emerging markets Resilient Recurring
Press release August 30, FIRST-HALF 2017 RESULTS Solid sales growth of +6.2% Recurring operating income of 621m
 FIRST-HALF 2017 RESULTS Solid sales growth of +6.2% Recurring operating income of 621m Net sales up +6.2% to 38.5bn, reflecting the combination of a good like-for-like performance and the effect of expansion:
The contents of this document must be taken into account by all individuals or entities that may have to make decisions or draw up or
 Corporate Presentation April 2018 Disclaimer This document has been prepared by NATURHOUSE HEALTH S.A. ( NATURHOUSE or the Company ) for its exclusive use during the presentations to investors. NATURHOUSE
Prosegur FY 2010 Results. Madrid, February 28 th, 2011
 Prosegur FY Results Madrid, February 28 th, 2011 Highlights Total sales in increased by 17.1% to EUR 2,560 million (2,187). Organic sales growth of 7.1% (3.7%) EBIT Margin stood at 10.3% EBIT rose 13.9%
GrandVision reports 2017 Revenue growth of 5.6% and adj. EBITDA of 552 million
 GrandVision reports 2017 Revenue of 5.6% and adj. EBITDA of 552 million Schiphol, the Netherlands 28 February 2018. GrandVision NV (EURONEXT: GVNV) publishes Full Year and Fourth Quarter 2017 results.
RESULTS 1Q18 MADRID, MAY 14 TH
 RESULTS 1Q18 MADRID, MAY 14 TH 2018 www.indracompany.com CONTENTS 1. Introduction & Key Figures 3 2. Analysis of the Consolidated Financial Statements (IFRS) 5 3. Analysis by Vertical Markets 8 4. Analysis
MAISONS DU MONDE: FIRST-HALF 2018 RESULTS
 PRESS RELEASE MAISONS DU MONDE: FIRST-HALF 2018 RESULTS A solid first half in a challenging environment Updated full-year 2018 targets Sales up 11% to 507m including Modani, and up 9.8% at constant scope
European Real Estate Market H
 European Real Estate Market H1 2 18 The European Union MACROECONOMIC OVERVIEW 18. Contribution of some Member States to the EU-28 GDP (million euro) Globally, economic growth remains solid, but less synchronized
International Statistical Release
 International Statistical Release This release and additional tables of international statistics are available on efama s website (www.efama.org). Worldwide Investment Fund Assets and Flows Trends in the
Atalian New H results. August 31, 2017
 Atalian New H1 2017 results August 31, 2017 Disclaimer Certain statements in this presentation are forward-looking. All statements other than statements of historical facts included in this presentation,
FY2016 RESULTS. 1 February 2016 to 31 January Inditex continues to roll out its global, fully integrated store and online model.
 FY2016 RESULTS 1 February 2016 to 31 January 2017 Inditex continues to roll out its global, fully integrated store and online model. Strong operating performance: Net sales for FY2016 reached 23.3 billion,
Corporate Presentation
 Corporate Presentation December 2017 Disclaimer This document has been prepared by NATURHOUSE HEALTH S.A. ( NATURHOUSE or the Company ) for its exclusive use during the presentations to investors. NATURHOUSE
Q trading update
 Q3 2018 trading update October 25, 2018 Louis Guyot, CFO We empower your day Disclaimer This document may contain information related to the Group s outlook. Such outlook is based on data, assumptions
Grupo Posadas, S.A.B. de C.V. & Subsidiaries Mexico City, October 22, 2015
 Operative & Financial Results: Third Quarter 2015 Grupo Posadas, S.A.B. de C.V. & Subsidiaries Mexico City, October 22, 2015 Information presented with respect to the same quarter of last year under IFRS
GrandVision reports HY18 revenue growth of 11.8% at constant exchange rates and comparable growth of 2.8%
 GrandVision reports HY18 revenue of 11.8% at constant exchange rates and comparable of 2.8% Schiphol, the Netherlands 6 August 2018. GrandVision N.V. publishes Half Year and Second Quarter 2018 results.
First Quarter 2016 Performance Summary
 First Quarter 2016 Performance Summary Operational and Financial Highlights - 1Q 2016 Grifols' revenues increase by +5.6% to Euros 959 million, driven by growth of +10.9% for the Bioscience Division The
PROSEGUR COMPAÑÍA DE SEGURIDAD, S.A. AND SUBSIDIARIES
 COMPAÑÍA DE SEGURIDAD, S.A. AND SUBSIDIARIES QUARTERLY FINANCIAL INFORMATION Interim Statement for first quarter of financial year 2013 RESULTS FOR PERIOD JANUARY TO MARCH 2013 CONSOLIDATED RESULTS 2012
RESULTS 1Q17 MADRID, MAY 11 TH
 RESULTS 1Q17 MADRID, MAY 11 TH 2017 www.indracompany.com CONTENTS 1. Introduction & Key Figures 3 2. Analysis of the Consolidated Financial Statements (IFRS) 4 3. Analysis by Vertical Markets 7 4. Analysis
Grupo Posadas, S.A.B. de C.V. & Subsidiaries Mexico City, October 25, 2018.
 Operative & Financial Results: Third Quarter 2018 Grupo Posadas, S.A.B. de C.V. & Subsidiaries Mexico City, October 25, 2018. Information presented with respect to the same quarter of previous year under
2008 FOURTH QUARTER RESULTS
 2008 FOURTH QUARTER RESULTS Stock Listing Information NYSE (ADS) Ticker: CX MEXICAN STOCK EXCHANGE Ticker: CEMEX.CPO Ratio of CEMEX.CPO to CX= 10:1 Fourth quarter January - December 2008 2007 % Var. 2008
H Financial Results
 H1 2016 Financial Results Gilles Petit, CEO Arnaud Louet, CFO H1 2016 Financial Results FORWARD LOOKING STATEMENTS This presentation does not constitute an offer to sell securities in the United States
PROSEGUR COMPAÑÍA DE SEGURIDAD, S.A. AND SUBSIDIARIES INTERIM FINANCIAL INFORMATION - QUARTERLY REPORT
 COMPAÑÍA DE SEGURIDAD, S.A. AND SUBSIDIARIES INTERIM FINANCIAL INFORMATION - QUARTERLY REPORT Interim financial report for the first quarter of 2018 (Translation from the original in Spanish. In the event
BOARD OF DIRECTORS REPORT ON OPERATIONS IN THE 4 TH QUARTER OF 2002
 MERLONI ELETTRODOMESTICI SPA Registered office: V.le A. Merloni, 47-60044 Fabriano Rome office: Via della Scrofa, 64 00186 Roma Capital stock: 99,416,219.40 fully paid in Tax/VAT code: 00693740425 Court
FULL YEAR 2011 RESULTS
 FULL YEAR 2011 RESULTS February 28 th 2012 1 28 February 2011 This document does not constitute a purchase, sales or exchange offer, nor is it an invitation to draw up a purchase, sales or exchange offer,
The contents of this document must be taken into account by all individuals or entities that may have to make decisions or draw up or
 Corporate Presentation September 2018 Disclaimer This document has been prepared by NATURHOUSE HEALTH S.A. ( NATURHOUSE or the Company ) for its exclusive use during the presentations to investors. NATURHOUSE
easyhotel plc Results for the year ended 30 September 2017
 Results for the year ended 30 September 2017 Introduction Guy Parsons Chief Executive Officer p2 Highlights Delivering Growth Revenue +39.7% Adjusted EBITDA +48.3% PBT before one-offs +43.0% Market Outperformance
Press release 8 March RESULTS
 2011 RESULTS Slight growth in sales, supported by emerging markets Current Operating Income of 2.2bn Net income, Group share, down 14%, impacted by significant one off elements Net debt reduced by more
RCI BANQUE OVERVIEW. KeY FIGUReS. total number of vehicle contracts in thousands. Results
 business report first half 2013 RCI BANQUE OVERVIEW RCI Banque is the captive finance company of the Renault Nissan Alliance and, as a consequence, finances sales of the following brands: Renault, Renault
February 29 th, FY 2015 Results Presentation
 February 29 th, 2016 FY 2015 Results Presentation 1 GROWTH Excellent results in Spain and Argentina Positive organic growth in Brazil Sales growth of 4.7% including FX rate LatAm organic growth above 12%
Savills plc. Results for the six months ended 30 th June August 2017
 Savills plc Results for the six months ended 30 th June 2017 10 August 2017 Disclaimer: Forward-looking statements These slides contain certain forward-looking statements including the Group s financial
FIRST-HALF 2016 KEY FIGURES
 FIRST-HALF 2016 KEY FIGURES (in m) H1 2015 H1 2016 (1) Variation at constant exch. rates Variation at current exch. rates Net sales 37,739 36,289 +2.2% -3.8% Net sales excluding petrol 34,337 33,243 +3.2%
July 26, 2017 LafargeHolcim Ltd 2015
 Second Quarter 2017 Results Beat Hess, Chairman and Interim CEO Roland Köhler, Interim COO and Regional Head of Europe, Australia/NZ & Trading Ron Wirahadiraksa, CFO July 26, 2017 LafargeHolcim Ltd 2015
Grupo Posadas, S.A.B. de C.V. & Subsidiaries Mexico City, October 26 th, 2017.
 Operative & Financial Results: Third Quarter 2017 Grupo Posadas, S.A.B. de C.V. & Subsidiaries Mexico City, October 26 th, 2017. Information presented with respect to the same quarter of previous year
BANCO BILBAO VIZCAYA ARGENTARIA, S.A. BANK BILBAO VIZCAYA ARGENTARIA, S.A.
 UNITED STATES SECURITIES AND EXCHANGE COMMISSION WASHINGTON, D.C. 20549 FORM 6-K REPORT OF FOREIGN ISSUER PURSUANT TO RULE 13a-16 OR 15d-16 UNDER THE SECURITIES EXCHANGE ACT OF 1934 For the six months
Financial summary Gross sales amounted to EUR4.60bn in H1 2018, implying 1.4% growth ex-currency.
 26 July 2018 Revised H1/2018 Financial summary Gross sales amounted to EUR4.60bn in H1 2018, implying 1.4% growth ex-currency. The group s LFL grew by 1.8% in the first half of 2018, 0.4% down in Iberia
Net sales 8,669 8, % 0.6% Operating income (EBIT) % -19.5% Basic EPS % -38.2%
 % -19.5% Basic EPS % -38.2%") 22 February 2018 Audited Financial summary Gross sales amounted to EUR10.3bn in 2017, implying 1.5% growth ex-currency. In Spain, gross sales declined by 3.8%, in line with a 3.9% space reduction carried
22 February 2018 Audited Financial summary Gross sales amounted to EUR10.3bn in 2017, implying 1.5% growth ex-currency. In Spain, gross sales declined by 3.8%, in line with a 3.9% space reduction carried
Q RESULTS BRUSSELS, 23 JULY 2015 WOLFGANG M. NEUMANN, PRESIDENT & CEO KNUT KLEIVEN, DEPUTY PRESIDENT & CFO
 Q2 2015 RESULTS BRUSSELS, 23 JULY 2015 WOLFGANG M. NEUMANN, PRESIDENT & CEO KNUT KLEIVEN, DEPUTY PRESIDENT & CFO Park Inn by Radisson Istanbul Ataturk Airport 1 I Q2-2015 Results Strengthening our position
Q RESULTS BRUSSELS, 27 JULY 2016
 Q2 2016 RESULTS BRUSSELS, 27 JULY 2016 WOLFGANG M. NEUMANN, PRESIDENT & CEO KNUT KLEIVEN, DEPUTY PRESIDENT & CFO 1 I Q2-2016 Results Radisson Blu Beach Resort, Milatos Crete, Greece Significant further
2005 FOURTH QUARTER AND FULL-YEAR RESULTS
 2005 FOURTH QUARTER AND FULL-YEAR RESULTS Stock Listing Information NYSE (ADR) Ticker: CX MEXICAN STOCK EXCHANGE Ticker: CEMEX.CPO Ratio of CEMEX.CPO to CX= 10:1 Fourth quarter (1) January - December (1)
Ezentis increases its EBITDA by 142,3% in the first nine months of the year up to 16,4 million Euros
 Results Presentation Ezentis increases its EBITDA by 142,3% in the first nine months of the year up to 16,4 million Euros The revenue of the Company increased by 30% up to 228,5 million Euros thanks to
PROLOGIS FORM 10-Q. (Quarterly Report) Filed 05/05/10 for the Period Ending 03/31/10
 Filed 05/05/10 for the Period Ending 03/31/10") PROLOGIS FORM 10-Q (Quarterly Report) Filed 05/05/10 for the Period Ending 03/31/10 Address 4545 AIRPORT WAY DENVER, CO 80239 Telephone 3033759292 CIK 0000899881 Symbol PLD SIC Code 6798 - Real Estate
PROLOGIS FORM 10-Q (Quarterly Report) Filed 05/05/10 for the Period Ending 03/31/10 Address 4545 AIRPORT WAY DENVER, CO 80239 Telephone 3033759292 CIK 0000899881 Symbol PLD SIC Code 6798 - Real Estate
1H RESULTS PRESENTATION Madrid, 2014
 1H RESULTS PRESENTATION Madrid, 2014 Disclaimer In addition to figures prepared in accordance with IFRS, PRISA presents non-gaap financial performance measures, e.g., EBITDA, EBITDA margin, adjusted EBITDA,
Grupo Posadas, S.A.B. de C.V. & Subsidiaries Mexico City, February 25, 2015
 Operative & Financial Results: Fourth Quarter 2015 Grupo Posadas, S.A.B. de C.V. & Subsidiaries Mexico City, February 25, 2015 Information presented with respect to previous year under IFRS accounting
Prosegur Results 1 st Half Madrid, 28 th July 2010
 Prosegur Results 1 st Half 2010 Madrid, 28 th July 2010 Executive summary Total Growth Growth Profitability +19.8% +22.6% 1,227.9 1,025.3 103.5 126.9 Margin 10.1% 10.3% Strong growth trend, mainly due
CONSOLIDATED ANNUAL ACCOUNTS
 Financial report 2010 Contents CONSOLIDATED ANNUAL ACCOUNTS 04 Balance sheet assets 05 Balance sheet equity and liabilities 06 Income statement 07 Statement of comprehensive income 08 Statement of Changes
The Bank of America Merrill Lynch Global Bond Index Rules. PIMCO Global Advantage Government Bond Index Fine Specifications
 PIMCO Global Advantage Government Bond Index Fine Specifications July 2017 1 Index Overview The PIMCO Global Advantage Government Bond Index history starts on December 31, 2003. The index has a level of
FOURTH QUARTER RESULTS
 2016 FOURTH QUARTER RESULTS Stock Listing Information NYSE (ADS) Ticker: CX Mexican Stock Exchange Ticker: CEMEXCPO Ratio of CEMEXCPO to CX = 10:1 Investor Relations In the United States: + 1 877 7CX NYSE
QUARTERLY STATEMENT Q1 2016/17
 QUARTERLY STATEMENT Q1 2016/17 P. 2 3 Overview 3 Sales, earnings and financial position 5 Sales lines 5 METRO Cash & Carry 6 Media-Saturn 7 Real 7 Others 8 Outlook 9 Store network 10 Reconciliation of
Fourth Quarter 2015 Performance Summary
 Fourth Quarter 2015 Performance Summary Operational and Financial Highlights - 2015 Grifols revenues grow by 17.3% to Euros 3,935 million, and net profit grows by 13.2% reaching Euros 532 million of the
First-quarter results: In line with full-year objectives
 PRESS RELEASE Paris, March 10, 2015 First-quarter results: In line with full-year objectives Solid organic revenue growth of 3.3% EBITDA up 1.5% Net result multiplied by 3.3 Full-year guidance confirmed
In 2015, we moved to a new organizational model:
 9M 2016 Results In 2015, we moved to a new organizational model: One Group, Three Businesses Leading the industry development Accelerate growth Increase specialization and efficiency Transforming the sector
Grupo Prosegur - Results Madrid, 26 th February 2009
 Grupo Prosegur - Results 2008 Madrid, 26 th February 2009 Executive Summary Total Growth Growth Profitability +11.4% +27.9% 2,051.7 1,841.8 207.1 Margin 8.8% 10.1% Strong growth trend, mainly due to the
Half-year 2014 results. May 16 th, 2014
 Half-year 2014 results May 16 th, 2014 Winter 2014 2 Pragelato-Vialattea, Italia Differences between the final figures and estimated data* *Published on April 28 th, 2014 (in m) S1 12 S1 13 S1 14 estimated
EU BUDGET AND NATIONAL BUDGETS
 DIRECTORATE GENERAL FOR INTERNAL POLICIES POLICY DEPARTMENT ON BUDGETARY AFFAIRS EU BUDGET AND NATIONAL BUDGETS 1999-2009 October 2010 INDEX Foreward 3 Table 1. EU and National budgets 1999-2009; EU-27
Developing Housing Finance Systems
 Developing Housing Finance Systems Veronica Cacdac Warnock IIMB-IMF Conference on Housing Markets, Financial Stability and Growth December 11, 2014 Based on Warnock V and Warnock F (2012). Developing Housing
PRESS RELEASE. Banco Santander made a profit EUR billion, 32% more than a year earlier FIRST QUARTER 2015 RESULTS
 PRESS RELEASE FIRST QUARTER 2015 RESULTS Banco Santander made a profit EUR 1.717 billion, 32% more than a year earlier Santander's strong increase in lending reflects our commitment to helping our customers
Amanera, Dominican Republic. Third Quarter Results
 Amanera, Dominican Republic 2017 Third Quarter Results This presentation contains forward-looking statements within the meaning of the U.S. federal securities laws. CEMEX, S.A.B. de C.V. and its direct
June 30, 2013 INTERIM FINANCIAL REPORT CONSOLIDATED FINANCIAL STATEMENTS
 June 30, 2013 INTERIM FINANCIAL REPORT CONSOLIDATED FINANCIAL STATEMENTS CONTENTS Financial highlights 3 Statutory Auditors Report 4 Interim financial review 5 Condensed interim consolidated financial
Strong growth in Q revenue, up +46.4% Organic growth at +2.3% Integration of Berendsen underway
 Press release Strong in Q3 2017 revenue, up +46.4% Organic at +2.3% Integration of Berendsen underway Further organic in all geographies of Elis historical scope o +2.3% in : decent summer season and favorable
BANCO BILBAO VIZCAYA ARGENTARIA, S.A. BANK BILBAO VIZCAYA ARGENTARIA, S.A.
 UNITED STATES SECURITIES AND EXCHANGE COMMISSION WASHINGTON, D.C. 20549 FORM 6-K REPORT OF FOREIGN ISSUER PURSUANT TO RULE 13a-16 OR 15d-16 UNDER THE SECURITIES EXCHANGE ACT OF 1934 For the six months
AMPLIFON: THE PATH OF STRONG GROWTH AND IMPROVING
 AMPLIFON: THE PATH OF STRONG GROWTH AND IMPROVING PROFITABILITY CONTINUES DOUBLE DIGIT GROWTH IN REVENUES AND SIGNIFICANT INCREASE IN PROFITABILITY STRONG CONTRIBUTION FROM ACQUISITIONS, PARTICULARLY IN
Altice Europe N.V. Q Results August 2, 2018
 Altice Europe N.V. Q2 2018 Results August 2, 2018 Disclaimer FORWARD-LOOKING STATEMENTS Certain statements in this presentation constitute forward-looking statements. These forward-looking statements include,