FREEPORT-McMoRan INC. (Exact name of registrant as specified in its charter)
|
|
|
- Ethelbert Brooks
- 5 years ago
- Views:
Transcription

1 UNITED STATES SECURITIES AND EXCHANGE COMMISSION Washington, D.C FORM 8-K CURRENT REPORT Pursuant to Section 13 OR 15(d) of The Securities Exchange Act of 1934 Date of Report (Date of earliest event reported): July 25, 2017 FREEPORT-McMoRan INC. (Exact name of registrant as specified in its charter) Delaware (State or other jurisdiction of incorporation) (Commission File Number) (IRS Employer Identification No.) 333 North Central Avenue Phoenix, AZ (Address of principal executive offices) Registrant's telephone number, including area code: (602) [ ] Written communications pursuant to Rule 425 under the Securities Act (17 CFR ) [ ] Soliciting material pursuant to Rule 14a-12 under the Exchange Act (17 CFR a-12) [ ] Pre-commencement communications pursuant to Rule 14d-2(b) under the Exchange Act (17 CFR d-2(b)) [ ] Pre-commencement communications pursuant to Rule 13e-4(c) under the Exchange Act (17 CFR e-4(c)) (Zip Code) Indicate by check mark whether the registrant is an emerging growth company as defined in Rule 405 of the Securities Act of 1933 (17 CFR ) or Rule 12b- 2 of the Securities Exchange Act of 1934 (17 CFR b-2). Emerging growth company [ ] If an emerging growth company, indicate by check mark if the registrant has elected not to use the extended transition period for complying with any new or revised financial accounting standards provided pursuant to Section 13(a) of the Exchange Act. [ ]
2 Item Results of Operations and Financial Condition. Freeport-McMoRan Inc. (FCX) issued a press release dated July 25, 2017, announcing its second-quarter and six-month 2017 financial and operating results, referencing supplementary schedules (see Exhibit 99.1). Item Regulation FD Disclosure. The slides presented in connection with FCX s second-quarter 2017 earnings conference call conducted via the internet on July 25, 2017 are attached hereto as Exhibit The information furnished pursuant to this Item 7.01 shall not be deemed filed for purposes of Section 18 of the Securities Exchange Act of 1934, as amended (the Exchange Act ), or otherwise subject to the liabilities of that section, nor shall it be deemed incorporated by reference in any filing under the Securities Act of 1933, as amended, or the Exchange Act, regardless of any general incorporation language in such filing. Item Financial Statements and Exhibits. (d) Exhibits. The Exhibits included as part of this Current Report are listed in the attached Exhibit Index.
3 SIGNATURE Pursuant to the requirements of the Securities Exchange Act of 1934, the registrant has duly caused this report to be signed on its behalf by the undersigned hereunto duly authorized. FREEPORT-McMoRan INC. Date: July 25, 2017 By: /s/ C. Donald Whitmire, Jr C. Donald Whitmire, Jr. Vice President and Controller - Financial Reporting (authorized signatory and Principal Accounting Officer)
4 Freeport-McMoRan Inc. Exhibit Index Exhibit Number 99.1 Press release dated July 25, 2017, titled Freeport-McMoRan Reports Second-Quarter and Six-Month 2017 Results and supplementary schedules Slides presented in connection with FCX s second-quarter 2017 earnings conference call conducted via the internet on July 25, 2017.

5 Freeport-McMoRan Reports Second-Quarter and Six-Month 2017 Results Net income attributable to common stock totaled $268 million, $0.18 per share, for second-quarter After adjusting for net gains of $27 million, $0.01 per share, second-quarter 2017 adjusted net income attributable to common stock totaled $241 million, $0.17 per share. Consolidated sales totaled 942 million pounds of copper, 432 thousand ounces of gold and 25 million pounds of molybdenum for second-quarter Consolidated sales for the year 2017 are expected to approximate 3.7 billion pounds of copper, 1.6 million ounces of gold and 93 million pounds of molybdenum, including 940 million pounds of copper, 375 thousand ounces of gold and 22 million pounds of molybdenum for third-quarter Average realized prices were $2.65 per pound for copper, $1,243 per ounce for gold and $9.58 per pound for molybdenum for second-quarter Average unit net cash costs were $1.20 per pound of copper for second-quarter 2017 and are expected to average $1.19 per pound of copper for the year Operating cash flows totaled $1.0 billion (including $144 million in working capital sources and changes in tax payments) for second-quarter 2017 and $1.8 billion (including $322 million in working capital sources and changes in tax payments) for the first six months of Based on current sales volume and cost estimates, and assuming average prices of $2.65 per pound for copper, $1,250 per ounce for gold and $7.50 per pound for molybdenum for the second half of 2017, operating cash flows for the year 2017 are expected to approximate $3.8 billion (including $0.6 billion in working capital sources and changes in tax payments). Capital expenditures totaled $362 million (including approximately $210 million for major mining projects) for second-quarter 2017 and $706 million for the first six months of 2017 (including approximately $420 million for major mining projects). Capital expenditures for the year 2017 are expected to approximate $1.6 billion, including $0.7 billion for underground development activities in the Grasberg minerals district in Indonesia, which depends on a resolution of PT Freeport Indonesia's (PT-FI) longterm operating rights. At June 30, 2017, consolidated cash totaled $4.7 billion and consolidated debt totaled $15.4 billion, compared with $4.2 billion of consolidated cash and $16.0 billion of consolidated debt at December 31, FCX had no borrowings and $3.5 billion available under its revolving credit facility at June 30, Freeport-McMoRan 1
6 PHOENIX, AZ, July 25, Freeport-McMoRan Inc. (NYSE: FCX) reported net income attributable to common stock of $268 million ( $0.18 per share) for second-quarter 2017 and $496 million ( $0.34 per share) for the first six months of 2017, compared with net losses attributable to common stock of $479 million ( $0.38 per share) for second-quarter 2016 and $4.7 billion ( $3.70 per share) for the first six months of After adjusting for net gains (losses) of $27 million ( $0.01 per share) for second-quarter 2017 and $(452) million ( $(0.36) per share) for second-quarter 2016, adjusted net income (loss) attributable to common stock totaled $241 million ( $0.17 per share) for second-quarter 2017 and $(27) million ( $(0.02) per share) for second-quarter Additionally, FCX's second-quarter 2017 sales from its mining operations to affiliated smelters resulted in the deferral of $51 million ($0.04 per share) of net income attributable to common stock, which will be recognized in future periods. Refer to the supplemental schedules, "Adjusted Net Income (Loss)," beginning on page VII, and "Deferred Profits," on page X, which are available on FCX's website, "fcx.com," for additional information. Richard C. Adkerson, President and Chief Executive Officer, said, "We are successfully executing our strategy of building values in our largescale, industry-leading portfolio of copper assets. Our strong management of costs and ongoing capital discipline combined with improved copper prices are providing free cash flow to strengthen our company s financial position. We remain focused on protecting our past investments and supporting our long-term investment plans at the high-grade, long-lived mineral deposits in the Grasberg minerals district in Papua, Indonesia. We are encouraged by recent progress in our active negotiations with the Indonesian government to resolve issues involving our contractual rights and by multiple opportunities to build long-term future values for our shareholders from our high-quality copper assets in the Americas." SUMMARY FINANCIAL DATA Three Months Ended June 30, Six Months Ended June 30, (in millions, except per share amounts) Revenues a,b $ 3,711 $ 3,334 $ 7,052 $ 6,576 Operating income (loss) a $ 669 $ 18 $ 1,249 $ (3,854) Net income (loss) from continuing operations $ 326 $ (229) $ 594 $ (4,326) Net income (loss) from discontinued operations $ 9 c $ (181) $ 47 c $ (185) Net income (loss) attributable to common stock d,e $ 268 $ (479) $ 496 $ (4,663) Diluted net income (loss) per share of common stock: Continuing operations $ 0.18 $ (0.23) $ 0.31 $ (3.54) Discontinued operations (0.15) 0.03 (0.16) $ 0.18 $ (0.38) $ 0.34 $ (3.70) Diluted weighted-average common shares outstanding 1,453 1,269 1,453 1,260 Operating cash flows f $ 1,037 $ 874 $ 1,829 $ 1,614 Capital expenditures $ 362 $ 833 $ 706 $ 1,815 At June 30: Cash and cash equivalents $ 4,667 $ 330 $ 4,667 $ 330 Total debt, including current portion $ 15,354 $ 19,220 $ 15,354 $ 19,220 a. For segment financial results, refer to the supplemental schedules, "Business Segments," beginning on page X, which are available on FCX's website, "fcx.com." b. Includes (unfavorable) favorable adjustments to provisionally priced concentrate and cathode copper sales recognized in prior periods totaling $(20) million ( $(8) million to net income attributable to common stock or $(0.01) per share) in second-quarter 2017, $(28) million ( $(15) million to net loss attributable to common stock or $(0.01) per share) in second-quarter 2016, $81 million ( $35 million to net income attributable to common stock or $0.02 per share) for the first six months of 2017 and $5 million ( $2 million to net loss attributable to common stock or less than $0.01 per share) for the first six months of For further discussion, refer to the supplemental schedule, "Derivative Instruments," on page X, which is available on FCX's website, "fcx.com." Freeport-McMoRan 2
7 c. Primarily reflects adjustments to the fair value of the potential $120 million in contingent consideration related to the November 2016 sale of FCX's interest in TF Holdings Limited (TFHL), which totaled $55 million at June 30, 2017, and in accordance with accounting guidelines, will continue to be adjusted through December 31, d. Includes net gains (charges) of $27 million ( $0.01 per share) in second-quarter 2017, $(452) million ( $(0.36) per share) in second-quarter 2016, $34 million ( $0.02 per share) for the first six months of 2017 and $(4.4) billion ( $(3.53) per share) for the first six months of 2016 that are described in the supplemental schedule, "Adjusted Net Income (Loss)," beginning on page VII, which is available on FCX's website, "fcx.com." e. FCX defers recognizing profits on intercompany sales until final sales to third parties occur. For a summary of net impacts from changes in these deferrals, refer to the supplemental schedule, "Deferred Profits," on page X, which is available on FCX's website, "fcx.com." f. Includes net working capital sources and changes in tax payments of $144 million in second-quarter 2017, $278 million in second-quarter 2016, $322 million for the first six months of 2017 and $466 million for the first six months of SUMMARY OPERATING DATA Copper (millions of recoverable pounds) Three Months Ended June 30, Six Months Ended June 30, a a Production 883 1,011 1,734 1,998 Sales, excluding purchases ,751 1,987 Average realized price per pound $ 2.65 $ 2.19 $ 2.65 $ 2.17 Site production and delivery costs per pound b $ 1.64 $ 1.41 $ 1.62 $ 1.45 Unit net cash costs per pound b $ 1.20 $ 1.33 $ 1.29 $ 1.36 Gold (thousands of recoverable ounces) Production Sales, excluding purchases Average realized price per ounce $ 1,243 $ 1,292 $ 1,242 $ 1,259 Molybdenum (millions of recoverable pounds) Production Sales, excluding purchases Average realized price per pound $ 9.58 $ 8.34 $ 9.16 $ 7.99 a. Excludes the results of the Tenke Fungurume (Tenke) mine, which was sold in November 2016 and is reported as discontinued operations. Copper sales from the Tenke mine totaled 124 million pounds in second-quarter 2016 and 247 million for the first six months of b. Reflects per pound weighted-average production and delivery costs and unit net cash costs (net of by-product credits) for all copper mines, before net noncash and other costs. For reconciliations of per pound unit costs by operating division to production and delivery costs applicable to sales reported in FCX's consolidated financial statements, refer to the supplemental schedules, "Product Revenues and Production Costs," beginning on page XIII, which are available on FCX's website, "fcx.com." Consolidated Sales Volumes Second-quarter 2017 copper sales of 942 million pounds were lower than the April 2017 estimate of 975 million pounds, primarily reflecting the impact of worker absenteeism on mining and milling rates in Indonesia. Second-quarter 2017 copper sales were also lower than second-quarter 2016 sales of 987 million pounds, primarily reflecting anticipated lower ore grades in North America and lower leach production and recoveries in South America, partly offset by higher volumes from Indonesia associated with higher ore grades and the sale of concentrate in inventory produced in first-quarter Second-quarter 2017 gold sales of 432 thousand ounces were slightly lower than the April 2017 estimate of 440 thousand ounces, but were higher than second-quarter 2016 sales of 156 thousand ounces, primarily reflecting higher ore grades from Indonesia. Freeport-McMoRan 3
8 Second-quarter 2017 molybdenum sales of 25 million pounds were slightly higher than the April 2017 estimate of 24 million pounds and were higher than second-quarter 2016 sales of 19 million pounds. Sales volumes for the year 2017 are expected to approximate 3.7 billion pounds of copper, 1.6 million ounces of gold and 93 million pounds of molybdenum, including 940 million pounds of copper, 375 thousand ounces of gold and 22 million pounds of molybdenum in third-quarter Estimated sales volumes for the year 2017 are lower than April 2017 estimates by approximately 150 million pounds of copper and 320 thousand ounces of gold, principally attributable to lower mining rates in the Grasberg open pit associated with reduced manpower levels and modifications to the ramp-up schedule for the Deep Mill Level Zone (DMLZ) underground mine. These shortfalls are expected to be recovered in future periods. Efforts are under way to increase mining rates in the Grasberg open pit to benefit from the high-grade ore currently available to be mined. Refer to page 6 for a discussion of Indonesia Regulatory Matters, which may have a significant impact on future results. Consolidated Unit Costs Consolidated average unit net cash costs (net of by-product credits) for FCX's copper mines of $1.20 per pound of copper in second-quarter 2017 were lower than unit net cash costs of $1.33 per pound in second-quarter 2016, primarily reflecting higher by-product credits, partly offset by lower copper sales volumes. Assuming average prices of $1,250 per ounce of gold and $7.50 per pound of molybdenum for the second half of 2017 and achievement of current sales volume and cost estimates, consolidated unit net cash costs (net of by-product credits) for copper mines are expected to average $1.19 per pound of copper for the year The impact of price changes for the second half of 2017 on consolidated unit net cash costs would approximate $0.015 per pound for each $50 per ounce change in the average price of gold and $0.01 per pound for each $2 per pound change in the average price of molybdenum. Quarterly unit net cash costs vary with fluctuations in sales volumes and realized prices, primarily for gold and molybdenum. MINING OPERATIONS North America Copper Mines. FCX operates seven open-pit copper mines in North America - Morenci, Bagdad, Safford, Sierrita and Miami in Arizona, and Chino and Tyrone in New Mexico. In addition to copper, molybdenum concentrate, gold and silver are also produced by certain of FCX's North America copper mines. All of the North America mining operations are wholly owned, except for Morenci. FCX records its 72 percent undivided joint venture interest in Morenci using the proportionate consolidation method. Operating and Development Activities. FCX has significant undeveloped reserves and resources in North America and a portfolio of potential long-term development projects. Future investments will be undertaken based on the results of economic and technical feasibility studies, and are dependent on market conditions. FCX continues to evaluate opportunities to reduce the capital intensity of its long-term development projects. Through exploration drilling, FCX has identified a significant resource at the Lone Star project located near the Safford operation in eastern Arizona. Initial production from the Lone Star oxide ores could begin in 2021 using existing infrastructure to replace oxide production from Safford. FCX is seeking regulatory approvals for this project and continues to evaluate longer term opportunities available from the significant sulfide potential in the Lone Star/Safford minerals district. Freeport-McMoRan 4
9 Operating Data. Following is summary consolidated operating data for the North America copper mines for the second quarters and first six months of 2017 and 2016 : Copper (millions of recoverable pounds) Three Months Ended June 30, Six Months Ended June 30, Production Sales, excluding purchases Average realized price per pound $ 2.62 $ 2.18 $ 2.65 $ 2.17 Molybdenum (millions of recoverable pounds) Production a Unit net cash costs per pound of copper b Site production and delivery, excluding adjustments $ 1.59 $ 1.40 $ 1.56 $ 1.40 By-product credits (0.16) (0.11) (0.15) (0.10) Treatment charges Unit net cash costs $ 1.53 $ 1.40 $ 1.51 $ 1.41 a. Refer to summary operating data on page 3 for FCX's consolidated molybdenum sales, which includes sales of molybdenum produced at the North America copper mines. b. For a reconciliation of unit net cash costs per pound to production and delivery costs applicable to sales reported in FCX's consolidated financial statements, refer to the supplemental schedules, "Product Revenues and Production Costs," beginning on page XIII, which are available on FCX's website, "fcx.com." North America's consolidated copper sales volumes of 408 million pounds in second-quarter 2017 were lower than second-quarter 2016 sales of 464 million pounds, primarily reflecting lower ore grades. North America copper sales are estimated to approximate 1.5 billion pounds for the year 2017, compared with 1.8 billion pounds in Average unit net cash costs (net of by-product credits) for the North America copper mines of $1.53 per pound of copper in second-quarter 2017 were higher than unit net cash costs of $1.40 per pound in second-quarter 2016, primarily reflecting lower sales volumes, partly offset by higher by-product credits. Average unit net cash costs (net of by-product credits) for the North America copper mines are expected to approximate $1.54 per pound of copper for the year 2017, based on achievement of current sales volume and cost estimates and assuming an average molybdenum price of $7.50 per pound for the second half of North America's average unit net cash costs for the year 2017 would change by approximately $0.02 per pound for each $2 per pound change in the average price of molybdenum. South America Mining. FCX operates two copper mines in South America - Cerro Verde in Peru (in which FCX owns a percent interest) and El Abra in Chile (in which FCX owns a 51 percent interest). These operations are consolidated in FCX's financial statements. In addition to copper, the Cerro Verde mine produces molybdenum concentrate and silver. Operating and Development Activities. The Cerro Verde expansion project commenced operations in September 2015 and achieved capacity operating rates during first-quarter Cerro Verde's expanded operations benefit from its large-scale, long-lived reserves and cost efficiencies. The project expanded the concentrator facilities from 120,000 metric tons of ore per day to 360,000 metric tons of ore per day. In the second half of 2015, FCX adjusted operations at its El Abra mine to reduce mining and stacking rates by approximately 50 percent to achieve lower operating and labor costs, defer capital expenditures and extend the life of the existing operations. El Abra continues to operate at reduced rates. FCX continues to evaluate a potential large-scale milling operation at El Abra to process additional sulfide material and to achieve higher recoveries. Exploration results at El Abra indicate a significant sulfide resource, Freeport-McMoRan 5
10 which could potentially support a major mill project. Future investments will depend on technical studies, economic factors and market conditions. Operating Data. Following is summary consolidated operating data for the South America mining operations for the second quarters and first six months of 2017 and 2016 : Copper (millions of recoverable pounds) Three Months Ended June 30, Six Months Ended June 30, Production Sales Average realized price per pound $ 2.67 $ 2.19 $ 2.65 $ 2.18 Molybdenum (millions of recoverable pounds) Production a Unit net cash costs per pound of copper b Site production and delivery, excluding adjustments $ 1.55 $ 1.20 $ 1.52 $ 1.22 By-product credits (0.13) (0.12) (0.16) (0.10) Treatment charges Royalty on metals Unit net cash costs $ 1.65 $ 1.31 $ 1.59 $ 1.36 a. Refer to summary operating data on page 3 for FCX's consolidated molybdenum sales, which includes sales of molybdenum produced at Cerro Verde. b. For a reconciliation of unit net cash costs per pound to production and delivery costs applicable to sales reported in FCX's consolidated financial statements, refer to the supplemental schedules, "Product Revenues and Production Costs," beginning on page XIII, which are available on FCX's website, "fcx.com." South America's consolidated copper sales volumes of 287 million pounds in second-quarter 2017 were lower than second-quarter 2016 sales of 327 million pounds primarily reflecting lower mining rates, ore grades and recoveries. Sales from South America mining are expected to approximate 1.2 billion pounds of copper for the year 2017, compared with 1.3 billion pounds of copper in Average unit net cash costs (net of by-product credits) for South America mining of $1.65 per pound of copper in second-quarter 2017 were higher than unit net cash costs of $1.31 per pound in second-quarter 2016, primarily reflecting lower sales volumes and higher maintenance costs. Average unit net cash costs (net of by-product credits) for South America mining are expected to approximate $1.65 per pound of copper for the year 2017, based on current sales volume and cost estimates and assuming an average price of $7.50 per pound of molybdenum for the second half of Indonesia Mining. Through its percent owned and consolidated subsidiary PT-FI, FCX's assets include one of the world's largest copper and gold deposits at the Grasberg minerals district in Papua, Indonesia. PT-FI operates a proportionately consolidated joint venture, which produces copper concentrate that contains significant quantities of gold and silver. Regulatory Matters. In January and February 2017, the Indonesian government issued new regulations to address the export of unrefined metals, including copper concentrate and anode slimes, and other matters related to the mining sector. The new regulations permit the continuation of copper concentrate exports for a five-year period through January 2022, subject to various conditions, including conversion from a contract of work to a special operating license (known as an IUPK, which does not provide the same level of fiscal and legal protections as PT-FI's Contract of Work (COW), which remains in effect), a commitment to the completion of smelter construction in five years and payment of export duties to be determined by the Ministry of Finance. In addition, the Freeport-McMoRan 6
11 new regulations enable application for an extension of operating rights five years before expiration of the IUPK and require foreign IUPK holders to divest a 51 percent interest in the licensed entity to Indonesian interests no later than the tenth year of production. Export licenses would be valid for one-year periods, subject to review every six months, depending on smelter construction progress. Following the issuance of the January and February 2017 regulations and discussions with the Indonesian government, PT-FI advised the government that it was prepared to convert its COW to an IUPK, subject to obtaining an investment stability agreement providing contractual rights with the same level of legal and fiscal certainty enumerated under its COW, and provided that the COW would remain in effect until it is replaced by a mutually satisfactory alternative. PT-FI also committed to commence construction of a new smelter during a five-year time frame, subject to approval of the extension of its long-term operating rights. In mid-february 2017, pursuant to the COW's dispute resolution provisions, PTFI provided formal notice to the Indonesian government of an impending dispute listing the government's breaches and violations of the COW. PT-FI continues to reserve its rights under these provisions. As a result of the 2017 regulatory restrictions and uncertainties regarding long-term investment stability, PT-FI has taken actions to adjust its cost structure, slow investments in its underground development projects and new smelter, and place certain of its workforce on furlough programs. In late March 2017, the Indonesian government amended the regulations to enable PT-FI to retain its COW until replaced with an IUPK accompanied by an investment stability agreement, and to grant PT-FI a temporary IUPK through October 10, 2017, that would allow concentrate exports to resume during this period. In April 2017, PT-FI entered into a Memorandum of Understanding with the Indonesian government confirming that the COW would continue to be valid and honored until replaced by a mutually agreed IUPK and investment stability agreement. PT-FI agreed to continue to pay a five percent export duty during this period. On April 21, 2017, the Indonesian government issued a permit to PT-FI that allows exports to resume for a six-month period, and PT-FI commenced export shipments. PT-FI and the Indonesian government are now engaged in active negotiations on the conversion of PT-FI's COW to an IUPK accompanied by an investment stability agreement with the objective of providing a mutually acceptable long-term investment framework. In addition to negotiating a stability agreement, the parties are also discussing requirements for the construction of a new smelter and the government's request for divestment. PT-FI and the Indonesian government are working cooperatively with the objective of reaching a mutually acceptable long-term resolution during 2017 to secure PT-FI's long-term investments for the benefit of all stakeholders. Operating and Development Activities. PT-FI is currently mining the final phase of the Grasberg open pit, which contains high copper and gold ore grades. PT-FI expects to mine high-grade ore over the next several quarters prior to transitioning to the Grasberg Block Cave underground mine in early PT-FI has several projects in the Grasberg minerals district related to the development of its large-scale, long-lived, high-grade underground ore bodies. In aggregate, these underground ore bodies are expected to produce large-scale quantities of copper and gold following the transition from the Grasberg open pit. As a result of regulatory uncertainty, PT-FI has slowed investments in its underground development projects in Assuming an agreement is reached to support PT-FI's long-term investment plans, estimated annual capital spending on these projects would average $1.0 billion per year ( $0.8 billion per year net to PT-FI) over the next five years. Considering the long-term nature and size of these projects, actual costs could vary from these estimates. In response to market conditions and Indonesian regulatory uncertainty, timing of these expenditures continues to be reviewed. If PT-FI is unable to reach agreement with the Indonesian government on its long-term mining rights, FCX intends to reduce or defer investments significantly in its underground development projects and pursue arbitration under its COW. Freeport-McMoRan 7
12 Operating Data. Following is summary consolidated operating data for the Indonesia mining operations for the second quarters and first six months of 2017 and 2016 : Three Months Ended June 30, Six Months Ended June 30, Copper (millions of recoverable pounds) Production Sales Average realized price per pound $ 2.67 $ 2.20 $ 2.64 $ 2.17 Gold (thousands of recoverable ounces) Production Sales Average realized price per ounce $ 1,243 $ 1,292 $ 1,242 $ 1,260 Unit net cash costs per pound of copper a Site production and delivery, excluding adjustments $ 1.80 b $ 1.77 $ 1.91 b $ 1.99 Gold and silver credits (2.21) (1.05) (2.10) (1.27) Treatment charges Export duties Royalty on metals Unit net cash costs $ 0.13 $ 1.20 $ 0.36 $ 1.22 a. For a reconciliation of unit net cash costs per pound to production and delivery costs applicable to sales reported in FCX's consolidated financial statements, refer to the supplemental schedules, "Product Revenues and Production Costs," beginning on page XIII, which are available on FCX's website, "fcx.com." b. Excludes fixed costs charged directly to production and delivery costs totaling $82 million ( $0.33 per pound of copper) for second-quarter 2017 and $103 million ( $0.28 per pound of copper) for the first six months of 2017 associated with workforce reductions. Beginning in mid-april 2017, PT-FI experienced a high level of worker absenteeism, which has unfavorably impacted mining and milling rates. During May 2017, a significant number of employees and contractors participated in an illegal strike and did not respond to PT-FI's multiple summons to return to work. As a result, these workers were deemed to have voluntarily resigned pursuant to Indonesian laws and regulations. During second-quarter 2017, PT-FI took steps to mitigate the impacts of worker absenteeism, including producing from available mine and mill stockpiles and selling concentrate in inventory produced in firstquarter PT-FI is also taking steps to increase its workforce in order to restore normal operating rates. In June 2017, production from the DMLZ underground mine, which is currently being developed, was impacted by mining-induced seismic activity. Mininginduced seismic activity is not uncommon in block cave mining. To mitigate the impact of these events, PT-FI has adjusted the DMLZ mine plans while it evaluates the appropriate start-up schedule. PT-FI expects DMLZ to ramp up to full capacity of 80,000 metric tons of ore per day in 2021, but at a slower pace than previous estimates. PT-FI is also evaluating opportunities to mine a section of high-grade ore from the Grasberg open pit in 2018 and 2019 currently planned to be mined in future periods from the Grasberg Block Cave underground mine. These plans are expected to be evaluated through the remainder of Indonesia's consolidated sales of 247 million pounds of copper and 427 thousand ounces of gold in second-quarter 2017 were higher than second-quarter 2016 sales of 196 million pounds of copper and 151 thousand ounces of gold, primarily reflecting the sale of concentrate in inventory and higher ore grades, partly offset by lower mill rates. Freeport-McMoRan 8
13 Assuming achieving planned operating rates for the second half of 2017, consolidated sales volumes from Indonesia mining are expected to approximate 1.0 billion pounds of copper and 1.6 million ounces of gold for the year 2017, compared with 1.1 billion pounds of copper and 1.1 million ounces of gold for the year A significant portion of PT-FI's costs are fixed and unit costs vary depending on production volumes and other factors. Indonesia's unit net cash costs (including gold and silver credits) of $0.13 per pound of copper in second-quarter 2017 were lower than unit net cash costs of $1.20 per pound in second-quarter 2016, primarily reflecting higher gold and silver credits. Assuming an average gold price of $1,250 per ounce for the second half of 2017 and achievement of current sales volume and cost estimates, unit net cash costs (net of gold and silver credits) for Indonesia mining are expected to approximate $0.13 per pound of copper for the year Indonesia mining's unit net cash credits for the year 2017 would change by approximately $0.05 per pound for each $50 per ounce change in the average price of gold. Because of the fixed nature of a large portion of Indonesia's costs, unit costs vary from quarter to quarter depending on copper and gold volumes. Indonesia mining's projected sales volumes are dependent on a number of factors, including operational performance, workforce productivity, the timing of shipments and its ability to continue to export copper concentrate. Molybdenum Mines. FCX has two wholly owned molybdenum mines in North America - the Henderson underground mine and the Climax open-pit mine, both in Colorado. The Henderson and Climax mines produce high-purity, chemical-grade molybdenum concentrate, which is typically further processed into value-added molybdenum chemical products. The majority of molybdenum concentrate produced at the Henderson and Climax mines, as well as from FCX's North America and South America copper mines, is processed at FCX's conversion facilities. Operating and Development Activities. In response to market conditions, the Henderson molybdenum mine continues to operate at reduced rates. Production from the Molybdenum mines totaled 8 million pounds of molybdenum in second-quarter 2017 and 7 million pounds in second-quarter Refer to summary operating data on page 3 for FCX's consolidated molybdenum sales, which includes sales of molybdenum produced at the Molybdenum mines, and from FCX's North America and South America copper mines. Average unit net cash costs for the Molybdenum mines of $7.81 per pound of molybdenum in second-quarter 2017 approximated second-quarter 2016 costs. Based on current sales volume and cost estimates, unit net cash costs for the Molybdenum mines are expected to average approximately $7.85 per pound of molybdenum for the year For a reconciliation of unit net cash costs per pound to production and delivery costs applicable to sales reported in FCX's consolidated financial statements, refer to the supplemental schedules, "Product Revenues and Production Costs," beginning on page XIII, which are available on FCX's website, "fcx.com." Mining Exploration Activities. FCX's mining exploration activities are generally associated with its existing mines, focusing on opportunities to expand reserves and resources to support development of additional future production capacity. Exploration results continue to indicate opportunities for significant future potential reserve additions in North America and South America. Exploration spending continues to be constrained by market conditions and is expected to approximate $70 million for the year 2017, compared to $44 million in CASH FLOWS, CASH and DEBT Operating Cash Flows. FCX generated operating cash flows of $1.0 billion (including $144 million in working capital sources and changes in tax payments) in second-quarter 2017 and $1.8 billion (including $322 million in working capital sources and changes in tax payments) for the first six months of Based on current sales volume and cost estimates, and assuming average prices of $2.65 per pound of copper, $1,250 per ounce of gold and $7.50 per pound of molybdenum for the second half of 2017, FCX's consolidated operating cash flows are estimated to approximate $3.8 billion for the year 2017 (including $0.6 billion in working capital sources and tax payments). The impact of price changes during the second half of 2017 on operating cash flows would approximate $180 million for each $0.10 per pound change in the average price of Freeport-McMoRan 9
14 copper, $40 million for each $50 per ounce change in the average price of gold and $40 million for each $2 per pound change in the average price of molybdenum. Refer to page 6 for discussion of Indonesian Regulatory Matters, which may have a significant impact on future results. Capital Expenditures. Capital expenditures totaled $362 million for second-quarter 2017 (including approximately $210 million for major mining projects) and $706 million for the first six months of 2017 (including approximately $420 million for major mining projects). Capital expenditures are expected to approximate $1.6 billion for the year 2017, including $0.9 billion for major mining projects, primarily for underground development activities at Grasberg. As a result of regulatory uncertainty, PT-FI has slowed investments in its underground development projects. If PT-FI is unable to reach an agreement with the Indonesian government on its long-term mining rights, FCX intends to reduce or defer investments significantly in underground development projects and pursue arbitration under its COW. Cash. Following is a summary of the U.S. and international components of consolidated cash and cash equivalents available to the parent company, net of noncontrolling interests' share, taxes and other costs at June 30, 2017 (in billions): Cash at domestic companies $ 3.8 Cash at international operations 0.9 Total consolidated cash and cash equivalents 4.7 Noncontrolling interests' share (0.2) Cash, net of noncontrolling interests' share 4.5 Withholding taxes and other (0.1) Net cash available $ 4.4 Debt. Following is a summary of total debt and the related weighted-average interest rates at June 30, 2017 (in billions, except percentages): Weighted- Average Interest Rate Senior Notes $ % Cerro Verde credit facility % Total debt $ % In June 2017, the Cerro Verde credit facility was amended to increase the commitment by $225 million to $1.5 billion, modify the amortization schedule and to extend the maturity date to June All other terms, including interest rates, remain the same. At June 30, 2017, FCX had no borrowings, $37 million in letters of credit issued and $3.5 billion available under its revolving credit facility. FINANCIAL POLICY In December 2015, FCX's common stock dividend was suspended. The declaration of dividends is at the discretion of the Board of Directors (Board) and will depend upon FCX s financial results, cash requirements, future prospects and other factors deemed relevant by the Board. Freeport-McMoRan 10
15 WEBCAST INFORMATION A conference call with securities analysts to discuss FCX's second-quarter 2017 results is scheduled for today at 10:00 a.m. Eastern Time. The conference call will be broadcast on the Internet along with slides. Interested parties may listen to the conference call live and view the slides by accessing fcx.com. A replay of the webcast will be available through Friday, August 25, FCX is a leading international mining company with headquarters in Phoenix, Arizona. FCX operates large, long-lived, geographically diverse assets with significant proven and probable reserves of copper, gold and molybdenum. FCX is the world's largest publicly traded copper producer. FCX s portfolio of assets includes the Grasberg minerals district in Indonesia, one of the world's largest copper and gold deposits; and significant mining operations in the Americas, including the large-scale Morenci minerals district in North America and the Cerro Verde operation in South America. Additional information about FCX is available on FCX's website at "fcx.com." CautionaryStatementandRegulationGDisclosure:This press release contains forward-looking statements in which FCX discusses its potential future performance. Forward-looking statements are all statements other than statements of historical facts, such as projections or expectations relating to ore grades and milling rates, production and sales volumes, unit net cash costs, operating cash flows, capital expenditures, exploration efforts and results, development and production activities and costs, liquidity, tax rates, the impact of copper, gold and molybdenum price changes, the impact of deferred intercompany profits on earnings, reserve estimates, future dividend payments, and share purchases and sales. The words anticipates, may, can, plans, believes, estimates, expects, projects, "targets," intends, likely, will, should, to be, potential" and any similar expressions are intended to identify those assertions as forward-looking statements. FCX cautions readers that forward-looking statements are not guarantees of future performance and actual results may differ materially from those anticipated, projected or assumed in the forward-looking statements. Important factors that can cause FCX's actual results to differ materially from those anticipated in the forward-looking statements include supply of and demand for, and prices of, copper, gold and molybdenum; mine sequencing; production rates; potential effects of cost and capital expenditure reductions and production curtailments on financial results and cash flow; potential inventory adjustments; potential impairment of long-lived mining assets; the outcome of negotiations with the Indonesian government regarding PT-FI's COW; the potential effects of violence in Indonesia generally and in the province of Papua; industry risks; regulatory changes (including adoption of financial assurance regulations as proposed by the U.S. Environmental Protection Agency under CERCLA for the hard rock mining industry); political risks; labor relations; weather- and climate-related risks; environmental risks; litigation results (including the final disposition of the unfavorable Indonesian Tax Court ruling relating to surface water taxes); and other factors described in more detail under the heading Risk Factors in FCX's Annual Report on Form 10-K for the year ended December 31, 2016, filed with the U.S. Securities and Exchange Commission (SEC) as updated by FCX's subsequent filings with the SEC. With respect to FCX's operations in Indonesia, such factors include whether PT-FI will be able to resolve complex regulatory matters in Indonesia. Investors are cautioned that many of the assumptions upon which FCX's forward-looking statements are based are likely to change after the forward-looking statements are made, including for example commodity prices, which FCX cannot control, and production volumes and costs, some aspects of which FCX may not be able to control. Further, FCX may make changes to its business plans that could affect its results. FCX cautions investors that it does not intend to update forward-looking statements more frequently than quarterly notwithstanding any changes in its assumptions, changes in business plans, actual experience or other changes, and FCX undertakes no obligation to update any forward-looking statements. This press release also contains certain financial measures such as unit net cash costs per pound of copper and molybdenum, which are not recognized under U.S. generally accepted accounting principles. As required by SEC Regulation G, reconciliations of these measures to amounts reported in FCX's consolidated financial statements are in the supplemental schedules of this press release, which are also available on FCX's website, "fcx.com." Freeport-McMoRan 11
16 FREEPORT-McMoRan INC. SELECTED OPERATING DATA Three Months Ended June 30, MINING OPERATIONS: Production Sales COPPER (millions of recoverable pounds) (FCX's net interest in %) North America Morenci (72%) a Bagdad (100%) Safford (100%) Sierrita (100%) Miami (100%) Chino (100%) Tyrone (100%) Other (100%) 2 2 Total North America South America Cerro Verde (53.56%) El Abra (51%) Total South America Indonesia Grasberg (90.64%) b Consolidated - continuing operations 883 1, Discontinued operations - Tenke Fungurume (Tenke) (56%) d Total 883 1, ,111 Less noncontrolling interests Net c 987 c Average realized price per pound (continuing operations) $ 2.65 $ 2.19 GOLD (thousands of recoverable ounces) (FCX's net interest in %) North America (100%) Indonesia (90.64%) b Consolidated Less noncontrolling interests Net Average realized price per ounce $ 1,243 $ 1,292 MOLYBDENUM (millions of recoverable pounds) (FCX's net interest in %) Henderson (100%) 3 3 N/A N/A Climax (100%) 5 4 N/A N/A North America copper mines (100%) a 8 8 N/A N/A Cerro Verde (53.56%) 7 4 N/A N/A Consolidated Less noncontrolling interests Net Average realized price per pound $ 9.58 $ 8.34 U.S. OIL AND GAS OPERATIONS: Sales Volumes Sales per Day Oil (thousand barrels, or MBbls) 468 8, Natural gas (million cubic feet or MMcf) 4,281 18, Natural gas liquids (NGLs) (MBbls) Thousand barrels of oil equivalents (MBOE) 1,244 12, a. Amounts are net of Morenci's undivided joint venture partners' interest; effective May 31, 2016, FCX's undivided interest in Morenci was prospectively reduced from 85 percent to 72 percent.
17 b. Amounts are net of Grasberg's joint venture partner's interest, which varies in accordance with the terms of the joint venture agreement. c. Consolidated sales volumes exclude purchased copper of 62 million pounds in second-quarter 2017 and 43 million pounds in second-quarter d. On November 16, 2016, FCX completed the sale of its interest in the Tenke mine. I
18 FREEPORT-McMoRan INC. SELECTED OPERATING DATA (continued) Six Months Ended June 30, MINING OPERATIONS: Production Sales Copper (millions of recoverable pounds) (FCX's net interest in %) North America Morenci (72%) a Bagdad (100%) Safford (100%) Sierrita (100%) Miami (100%) Chino (100%) Tyrone (100%) Other (100%) Total North America South America Cerro Verde (53.56%) El Abra (51%) Total South America Indonesia Grasberg (90.64%) b Consolidated - continuing operations 1,734 1,998 1,751 1,987 c Discontinued operations - Tenke (56%) d c Total 1,734 2,230 1,751 2,234 Less noncontrolling interests Net 1,418 1,780 1,437 1,786 Average realized price per pound (continuing operations) $ 2.65 $ 2.17 Gold (thousands of recoverable ounces) (FCX's net interest in %) North America (100%) Indonesia (90.64%) b Consolidated Less noncontrolling interests Net Average realized price per ounce $ 1,242 $ 1,259 Molybdenum (millions of recoverable pounds) (FCX's net interest in %) Henderson (100%) 6 5 N/A N/A Climax (100%) 10 9 N/A N/A North America (100%) a N/A N/A Cerro Verde (53.56%) 13 9 N/A N/A Consolidated Less noncontrolling interests Net Average realized price per pound $ 9.16 $ 7.99 U.S. OIL AND GAS OPERATIONS: Sales Volumes Sales per Day Oil (MBbls) , Natural gas (MMcf) 10,280 38, NGLs (MBbls) 151 1, MBOE 2,814 24, a. Amounts are net of Morenci's undivided joint venture partners' interest; effective May 31, 2016, FCX's undivided interest in Morenci was prospectively reduced from 85 percent to 72 percent.
19 b. Amounts are net of Grasberg's joint venture partner's interest, which varies in accordance with the terms of the joint venture agreement. c. Consolidated sales volumes exclude purchased copper of 120 million pounds for the first six months of 2017 and 70 million pounds for the first six months of d. On November 16, 2016, FCX completed the sale of its interest in the Tenke mine. II
20 FREEPORT-McMoRan INC. SELECTED OPERATING DATA (continued) Three Months Ended June 30, Six Months Ended June 30, % North America Copper Mines Solution Extraction/Electrowinning (SX/EW) Operations Leach ore placed in stockpiles (metric tons per day) 688, , , ,100 Average copper ore grade (percent) Copper production (millions of recoverable pounds) Mill Operations Ore milled (metric tons per day) 299, , , ,500 Average ore grades (percent): Copper Molybdenum Copper recovery rate (percent) Production (millions of recoverable pounds): Copper Molybdenum % South America Mining SX/EW Operations Leach ore placed in stockpiles (metric tons per day) 152, , , ,500 Average copper ore grade (percent) Copper production (millions of recoverable pounds) Mill Operations Ore milled (metric tons per day) 347, , , ,700 Average ore grades (percent): Copper Molybdenum Copper recovery rate (percent) Production (millions of recoverable pounds): Copper Molybdenum % Indonesia Mining Ore milled (metric tons per day): a Grasberg open pit 88, ,200 71, ,000 Deep Ore Zone underground mine 27,300 36,700 26,800 40,500 Deep Mill Level Zone (DMLZ) underground mine b 3,800 4,900 3,500 4,500 Grasberg Block Cave underground mine b 3,800 2,600 3,200 2,400 Big Gossan underground mine b 1, Total 123, , , ,000 Average ore grades: Copper (percent) Gold (grams per metric ton) Recovery rates (percent): Copper Gold Production (recoverable): Copper (millions of pounds) Gold (thousands of ounces) % Molybdenum Mines Ore milled (metric tons per day) 22,000 18,600 21,800 18,500 Average molybdenum ore grade (percent) Molybdenum production (millions of recoverable pounds) a. Amounts represent the approximate average daily throughput processed at PT Freeport Indonesia's (PT-FI) mill facilities from each producing mine and from development activities that result in metal production. b. Targeted production rates once the DMLZ underground mine reaches full capacity are expected to approximate 80,000 metric tons of ore per day in 2021; production from the Grasberg Block Cave underground mine is expected to commence in early 2019, and production from the Big Gossan underground mine is on care-and-maintenance.
21 III
22 FREEPORT-McMoRan INC. CONSOLIDATED STATEMENTS OF OPERATIONS (Unaudited) Three Months Ended Six Months Ended June 30, June 30, (In Millions, Except Per Share Amounts) Revenues a $ 3,711 $ 3,334 $ 7,052 $ 6,576 Cost of sales: Production and delivery b 2,495 c 2,956 4,695 c 5,455 Depreciation, depletion and amortization ,294 Impairment of oil and gas properties 291 4,078 Total cost of sales 2,945 3,879 5,534 10,827 Selling, general and administrative expenses d 107 c c 298 Mining exploration and research expenses Environmental obligations and shutdown costs (19) Net gain on sales of assets e (10) (749) (33) (749) Total costs and expenses 3,042 3,316 5,803 10,430 Operating income (loss) ,249 (3,854) Interest expense, net f (162) (196) (329) (387) Net (loss) gain on exchanges and early extinguishment of debt (4) 39 (3) 36 Other income, net Income (loss) from continuing operations before income taxes and equity in affiliated companies' net (losses) earnings 513 (114) 951 (4,141) Provision for income taxes g (186) (116) (360) (193) Equity in affiliated companies' net (losses) earnings (1) Net income (loss) from continuing operations 326 (229) 594 (4,326) Net income (loss) from discontinued operations h 9 (181) 47 (185) Net income (loss) 335 (410) 641 (4,511) Net income attributable to noncontrolling interests: Continuing operations (66) (47) (141) (109) Discontinued operations (1) (12) (4) (22) Preferred dividends attributable to redeemable noncontrolling interest (10) (21) Net income (loss) attributable to FCX common stock i $ 268 $ (479) $ 496 $ (4,663) Basic and diluted net income (loss) per share attributable to common stock: Continuing operations $ 0.18 $ (0.23) $ 0.31 $ (3.54) Discontinued operations (0.15) 0.03 (0.16) Weighted-average common shares outstanding: $ 0.18 $ (0.38) $ 0.34 $ (3.70) Basic 1,447 1,269 1,447 1,260 Diluted 1,453 1,269 1,453 1,260 a. Includes adjustments to provisionally priced concentrate and cathode copper sales recognized in prior periods, which are summarized in the supplemental schedule, "Derivative Instruments," on page X. b. Includes oil and gas net (credits) charges primarily associated with drillship settlements, inventory adjustments and asset impairment, which are summarized in the supplemental schedule, Adjusted Net Income (Loss), beginning on page VII. c. Includes net charges at mining operations primarily for workforce reductions at PT-FI, which are summarized in the supplemental schedule, "Adjusted Net Income (Loss)," beginning on page VII. d. Includes oil and gas net (credits) charges for contract termination and restructuring, which are summarized in the supplemental schedule, "Adjusted Net Income (Loss)," beginning on page VII. e. Refer to the supplemental schedule, "Adjusted Net Income (Loss)," beginning on page VII, for a summary of net gain on sales of assets. f. Consolidated interest expense, excluding capitalized interest, totaled $192 million in second-quarter 2017, $218 million in second-quarter 2016, $387 million for the first six months of 2017 and $436 million for the first six months of g. Refer to the supplemental schedule, "Income Taxes," on page IX for a summary of FCX's provision for income taxes. h. Refer to the supplemental schedule, Adjusted Net Income (Loss), beginning on page VII for a summary of gains (losses) on discontinued operations. i. FCX defers recognizing profits on intercompany sales until final sales to third parties occur. Refer to the supplemental schedule, "Deferred Profits," on page X for a summary of net impacts from changes in these deferrals. IV
23 FREEPORT-McMoRan INC. CONSOLIDATED BALANCE SHEETS (Unaudited) June 30, December 31, (In Millions) ASSETS Current assets: Cash and cash equivalents $ 4,667 $ 4,245 Trade accounts receivable 802 1,126 Income and other tax receivables Inventories: Mill and leach stockpiles 1,359 1,338 Materials and supplies, net 1,264 1,306 Product 1, Other current assets Held for sale Total current assets 10,417 10,435 Property, plant, equipment and mine development costs, net 23,067 23,219 Oil and gas properties, subject to amortization, less accumulated amortization and impairments Long-term mill and leach stockpiles 1,554 1,633 Other assets 1,957 1,956 Total assets $ 37,043 $ 37,317 LIABILITIES AND EQUITY Current liabilities: Accounts payable and accrued liabilities $ 1,880 $ 2,393 Current portion of debt 2,216 1,232 Current portion of environmental and asset retirement obligations Accrued income taxes Held for sale Total current liabilities 4,944 4,265 Long-term debt, less current portion 13,138 14,795 Deferred income taxes 3,870 3,768 Environmental and asset retirement obligations, less current portion 3,512 3,487 Other liabilities 1,586 1,745 Total liabilities 27,050 28,060 Equity: Stockholders' equity: Common stock Capital in excess of par value 26,734 26,690 Accumulated deficit (16,043) (16,540) Accumulated other comprehensive loss (456) (548) Common stock held in treasury (3,720) (3,708) Total stockholders' equity 6,673 6,051 Noncontrolling interests 3,320 3,206 Total equity 9,993 9,257 Total liabilities and equity $ 37,043 $ 37,317 V
24 FREEPORT-McMoRan INC. CONSOLIDATED STATEMENTS OF CASH FLOWS (Unaudited) Six Months Ended June 30, (In Millions) Cash flow from operating activities: Net income (loss) $ 641 $ (4,511) Adjustments to reconcile net income (loss) to net cash provided by operating activities: Depreciation, depletion and amortization 839 1,374 Impairment of oil and gas properties 4,078 Non-cash drillship settlements/idle rig costs and other oil and gas adjustments (33) 694 Net gain on sales of assets (33) (749) Stock-based compensation Net charges for environmental and asset retirement obligations, including accretion Payments for environmental and asset retirement obligations (59) (116) Net loss (gain) on exchanges and early extinguishment of debt 3 (36) Deferred income taxes (Gain) loss on disposal of discontinued operations (38) 177 Decrease (increase) in long-term mill and leach stockpiles 80 (99) Oil and gas contract settlement payments (70) Other, net (9) 18 Changes in working capital and tax payments, excluding amounts from dispositions: Accounts receivable Inventories (101) 190 Other current assets (2) (53) Accounts payable and accrued liabilities (267) 44 Accrued income taxes and changes in other tax payments Net cash provided by operating activities 1,829 1,614 Cash flow from investing activities: Capital expenditures: North America copper mines (67) (76) South America (45) (293) Indonesia (457) (453) Molybdenum mines (2) (1) Other, including oil and gas operations (135) (992) Net proceeds from the sale of additional interest in Morenci 996 Net proceeds from sales of other assets Other, net (8) (6) Net cash used in investing activities (710) (535) Cash flow from financing activities: Proceeds from debt 598 2,811 Repayments of debt (1,242) (3,649) Net proceeds from sale of common stock 32 Cash dividends paid: Common stock (2) (5) Noncontrolling interests (39) (39) Stock-based awards net payments (8) (5) Debt financing costs and other, net (11) (18) Net cash used in financing activities (704) (873) Net increase in cash and cash equivalents Decrease (increase) in cash and cash equivalents in assets held for sale 7 (53) Cash and cash equivalents at beginning of year 4, Cash and cash equivalents at end of period $ 4,667 $ 330
25 VI
26 FREEPORT-McMoRan INC. ADJUSTED NET INCOME (LOSS) Adjusted net income (loss) is intended to provide investors and others with information about FCX's recurring operating performance. This information differs from net income (loss) attributable to common stock determined in accordance with U.S. generally accepted accounting principles (GAAP) and should not be considered in isolation or as a substitute for measures of performance determined in accordance with U.S. GAAP. FCX's adjusted net income (loss) follows, which may not be comparable to similarly titled measures reported by other companies (in millions, except per share amounts). Three Months Ended June 30, Pre-tax After-tax Per Share Pre-tax After-tax Per Share Net income (loss) attributable to common stock N/A $ 268 $ 0.18 N/A $ (479) $ (0.38) Mining charges: PT-FI net charges for workforce reductions $ (87) a $ (46) $ (0.03) $ $ $ Inventory adjustments and asset impairment (9) (9) (0.01) (2) (2) Oil and gas charges: Drillship settlement/idle rig credits (costs) 6 b 6 (639) (639) (0.50) Inventory adjustments and asset impairment (53) (53) (0.04) Other contract termination credits 4 4 Restructuring charges (4) (4) (37) (37) (0.03) Impairment of oil and gas properties (291) (291) (0.23) Net adjustments to environmental obligations and related litigation reserves Net gain on sales of assets c Net (loss) gain on exchanges and early extinguishment of debt (4) (4) Net tax credits (charges) d N/A N/A (36) (0.03) Gain (loss) on discontinued operations e 10 8 (177) (177) (0.14) $ (44) $ 27 $ 0.01 $ (411) $ (452) $ (0.36) f Adjusted net income (loss) attributable to common stock N/A $ 241 $ 0.17 N/A $ (27) $ (0.02) a. Includes $82 million in production and delivery costs and $5 million in selling, general and administrative expenses. b. Reflects adjustments to the fair value of the contingent payments related to the 2016 drillship settlements. The 12-month contingency period associated with the drillship settlements ended June 30, 2017, and no additional amounts were paid. c. Net gains in second-quarter 2017 primarily reflect an adjustment of $13 million to assets held for sale, partly offset by a net charge of $2 million to adjust the estimated fair value of the potential $150 million in contingent consideration related to the December 2016 onshore California sale, which totaled $21 million at June 30, 2017, and in accordance with accounting guidelines, will continue to be adjusted through December 31, Second-quarter 2016 reflects gains associated with the sales of a 13 percent undivided interest in the Morenci unincorporated joint venture and an interest in the Timok exploration project in Serbia. d. Refer to Income Taxes, on page IX, for further discussion of net tax charges. e. The second-quarter 2017 gain primarily reflects an adjustment to the estimated fair value of the potential $120 million in contingent consideration related to the November 2016 sale of FCX s interest in TFHL, which totaled $55 million at June 30, 2017, and in accordance with accounting guidelines, will continue to be adjusted through December 31, Second-quarter 2016 reflects the estimated loss on the sale of FCX s interest in TFHL. f. Per share amount does not foot down because of rounding. VII
27 FREEPORT-McMoRan INC. ADJUSTED NET INCOME (LOSS) (continued) Six Months Ended June 30, Pre-tax After-tax Per Share Pre-tax After-tax Per Share Net income (loss) attributable to common stock N/A $ 496 $ 0.34 N/A $ (4,663) $ (3.70) Mining charges: PT-FI net charges for workforce reductions $ (108) a $ (57) $ (0.04) $ $ $ Inventory adjustments and asset impairment (28) (28) (0.02) (7) (7) (0.01) Oil and gas charges: Drillship settlements/idle rig credits (costs) 26 b (804) (804) (0.64) Inventory adjustments and asset impairment (88) (88) (0.07) Other contract termination charges (17) (17) (0.01) Restructuring charges (5) (5) (39) (39) (0.03) Impairment of oil and gas properties (4,078) (4,078) (3.24) Net adjustments to environmental obligations and related litigation reserves Net gain on sales of assets c Net (loss) gain on exchanges and early extinguishment of debt (3) (3) Net tax credits (charges) d N/A N/A (36) (0.03) Gain (loss) on discontinued operations e (177) (177) (0.14) $ (40) $ 34 $ 0.02 f $ (4,408) $ (4,449) $ (3.53) f Adjusted net income (loss) attributable to common stock N/A $ 462 $ 0.32 N/A $ (214) $ (0.17) a. Includes $103 million in production and delivery costs and $5 million in selling, general and administrative expenses. b. Reflects adjustments to the fair value of the contingent payments related to the 2016 drillship settlements. The 12-month contingency period associated with the drillship settlements ended June 30, 2017, and no additional amounts were paid. c. Net gains for the first six months of 2017 primarily reflect adjustments of $32 million associated with oil and gas transactions and an adjustment of $13 million to assets held for sale, partly offset by a net charge of $12 million to adjust the estimated fair value of the potential $150 million in contingent consideration related to the December 2016 onshore California sale, which totaled $21 million at June 30, 2017, and in accordance with accounting guidelines, will continue to be adjusted through December 31, The first six months of 2016 reflects gains associated with the sales of a 13 percent undivided interest in the Morenci unincorporated joint venture and an interest in the Timok exploration project in Serbia. d. Refer to Income Taxes, on page IX, for further discussion of net tax charges. e. The gain for the first six months of 2017 primarily reflects an adjustment to the estimated fair value of the potential $120 million in contingent consideration related to the November 2016 sale of FCX s interest in TFHL, which totaled $55 million at June 30, 2017, and in accordance with accounting guidelines, will continue to be adjusted through December 31, The first six months of 2016 reflects the estimated loss on the sale of FCX s interest in TFHL. f. Per share amount does not foot down because of rounding. VIII
28 FREEPORT-McMoRan INC. INCOME TAXES Following is a summary of the approximate amounts used in the calculation of FCX's consolidated income tax provision for the second quarters and first six months of 2017 and 2016 (in millions, except percentages): Three Months Ended June 30, Income Tax Income Tax Effective (Provision) Income Effective (Provision) Income a Tax Rate Benefit (Loss) a Tax Rate Benefit U.S. $ 51 (61)% $ 31 b $ (81) (68)% $ (55) b South America % (58) % (43) Indonesia % (135) 73 25% (18) Impairment of oil and gas properties N/A (291) 37% 108 Valuation allowance, net N/A N/A (108) c Eliminations and other 1 N/A (23) 79 N/A (22) Rate adjustment d N/A (1) N/A 22 Continuing operations $ % $ (186) $ (114) (102)% $ (116) Six Months Ended June 30, Income Tax U.S. $ 61 (39)% $ 24 Income Tax Effective (Provision) Income Effective (Provision) Income a Tax Rate Benefit (Loss) a Tax Rate Benefit b $ (535) (7)% $ (39) b South America % (159) % (82) Indonesia % (202) % (54) Impairment of oil and gas properties N/A (4,078) 38% 1,543 Valuation allowance, net N/A N/A (1,543) c Eliminations and other 17 N/A (24) 89 N/A (25) Rate adjustment d N/A 1 N/A 7 Continuing operations $ % e $ (360) $ (4,141) (5)% $ (193) a. Represents income (loss) from continuing operations by geographic location before income taxes and equity in affiliated companies' net (losses) earnings. b. Includes net tax credits of $32 million for second-quarter 2017 and $31 million for the first six months of 2017 associated with anticipated recovery of alternative minimum tax credit carryforwards. The second quarter and first six months of 2016 includes net tax charges of $36 million associated with net operating loss carryback claims, partly offset by alternative minimum tax credits. c. As a result of the impairment to U.S. oil and gas properties, FCX recorded tax charges to establish valuation allowances against U.S. federal and state deferred tax assets that will not generate a future benefit. d. In accordance with applicable accounting rules, FCX adjusts its interim provision for income taxes equal to its consolidated tax rate. e. The consolidated effective income tax rate is a function of the combined effective tax rates for the jurisdictions in which FCX operates. Accordingly, variations in the relative proportions of jurisdictional income result in fluctuations to FCX's consolidated effective income tax rate. Assuming achievement of current sales volume and cost estimates and average prices of $2.65 per pound for copper, $1,250 per ounce for gold and $7.50 per pound for molybdenum for the second half of 2017, FCX estimates its consolidated effective tax rate for the year 2017 will approximate 43 percent and would decrease with higher prices. IX
29 FREEPORT-McMoRan INC. DERIVATIVE INSTRUMENTS During the first six months of 2017, FCX's mined copper was sold 55 percent in concentrate, 20 percent as cathode and 25 percent as rod from North America operations. Under the long-established structure of sales agreements prevalent in the industry, copper contained in concentrates and cathodes is provisionally priced at the time of shipment. The provisional prices are finalized in a contractually specified future month (generally one to four months from the shipment date) primarily based on quoted monthly average spot copper prices on the London Metal Exchange (LME). Because a significant portion of FCX's copper concentrate and cathode sales in any quarterly period usually remain subject to final pricing, the quarter-end forward price is a major determinant of recorded revenues and the average recorded copper price for the period. LME spot copper prices averaged $2.57 per pound during second-quarter 2017, compared to FCX's average realized price of $2.65 per pound. Following is a summary of the (unfavorable) favorable adjustments to prior periods' provisionally priced copper sales for the second quarters and first six months of 2017 and 2016 (in millions, except per share amounts): Three Months Ended June 30, Six Months Ended June 30, Revenues $ (20) $ (28) $ 81 $ 5 Net income attributable to common stock $ (8) $ (15) $ 35 $ 2 Net income per share of common stock $ (0.01) $ (0.01) $ 0.02 $ At June 30, 2017, FCX had provisionally priced copper sales at its copper mining operations totaling 344 million pounds of copper (net of intercompany sales and noncontrolling interests) recorded at an average of $2.69 per pound, subject to final pricing over the next several months. FCX estimates that each $0.05 change in the price realized from the June 30, 2017, provisional price recorded would have an approximate $11 million effect on 2017 net income attributable to common stock. The LME spot copper price closed at $2.72 per pound on July 24, DEFERRED PROFITS FCX defers recognizing profits on sales from its mining operations to Atlantic Copper and on 25 percent of PT-FI's sales to PT Smelting (PT-FI's 25 percent-owned Indonesian smelting unit) until final sales to third parties occur. Changes in these deferrals attributable to variability in intercompany volumes resulted in net reductions to net income attributable to common stock totaling $51 million in second-quarter 2017, $13 million in second-quarter 2016, $24 million for the first six months of 2017 and $11 million for the first six months of FCX's net deferred profits on its inventories at Atlantic Copper and PT Smelting to be recognized in future periods' net income attributable to common stock totaled $68 million at June 30, Quarterly variations in ore grades, the timing of intercompany shipments and changes in product prices will result in variability in FCX's net deferred profits and quarterly earnings. BUSINESS SEGMENTS FCX has organized its mining operations into four primary divisions North America copper mines, South America mining, Indonesia mining and Molybdenum mines, and operating segments that meet certain thresholds are reportable segments. Separately disclosed in the following tables are FCX's reportable segments, which include the Morenci, Cerro Verde and Grasberg copper mines, the Rod & Refining operations and Atlantic Copper Smelting & Refining. FCX s reportable segments previously included U.S. Oil & Gas operations. During 2016, FCX completed the sales of its Deepwater Gulf of Mexico, onshore California and Haynesville oil and gas properties, and in first-quarter 2017, completed the sale of its Madden property interests. The results of FCX's U.S. oil and gas operations have been included in Corporate, Other & Eliminations in the following tables. Intersegment sales between FCX s business segments are based on similar arms-length transactions with third parties at the time of the sale. Intersegment sales may not be reflective of the actual prices ultimately realized because of a variety of factors, including additional processing, the timing of sales to unaffiliated customers and transportation premiums. FCX allocates certain operating costs, expenses and capital expenditures to its operating divisions and individual segments. However, not all costs and expenses applicable to an operation are allocated. U.S. federal and state income taxes are recorded and managed at the corporate level (included in Corporate, Other & Eliminations), whereas foreign income taxes are recorded and managed at the applicable country level. In addition, most mining exploration and research activities are managed on a consolidated basis, and those costs along with some selling, general and administrative costs are not allocated to the operating divisions or individual segments. Accordingly, the following segment information reflects management determinations that may not be indicative of what the actual financial performance of each operating division or segment would be if it was an independent entity. X
30 FREEPORT-McMoRan INC. BUSINESS SEGMENTS (continued) (In millions) Atlantic Corporate, North America Copper Mines South America Mining Copper Other Other Cerro Other Indonesia Molybdenum Rod & Smelting & Elimi- FCX Morenci Mines Total Verde Mines Total Mining Mines Refining & Refining nations a Total Three Months Ended June 30, 2017 Revenues: b c Unaffiliated customers $ 45 $ 32 $ 77 $ 567 $ 111 $ 678 $ 1,065 $ $ 1,046 $ 400 $ 445 $3,711 Intersegment , (1,205) Production and delivery , (754) 2,495 Depreciation, depletion and amortization Selling, general and administrative d expenses Mining exploration and research expenses Environmental obligations and shutdown costs (19) (19) Net gain on sales of assets (10) (10) Operating income (loss) (7) 1 (11) (89) 669 d e Interest expense, net Provision for (benefit from) income taxes (10) 186 Total assets at June 30, ,830 4,314 7,144 8,828 1,479 10,307 11,154 1, ,546 Capital expenditures f g 37, Three Months Ended June 30, 2016 Revenues: b c Unaffiliated customers $ 79 $ 43 $ 122 $ 494 $ 123 $ 617 $ 532 $ $ 919 $ 493 $ 651 $3,334 Intersegment (1) h (1,051) Production and delivery ,956 Depreciation, depletion and amortization Impairment of oil and gas properties Selling, general and administrative i expenses Mining exploration and research expenses Environmental obligations and shutdown costs Net gain on sale of assets (577) (577) (172) (749) Operating income (loss) (7) (22) 4 18 (950) 18 e Interest expense, net Provision for (benefit from) income taxes 45 (2) Total assets at June 30, ,960 4,676 7,636 9,330 1,609 10,939 9,499 1, ,429 Capital expenditures a. Includes U.S. oil and gas operations, which were previously a reportable segment. b. Includes PT-FI's sales to PT Smelting totaling $536 million in second-quarter 2017 and $287 million in second-quarter c. Includes revenues from FCX's molybdenum sales company, which includes sales of molybdenum produced by the Molybdenum mines and certain of the North America and South America copper mines. d. Includes net charges at PT-FI associated with workforce reductions totaling $82 million in production and delivery costs and $5 million in selling, general and administrative expenses. e. Includes net credits (charges) for oil and gas operations totaling $6 million in second-quarter 2017, primarily associated with adjustments to the fair value of contingent payments for the 2016 drillship settlements and $(692) million in second-quarter 2016 for drillship settlements, inventory adjustments and asset impairment. f. Includes assets held for sale totaling $463 million at June 30, 2017, primarily associated with Freeport Cobalt and the Kisanfu exploration project, and $5.1 billion at June 30, 2016, which also included the Tenke disposal group. Also includes assets associated with oil and gas operations totaling $316 million at June 30, 2017, and $3.9 billion at June 30, g. Includes $14 million in second-quarter 2017 and $392 million in second-quarter 2016 associated with oil and gas operations. Second-quarter 2016 also includes $20 million associated with discontinued operations. h. Reflects net reductions for provisional pricing adjustments to prior period open sales. There were no intersegment sales from Grasberg in second-quarter i. Includes other oil and gas net charges of $37 million in second-quarter 2016 for restructuring. XI f g 41,
31 FREEPORT-McMoRan INC. BUSINESS SEGMENTS (continued) (In millions) Atlantic Corporate North America Copper Mines South America Mining Copper Other Other Cerro Other Indonesia Molybdenum Rod & Smelting & Elimi- FCX Morenci Mines Total Verde Mines Total Mining Mines Refining & Refining nations a Total Six Months Ended June 30, 2017 Revenues: b c Unaffiliated customers $ 111 $ 82 $ 193 $1,207 $ 223 $1,430 $ 1,599 $ $ 2,153 $ 858 $ 819 $7,052 Intersegment 894 1,156 2, (2,371) d Production and delivery , , (1,571) 4,695 Depreciation, depletion and amortization Selling, general and administrative e g expenses Mining exploration and research expenses Environmental obligations and shutdown costs 8 8 Net gain on sales of assets (33) (33) Operating income (loss) (15) 4 (1) (226) 1,249 e f Interest expense, net Provision for (benefit from) income taxes (4) 360 Capital expenditures h 706 Six Months Ended June 30, 2016 Revenues: b c Unaffiliated customers $ 241 $ 99 $ 340 $ 980 $ 267 $1,247 $ 1,030 $ $ 1,890 $ 915 $ 1,154 $6,576 Intersegment 761 1,095 1, (2,122) Production and delivery , , (475) 5,455 Depreciation, depletion and amortization ,294 Impairment of oil and gas properties 4,078 4,078 Selling, general and administrative g expenses Mining exploration and research expenses Environmental obligations and shutdown costs Net gain on sales of assets (577) (577) (172) (749) Operating income (loss) (13) (48) (5,217) (3,854) f Interest expense, net Provision for (benefit from) income taxes 90 (8) Capital expenditures a. Includes U.S. oil and gas operations, which were previously a reportable segment. b. Includes PT-FI's sales to PT Smelting totaling $794 million for the first six months of 2017 and $564 million for the first six months of c. Includes revenues from FCX's molybdenum sales company, which includes sales of molybdenum produced by the Molybdenum mines and certain of the North America and South America copper mines. d. Includes asset impairment charges totaling $21 million. e. Includes net charges at PT-FI associated with workforce reductions totaling $103 million in production and delivery costs and $5 million in selling, general and administrative expenses. f. Includes net credits (charges) for oil and gas operations totaling $26 million for the first six months of 2017, primarily associated with adjustments to the fair value of the contingent payments for the 2016 drillship settlements and $(892) million for the first six months of 2016 for drillship settlement/idle rig costs, inventory adjustments and asset impairment. g. Includes other oil and gas charges of $17 million for the first six months of 2017 for other contract termination and $39 million for the first six months of 2016 for net restructuring charges. h. Includes $33 million for the first six months of 2017 and $915 million for the first six months of 2016 associated with oil and gas operations. The first six months of 2016 also includes $55 million associated with discontinued operations. h 1,815 XII
32 FREEPORT-McMoRan INC. PRODUCT REVENUES AND PRODUCTION COSTS Unit net cash costs per pound of copper and molybdenum are measures intended to provide investors with information about the cash-generating capacity of FCX's mining operations expressed on a basis relating to the primary metal product for the respective operations. FCX uses this measure for the same purpose and for monitoring operating performance by its mining operations. This information differs from measures of performance determined in accordance with U.S. GAAP and should not be considered in isolation or as a substitute for measures of performance determined in accordance with U.S. GAAP. These measures are presented by other metals mining companies, although FCX's measures may not be comparable to similarly titled measures reported by other companies. FCX presents gross profit per pound of copper in the following tables using both a by-product method and a co-product method. FCX uses the by-product method in its presentation of gross profit per pound of copper because (i) the majority of its revenues are copper revenues, (ii) it mines ore, which contains copper, gold, molybdenum and other metals, (iii) it is not possible to specifically assign all of FCX's costs to revenues from the copper, gold, molybdenum and other metals it produces and (iv) it is the method used by FCX's management and Board to monitor FCX's mining operations and to compare mining operations in certain industry publications. In the co-product method presentations, shared costs are allocated to the different products based on their relative revenue values, which will vary to the extent FCX's metals sales volumes and realized prices change. FCX shows revenue adjustments for prior period open sales as a separate line item. Because these adjustments do not result from current period sales, these amounts have been reflected separately from revenues on current period sales. Noncash and other costs, which are removed from site production and delivery costs in the calculation of unit net cash costs, consist of items such as stock-based compensation costs, start-up costs, inventory adjustments, long-lived asset impairments, restructuring and/or unusual charges. As discussed above, gold, molybdenum and other metal revenues at copper mines are reflected as credits against site production and delivery costs in the by-product method. The following schedules are presentations under both the by-product and co-product methods together with reconciliations to amounts reported in FCX's consolidated financial statements. XIII
33 FREEPORT-McMoRan INC. PRODUCT REVENUES AND PRODUCTION COSTS (continued) North America Copper Mines Product Revenues, Production Costs and Unit Net Cash Costs Three Months Ended June 30, 2017 (In millions) By-Product Co-Product Method Method Copper Molybdenum a Other b Total Revenues, excluding adjustments $ 1,068 $ 1,068 $ 63 $ 23 $ 1,154 Site production and delivery, before net noncash and other costs shown below By-product credits (65) Treatment charges Net cash costs Depreciation, depletion and amortization (DD&A) Noncash and other costs, net Total costs Revenue adjustments, primarily for pricing on prior period open sales (2) (2) (2) Gross profit $ 305 $ 290 $ 10 $ 5 $ 305 Copper sales (millions of recoverable pounds) Molybdenum sales (millions of recoverable pounds) a 8 Gross profit per pound of copper/molybdenum: Revenues, excluding adjustments $ 2.62 $ 2.62 $ 8.17 Site production and delivery, before net noncash and other costs shown below By-product credits (0.16) Treatment charges Unit net cash costs DD&A Noncash and other costs, net Total unit costs Revenue adjustments, primarily for pricing on prior period open sales Gross profit per pound $ 0.75 $ 0.71 $ 1.31 Reconciliation to Amounts Reported (In millions) Production Revenues and Delivery DD&A Totals presented above $ 1,154 $ 671 $ 117 Treatment charges (19) 21 Noncash and other costs, net 19 Revenue adjustments, primarily for pricing on prior period open sales (2) Eliminations and other North America copper mines 1, Other mining c 3,323 2, Corporate, other & eliminations (760) (754) 25 As reported in FCX's consolidated financial statements $ 3,711 $ 2,495 $ 450 a. Reflects sales of molybdenum produced by certain of the North America copper mines to FCX's molybdenum sales company at market-based pricing. b. Includes gold and silver product revenues and production costs. c. Represents the combined total for FCX's other mining operations, including South America mining, Indonesia mining, Molybdenum mines, Rod & Refining and Atlantic Copper Smelting & Refining, as presented in the supplemental schedule, "Business Segments," beginning on page X. XIV
34 FREEPORT-McMoRan INC. PRODUCT REVENUES AND PRODUCTION COSTS (continued) North America Copper Mines Product Revenues, Production Costs and Unit Net Cash Costs Three Months Ended June 30, 2016 (In millions) By-Product Co-Product Method Method Copper Molybdenum a Other b Total Revenues, excluding adjustments $ 1,010 $ 1,010 $ 50 $ 20 $ 1,080 Site production and delivery, before net noncash and other costs shown below By-product credits (50) Treatment charges Net cash costs DD&A Noncash and other costs, net Total costs Revenue adjustments, primarily for pricing on prior period open sales (7) (7) (7) Gross profit $ 201 $ 191 $ 5 $ 5 $ 201 Copper sales (millions of recoverable pounds) Molybdenum sales (millions of recoverable pounds) a 8 Gross profit per pound of copper/molybdenum: Revenues, excluding adjustments $ 2.18 $ 2.18 $ 5.92 Site production and delivery, before net noncash and other costs shown below By-product credits (0.11) Treatment charges Unit net cash costs DD&A Noncash and other costs, net Total unit costs Revenue adjustments, primarily for pricing on prior period open sales (0.01) (0.01) Gross profit per pound $ 0.43 $ 0.41 $ 0.56 Reconciliation to Amounts Reported (In millions) Production Revenues and Delivery DD&A Totals presented above $ 1,080 $ 667 $ 134 Treatment charges (24) 25 Noncash and other costs, net 22 Revenue adjustments, primarily for pricing on prior period open sales (7) Eliminations and other North America copper mines 1, Other mining c 2,674 2, Corporate, other & eliminations (400) As reported in FCX's consolidated financial statements $ 3,334 $ 2,956 $ 632 a. Reflects sales of molybdenum produced by certain of the North America copper mines to FCX's molybdenum sales company at market-based pricing. b. Includes gold and silver product revenues and production costs. c. Represents the combined total for FCX's other mining operations, including South America mining, Indonesia mining, Molybdenum mines, Rod & Refining and Atlantic Copper Smelting & Refining, as presented in the supplemental schedule, "Business Segments," beginning on page X. XV
35 FREEPORT-McMoRan INC. PRODUCT REVENUES AND PRODUCTION COSTS (continued) North America Copper Mines Product Revenues, Production Costs and Unit Net Cash Costs Six Months Ended June 30, 2017 (In millions) By-Product Co-Product Method Method Copper Molybdenum a Other b Total Revenues, excluding adjustments $ 2,072 $ 2,072 $ 122 $ 43 $ 2,237 Site production and delivery, before net noncash and other costs shown below 1,218 1, ,261 By-product credits (122) Treatment charges Net cash costs 1,178 1, ,343 DD&A Noncash and other costs, net 53 c Total costs 1,464 1, ,629 Revenue adjustments, primarily for pricing on prior period open sales Gross profit $ 612 $ 580 $ 20 $ 12 $ 612 Copper sales (millions of recoverable pounds) Molybdenum sales (millions of recoverable pounds) a 17 Gross profit per pound of copper/molybdenum: Revenues, excluding adjustments $ 2.65 $ 2.65 $ 7.56 Site production and delivery, before net noncash and other costs shown below By-product credits (0.15) Treatment charges Unit net cash costs DD&A Noncash and other costs, net 0.07 c Total unit costs Revenue adjustments, primarily for pricing on prior period open sales Gross profit per pound $ 0.78 $ 0.74 $ 1.26 Reconciliation to Amounts Reported (In millions) Production Revenues and Delivery DD&A Totals presented above $ 2,237 $ 1,261 $ 233 Treatment charges (28) 54 Noncash and other costs, net 53 Revenue adjustments, primarily for pricing on prior period open sales 4 Eliminations and other North America copper mines 2,243 1, Other mining d 6,361 4, Corporate, other & eliminations (1,552) (1,571) 54 As reported in FCX's consolidated financial statements $ 7,052 $ 4,695 $ 839 a. Reflects sales of molybdenum produced by certain of the North America copper mines to FCX's molybdenum sales company at market-based pricing. b. Includes gold and silver product revenues and production costs. c. Includes $21 million ( $0.03 per pound of copper) for asset impairment charges at Morenci. d. Represents the combined total for FCX's other mining operations, including South America mining, Indonesia mining, Molybdenum mines, Rod & Refining and Atlantic Copper Smelting & Refining, as presented in the supplemental schedule, "Business Segments," beginning on page X. XVI
36 FREEPORT-McMoRan INC. PRODUCT REVENUES AND PRODUCTION COSTS (continued) North America Copper Mines Product Revenues, Production Costs and Unit Net Cash Costs Six Months Ended June 30, 2016 (In millions) By-Product Co-Product Method Method Copper Molybdenum a Other b Total Revenues, excluding adjustments $ 2,092 $ 2,092 $ 90 $ 41 $ 2,223 Site production and delivery, before net noncash and other costs shown below 1,349 1, ,388 By-product credits (92) Treatment charges Net cash costs 1,360 1, ,491 DD&A Noncash and other costs, net Total costs 1,685 1, ,816 Revenue adjustments, primarily for pricing on prior period open sales (1) (1) (1) Gross profit $ 406 $ 386 $ 9 $ 11 $ 406 Copper sales (millions of recoverable pounds) Molybdenum sales (millions of recoverable pounds) a 16 Gross profit per pound of copper/molybdenum: Revenues, excluding adjustments $ 2.17 $ 2.17 $ 5.61 Site production and delivery, before net noncash and other costs shown below By-product credits (0.10) Treatment charges Unit net cash costs DD&A Noncash and other costs, net Total unit costs Revenue adjustments, primarily for pricing on prior period open sales Gross profit per pound $ 0.42 $ 0.40 $ 0.53 Reconciliation to Amounts Reported (In millions) Production Revenues and Delivery DD&A Totals presented above $ 2,223 $ 1,388 $ 277 Treatment charges (48) 55 Noncash and other costs, net 48 Revenue adjustments, primarily for pricing on prior period open sales (1) Eliminations and other North America copper mines 2,196 1, Other mining c 5,348 4, Corporate, other & eliminations (968) (475) 518 As reported in FCX's consolidated financial statements $ 6,576 $ 5,455 $ 1,294 a. Reflects sales of molybdenum produced by certain of the North America copper mines to FCX's molybdenum sales company at market-based pricing. b. Includes gold and silver product revenues and production costs. c. Represents the combined total for FCX's other mining operations, including South America mining, Indonesia mining, Molybdenum mines, Rod & Refining and Atlantic Copper Smelting & Refining, as presented in the supplemental schedule, "Business Segments," beginning on page X. XVII
37 FREEPORT-McMoRan INC. PRODUCT REVENUES AND PRODUCTION COSTS (continued) South America Mining Product Revenues, Production Costs and Unit Net Cash Costs Three Months Ended June 30, 2017 (In millions) By-Product Co-Product Method Method Copper Other a Total Revenues, excluding adjustments $ 766 $ 766 $ 47 $ 813 Site production and delivery, before net noncash and other costs shown below By-product credits (37) Treatment charges Royalty on metals Net cash costs DD&A Noncash and other costs, net Total costs Revenue adjustments, primarily for pricing on prior period open sales (14) (14) (14) Gross profit $ 146 $ 140 $ 6 $ 146 Copper sales (millions of recoverable pounds) Gross profit per pound of copper: Revenues, excluding adjustments $ 2.67 $ 2.67 Site production and delivery, before net noncash and other costs shown below By-product credits (0.13) Treatment charges Royalty on metals Unit net cash costs DD&A Noncash and other costs, net Total unit costs Revenue adjustments, primarily for pricing on prior period open sales (0.05) (0.05) Gross profit per pound $ 0.51 $ 0.49 Reconciliation to Amounts Reported (In millions) Production Revenues and Delivery DD&A Totals presented above $ 813 $ 458 $ 125 Treatment charges (63) Royalty on metals (2) Noncash and other costs, net 5 Revenue adjustments, primarily for pricing on prior period open sales (14) Eliminations and other 1 South America mining Other mining b 3,736 2, Corporate, other & eliminations (760) (754) 25 As reported in FCX's consolidated financial statements $ 3,711 $ 2,495 $ 450 a. Includes silver sales of 848 thousand ounces ( $17.97 per ounce average realized price). Also reflects sales of molybdenum produced by Cerro Verde to FCX's molybdenum sales company at market-based pricing. b. Represents the combined total for FCX's other mining operations, including North America copper mines, Indonesia mining, Molybdenum mines, Rod & Refining and Atlantic Copper Smelting & Refining, as presented in the supplemental schedule, "Business Segments," beginning on page X.
38 XVIII
39 FREEPORT-McMoRan INC. PRODUCT REVENUES AND PRODUCTION COSTS (continued) South America Mining Product Revenues and Production Costs and Unit Net Cash Costs Three Months Ended June 30, 2016 (In millions) By-Product Co-Product Method Method Copper Other a Total Revenues, excluding adjustments $ 715 $ 715 $ 51 $ 766 Site production and delivery, before net noncash and other costs shown below By-product credits (40) Treatment charges Royalty on metals Net cash costs DD&A Noncash and other costs, net Total costs Revenue adjustments, primarily for pricing on prior period open sales (11) (11) (11) Gross profit $ 134 $ 125 $ 9 $ 134 Copper sales (millions of recoverable pounds) Gross profit per pound of copper: Revenues, excluding adjustments $ 2.19 $ 2.19 Site production and delivery, before net noncash and other costs shown below By-product credits (0.12) Treatment charges Royalty on metals Unit net cash costs DD&A Noncash and other costs, net Total unit costs Revenue adjustments, primarily for pricing on prior period open sales (0.04) (0.04) Gross profit per pound $ 0.41 $ 0.38 Reconciliation to Amounts Reported (In millions) Production Revenues and Delivery DD&A Totals presented above $ 766 $ 402 $ 136 Treatment charges (76) Royalty on metals (2) Noncash and other costs, net 5 Revenue adjustments, primarily for pricing on prior period open sales (11) Eliminations and other (1) South America mining Other mining b 3,057 2, Corporate, other & eliminations (400) As reported in FCX's consolidated financial statements $ 3,334 $ 2,956 $ 632 a. Includes silver sales of 911 thousand ounces ( $17.50 per ounce average realized price). Also reflects sales of molybdenum produced by Cerro Verde to FCX's molybdenum sales company at market-based pricing. b. Represents the combined total for FCX's other mining operations, including North America copper mines, Indonesia mining, Molybdenum mines, Rod & Refining and Atlantic Copper Smelting & Refining, as presented in the supplemental schedule, "Business Segments," beginning on page X. XIX
40 FREEPORT-McMoRan INC. PRODUCT REVENUES AND PRODUCTION COSTS (continued) South America Copper Mines Product Revenues, Production Costs and Unit Net Cash Costs Six Months Ended June 30, 2017 (In millions) By-Product Co-Product Method Method Copper Other a Total Revenues, excluding adjustments $ 1,581 $ 1,581 $ 115 $ 1,696 Site production and delivery, before net noncash and other costs shown below By-product credits (93) Treatment charges Royalty on metals Net cash costs ,061 DD&A Noncash and other costs, net Total costs 1,214 1, ,329 Revenue adjustments, primarily for pricing on prior period open sales Gross profit $ 408 $ 387 $ 21 $ 408 Copper sales (millions of recoverable pounds) Gross profit per pound of copper: Revenues, excluding adjustments $ 2.65 $ 2.65 Site production and delivery, before net noncash and other costs shown below By-product credits (0.16) Treatment charges Royalty on metals Unit net cash costs DD&A Noncash and other costs, net Total unit costs Revenue adjustments, primarily for pricing on prior period open sales Gross profit per pound $ 0.68 $ 0.65 Reconciliation to Amounts Reported (In millions) Production Revenues and Delivery DD&A Totals presented above $ 1,696 $ 927 $ 258 Treatment charges (130) Royalty on metals (4) Noncash and other costs, net 10 Revenue adjustments, primarily for pricing on prior period open sales 41 Eliminations and other (1) South America mining 1, Other mining b 7,001 5, Corporate, other & eliminations (1,552) (1,571) 54 As reported in FCX's consolidated financial statements $ 7,052 $ 4,695 $ 839 a. Includes silver sales of 1.8 million ounces ( $16.95 per ounce average realized price). Also reflects sales of molybdenum produced by Cerro Verde to FCX's molybdenum sales company at market-based pricing. b. Represents the combined total for FCX's other mining operations, including North America copper mines, Indonesia mining, Molybdenum mines, Rod & Refining and Atlantic Copper Smelting & Refining, as presented in the supplemental schedule, "Business Segments," beginning on page X.
41 XX
42 FREEPORT-McMoRan INC. PRODUCT REVENUES AND PRODUCTION COSTS (continued) South America Copper Mines Product Revenues, Production Costs and Unit Net Cash Costs Six Months Ended June 30, 2016 (In millions) By-Product Co-Product Method Method Copper Other a Total Revenues, excluding adjustments $ 1,414 $ 1,414 $ 80 $ 1,494 Site production and delivery, before net noncash and other costs shown below By-product credits (62) Treatment charges Royalty on metals Net cash costs DD&A Noncash and other costs, net Total costs 1,160 1, ,240 Revenue adjustments, primarily for pricing on prior period open sales Gross profit $ 262 $ 249 $ 13 $ 262 Copper sales (millions of recoverable pounds) Gross profit per pound of copper: Revenues, excluding adjustments $ 2.18 $ 2.18 Site production and delivery, before net noncash and other costs shown below By-product credits (0.10) Treatment charges Royalty on metals Unit net cash costs DD&A Noncash and other costs, net Total unit costs Revenue adjustments, primarily for pricing on prior period open sales Gross profit per pound $ 0.40 $ 0.38 Reconciliation to Amounts Reported (In millions) Production Revenues and Delivery DD&A Totals presented above $ 1,494 $ 807 $ 267 Treatment charges (151) Royalty on metals (3) Noncash and other costs, net 12 Revenue adjustments, primarily for pricing on prior period open sales 8 Eliminations and other (3) 1 South America mining 1, Other mining b 6,196 5, Corporate, other & eliminations (968) (475) 518 As reported in FCX's consolidated financial statements $ 6,576 $ 5,455 $ 1,294 a. Includes silver sales of 1.8 million ounces ( $16.03 per ounce average realized price). Also reflects sales of molybdenum produced by Cerro Verde to FCX's molybdenum sales company at market-based pricing. b. Represents the combined total for FCX's other mining operations, including North America copper mines, Indonesia mining, Molybdenum mines, Rod & Refining and Atlantic Copper Smelting & Refining, as presented in the supplemental schedule, "Business Segments," beginning on page X XXI
43 FREEPORT-McMoRan INC. PRODUCT REVENUES AND PRODUCTION COSTS (continued) Indonesia Mining Product Revenues, Production Costs and Unit Net Cash Costs Three Months Ended June 30, 2017 (In millions) By-Product Co-Product Method Method Copper Gold Silver a Total Revenues, excluding adjustments $ 660 $ 660 $ 531 $ 14 $ 1,205 Site production and delivery, before net noncash and other costs shown below Gold and silver credits (547) Treatment charges Export duties Royalty on metals Net cash costs DD&A Noncash and other costs, net 84 b Total costs Revenue adjustments, primarily for pricing on prior period open sales (7) (7) 2 (5) PT Smelting intercompany loss (26) (15) (11) (26) Gross profit $ 358 $ 193 $ 161 $ 4 $ 358 Copper sales (millions of recoverable pounds) Gold sales (thousands of recoverable ounces) 427 Gross profit per pound of copper/per ounce of gold: Revenues, excluding adjustments $ 2.67 $ 2.67 $ 1,243 Site production and delivery, before net noncash and other costs shown below Gold and silver credits (2.21) Treatment charges Export duties Royalty on metals Unit net cash costs DD&A Noncash and other costs, net 0.34 b Total unit costs Revenue adjustments, primarily for pricing on prior period open sales (0.03) (0.03) 5 PT Smelting intercompany loss (0.10) (0.06) (26) Gross profit per pound/ounce $ 1.45 $ 0.78 $ 377 Reconciliation to Amounts Reported (In millions) Production Revenues and Delivery DD&A Totals presented above $ 1,205 $ 444 $ 153 Treatment charges (65) Export duties (27) Royalty on metals (43) Noncash and other costs, net 84 Revenue adjustments, primarily for pricing on prior period open sales (5) PT Smelting intercompany loss 26 Indonesia mining 1, Other mining c 3,406 2, Corporate, other & eliminations (760) (754) 25 As reported in FCX's consolidated financial statements $ 3,711 $ 2,495 $ 450
44 a. Includes silver sales of 851 thousand ounces ( $16.26 per ounce average realized price). b. Includes $82 million ( $0.33 per pound of copper) of costs charged directly to production and delivery costs as a result of the impact of workforce reductions. c. Represents the combined total for FCX's other mining operations, including North America copper mines, South America mining, Molybdenum mines, Rod & Refining and Atlantic Copper Smelting & Refining, as presented in the supplemental schedule, "Business Segments," beginning on page X. XXII
45 FREEPORT-McMoRan INC. PRODUCT REVENUES AND PRODUCTION COSTS (continued) Indonesia Mining Product Revenues, Production Costs and Unit Net Cash Costs Three Months Ended June 30, 2016 (In millions) By-Product Co-Product Method Method Copper Gold Silver a Total Revenues, excluding adjustments $ 431 $ 431 $ 195 $ 10 $ 636 Site production and delivery, before net noncash and other costs shown below Gold and silver credits (206) Treatment charges Export duties Royalty on metals Net cash costs DD&A Noncash and other costs, net Total costs Revenue adjustments, primarily for pricing on prior period open sales (12) (12) 1 (11) PT Smelting intercompany loss (7) (5) (2) (7) Gross profit $ 82 $ 51 $ 29 $ 2 $ 82 Copper sales (millions of recoverable pounds) Gold sales (thousands of recoverable ounces) 151 Gross profit per pound of copper/per ounce of gold: Revenues, excluding adjustments $ 2.20 $ 2.20 $ 1,292 Site production and delivery, before net noncash and other costs shown below Gold and silver credits (1.05) Treatment charges Export duties Royalty on metals Unit net cash costs DD&A Noncash and other costs, net Total unit costs ,093 Revenue adjustments, primarily for pricing on prior period open sales (0.06) (0.06) 7 PT Smelting intercompany loss (0.03) (0.02) (14) Gross profit per pound/ounce $ 0.42 $ 0.26 $ 192 Reconciliation to Amounts Reported (In millions) Production Revenues and Delivery DD&A Totals presented above $ 636 $ 347 $ 93 Treatment charges (57) Export duties (16) Royalty on metals (21) Noncash and other costs, net 2 Revenue adjustments, primarily for pricing on prior period open sales (11) PT Smelting intercompany loss 7 Indonesia mining Other mining b 3,203 2, Corporate, other & eliminations (400) As reported in FCX's consolidated financial statements $ 3,334 $ 2,956 $ 632
46 a. Includes silver sales of 562 thousand ounces ( $17.42 per ounce average realized price). b. Represents the combined total for FCX's other mining operations, including North America copper mines, South America mining, Molybdenum mines, Rod & Refining and Atlantic Copper Smelting & Refining, as presented in the supplemental schedule, "Business Segments," beginning on page X. XXIII
47 FREEPORT-McMoRan INC. PRODUCT REVENUES AND PRODUCTION COSTS (continued) Indonesia Mining Product Revenues, Production Costs and Unit Net Cash Costs Six Months Ended June 30, 2017 (In millions) By-Product Co-Product Method Method Copper Gold Silver a Total Revenues, excluding adjustments $ 982 $ 982 $ 752 $ 21 $ 1,755 Site production and delivery, before net noncash and other costs shown below Gold and silver credits (782) Treatment charges Export duties Royalty on metals Net cash costs DD&A Noncash and other costs, net 116 b Total costs ,268 Revenue adjustments, primarily for pricing on prior period open sales PT Smelting intercompany profit Gross profit $ 536 $ 313 $ 216 $ 7 $ 536 Copper sales (millions of recoverable pounds) Gold sales (thousands of recoverable ounces) 604 Gross profit per pound of copper/per ounce of gold: Revenues, excluding adjustments $ 2.64 $ 2.64 $ 1,242 Site production and delivery, before net noncash and other costs shown below Gold and silver credits (2.10) Treatment charges Export duties Royalty on metals Unit net cash costs DD&A Noncash and other costs, net 0.32 b Total unit costs Revenue adjustments, primarily for pricing on prior period open sales PT Smelting intercompany profit 1 Gross profit per pound/ounce $ 1.44 $ 0.84 $ 358 Reconciliation to Amounts Reported (In millions) Production Revenues and Delivery DD&A Totals presented above $ 1,755 $ 712 $ 236 Treatment charges (100) Export duties (41) Royalty on metals (63) Noncash and other costs, net 116 Revenue adjustments, primarily for pricing on prior period open sales 48 PT Smelting intercompany profit (1) Indonesia mining 1, Other mining c 7,005 5, Corporate, other & eliminations (1,552) (1,571) 54 As reported in FCX's consolidated financial statements $ 7,052 $ 4,695 $ 839
48 a. Includes silver sales of 1.3 million ounces ( $16.66 per ounce average realized price). b. Includes $103 million ( $0.28 per pound of copper) of costs charged directly to production and delivery costs as a result of workforce reductions. c. Represents the combined total for FCX's other mining operations, including North America copper mines, South America mining, Molybdenum mines, Rod & Refining and Atlantic Copper Smelting & Refining, as presented in the supplemental schedule, "Business Segments," beginning on page X. XXIV
49 FREEPORT-McMoRan INC. PRODUCT REVENUES AND PRODUCTION COSTS (continued) Indonesia Mining Product Revenues and Production Costs and Unit Net Cash Costs Six Months Ended June 30, 2016 (In millions) By-Product Co-Product Method Method Copper Gold Silver a Total Revenues, excluding adjustments $ 802 $ 802 $ 436 $ 17 $ 1,255 Site production and delivery, before net noncash and other costs shown below Gold and silver credits (470) Treatment charges Export duties Royalty on metals Net cash costs DD&A Noncash and other costs, net Total costs ,109 Revenue adjustments, primarily for pricing on prior period open sales (1) (1) PT Smelting intercompany profit Gross profit $ 163 $ 94 $ 67 $ 2 $ 163 Copper sales (millions of recoverable pounds) Gold sales (thousands of recoverable ounces) 346 Gross profit per pound of copper/per ounce of gold: Revenues, excluding adjustments $ 2.17 $ 2.17 $ 1,260 Site production and delivery, before net noncash and other costs shown below Gold and silver credits (1.27) Treatment charges Export duties Royalty on metals Unit net cash costs DD&A Noncash and other costs, net Total unit costs ,118 Revenue adjustments, primarily for pricing on prior period open sales 48 PT Smelting intercompany profit 2 Gross profit per pound/ounce $ 0.44 $ 0.26 $ 192 Reconciliation to Amounts Reported (In millions) Production Revenues and Delivery DD&A Totals presented above $ 1,255 $ 737 $ 174 Treatment charges (112) Export duties (29) Royalty on metals (43) Noncash and other costs, net 14 Revenue adjustments, primarily for pricing on prior period open sales 16 PT Smelting intercompany profit (1) Indonesia mining 1, Other mining b 6,457 5, Corporate, other & eliminations (968) (475) 518 As reported in FCX's consolidated financial statements $ 6,576 $ 5,455 $ 1,294
50 a. Includes silver sales of 1.1 million ounces ( $16.56 per ounce average realized price). b. Represents the combined total for FCX's other mining operations, including North America copper mines, South America mining, Molybdenum mining, Rod & Refining and Atlantic Copper Smelting and Refining, as presented in the supplemental schedule, "Business Segments," beginning on page X. XXV
51 FREEPORT-McMoRan INC. PRODUCT REVENUES AND PRODUCTION COSTS (continued) Molybdenum Mines Product Revenues, Production Costs and Unit Net Cash Costs Three Months Ended June 30, (In millions) Revenues, excluding adjustments a $ 78 $ 50 Site production and delivery, before net noncash and other costs shown below Treatment charges and other 7 5 Net cash costs DD&A Noncash and other costs, net 2 5 Total costs Gross loss $ (7) $ (22) Molybdenum sales (millions of recoverable pounds) a 8 7 Gross loss per pound of molybdenum: Revenues, excluding adjustments a $ 9.57 $ 7.87 Site production and delivery, before net noncash and other costs shown below Treatment charges and other Unit net cash costs DD&A Noncash and other costs, net Total unit costs Gross loss per pound $ (0.83) $ (3.46) Reconciliation to Amounts Reported (In millions) Production Three Months Ended June 30, 2017 Revenues and Delivery DD&A Totals presented above $ 78 $ 57 $ 19 Treatment charges and other (7) Noncash and other costs, net 2 Molybdenum mines Other mining b 4,400 3, Corporate, other & eliminations (760) (754) 25 As reported in FCX's consolidated financial statements $ 3,711 $ 2,495 $ 450 Three Months Ended June 30, 2016 Totals presented above $ 50 $ 45 $ 17 Treatment charges and other (5) Noncash and other costs, net 5 Molybdenum mines Other mining b 3,689 2, Corporate, other & eliminations (400) As reported in FCX's consolidated financial statements $ 3,334 $ 2,956 $ 632 a. Reflects sales of the Molybdenum mines' production to FCX's molybdenum sales company at market-based pricing. On a consolidated basis, realizations are based on the actual contract terms for sales to third parties; as a result, FCX's consolidated average realized price per pound of molybdenum will differ from the amounts reported in this table. b. Represents the combined total for FCX's other mining operations, including North America copper mines, South America mining, Indonesia mining, Rod & Refining and Atlantic Copper Smelting & Refining, as presented in the supplemental schedule, "Business Segments," beginning on page X. Also includes amounts associated with FCX's molybdenum sales company, which includes sales of molybdenum produced by the Molybdenum mines and by certain of the North America and South America copper mines. XXVI
52 FREEPORT-McMoRan INC. PRODUCT REVENUES AND PRODUCTION COSTS (continued) Molybdenum Mines Product Revenues, Production Costs and Unit Net Cash Costs Six Months Ended June 30, (In millions) Revenues, excluding adjustments a $ 148 $ 102 Site production and delivery, before net noncash and other costs shown below Treatment charges and other Net cash costs DD&A Noncash and other costs, net 3 10 Total costs Gross loss $ (15) $ (48) Molybdenum sales (millions of recoverable pounds) a Gross loss per pound of molybdenum: Revenues, excluding adjustments a $ 9.07 $ 7.47 Site production and delivery, before net noncash and other costs shown below Treatment charges and other Unit net cash costs DD&A Noncash and other costs, net Total unit costs Gross loss per pound $ (0.94) $ (3.49) Reconciliation to Amounts Reported (In millions) Production Six Months Ended June 30, 2017 Revenues and Delivery DD&A Totals presented above $ 148 $ 108 $ 38 Treatment charges and other (14) Noncash and other costs, net 3 Molybdenum mines Other mining b 8,470 6, Corporate, other & eliminations (1,552) (1,571) 54 As reported in FCX's consolidated financial statements $ 7,052 $ 4,695 $ 839 Six Months Ended June 30, 2016 Totals presented above $ 102 $ 92 $ 36 Treatment charges and other (12) Noncash and other costs, net 10 Molybdenum mines Other mining b 7,454 5, Corporate, other & eliminations (968) (475) 518 As reported in FCX's consolidated financial statements $ 6,576 $ 5,455 $ 1,294 a. Reflects sales of the Molybdenum mines' production to FCX's molybdenum sales company at market-based pricing. On a consolidated basis, realizations are based on the actual contract terms for sales to third parties; as a result, FCX's consolidated average realized price per pound of molybdenum will differ from the amounts reported in this table. b. Represents the combined total for FCX's other mining operations, including North America copper mines, South America mining, Indonesia mining, Rod & Refining and Atlantic Copper Smelting & Refining, as presented in the supplemental schedule, "Business Segments," beginning on page X. Also includes amounts associated with FCX's molybdenum sales company, which includes sales of molybdenum produced by the Molybdenum mines and by certain of the North America and South America copper mines. XXVII

53
54
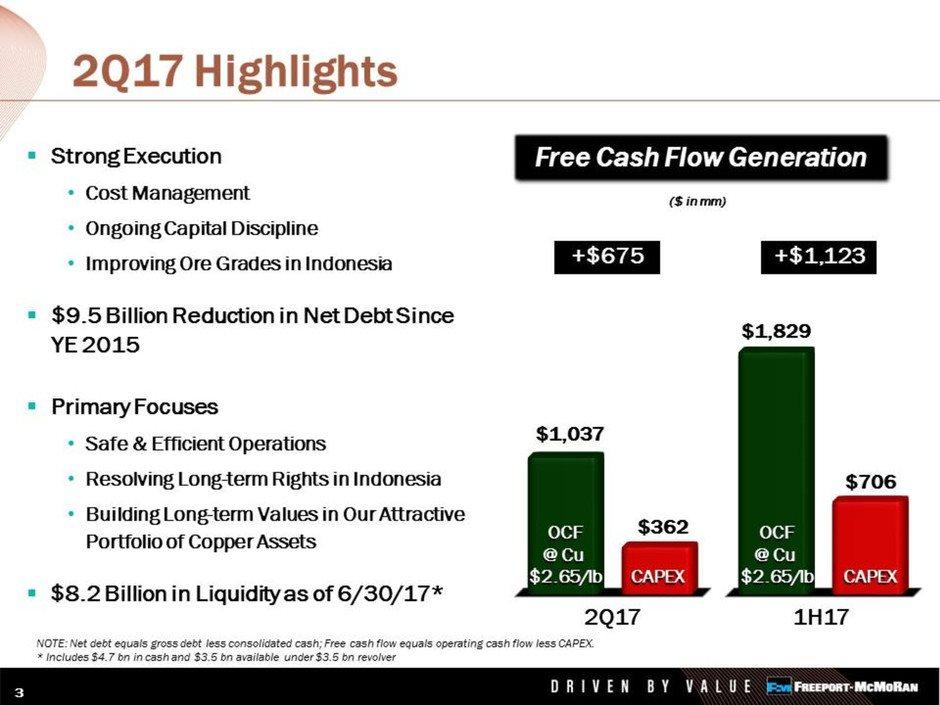
55

56
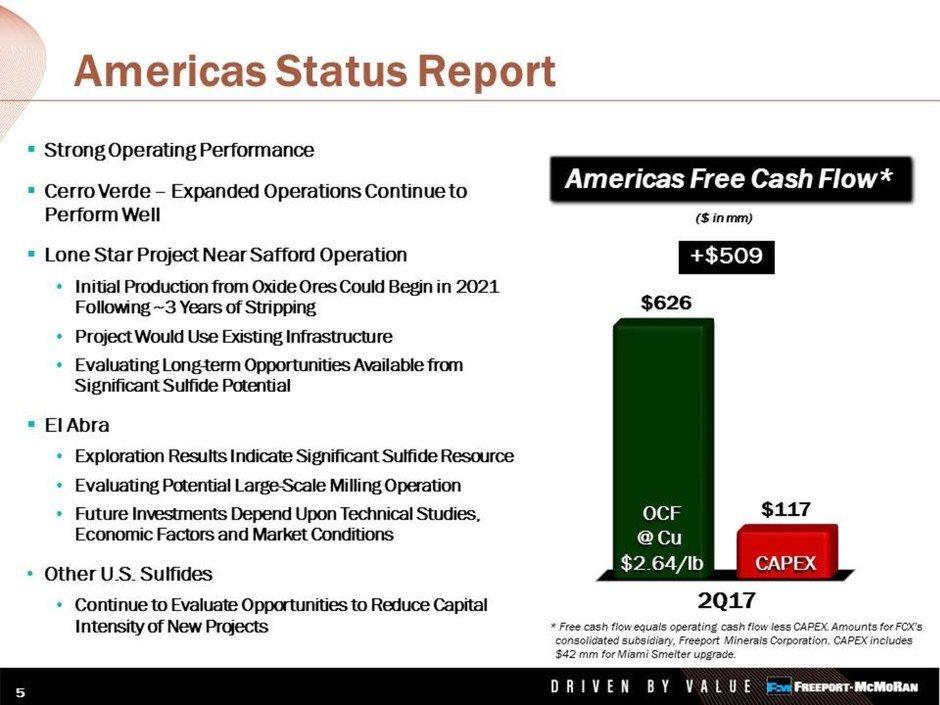
57

58

59

60

61
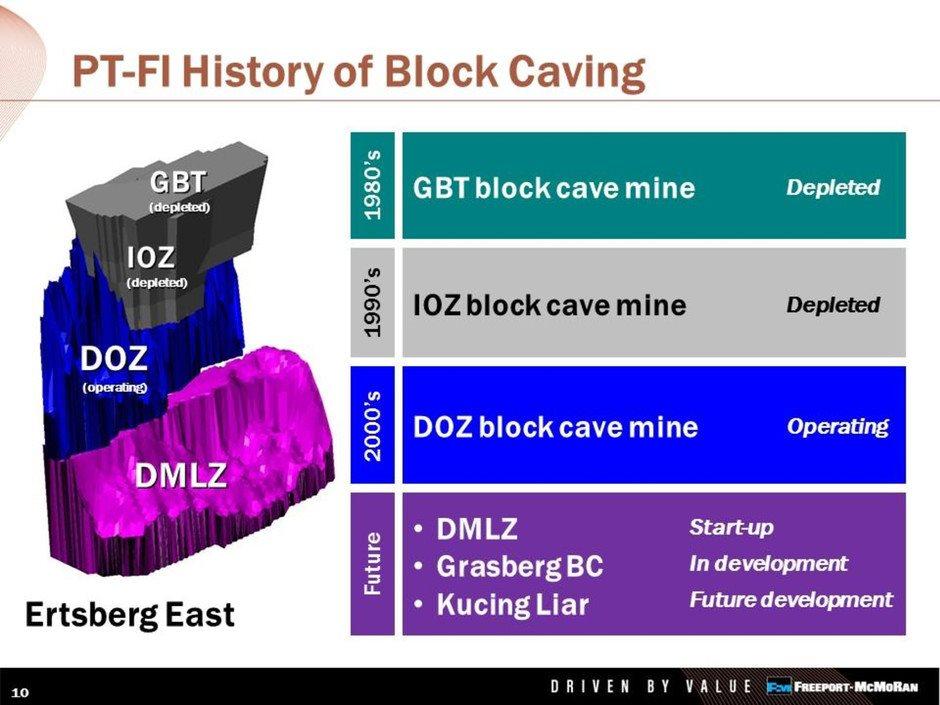
62

63

64

65

66

67

68

69

70

71

72

73
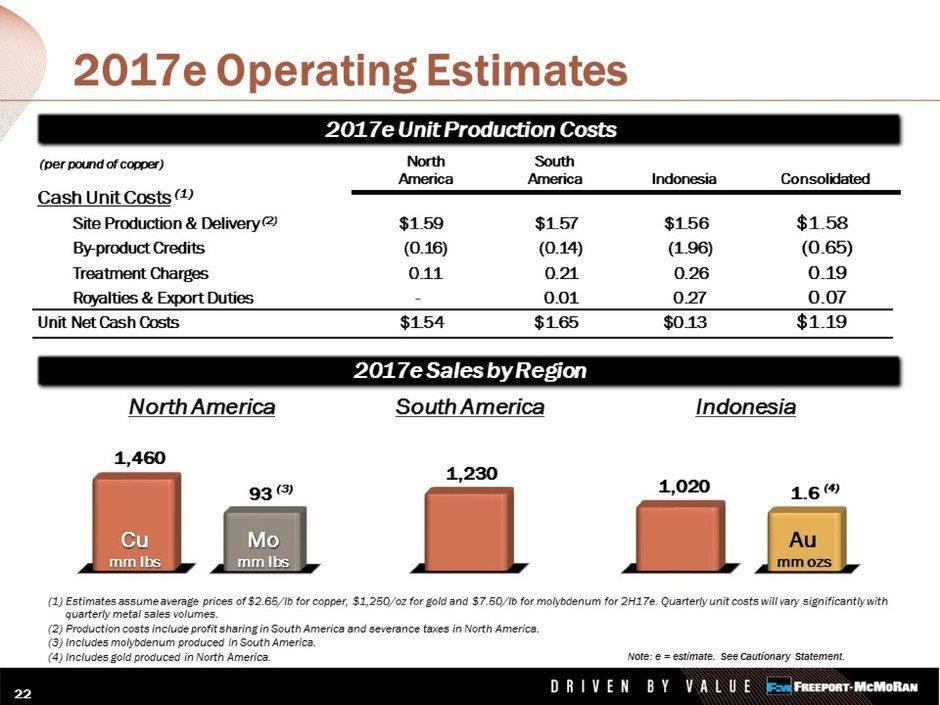
74

75

76

77
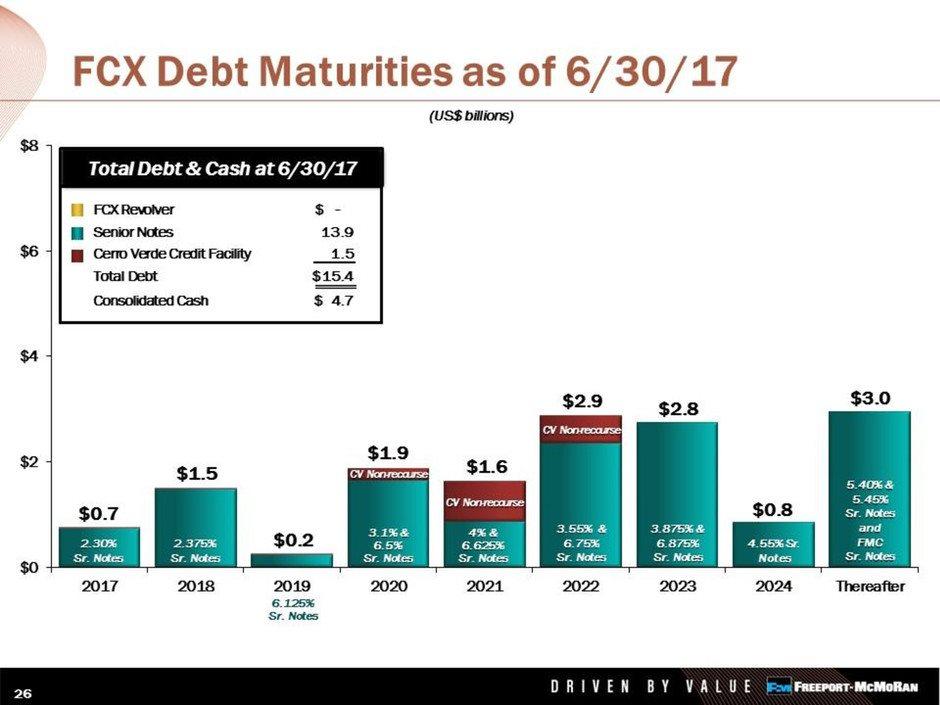
78

79
FREEPORT-McMoRan INC. (Exact name of registrant as specified in its charter)
") UNITED STATES SECURITIES AND EXCHANGE COMMISSION Washington, D.C. 20549 FORM 8-K CURRENT REPORT Pursuant to Section 13 OR 15(d) of The Securities Exchange Act of 1934 Date of Report (Date of earliest event
UNITED STATES SECURITIES AND EXCHANGE COMMISSION Washington, D.C. 20549 FORM 8-K CURRENT REPORT Pursuant to Section 13 OR 15(d) of The Securities Exchange Act of 1934 Date of Report (Date of earliest event
Freeport-McMoRan Copper & Gold Inc. Reports Third-Quarter and Nine-Month 2010 Results
 333 North Central Avenue Phoenix, AZ 85004 Financial Contacts: Media Contact: Kathleen L. Quirk David P. Joint William L. Collier (602) 366-8016 (504) 582-4203 (504) 582-1750 Freeport-McMoRan Copper &
Freeport-McMoRan Copper & Gold Inc. Reports Second-Quarter and Six-Month 2008 Results
 One North Central Avenue Phoenix, AZ 85004 Financial Contacts: Media Contact: Kathleen L. Quirk David P. Joint William L. Collier (602) 366-8016 (504) 582-4203 (504) 582-1750 Freeport-McMoRan Copper &
Richard C. Adkerson. President & Chief Executive Officer
 Richard C. Adkerson President & Chief Executive Officer February 27, 2017 Cautionary Statement Regarding Forward-Looking Statements This presentation contains forward-looking statements in which FCX discusses
FREEPORT-MCMORAN INC
 FREEPORT-MCMORAN INC FORM 8-K (Current report filing) Filed 01/27/15 for the Period Ending 01/27/15 Address 333 NORTH CENTRAL AVENUE PHOENIX, AZ 85004 Telephone 6023668100 CIK 0000831259 Symbol FCX SIC
FREEPORT-McMoRan INC. (Exactnameofregistrantasspecifiedinitscharter) Delaware (Stateorotherjurisdictionof
 Delaware (Stateorotherjurisdictionof") UNITED STATES SECURITIES AND EXCHANGE COMMISSION Washington, D.C. 20549 FORM 8-K CURRENT REPORT Pursuant to Section 13 OR 15(d) of The Securities Exchange Act of 1934 Date of Report (Date of earliest event
UNITED STATES SECURITIES AND EXCHANGE COMMISSION Washington, D.C. 20549 FORM 8-K CURRENT REPORT Pursuant to Section 13 OR 15(d) of The Securities Exchange Act of 1934 Date of Report (Date of earliest event
Richard C. Adkerson. President & CEO
 Richard C. Adkerson President & CEO December 6, 2016 Cautionary Statement Regarding Forward-Looking Statements This presentation contains forward-looking statements in which FCX discusses its potential
Annual Metals, Mining, and Steel Conference
 Annual Metals, Mining, and Steel Conference Kathleen L. Quirk Executive VP & CFO November 28, 2012 www.fcx.com CONNECTING THE FUTURE Cautionary Statement This presentation contains forward-looking statements
1 st Quarter 2010 Earnings Conference Call
 1 st Quarter 2010 Earnings Conference Call PROVEN PERFORMANCE SHINING FUTURE www.fcx.com April 21, 2010 Cautionary Statement Regarding Forward-Looking Statements This presentation contains forward-looking
3 rd Quarter 2012 Earnings Conference Call
 3 rd Quarter 2012 Earnings Conference Call October 22, 2012 www.fcx.com CONNECTING THE FUTURE Cautionary Statement This presentation contains forward-looking statements in which we discuss factors we believe
BMO Capital Markets 2008 Global Metals and Mining Conference
 FREEPORT-MCMORAN COPPER & GOLD BMO Capital Markets 2008 Global Metals and Mining Conference Richard C. Adkerson President & CEO February 25, 2008 www.fcx.com Cautionary Statement Regarding Forward-Looking
1 st Quarter 2012 Earnings Conference Call. CONNECTING THE FUTURE
 1 st Quarter 2012 Earnings Conference Call April 19, 2012 www.fcx.com CONNECTING THE FUTURE Cautionary Statement This presentation contains forward-looking statements in which we discuss factors we believe
27th Global Metals & Mining Conference
 27th Global Metals & Mining Conference Richard C. Adkerson Vice Chairman, President & CEO February 26, 2018 fcx.com Cautionary Statement Regarding Forward-Looking Statements This presentation contains
1 st Quarter 2018 Earnings Conference Call
 1 st Quarter 2018 Earnings Conference Call April 24, 2018 fcx.com Cautionary Statement Regarding Forward-Looking Statements This presentation contains forward-looking statements in which FCX discusses
Goldman Sachs Basic Materials Conference 2008
 Goldman Sachs Basic Materials Conference 2008 Richard C. Adkerson President & CEO New York City May 20, 2008 www.fcx.com Cautionary Statement Regarding Forward-Looking Statements This presentation contains
Richard C. Adkerson Vice Chairman of the Board, President & Chief Executive Officer February 25, 2019
 Richard C. Adkerson Vice Chairman of the Board, President & Chief Executive Officer February 25, 2019 fcx.com Cautionary Statement Regarding Forward-Looking Statements This presentation contains forward-looking
4 th Quarter 2008 Earnings Conference Call
 4 th Quarter 2008 Earnings Conference Call January 26, 2009 www.fcx.com Cautionary Statement Regarding Forward-Looking Statements This presentation contains forward-looking statements in which we discuss
Connecting the World. Richard C. Adkerson. President & CEO.
 Connecting the World Richard C. Adkerson President & CEO www.fcx.com May 10, 2011 Cautionary Statement This presentation contains forward-looking statements in which we discuss factors we believe may affect
FCX Conference Call to Discuss Revised Operating Plans
 FCX Conference Call to Discuss Revised Operating Plans December 3, 2008 www.fcx.com Cautionary Statement Regarding Forward-Looking Statements This presentation contains forward-looking statements in which
Richard C. Adkerson. President & CEO. November 11,
 Richard C. Adkerson President & CEO November 11, 2008 www.fcx.com Cautionary Statement Regarding Forward-Looking Statements This presentation contains forward-looking statements in which we discuss factors
Goldman Sachs Basic Materials Conference
 Goldman Sachs Basic Materials Conference Kathleen L. Quirk Executive Vice President & Chief Financial Officer June 4, 2009 www.fcx.com Cautionary Statement Regarding Forward-Looking Statements This presentation
2018 Global Metals, Mining & Steel Conference
 2018 Global Metals, Mining & Steel Conference Richard C. Adkerson President & CEO May 15, 2018 fcx.com Cautionary Statement Regarding Forward-Looking Statements This presentation contains forward-looking
Denver Gold Forum 2008
 Denver Gold Forum 2008 Richard C. Adkerson President & CEO September 10, 2008 www.fcx.com Cautionary Statement Regarding Forward-Looking Statements This presentation contains forward-looking statements
Kathleen L. Quirk Executive Vice President & CFO
 MACQUARIE CONNECTIONS MACQUARIE CAPITAL (USA) INC. Global Metals & Mining Conference Kathleen L. Quirk Executive Vice President & CFO www.fcx.com New York City November 30, 2009 Cautionary Statement Regarding
Richard C. Adkerson. President & CEO. CONNECTING THE FUTURE
 Richard C. Adkerson President & CEO May 15, 2012 www.fcx.com CONNECTING THE FUTURE Cautionary Statement This presentation contains forward-looking statements in which we discuss factors we believe may
Richard C. Adkerson. President & Chief Executive Officer.
 Richard C. Adkerson President & Chief Executive Officer www.fcx.com March 1, 2010 Cautionary Statement Regarding Forward-Looking Statements This presentation contains forward-looking statements in which
Global Metals & Mining Conference
 Global Metals & Mining Conference Kathleen L. Quirk Executive Vice President & CFO November 16, 2016 Cautionary Statement Regarding Forward-Looking Statements This presentation contains forward-looking
Freeport-McMoRan Copper & Gold Inc. (Exact name of registrant as specified in its charter)
") UNITED STATES SECURITIES AND EXCHANGE COMMISSION Washington, D.C. 20549 FORM 10-Q (Mark One) [X] QUARTERLY REPORT PURSUANT TO SECTION 13 OR 15(d) OF THE SECURITIES EXCHANGE ACT OF 1934 For the quarterly
UNITED STATES SECURITIES AND EXCHANGE COMMISSION Washington, D.C. 20549 FORM 10-Q (Mark One) [X] QUARTERLY REPORT PURSUANT TO SECTION 13 OR 15(d) OF THE SECURITIES EXCHANGE ACT OF 1934 For the quarterly
Connecting the World. Richard C. Adkerson President & Chief Executive Officer.
 Connecting the World Richard C. Adkerson President & Chief Executive Officer www.fcx.com November 16, 2011 Cautionary Statement This presentation contains forward-looking statements in which we discuss
3 rd Quarter 2017 Earnings Conference Call
 3 rd Quarter 2017 Earnings Conference Call October 25, 2017 fcx.com 2 Cautionary Statement Regarding Forward-Looking Statements This presentation contains forward-looking statements in which FCX discusses
2 nd Quarter 2018 Earnings Conference Call
 2 nd Quarter 2018 Earnings Conference Call July 25, 2018 fcx.com Cautionary Statement Regarding Forward-Looking Statements This presentation contains forward-looking statements in which FCX discusses its
4th Quarter 2015 Earnings Conference Call. January 26, 2016
 4th Quarter 2015 Earnings Conference Call January 26, 2016 Cautionary Statement Regarding Forward-Looking Statements This presentation contains forward-looking statements in which FCX discusses its potential
4 th Quarter 2017 Earnings Conference Call
 4 th Quarter 2017 Earnings Conference Call January 25, 2018 fcx.com Cautionary Statement Regarding Forward-Looking Statements This presentation contains forward-looking statements in which FCX discusses
3 rd Quarter 2018 Earnings Conference Call
 3 rd Quarter 2018 Earnings Conference Call October 24, 2018 fcx.com Cautionary Statement Regarding Forward-Looking Statements This presentation contains forward-looking statements in which FCX discusses
4 th Quarter 2018 Earnings Conference Call
 4 th Quarter 2018 Earnings Conference Call January 24, 2019 fcx.com Cautionary Statement Regarding Forward-Looking Statements This presentation contains forward-looking statements in which FCX discusses
3rd Quarter 2015 Earnings Conference Call. October 22, 2015
 3rd Quarter 2015 Earnings Conference Call October 22, 2015 Cautionary Statement Regarding Forward-Looking Statements This presentation contains forward-looking statements in which FCX discusses its potential
Freeport-McMoRan Inc.
 February 05, 2015 Freeport-McMoRan Inc. Current Recommendation Prior Recommendation Neutral Date of Last Change 11/05/2014 Current Price (02/03/15) $18.98 Target Price $17.00 UNDERPERFORM (FCX-NYSE) SUMMARY
Freeport-McMoRan Inc. (Exactnameofregistrantasspecifiedinitscharter)
") UNITED STATES SECURITIES AND EXCHANGE COMMISSION Washington, D.C. 20549 FORM 8-K CURRENT REPORT Pursuant to Section 13 OR 15(d) of The Securities Exchange Act of 1934 Date of Report (Date of earliest event
UNITED STATES SECURITIES AND EXCHANGE COMMISSION Washington, D.C. 20549 FORM 8-K CURRENT REPORT Pursuant to Section 13 OR 15(d) of The Securities Exchange Act of 1934 Date of Report (Date of earliest event
NEWS RELEASE. Coeur Reports Second Quarter 2014 Results
 NEWS RELEASE Coeur Reports Second Quarter 2014 Results Cash flow from operating activities increased by $40 million; Rochester cash flow and production growth accelerates; Full-year cost guidance reduced
SECURITIES AND EXCHANGE COMMISSION FORM 8-K SOUTHERN PERU COPPER CORPORATION
 SECURITIES AND EXCHANGE COMMISSION Washington, D.C. 20549 FORM 8-K CURRENT REPORT Pursuant to Section 13 or 15(d) of the Securities Exchange Act of 1934 Date of report (Date of earliest event reported):
FREEPORT-McMoRan INC. (Exactnameofregistrantasspecifiedinitscharter)
") UNITED STATES SECURITIES AND EXCHANGE COMMISSION Washington, D.C. 20549 FORM 8-K CURRENT REPORT Pursuant to Section 13 OR 15(d) of The Securities Exchange Act of 1934 Date of Report (Date of earliest event
UNITED STATES SECURITIES AND EXCHANGE COMMISSION Washington, D.C. 20549 FORM 8-K CURRENT REPORT Pursuant to Section 13 OR 15(d) of The Securities Exchange Act of 1934 Date of Report (Date of earliest event
2018 Basic Materials Conference
 2018 Basic Materials Conference Kathleen L. Quirk Executive Vice President & Chief Financial Officer November 27, 2018 fcx.com Cautionary Statement Regarding Forward-Looking Statements This presentation
6th Annual Global Industrials and Basic Materials Conference
 6th Annual Global Industrials and Basic Materials Conference Kathleen L. Quirk Executive Vice President & CFO June 3, 2015 Cautionary Statement Regarding Forward-Looking Statements This presentation contains
NEWMONT MINING CORP /DE/
 NEWMONT MINING CORP /DE/ FORM 8-K (Current report filing) Filed 02/21/14 for the Period Ending 02/20/14 Address 6363 SOUTH FIDDLERS GREEN CIRCLE GREENWOOD VILLAGE, CO 80111 Telephone 303-863-7414 CIK 0001164727
Freeport-McMoRan Copper & Gold Inc. (Exact name of registrant as specified in its charter)
") UNITED STATES SECURITIES AND EXCHANGE COMMISSION Washington, D.C. 20549 FORM 10-K (Mark One) [X] ANNUAL REPORT PURSUANT TO SECTION 13 OR 15(d) OF THE SECURITIES EXCHANGE ACT OF 1934 For the fiscal year
UNITED STATES SECURITIES AND EXCHANGE COMMISSION Washington, D.C. 20549 FORM 10-K (Mark One) [X] ANNUAL REPORT PURSUANT TO SECTION 13 OR 15(d) OF THE SECURITIES EXCHANGE ACT OF 1934 For the fiscal year
Freeport-McMoRanInc.
 UNITEDSTATES SECURITIESANDEXCHANGECOMMISSION Washington,D.C.20549 FORM10-K (MarkOne) [X]ANNUALREPORTPURSUANTTOSECTION13OR15(d)OFTHESECURITIESEXCHANGEACTOF1934 ForthefiscalyearendedDecember31,2017 OR []TRANSITIONREPORTPURSUANTTOSECTION13OR15(d)OFTHESECURITIESEXCHANGEACTOF1934
CLEVELAND-CLIFFS INC. (Exact name of registrant as specified in its charter)
") UNITED STATES SECURITIES AND EXCHANGE COMMISSION WASHINGTON, D.C. 20549 FORM 8-K CURRENT REPORT PURSUANT TO SECTION 13 OR 15(d) OF THE SECURITIES EXCHANGE ACT OF 1934 Date of Report (Date of earliest event
UNITED STATES SECURITIES AND EXCHANGE COMMISSION WASHINGTON, D.C. 20549 FORM 8-K CURRENT REPORT PURSUANT TO SECTION 13 OR 15(d) OF THE SECURITIES EXCHANGE ACT OF 1934 Date of Report (Date of earliest event
UNITED STATES SECURITIES AND EXCHANGE COMMISSION Washington, D.C FORM 8-K
 UNITED STATES SECURITIES AND EXCHANGE COMMISSION Washington, D.C. 20549 FORM 8-K Current Report Pursuant to Section 13 or 15(d) of the Securities Exchange Act of 1934 Date of Report (Date of earliest event
UNITED STATES SECURITIES AND EXCHANGE COMMISSION FORM 8-K HAYNES INTERNATIONAL, INC.
 hayn_currentfolio_8k Page 1 of 2 2/2/2017 UNITED STATES SECURITIES AND EXCHANGE COMMISSION Washington, D.C. 20549 FORM 8-K CURRENT REPORT Pursuant to Section 13 or 15(d) of the Securities Exchange Act
Freeport-McMoRanInc.
 UNITEDSTATES SECURITIESANDEXCHANGECOMMISSION Washington,D.C.20549 FORM10-Q (MarkOne) [X]QUARTERLYREPORTPURSUANTTOSECTION13OR15(d)OFTHESECURITIESEXCHANGEACTOF1934 ForthequarterlyperiodendedMarch31,2018
UNITED STATES SECURITIES AND EXCHANGE COMMISSION WASHINGTON, D.C FORM 8-K CURRENT REPORT
 UNITED STATES SECURITIES AND EXCHANGE COMMISSION WASHINGTON, D.C. 20549 FORM 8-K CURRENT REPORT PURSUANT TO SECTION 13 OR 15(d) OF THE SECURITIES EXCHANGE ACT OF 1934 Date of Report (Date of earliest event
Royal Gold Reports Third Quarter 2018 Results
 Royal Gold Reports Third Quarter 2018 Results DENVER, COLORADO. MAY 2, 2018: ROYAL GOLD, INC. (NASDAQ: RGLD) (together with its subsidiaries, Royal Gold or the Company, we or our ) reports a net loss of
Royal Gold Reports Record Operating Cash Flow in its Third Quarter 2017
 Royal Gold Reports Record Operating Cash Flow in its Third Quarter 2017 DENVER, COLORADO. MAY 10, 2017: ROYAL GOLD, INC. (NASDAQ: RGLD) (together with its subsidiaries, Royal Gold or the Company, we or
Global Metals & Mining, Steel Conference
 Global Metals & Mining, Steel Conference Kathleen L. Quirk Executive Vice President & CFO www.fcx.com November 19, 2014 Cautionary Statement Regarding Forward-Looking Statements This presentation contains
NEWMONT MINING CORPORATION (Exact name of registrant as specified in its charter)
") UNITED STATES SECURITIES AND EXCHANGE COMMISSION Washington, D. C. 20549 Form 10-Q (Mark One) QUARTERLY REPORT PURSUANT TO SECTION 13 OR 15(d) OF THE SECURITIES EXCHANGE ACT OF 1934 For the Quarterly Period
UNITED STATES SECURITIES AND EXCHANGE COMMISSION Washington, D. C. 20549 Form 10-Q (Mark One) QUARTERLY REPORT PURSUANT TO SECTION 13 OR 15(d) OF THE SECURITIES EXCHANGE ACT OF 1934 For the Quarterly Period
Royal Gold Reports Record Annual Revenue, Earnings and Cash Flow
 Royal Gold Reports Record Annual Revenue, Earnings and Cash Flow DENVER, COLORADO. AUGUST 9, 2017: ROYAL GOLD, INC. (NASDAQ: RGLD) (together with its subsidiaries, Royal Gold or the Company, we or our
news release November 9, 2015
 news release November 9, Thompson Creek Reports Third Quarter Cash Balance of $217 Million and Non-GAAP Unit Cash Cost on a By-Product Basis of Negative $0.16 per Pound of Copper Produced Denver, CO Thompson
Newmont Announces First Quarter 2018 Results
 NEWS RELEASE NYSE: NEM newmont.com Newmont Announces First Quarter 2018 Results DENVER, April 26, 2018 Newmont Mining Corporation (NYSE: NEM) (Newmont or the Company) announced first quarter 2018 results.
UNITED STATES SECURITIES AND EXCHANGE COMMISSION Washington, D.C FORM 8-K
 UNITED STATES SECURITIES AND EXCHANGE COMMISSION Washington, D.C. 20549 FORM 8-K CURRENT REPORT Pursuant to Section 13 or 15(d) of the Securities Exchange Act of 1934 Date of Report (Date of earliest event
WPX ENERGY, INC. FORM 8-K. (Current report filing) Filed 05/05/15 for the Period Ending 05/05/15
 Filed 05/05/15 for the Period Ending 05/05/15") WPX ENERGY, INC. FORM 8-K (Current report filing) Filed 05/05/15 for the Period Ending 05/05/15 Address ONE WILLIAMS CENTER TULSA, OK 74172 Telephone 9185732000 CIK 0001518832 Symbol WPX SIC Code 1311
WPX ENERGY, INC. FORM 8-K (Current report filing) Filed 05/05/15 for the Period Ending 05/05/15 Address ONE WILLIAMS CENTER TULSA, OK 74172 Telephone 9185732000 CIK 0001518832 Symbol WPX SIC Code 1311
Cash generated by operating activities was $184.8 million in 2014 compared to $44.8 million in 2013.
 February 19, 2015 news release Thompson Creek Reports Significantly Improved 2014 Financial Results Revenue of $807 Million, up 86%, Operating Cash Flow of $185 Million, up 313% and Cash Balance of $266
CLEVELAND-CLIFFS INC. (Exact name of registrant as specified in its charter)
") UNITED STATES SECURITIES AND EXCHANGE COMMISSION WASHINGTON, D.C. 20549 FORM 8-K CURRENT REPORT PURSUANT TO SECTION 13 OR 15(d) OF THE SECURITIES EXCHANGE ACT OF 1934 Date of Report (Date of earliest event
UNITED STATES SECURITIES AND EXCHANGE COMMISSION WASHINGTON, D.C. 20549 FORM 8-K CURRENT REPORT PURSUANT TO SECTION 13 OR 15(d) OF THE SECURITIES EXCHANGE ACT OF 1934 Date of Report (Date of earliest event
OLD DOMINION FREIGHT LINE, INC.
 UNITED STATES SECURITIES AND EXCHANGE COMMISSION Washington, D.C. 20549 FORM 8-K CURRENT REPORT Pursuant to Section 13 or 15(d) of The Securities Exchange Act of 1934 Date of Report (Date of earliest event
CLEVELAND-CLIFFS INC. (Exact name of registrant as specified in its charter)
") UNITED STATES SECURITIES AND EXCHANGE COMMISSION WASHINGTON, D.C. 20549 FORM 8-K CURRENT REPORT PURSUANT TO SECTION 13 OR 15(d) OF THE SECURITIES EXCHANGE ACT OF 1934 Date of Report (Date of earliest event
UNITED STATES SECURITIES AND EXCHANGE COMMISSION WASHINGTON, D.C. 20549 FORM 8-K CURRENT REPORT PURSUANT TO SECTION 13 OR 15(d) OF THE SECURITIES EXCHANGE ACT OF 1934 Date of Report (Date of earliest event
NEWMONT MINING CORP /DE/
 NEWMONT MINING CORP /DE/ FORM 8-K (Current report filing) Filed 07/26/13 for the Period Ending 07/25/13 Address 6363 SOUTH FIDDLERS GREEN CIRCLE GREENWOOD VILLAGE, CO 80111 Telephone 303-863-7414 CIK 0001164727
CROSSTEX ENERGY LP FORM 8-K. (Current report filing) Filed 11/04/11 for the Period Ending 11/04/11
 Filed 11/04/11 for the Period Ending 11/04/11") CROSSTEX ENERGY LP FORM 8-K (Current report filing) Filed 11/04/11 for the Period Ending 11/04/11 CIK 0001179060 Symbol XTEX SIC Code Industry Oil Well Services & Equipment Sector Energy Fiscal Year 12/31
CROSSTEX ENERGY LP FORM 8-K (Current report filing) Filed 11/04/11 for the Period Ending 11/04/11 CIK 0001179060 Symbol XTEX SIC Code Industry Oil Well Services & Equipment Sector Energy Fiscal Year 12/31
TASEKO REPORTS FIRST QUARTER 2018 FINANCIAL RESULTS
 TASEKO REPORTS FIRST QUARTER 2018 FINANCIAL RESULTS This release should be read with the Company s Financial Statements and Management Discussion & Analysis ("MD&A"), available at www.tasekomines.com and
LKQ CORPORATION (Exact name of registrant as specified in its charter)
") UNITED STATES SECURITIES AND EXCHANGE COMMISSION WASHINGTON, DC 20549 FORM 8-K Current Report Pursuant to Section 13 or 15(d) of The Securities Exchange Act of 1934 Date of Report (Date of earliest event
UNITED STATES SECURITIES AND EXCHANGE COMMISSION WASHINGTON, DC 20549 FORM 8-K Current Report Pursuant to Section 13 or 15(d) of The Securities Exchange Act of 1934 Date of Report (Date of earliest event
UNITED STATES SECURITIES AND EXCHANGE COMMISSION Washington, D.C FORM 8-K
 UNITED STATES SECURITIES AND EXCHANGE COMMISSION Washington, D.C. 20549 FORM 8-K CURRENT REPORT Pursuant to Section 13 or 15(d) of the Securities Exchange Act of 1934 Date of Report (date of earliest event
PARKER DRILLING COMPANY (Exact name of registrant as specified in its charter)
") UNITED STATES SECURITIES AND EXCHANGE COMMISSION WASHINGTON, D.C. 20549 FORM 8-K CURRENT REPORT PURSUANT TO SECTION 13 OR 15(D) OF THE SECURITIES EXCHANGE ACT OF 1934 Date of report (Date of earliest event
UNITED STATES SECURITIES AND EXCHANGE COMMISSION WASHINGTON, D.C. 20549 FORM 8-K CURRENT REPORT PURSUANT TO SECTION 13 OR 15(D) OF THE SECURITIES EXCHANGE ACT OF 1934 Date of report (Date of earliest event
SILVER STANDARD RESOURCES INC.
 SILVER STANDARD RESOURCES INC. MANAGEMENT'S DISCUSSION AND ANALYSIS OF THE FINANCIAL POSITION AND RESULTS OF OPERATIONS FOR THE THREE MONTHS ENDED MARCH 31, 2017 1. FIRST QUARTER 2017 HIGHLIGHTS 2. OUTLOOK
UNITED STATES SECURITIES AND EXCHANGE COMMISSION Washington, D.C FORM 8-K. Aon plc (Exact Name of Registrant as Specified in Charter)
") UNITED STATES SECURITIES AND EXCHANGE COMMISSION Washington, D.C. 20549 FORM 8-K CURRENT REPORT Pursuant to Section 13 or 15(d) of the Securities Exchange Act of 1934 Date of report (Date of earliest event
UNITED STATES SECURITIES AND EXCHANGE COMMISSION Washington, D.C. 20549 FORM 8-K CURRENT REPORT Pursuant to Section 13 or 15(d) of the Securities Exchange Act of 1934 Date of report (Date of earliest event
FORM 8-K. BP Midstream Partners LP
 UNITED STATES SECURITIES AND EXCHANGE COMMISSION Washington, D.C. 20549 FORM 8-K CURRENT REPORT Pursuant to Section 13 or 15(d) of the Securities Exchange Act of 1934 Date of Report (date of earliest event
SNAP INC. (Exact name of Registrant as Specified in Its Charter)
") UNITED STATES SECURITIES AND EXCHANGE COMMISSION WASHINGTON, D.C. 20549 FORM 8-K CURRENT REPORT Pursuant to Section 13 or 15(d) of the Securities Exchange Act of 1934 Date of Report (Date of earliest event
UNITED STATES SECURITIES AND EXCHANGE COMMISSION WASHINGTON, D.C. 20549 FORM 8-K CURRENT REPORT Pursuant to Section 13 or 15(d) of the Securities Exchange Act of 1934 Date of Report (Date of earliest event
NEWMONT MINING CORPORATION (Exact name of registrant as specified in its charter)
") UNITED STATES SECURITIES AND EXCHANGE COMMISSION Washington, D. C. 20549 Form 10-Q (Mark One) QUARTERLY REPORT PURSUANT TO SECTION 13 OR 15(d) OF THE SECURITIES EXCHANGE ACT OF 1934 For the Quarterly Period
UNITED STATES SECURITIES AND EXCHANGE COMMISSION Washington, D. C. 20549 Form 10-Q (Mark One) QUARTERLY REPORT PURSUANT TO SECTION 13 OR 15(d) OF THE SECURITIES EXCHANGE ACT OF 1934 For the Quarterly Period
Newmont Announces Second Quarter Operating and Financial Results
 NEWS RELEASE NYSE: NEM newmont.com Newmont Announces Second Quarter Operating and Financial Results DENVER, July 20, 2016 Newmont Mining Corporation (NYSE: NEM) (Newmont or the Company) announced second
Newmont Announces Third Quarter 2017 Results
 NEWS RELEASE NYSE: NEM newmont.com Newmont Announces Third Quarter 2017 Results DENVER, October 26, 2017 Newmont Mining Corporation (NYSE: NEM) (Newmont or the Company) announced third quarter 2017 results.
Capstone Mining 2017 Production Results and 2018 Operating and Capital Guidance
 Suite 2100 510 West Georgia Street Vancouver, BC, V6B 0M3, Canada Tel: 604-684-8894 Fax: 604-688-2180 www.capstonemining.com January 10, 2018 Capstone Mining 2017 Production Results and 2018 Operating
THOMPSON CREEK METALS COMPANY REPORTS INCREASE IN SECOND QUARTER 2014 OPERATING INCOME OF 233% AND POSITIVE NET CASH FLOW
 news release August 5, 2014 NYSE: TC TSX: TCM THOMPSON CREEK METALS COMPANY REPORTS INCREASE IN SECOND QUARTER 2014 OPERATING INCOME OF 233% AND POSITIVE NET CASH FLOW Denver, CO Thompson Creek Metals
TASEKO ANNOUNCES 43 MILLION POUNDS OF COPPER PRODUCTION AND FINANCIAL RESULTS FOR THE THIRD QUARTER
 TASEKO ANNOUNCES 43 MILLION POUNDS OF COPPER PRODUCTION AND FINANCIAL RESULTS FOR THE THIRD QUARTER This release should be read with the Company s Financial Statements and Management Discussion & Analysis
TASEKO REPORTS SECOND QUARTER 2018 FINANCIAL AND OPERATIONAL RESULTS
 TASEKO REPORTS SECOND QUARTER 2018 FINANCIAL AND OPERATIONAL RESULTS This release should be read with the Company s Financial Statements and Management Discussion & Analysis ("MD&A"), available at www.tasekomines.com
IDEXX LABORATORIES, INC. (Exact name of registrant as specified in its charter)
") UNITED STATES SECURITIES AND EXCHANGE COMMISSION Washington, D.C. 20549 FORM 8-K CURRENT REPORT Pursuant to Section 13 or 15(d) of the Securities Exchange Act of 1934 Date of report (Date of earliest event
UNITED STATES SECURITIES AND EXCHANGE COMMISSION Washington, D.C. 20549 FORM 8-K CURRENT REPORT Pursuant to Section 13 or 15(d) of the Securities Exchange Act of 1934 Date of report (Date of earliest event
UNITED STATES SECURITIES AND EXCHANGE COMMISSION Washington, D.C FORM 8-K CURRENT REPORT. Pursuant to Section 13 or 15(d) of the
 of the") UNITED STATES SECURITIES AND EXCHANGE COMMISSION Washington, D.C. 20549 FORM 8-K CURRENT REPORT Pursuant to Section 13 or 15(d) of the Securities Exchange Act of 1934 Date of report (Date of earliest event
UNITED STATES SECURITIES AND EXCHANGE COMMISSION Washington, D.C. 20549 FORM 8-K CURRENT REPORT Pursuant to Section 13 or 15(d) of the Securities Exchange Act of 1934 Date of report (Date of earliest event
Cavco Industries, Inc. (Exact name of registrant as specified in its charter)
") SECURITIES AND EXCHANGE COMMISSION Washington, D.C. 20549 FORM 8-K CURRENT REPORT Pursuant to Section 13 or 15(d) of the Securities Exchange Act of 1934 Date of Report (Date of earliest event reported):
SECURITIES AND EXCHANGE COMMISSION Washington, D.C. 20549 FORM 8-K CURRENT REPORT Pursuant to Section 13 or 15(d) of the Securities Exchange Act of 1934 Date of Report (Date of earliest event reported):
International Paper Company (Exact name of registrant as specified in its charter)
") UNITED STATES SECURITIES AND EXCHANGE COMMISSION Washington, D.C. 20549 FORM 8-K CURRENT REPORT Pursuant to Section 13 or 15(d) of the Securities Exchange Act of 1934 Date of Report (Date of Earliest Event
UNITED STATES SECURITIES AND EXCHANGE COMMISSION Washington, D.C. 20549 FORM 8-K CURRENT REPORT Pursuant to Section 13 or 15(d) of the Securities Exchange Act of 1934 Date of Report (Date of Earliest Event
SNAP INC. (Exact name of Registrant as Specified in Its Charter)
") UNITED STATES SECURITIES AND EXCHANGE COMMISSION WASHINGTON, D.C. 20549 FORM 8-K CURRENT REPORT Pursuant to Section 13 or 15(d) of the Securities Exchange Act of 1934 Date of Report (Date of earliest event
UNITED STATES SECURITIES AND EXCHANGE COMMISSION WASHINGTON, D.C. 20549 FORM 8-K CURRENT REPORT Pursuant to Section 13 or 15(d) of the Securities Exchange Act of 1934 Date of Report (Date of earliest event
Coeur Provides Updated Palmarejo Mine Plan
 NEWS RELEASE Coeur Provides Updated Palmarejo Mine Plan Chicago, Illinois - July 20, 2014 - Coeur Mining, Inc. ( Coeur or the Company ) (NYSE: CDE) announced an updated and re-scoped mine plan and preliminary
LENNAR CORPORATION (Exact name of registrant as specified in its charter)
") UNITED STATES SECURITIES AND EXCHANGE COMMISSION Washington, D.C. 20549 FORM 8-K CURRENT REPORT Pursuant to Section 13 or 15(d) of The Securities Exchange Act of 1934 June 20, 2017 Date of Report (Date
UNITED STATES SECURITIES AND EXCHANGE COMMISSION Washington, D.C. 20549 FORM 8-K CURRENT REPORT Pursuant to Section 13 or 15(d) of The Securities Exchange Act of 1934 June 20, 2017 Date of Report (Date
NEWMONT MINING CORP /DE/
 NEWMONT MINING CORP /DE/ FORM 8-K (Current report filing) Filed 09/28/05 for the Period Ending 09/28/05 Address 6363 SOUTH FIDDLERS GREEN CIRCLE GREENWOOD VILLAGE, CO 80111 Telephone 303-863-7414 CIK 0001164727
UNITED STATES SECURITIES AND EXCHANGE COMMISSION Washington, D.C FORM 8-K
 UNITED STATES SECURITIES AND EXCHANGE COMMISSION Washington, D.C. 20549 FORM 8-K CURRENT REPORT PURSUANT TO SECTION 13 OR 15(D) OF THE SECURITIES EXCHANGE ACT OF 1934 Date of Report (Date of earliest event
TASEKO ANNOUNCES 43 MILLION POUNDS OF COPPER PRODUCTION AND FINANCIAL RESULTS FOR THE THIRD QUARTER
 TASEKO ANNOUNCES 43 MILLION POUNDS OF COPPER PRODUCTION AND FINANCIAL RESULTS FOR THE THIRD QUARTER This release should be read with the Company s Financial Statements and Management Discussion & Analysis
SEMGROUP CORPORATION
 UNITED STATES SECURITIES AND EXCHANGE COMMISSION WASHINGTON, DC 20549 FORM 8-K CURRENT REPORT Pursuant to Section 13 or 15(d) of the Securities Exchange Act of 1934 Date of report (Date of earliest event
Young-Davidson Achieves Record Underground Productivity of 4,900 tonnes per day in April
 Gold Ounces Produced AuRico Gold Reports First Quarter Financial Results; Company-Wide Production of 54,027 Gold Ounces at Cash Costs of $696 per Ounce and Reconfirms Annual Guidance; Declares Dividend
GRANITE CONSTRUCTION INCORPORATED (Exact Name of Registrant as Specified in Charter)
") UNITED STATES SECURITIES AND EXCHANGE COMMISSION WASHINGTON, DC 20549 FORM 8-K CURRENT REPORT Pursuant to Section 13 or 15(d) of the Securities Exchange Act of 1934 Date of report (Date of earliest event
UNITED STATES SECURITIES AND EXCHANGE COMMISSION WASHINGTON, DC 20549 FORM 8-K CURRENT REPORT Pursuant to Section 13 or 15(d) of the Securities Exchange Act of 1934 Date of report (Date of earliest event
Cliffs Natural Resources Inc. Reports 2013 Second-Quarter Results
 July 25, 2013 Cliffs Natural Resources Inc. Reports 2013 Second-Quarter Results - Company Reports 2013 Second-Quarter Revenues of $1.5 Billion and Net Income Attributable to Cliffs' Common Shareholders
STURM, RUGER & COMPANY, INC. (Exact Name of Registrant as Specified in its Charter)
") UNITED STATES SECURITIES AND EXCHANGE COMMISSION Washington, D.C. 20549 FORM 8-K CURRENT REPORT Pursuant to Section 13 or 15(d) of the Securities Exchange Act of 1934 Date of Report (Date of earliest event
UNITED STATES SECURITIES AND EXCHANGE COMMISSION Washington, D.C. 20549 FORM 8-K CURRENT REPORT Pursuant to Section 13 or 15(d) of the Securities Exchange Act of 1934 Date of Report (Date of earliest event