FREEPORT-McMoRan INC. (Exact name of registrant as specified in its charter)
|
|
|
- Sherman Reed
- 5 years ago
- Views:
Transcription

1 UNITED STATES SECURITIES AND EXCHANGE COMMISSION Washington, D.C FORM 8-K CURRENT REPORT Pursuant to Section 13 OR 15(d) of The Securities Exchange Act of 1934 Date of Report (Date of earliest event reported): July 25, 2018 FREEPORT-McMoRan INC. (Exact name of registrant as specified in its charter) Delaware (State or other jurisdiction of incorporation) 333 North Central Avenue (Commission File Number) Phoenix, AZ (Address of principal executive offices) Registrant's telephone number, including area code: (602) (I.R.S. Employer Identification No.) (Zip Code) Check the appropriate box below if the Form 8-K filing is intended to simultaneously satisfy the filing obligation of the registrant under any of the following provisions: [ ] Written communications pursuant to Rule 425 under the Securities Act (17 CFR ) [ ] Soliciting material pursuant to Rule 14a-12 under the Exchange Act (17 CFR a-12) [ ] Pre-commencement communications pursuant to Rule 14d-2(b) under the Exchange Act (17 CFR d-2(b)) [ ] Pre-commencement communications pursuant to Rule 13e-4(c) under the Exchange Act (17 CFR e-4(c)) Indicate by check mark whether the registrant is an emerging growth company as defined in Rule 405 of the Securities Act of 1933 (17 CFR ) or Rule 12b-2 of the Securities Exchange Act of 1934 (17 CFR b-2). Emerging growth company [ ] If an emerging growth company, indicate by check mark if the registrant has elected not to use the extended transition period for complying with any new or revised financial accounting standards provided pursuant to Section 13(a) of the Exchange Act. [ ]
2 Item Results of Operations and Financial Condition. Freeport-McMoRan Inc. (FCX) issued a press release dated July 25, 2018, announcing its second-quarter and six-month 2018 financial and operating results, referencing supplementary schedules (see Exhibit 99.1). Item Regulation FD Disclosure. The slides presented in connection with FCX s second-quarter 2018 earnings conference call conducted via the internet on July 25, 2018 are attached hereto as Exhibit The information furnished pursuant to this Item 7.01 shall not be deemed filed for purposes of Section 18 of the Securities Exchange Act of 1934, as amended (the Exchange Act ), or otherwise subject to the liabilities of that section, nor shall it be deemed incorporated by reference in any filing under the Securities Act of 1933, as amended, or the Exchange Act, regardless of any general incorporation language in such filing. Item Financial Statements and Exhibits. (d) Exhibits. Exhibit Number Exhibit Title 99.1 Press release dated July 25, 2018, titled Freeport-McMoRan Reports Second-Quarter and Six-Month 2018 Results and supplementary schedules Slides presented in connection with FCX s second-quarter 2018 earnings conference call conducted via the internet on July 25, 2018.
3 SIGNATURE Pursuant to the requirements of the Securities Exchange Act of 1934, the registrant has duly caused this report to be signed on its behalf by the undersigned hereunto duly authorized. FREEPORT-McMoRan INC. Date: July 25, 2018 By: /s/ C. Donald Whitmire, Jr C. Donald Whitmire, Jr. Vice President and Controller - Financial Reporting (authorized signatory and Principal Accounting Officer)

4 Freeport-McMoRan Reports Second-Quarter and Six-Month 2018 Results Net income attributable to common stock totaled $869 million, $0.59 per share, in second-quarter After adjusting for net gains of $16 million, $0.01 per share, second-quarter 2018 adjusted net income attributable to common stock totaled $853 million, $0.58 per share. Consolidated sales totaled 989 million pounds of copper, 676 thousand ounces of gold and 24 million pounds of molybdenum in second-quarter Consolidated sales for the year 2018 are expected to approximate 3.8 billion pounds of copper, 2.4 million ounces of gold and 95 million pounds of molybdenum, including 970 million pounds of copper, 700 thousand ounces of gold and 24 million pounds of molybdenum in third-quarter Average realized prices in second-quarter 2018 were $3.08 per pound for copper, $1,274 per ounce for gold and $12.89 per pound for molybdenum. Average unit net cash costs in second-quarter 2018 were $0.96 per pound of copper and are expected to average $1.04 per pound of copper for the year Operating cash flows totaled $1.3 billion (net of $0.2 billion in working capital uses and timing of other tax payments) in second-quarter 2018 and $2.7 billion (net of $0.2 billion in working capital uses and timing of other tax payments) for the first six months of Based on current sales volume and cost estimates, and assuming average prices of $2.75 per pound for copper, $1,250 per ounce for gold and $11.00 per pound for molybdenum for the second half of 2018, operating cash flows are expected to approximate $4.3 billion (net of $0.2 billion in working capital uses and timing of other tax payments) for the year Capital expenditures totaled $0.5 billion (including approximately $0.3 billion for major mining projects) in second-quarter 2018 and $0.9 billion (including approximately $0.5 billion for major mining projects) for the first six months of Capital expenditures for the year 2018 are expected to approximate $2.0 billion, including $1.1 billion for major mining projects primarily associated with underground development activities in the Grasberg minerals district in Indonesia and development of the Lone Star oxide project in Arizona. In April 2018, FCX repaid $454 million in debt, consisting of the redemption of $404 million of senior notes due 2022 and $50 million of senior notes due At June 30, 2018, consolidated debt totaled $11.1 billion and consolidated cash totaled $3.9 billion. FCX had no borrowings and $3.5 billion available under its revolving credit facility at June 30, On June 27, 2018, FCX declared a quarterly cash dividend of $0.05 per share on its common stock, which will be paid on August 1, In July 2018, FCX and PT Freeport Indonesia (PT-FI) entered into a non-binding Heads of Agreement with PT Indonesia Asahan Aluminium (Persero) (Inalum) and Rio Tinto to establish a new long-term partnership between FCX, Inalum and the Indonesian government. Freeport-McMoRan 1
5 PHOENIX, AZ, July 25, Freeport-McMoRan Inc. (NYSE: FCX) reported net income attributable to common stock of $869 million ( $0.59 per share) in second-quarter 2018 and $1.6 billion ( $1.07 per share) for the first six months of 2018, compared with $268 million ( $0.18 per share) in second-quarter 2017 and $496 million ( $0.34 per share) for the first six months of After adjusting for net gains of $16 million ( $0.01 per share), adjusted net income attributable to common stock totaled $853 million ( $0.58 per share) in second-quarter Refer to the supplemental schedule, "Adjusted Net Income," on page VII, which is available on FCX's website, "fcx.com," for additional information. Richard C. Adkerson, President and Chief Executive Officer, said, "Our second quarter results reflect strong performance from our global operations and a continued focus on productivity, cost management and capital discipline. During the first half of 2018, we generated $2.7 billion in cash flow from operations and capital expenditures totaled $0.9 billion, enabling further strengthening of our balance sheet and advancement of initiatives to build value for FCX shareholders. We achieved important progress during the quarter to reach a new long-term partnership structure with the Indonesian government, and we remain focused on completing negotiation and documentation of definitive agreements to restore long-term stability for our Grasberg operations. Despite the recent decline in copper prices associated with the uncertain impact on the global economy of recent international trade actions, we remain positive on the outlook for copper prices given limitations on supply and the important role of copper in the global economy. To date, we have not experienced a decline in demand for our products, but will be prepared to adjust our plans if necessary to respond to market conditions. Our shareholders are well positioned to benefit from FCX s global leadership position in copper, supported by a large, high-quality portfolio of long-lived, geographically diverse assets." SUMMARY FINANCIAL DATA Three Months Ended June 30, Six Months Ended June 30, (in millions, except per share amounts) Revenues a,b $ 5,168 $ 3,711 $ 10,036 $ 7,052 Operating income a $ 1,664 $ 686 $ 3,123 $ 1,283 Net income from continuing operations $ 1,039 $ 326 $ 1,867 $ 594 Net (loss) income from discontinued operations c $ (4) $ 9 $ (15) $ 47 Net income attributable to common stock d,e $ 869 $ 268 $ 1,561 $ 496 Diluted net income (loss) per share of common stock: Continuing operations $ 0.59 $ 0.18 $ 1.08 $ 0.31 Discontinued operations (0.01) 0.03 $ 0.59 $ 0.18 $ 1.07 $ 0.34 Diluted weighted-average common shares outstanding 1,458 1,453 1,458 1,453 Operating cash flows f $ 1,309 $ 1,037 $ 2,678 $ 1,829 Capital expenditures $ 482 $ 362 $ 884 $ 706 At June 30: Cash and cash equivalents $ 3,859 $ 4,667 $ 3,859 $ 4,667 Total debt, including current portion $ 11,127 $ 15,354 $ 11,127 $ 15,354 a. For segment financial results, refer to the supplemental schedules, "Business Segments," beginning on page IX, which are available on FCX's website, "fcx.com." b. Includes adjustments to prior period provisionally priced concentrate and cathode copper sales totaling $23 million ( $9 million to net income attributable to common stock or $0.01 per share) in second-quarter 2018, $(20) million ( $(8) million to net income attributable to common stock or $(0.01) per share) in second-quarter 2017, $(70) million ( $(31) million to net income Freeport-McMoRan 2
6 attributable to common stock or $(0.02) per share) for the first six months of 2018 and $81 million ( $35 million to net income attributable to common stock or $0.02 per share) for the first six months of For further discussion, refer to the supplemental schedule, "Derivative Instruments," beginning on page VIII, which is available on FCX's website, "fcx.com." c. Primarily reflects adjustments to the fair value of contingent consideration related to the 2016 sale of FCX's interest in TF Holdings Limited, which will continue to be adjusted through December 31, d. Includes net gains of $16 million ( $0.01 per share) in second-quarter 2018, $27 million ( $0.01 per share) in second-quarter 2017, $27 million ( $0.02 per share) for the first six months of 2018 and $34 million ( $0.02 per share) for the first six months of 2017 that are described in the supplemental schedule, "Adjusted Net Income," on page VII, which is available on FCX's website, "fcx.com." e. FCX defers recognizing profits on intercompany sales until final sales to third parties occur. For a summary of net impacts from changes in these deferrals, refer to the supplemental schedule, "Deferred Profits," on page IX, which is available on FCX's website, "fcx.com." f. Includes net working capital (uses) sources and timing of other tax payments of $(192) million in second-quarter 2018, $154 million in second-quarter 2017, $(213) million for the first six months of 2018 and $343 million for the first six months of SUMMARY OPERATING DATA Copper (millions of recoverable pounds) Three Months Ended June 30, Six Months Ended June 30, Production 1, ,966 1,734 Sales, excluding purchases ,982 1,751 Average realized price per pound $ 3.08 $ 2.65 $ 3.10 $ 2.65 Site production and delivery costs per pound a $ 1.69 $ 1.63 $ 1.68 $ 1.61 Unit net cash costs per pound a $ 0.96 $ 1.19 $ 0.97 $ 1.28 Gold (thousands of recoverable ounces) Production , Sales, excluding purchases , Average realized price per ounce $ 1,274 $ 1,243 $ 1,291 $ 1,242 Molybdenum (millions of recoverable pounds) Production Sales, excluding purchases Average realized price per pound $ $ 9.58 $ $ 9.16 a. Reflects per pound weighted-average production and delivery costs and unit net cash costs (net of by-product credits) for all copper mines, before net noncash and other costs. For reconciliations of per pound unit costs by operating division to production and delivery costs applicable to sales reported in FCX's consolidated financial statements, refer to the supplemental schedules, "Product Revenues and Production Costs," beginning on page XII, which are available on FCX's website, "fcx.com." Consolidated Sales Volumes Second-quarter 2018 copper sales of 989 million pounds were higher than the April 2018 estimate of 970 million pounds and higher than second-quarter 2017 sales of 942 million pounds, primarily reflecting higher mining and milling rates and higher ore grades in Indonesia. Second-quarter 2018 gold sales of 676 thousand ounces were lower than the April 2018 estimate of 700 thousand ounces, primarily because of timing of shipments, and were higher than second-quarter 2017 sales of 432 thousand ounces, primarily reflecting higher ore grades and operating rates in Indonesia. Lower second-quarter 2017 operating rates in Indonesia included the impact of labor disruptions at PT-FI in the first half of Second-quarter 2018 molybdenum sales of 24 million pounds approximated the April 2018 estimate of 24 million pounds and second-quarter 2017 sales of 25 million pounds. Freeport-McMoRan 3
7 Sales volumes for the year 2018 are expected to approximate 3.8 billion pounds of copper, 2.4 million ounces of gold and 95 million pounds of molybdenum, including 970 million pounds of copper, 700 thousand ounces of gold and 24 million pounds of molybdenum in third-quarter Projections for 2018 and other forward looking statements in this release assume resolution of PT-FI s long-term mining rights or an extension of PT-FI s temporary special mining license (IUPK) after July 31, Refer to "Indonesia Mining," beginning on page 7, for further discussion of Indonesia regulatory matters which could have a significant impact on future results. Consolidated Unit Costs Consolidated average unit net cash costs (net of by-product credits) for FCX's copper mines of $0.96 per pound of copper in second-quarter 2018 were lower than unit net cash costs of $1.19 per pound in second-quarter 2017, primarily reflecting higher by-product credits. Assuming average prices of $1,250 per ounce of gold and $11.00 per pound of molybdenum for the second half of 2018 and achievement of current sales volume and cost estimates, consolidated unit net cash costs (net of by-product credits) for copper mines are expected to average $1.04 per pound of copper for the year The impact of price changes on consolidated unit net cash costs would approximate $0.015 per pound for each $50 per ounce change in the average price of gold and $0.02 per pound for each $2 per pound change in the average price of molybdenum for the second half of Quarterly unit net cash costs vary with fluctuations in sales volumes and realized prices, primarily for gold and molybdenum. MINING OPERATIONS North America Copper Mines. FCX operates seven open-pit copper mines in North America - Morenci, Bagdad, Safford, Sierrita and Miami in Arizona, and Chino and Tyrone in New Mexico. In addition to copper, certain of FCX's North America copper mines produce molybdenum concentrate, gold and silver. All of the North America mining operations are wholly owned, except for Morenci. FCX records its 72 percent undivided joint venture interest in Morenci using the proportionate consolidation method. Operating and Development Activities. FCX has significant undeveloped reserves and resources in North America and a portfolio of potential long-term development projects. Future investments will be undertaken based on the results of economic and technical feasibility studies, and are dependent on market conditions. FCX continues to study opportunities to reduce the capital intensity of its potential long-term development projects. Through exploration drilling, FCX has identified a significant resource at its wholly owned Lone Star project located near the Safford operation in eastern Arizona. An initial project to develop the Lone Star oxide ores has commenced with first production expected by the end of Total capital costs, including mine equipment and preproduction stripping, are expected to approximate $850 million and will benefit from the utilization of existing infrastructure at the adjacent Safford operation. As of June 30, 2018, $113 million has been incurred for this project. Production from the Lone Star oxide ores is expected to average approximately 200 million pounds of copper per year with an approximate 20-year mine life. The project also advances the potential for development of a larger-scale district opportunity. FCX is conducting additional drilling following positive exploration results and continues to evaluate longer term opportunities available from the significant long-term sulfide potential in the Lone Star/Safford minerals district. Freeport-McMoRan 4
8 Operating Data. Following is summary consolidated operating data for the North America copper mines for the second quarters and first six months of 2018 and 2017 : Three Months Ended June 30, Six Months Ended June 30, Copper (millions of recoverable pounds) Production Sales, excluding purchases Average realized price per pound $ 3.12 $ 2.62 $ 3.14 $ 2.65 Molybdenum (millions of recoverable pounds) Production a Unit net cash costs per pound of copper b Site production and delivery, excluding adjustments $ 1.94 $ 1.58 $ 1.89 $ 1.54 By-product credits (0.25) (0.16) (0.22) (0.15) Treatment charges Unit net cash costs $ 1.79 $ 1.52 $ 1.77 $ 1.49 a. Refer to summary operating data on page 3 for FCX's consolidated molybdenum sales, which includes sales of molybdenum produced at the North America copper mines. b. For a reconciliation of unit net cash costs per pound to production and delivery costs applicable to sales reported in FCX's consolidated financial statements, refer to the supplemental schedules, "Product Revenues and Production Costs," beginning on page XII, which are available on FCX's website, "fcx.com." North America's consolidated copper sales volumes of 361 million pounds in second-quarter 2018 were lower than second-quarter 2017 sales of 408 million pounds, primarily reflecting anticipated lower ore grades and timing of second-quarter 2017 shipments. North America copper sales are estimated to approximate 1.45 billion pounds for the year 2018, compared with 1.5 billion pounds in Average unit net cash costs (net of by-product credits) for the North America copper mines of $1.79 per pound of copper in second-quarter 2018 were higher than unit net cash costs of $1.52 per pound in second-quarter 2017, primarily reflecting lower sales volumes and higher mining and milling costs, partly offset by higher by-product credits. Average unit net cash costs (net of by-product credits) for the North America copper mines are expected to approximate $1.78 per pound of copper for the year 2018, based on achievement of current sales volume and cost estimates and assuming an average molybdenum price of $11.00 per pound for the second half of North America's average unit net cash costs for the year 2018 would change by approximately $0.02 per pound for each $2 per pound change in the average price of molybdenum for the second half of South America Mining. FCX operates two copper mines in South America - Cerro Verde in Peru (in which FCX owns a percent interest) and El Abra in Chile (in which FCX owns a 51 percent interest). These operations are consolidated in FCX's financial statements. In addition to copper, the Cerro Verde mine produces molybdenum concentrate and silver. Operating and Development Activities. Cerro Verde's expanded operations benefit from its large-scale, long-lived reserves and cost efficiencies. The Cerro Verde expansion project, which achieved capacity operating rates in early 2016, expanded the concentrator facilities' capacity from 120,000 metric tons of ore per day to 360,000 metric tons of ore per day. In March 2018, Cerro Verde received a modified environmental permit allowing it to operate its existing concentrator facilities at rates up to 409,500 metric tons of ore per day. Cerro Verde's concentrator facilities have continued to perform well, with average mill throughput rates of 385,300 metric tons of ore per day for the first six months of Freeport-McMoRan 5
9 Exploration results at El Abra indicate a significant sulfide resource, which could potentially support a major mill project similar to facilities constructed at Cerro Verde. FCX continues to evaluate a large-scale expansion at El Abra to process additional sulfide material and to achieve higher recoveries. Future investments will depend on technical studies, which are being advanced, economic factors and market conditions : Operating Data. Following is summary consolidated operating data for the South America mining operations for the second quarters and first six months of 2018 and Three Months Ended June 30, Six Months Ended June 30, Copper (millions of recoverable pounds) Production Sales Average realized price per pound $ 3.07 $ 2.67 $ 3.09 $ 2.65 Molybdenum (millions of recoverable pounds) Production a Unit net cash costs per pound of copper b Site production and delivery, excluding adjustments $ 1.77 $ 1.55 $ 1.78 $ 1.52 By-product credits (0.22) (0.13) (0.24) (0.16) Treatment charges Royalty on metals Unit net cash costs $ 1.74 $ 1.65 $ 1.74 $ 1.59 a. Refer to summary operating data on page 3 for FCX's consolidated molybdenum sales, which includes sales of molybdenum produced at Cerro Verde. b. For a reconciliation of unit net cash costs per pound to production and delivery costs applicable to sales reported in FCX's consolidated financial statements, refer to the supplemental schedules, "Product Revenues and Production Costs," beginning on page XII, which are available on FCX's website, "fcx.com." South America's consolidated copper sales volumes of 312 million pounds in second-quarter 2018 were higher than second-quarter 2017 sales of 287 million pounds, primarily reflecting higher mining and milling rates and timing of second-quarter 2017 shipments, partly offset by lower ore grades. Sales from South America mining are expected to approximate 1.2 billion pounds of copper for the year 2018, compared with 1.2 billion pounds of copper in Average unit net cash costs (net of by-product credits) for South America mining of $1.74 per pound of copper in second-quarter 2018 were higher than unit net cash costs of $1.65 per pound in second-quarter 2017, primarily reflecting higher mining and input costs, partly offset by higher volumes and by-product credits. Average unit net cash costs (net of by-product credits) for South America mining are expected to approximate $1.67 per pound of copper for the year 2018, based on current sales volume and cost estimates and assuming an average price of $11.00 per pound of molybdenum for the second half of Cerro Verde and its workers' union are negotiating a new collective labor agreement to replace the agreement that expires August 31, Freeport-McMoRan 6
10 Indonesia Mining. Through its percent owned and consolidated subsidiary PT-FI, FCX's assets include one of the world's largest copper and gold deposits at the Grasberg minerals district in Papua, Indonesia. PT-FI operates a proportionately consolidated joint venture, which produces copper concentrate that contains significant quantities of gold and silver. Regulatory Matters. PT-FI continues to actively engage with Indonesian government officials to address regulatory changes that conflict with its contractual rights in a manner that provides long-term stability for PT-FI s operations and investment plans, and protects value for FCX s shareholders. The parties have been engaged in negotiation and documentation of an IUPK and accompanying documentation for assurances on legal and fiscal terms to provide PT-FI with long-term mining rights through In addition, the IUPK would provide that PT-FI construct a smelter within five years of reaching a definitive agreement and include agreement for the divestment of 51 percent of the project area interests to Indonesian participants at fair market value. In July 2018, FCX entered into a Heads of Agreement with the Indonesian state-owned enterprise Inalum and PT-FI s joint venture partner Rio Tinto. Under the terms of the non-binding agreement, Inalum would acquire for aggregate cash consideration of $3.85 billion all of Rio Tinto's interests associated with its joint venture with PT-FI (Joint Venture) and FCX's interests in PT Indocopper Investama, which owns 9.36 percent of PT-FI. Inalum would contribute the Rio Tinto interests to PT-FI, which would expand PT-FI s asset base, in exchange for a 40 percent share ownership in PT-FI, pursuant to arrangements that would enable FCX and existing PT-FI shareholders to retain the economics of the revenue and cost sharing arrangements under the Joint Venture. Following completion of the transaction, Inalum's share ownership would approximate 51 percent of PT-FI (subject to an agreement between shareholders to replicate the Joint Venture economics) and FCX's ownership would approximate 49 percent. At closing, Rio Tinto would receive $3.5 billion and FCX would receive $350 million in cash proceeds from Inalum. In addition, Rio Tinto would forego in favor of FCX an amount equivalent to Rio Tinto's share of Joint Venture cash flows since January 1, 2018, through closing. Following completion of the ownership restructuring, FCX does not expect its economic exposure to PT-FI to change significantly. FCX expects its share of future cash flows of the expanded PT-FI asset base, combined with the cash proceeds received in the transaction, to be comparable to its existing share of future cash flows under the current Joint Venture arrangement. FCX would also continue to manage the operations of PT-FI. The transaction, which is expected to close during the second half of 2018, is subject to the negotiation and documentation of definitive agreements, including purchase and sale agreements, the extension and stability of PT-FI's long-term mining rights through 2041 in a form acceptable to FCX and Inalum, a shareholders agreement between FCX and Inalum providing for continuity of FCX s management of PT-FI s operations and addressing governance arrangements, and resolution of environmental regulatory matters pending before Indonesia's Ministry of Environment and Forestry satisfactory to the Indonesian government, FCX and Inalum. The terms of these agreements will be subject to approval by the FCX Board of Directors (Board). In February 2018, PT-FI's export license was extended to February 15, 2019, and in July 2018, PT-FI's temporary IUPK was extended to July 31, PT-FI is seeking an extension of the temporary IUPK to remain in effect until definitive agreements are complete. Until definitive agreements are reached, PT-FI has reserved all rights under its Contract of Work (COW), including pursuing arbitration under the dispute resolution procedures. Operating and Development Activities. PT-FI is currently mining the final phase of the Grasberg open pit, which contains high copper and gold ore grades. PT-FI has revised its mine plans to extend mining activities in the open pit by approximately six months following results of an economic analysis. PT-FI expects to mine ore from the open pit until transitioning to the Grasberg Block Cave underground mine in the first half of Lower copper and gold production from Indonesia mining is expected during the transition period in 2019 and PT-FI has several projects in the Grasberg minerals district related to the development of its large-scale, long-lived, high-grade underground ore bodies. In aggregate, these underground ore bodies are expected to produce large-scale quantities of copper and gold following the transition from the Grasberg open pit. Substantial progress has been made to prepare for the transition to mining of the Grasberg Block Cave underground mine. Freeport-McMoRan 7
11 Mine development activities are sufficiently advanced to commence caving in the first half of The ore flow and underground rail haulage systems are expected to be fully commissioned and operational in the second half of PT-FI has revised its mine plan for the ramp-up of the Deep Mill Level Zone (DMLZ) underground mine following mining-induced seismic activity that began in 2017 and continued during During second-quarter 2018, PT-FI initiated plans to conduct hydraulic fracturing activities to manage rock stresses and pre-condition the DMLZ for largescale production. PT-FI's revised mine plans, which will continue to be reviewed, currently project block cave mining activities in the DMLZ to commence in mid-2019 following a period of hydraulic fracturing activities designed to safely manage production. PT-FI continues to expect the DMLZ to reach full production rates of 80,000 metric tons per day in Subject to reaching a definitive agreement with the Indonesian government on PT-FI's long-term mining rights, estimated annual capital spending on these projects would average $0.8 billion per year ( $0.7 billion per year net to PT-FI) over the next five years. Considering the long-term nature and size of these projects, actual costs could vary from these estimates. In response to market conditions and Indonesian regulatory uncertainty, the timing of these expenditures continues to be reviewed and could be reduced or deferred significantly. Operating Data. Following is summary consolidated operating data for the Indonesia mining operations for the second quarters and first six months of 2018 and 2017 : Copper (millions of recoverable pounds) Three Months Ended June 30, Six Months Ended June 30, Production Sales Average realized price per pound $ 3.05 $ 2.67 $ 3.07 $ 2.64 Gold (thousands of recoverable ounces) Production , Sales , Average realized price per ounce $ 1,274 $ 1,243 $ 1,291 $ 1,242 Unit net cash (credits) costs per pound of copper a Site production and delivery, excluding adjustments $ 1.33 $ 1.77 b $ 1.34 $ 1.89 b Gold and silver credits (2.76) (2.21) (2.67) (2.10) Treatment charges Export duties Royalty on metals Unit net cash (credits) costs $ (0.77) $ 0.10 $ (0.70) $ 0.34 a. For a reconciliation of unit net cash (credits) costs per pound to production and delivery costs applicable to sales reported in FCX's consolidated financial statements, refer to the supplemental schedules, "Product Revenues and Production Costs," beginning on page XII, which are available on FCX's website, "fcx.com." b. Excludes fixed costs charged directly to production and delivery costs totaling $82 million ($0.33 per pound of copper) in second-quarter 2017 and $103 million ($0.28 per pound of copper) for the first six months of 2017 associated with workforce reductions. Indonesia's consolidated sales of 316 million pounds of copper and 671 thousand ounces of gold in second-quarter 2018 were higher than second-quarter 2017 sales of 247 million pounds of copper and 427 thousand ounces of gold, primarily reflecting higher operating rates and ore grades. Lower second-quarter 2017 operating rates included the impact of labor disruptions in the first half of Assuming achievement of planned operating rates for the second half of 2018, consolidated sales volumes from Indonesia mining are expected to approximate 1.15 billion pounds of copper and 2.4 million ounces of gold for Freeport-McMoRan 8
12 the year 2018, compared with 1.0 billion pounds of copper and 1.5 million ounces of gold for the year Because of the transition to underground mining, PT-FI's production is expected to be significantly lower in 2019 and 2020, compared to A significant portion of PT-FI's costs are fixed and unit costs vary depending on production volumes and other factors. As a result of higher sales volumes and gold and silver credits, Indonesia had unit net cash credits (including gold and silver credits) of $0.77 per pound of copper in second-quarter 2018, compared with unit net cash costs of $0.10 per pound in second-quarter Assuming an average gold price of $1,250 per ounce for the second half of 2018 and achievement of current sales volume and cost estimates, unit net cash credits (including gold and silver credits) for Indonesia mining are expected to approximate $0.58 per pound of copper for the year Indonesia mining's unit net cash credits for the year 2018 would change by approximately $0.06 per pound for each $50 per ounce change in the average price of gold for the second half of Because of the fixed nature of a large portion of Indonesia's costs, unit net cash credits/costs vary from quarter to quarter depending on copper and gold volumes. Indonesia mining's projected sales volumes and unit net cash credits for the year 2018 are dependent on a number of factors, including operational performance, workforce productivity, timing of shipments, and Indonesia regulatory matters, including the resolution of PT-FI's long-term mining rights or an extension of PT-FI's temporary IUPK after July 31, Molybdenum Mines. FCX has two wholly owned molybdenum mines - the Henderson underground mine and the Climax open-pit mine - both in Colorado. The Henderson and Climax mines produce high-purity, chemical-grade molybdenum concentrate, which is typically further processed into value-added molybdenum chemical products. The majority of molybdenum concentrate produced at the Henderson and Climax mines, as well as from FCX's North America and South America copper mines, is processed at FCX's conversion facilities. Operating and Development Activities. Production from the Molybdenum mines totaled 9 million pounds of molybdenum in second-quarter 2018 and 8 million pounds in second-quarter Refer to summary operating data on page 3 for FCX's consolidated molybdenum sales and average realized prices, which includes sales of molybdenum produced at the Molybdenum mines, and from FCX's North America and South America copper mines. Unit net cash costs for the Molybdenum mines averaged $8.36 per pound of molybdenum in second-quarter 2018 and $7.73 per pound in second-quarter Based on current sales volume and cost estimates, average unit net cash costs for the Molybdenum mines are expected to approximate $8.75 per pound of molybdenum for the year For a reconciliation of unit net cash costs per pound to production and delivery costs applicable to sales reported in FCX's consolidated financial statements, refer to the supplemental schedules, "Product Revenues and Production Costs," beginning on page XII, which are available on FCX's website, "fcx.com." Mining Exploration Activities. FCX's mining exploration activities are generally associated with its existing mines, focusing on opportunities to expand reserves and resources to support development of additional future production capacity. A drilling program to further delineate the Lone Star resource continues to indicate additional mineralization in this district. Exploration results continue to indicate opportunities for significant future potential reserve additions in North America and South America. Exploration spending is expected to approximate $90 million for the year CASH FLOWS, CASH and DEBT Operating Cash Flows. FCX generated operating cash flows of $1.3 billion (net of $0.2 billion in working capital uses and timing of other tax payments) in second-quarter 2018 and $2.7 billion (net of $0.2 billion in working capital uses and timing of other tax payments) for the first six months of Based on current sales volume and cost estimates, and assuming average prices of $2.75 per pound of copper, $1,250 per ounce of gold and $11.00 per pound of molybdenum for the second half of 2018, FCX's consolidated operating cash flows are estimated to approximate $4.3 billion for the year 2018 (net of $0.2 billion in working capital uses and timing of other tax payments). The impact of price changes during the second half of 2018 on operating cash flows would approximate $185 million for each $0.10 per pound change in the average price of Freeport-McMoRan 9
13 copper, $60 million for each $50 per ounce change in the average price of gold and $55 million for each $2 per pound change in the average price of molybdenum. Capital Expenditures. Capital expenditures totaled $0.5 billion in second-quarter 2018 (including approximately $0.3 billion for major mining projects) and $0.9 billion for the first six months of 2018 (including approximately $0.5 billion for major mining projects). Capital expenditures are expected to approximate $2.0 billion for the year 2018, including $1.1 billion for major mining projects primarily associated with underground development activities in the Grasberg minerals district and development of the Lone Star oxide project. Cash. Following is a summary of the U.S. and international components of consolidated cash and cash equivalents available to the parent company, net of noncontrolling interests' share, taxes and other costs at June 30, 2018 (in billions): Cash at domestic companies $ 2.9 Cash at international operations 1.0 Total consolidated cash and cash equivalents 3.9 Noncontrolling interests' share (0.4) Cash, net of noncontrolling interests' share 3.5 Withholding taxes and other (0.1) Net cash available $ 3.4 Debt. Following is a summary of total debt and the related weighted-average interest rates at June 30, 2018 (in billions, except percentages): Weighted- Average Interest Rate Senior Notes $ % Cerro Verde credit facility % Total debt $ % In April 2018, FCX redeemed $404 million of senior notes due 2022 and $50 million of senior notes due 2023, resulting in aggregate annual cash interest savings of approximately $30 million. In second-quarter 2018, FCX recorded a net gain on early extinguishment of debt totaling $9 million primarily related to these redemptions. During April 2018, FCX entered into a new $3.5 billion, five-year, unsecured revolving credit facility with substantially similar structure and terms as its prior facility, which was scheduled to mature in May At June 30, 2018, FCX had no borrowings, $13 million in letters of credit issued and $3.5 billion available under its revolving credit facility. FINANCIAL POLICY In February 2018, the Board reinstated a cash dividend on FCX common stock. On June 27, 2018, FCX declared a quarterly cash dividend of $0.05 per share on its common stock, which will be paid on August 1, 2018, to shareholders of record as of July 13, The declaration of dividends is at the discretion of the Board and will depend upon FCX s financial results, cash requirements, future prospects and other factors deemed relevant by the Board. Freeport-McMoRan 10
14 WEBCAST INFORMATION A conference call with securities analysts to discuss FCX's second-quarter 2018 results is scheduled for today at 10:00 a.m. Eastern Time. The conference call will be broadcast on the Internet along with slides. Interested parties may listen to the conference call live and view the slides by accessing fcx.com. A replay of the webcast will be available through Friday, August 24, FCX is a leading international mining company with headquarters in Phoenix, Arizona. FCX operates large, long-lived, geographically diverse assets with significant proven and probable reserves of copper, gold and molybdenum. FCX is the world's largest publicly traded copper producer. FCX s portfolio of assets includes the Grasberg minerals district in Indonesia, one of the world's largest copper and gold deposits; and significant mining operations in the Americas, including the large-scale Morenci minerals district in North America and the Cerro Verde operation in South America. Additional information about FCX is available on FCX's website at "fcx.com." CautionaryStatementandRegulationGDisclosure:This press release contains forward-looking statements in which FCX discusses its potential future performance. Forward-looking statements are all statements other than statements of historical facts, such as projections or expectations relating to ore grades and milling rates, production and sales volumes, unit net cash costs, operating cash flows, capital expenditures, the transaction contemplated by the non-binding Heads of Agreement between FCX, PT-FI, Inalum and Rio Tinto, exploration efforts and results, development and production activities and costs, liquidity, tax rates, the impact of copper, gold and molybdenum price changes, the impact of deferred intercompany profits on earnings, reserve estimates, future dividend payments, and share purchases and sales. The words anticipates, may, can, plans, believes, estimates, expects, projects, "targets," intends, likely, will, should, to be, potential" and any similar expressions are intended to identify those assertions as forward-looking statements. The declaration of dividends is at the discretion of the Board and will depend on FCX's financial results, cash requirements, future prospects, and other factors deemed relevant by the Board. FCX cautions readers that forward-looking statements are not guarantees of future performance and actual results may differ materially from those anticipated, projected or assumed in the forward-looking statements. Important factors that can cause FCX's actual results to differ materially from those anticipated in the forward-looking statements include supply of and demand for, and prices of, copper, gold and molybdenum; mine sequencing; production rates; potential inventory adjustments; potential impairment of long-lived mining assets; FCX s ability to complete the transaction contemplated by the non-binding Heads of Agreement, which is subject to the negotiation and documentation of definitive agreements, including purchase and sale agreements, the extension and stability of PT-FI's long-term mining rights through 2041 in a form acceptable to FCX and Inalum, a shareholders agreement between FCX and Inalum providing for continuity of FCX s management of PT-FI s operations and addressing governance arrangements, and resolution of administrative sanctions and environmental regulatory matters pending before Indonesia s Ministry of Environment and Forestry satisfactory to the Indonesian government, FCX and Inalum, the terms of all of which will be subject to FCX Board approval; PT-FI s ability to obtain an extension of its temporary IUPK after July 31, 2018; the potential effects of violence in Indonesia generally and in the province of Papua; industry risks; regulatory changes; political risks; labor relations; weather- and climate-related risks; environmental risks (including resolution of the administrative sanctions and other environmental matters pending before Indonesia's Ministry of Environment and Forestry); litigation results (including the final disposition of Indonesian tax disputes and the outcome of Cerro Verde's royalty dispute with the Peruvian national tax authority); and other factors described in more detail under the heading Risk Factors in FCX's Annual Report on Form 10-K for the year ended December 31, 2017, filed with the U.S. Securities and Exchange Commission (SEC) as updated by FCX's subsequent filings with the SEC. Investors are cautioned that many of the assumptions upon which FCX's forward-looking statements are based are likely to change after the forward-looking statements are made, including for example commodity prices, which FCX cannot control, and production volumes and costs, some aspects of which FCX may not be able to control. Further, FCX may make changes to its business plans that could affect its results. FCX cautions investors that it does not intend to update forward-looking statements more frequently than quarterly notwithstanding any changes in its assumptions, changes in business plans, actual experience or other changes, and FCX undertakes no obligation to update any forward-looking statements. This press release also contains certain financial measures such as unit net cash (credits) costs per pound of copper and molybdenum and adjusted net income, which are not recognized under U.S. generally accepted accounting principles. As required by SEC Regulation G, reconciliations of these measures to amounts reported in FCX's consolidated financial statements are in the supplemental schedules of this press release, which are also available on FCX's website, "fcx.com." Freeport-McMoRan 11
15 FREEPORT-McMoRan INC. SELECTED OPERATING DATA Three Months Ended June 30, MINING OPERATIONS: Production Sales COPPER (millions of recoverable pounds) (FCX's net interest in %) North America Morenci (72%) a Bagdad (100%) Safford (100%) Sierrita (100%) Miami (100%) Chino (100%) Tyrone (100%) Other (100%) Total North America South America Cerro Verde (53.56%) El Abra (51%) Total South America Indonesia Grasberg (90.64%) b Total 1, c 942 c Less noncontrolling interests Net Average realized price per pound $ 3.08 $ 2.65 GOLD (thousands of recoverable ounces) (FCX's net interest in %) North America (100%) Indonesia (90.64%) b Consolidated Less noncontrolling interests Net Average realized price per ounce $ 1,274 $ 1,243 MOLYBDENUM (millions of recoverable pounds) (FCX's net interest in %) Henderson (100%) 3 3 N/A N/A Climax (100%) 6 5 N/A N/A North America copper mines (100%) a 8 8 N/A N/A Cerro Verde (53.56%) 7 7 N/A N/A Consolidated Less noncontrolling interests Net Average realized price per pound $ $ 9.58 a. Amounts are net of Morenci's undivided joint venture partners' interests. b. Amounts are net of Grasberg's joint venture partner's interest, which varies in accordance with the terms of the joint venture agreement. c. Consolidated sales volumes exclude purchased copper of 90 million pounds in second-quarter 2018 and 62 million pounds in second- quarter I
16 FREEPORT-McMoRan INC. SELECTED OPERATING DATA (continued) Six Months Ended June 30, MINING OPERATIONS: Production Sales Copper (millions of recoverable pounds) (FCX's net interest in %) North America Morenci (72%) a Bagdad (100%) Safford (100%) Sierrita (100%) Miami (100%) Chino (100%) Tyrone (100%) Other (100%) Total North America South America Cerro Verde (53.56%) El Abra (51%) Total South America Indonesia Grasberg (90.64%) b Total 1,966 1,734 1,982 c 1,751 c Less noncontrolling interests Net 1,620 1,418 1,640 1,437 Average realized price per pound $ 3.10 $ 2.65 Gold (thousands of recoverable ounces) (FCX's net interest in %) North America (100%) Indonesia (90.64%) b 1, , Consolidated 1, , Less noncontrolling interests Net 1, , Average realized price per ounce $ 1,291 $ 1,242 Molybdenum (millions of recoverable pounds) (FCX's net interest in %) Henderson (100%) 7 6 N/A N/A Climax (100%) N/A N/A North America (100%) a N/A N/A Cerro Verde (53.56%) N/A N/A Consolidated Less noncontrolling interests Net Average realized price per pound $ $ 9.16 a. Amounts are net of Morenci's undivided joint venture partners' interests. b. Amounts are net of Grasberg's joint venture partner's interest, which varies in accordance with the terms of the joint venture agreement. c. Consolidated sales volumes exclude purchased copper of 164 million pounds for the first six months of 2018 and 120 million pounds for the first six months of II
17 FREEPORT-McMoRan INC. SELECTED OPERATING DATA (continued) Three Months Ended June 30, Six Months Ended June 30, % North America Copper Mines Solution Extraction/Electrowinning (SX/EW) Operations Leach ore placed in stockpiles (metric tons per day) 689, , , ,300 Average copper ore grade (percent) Copper production (millions of recoverable pounds) Mill Operations Ore milled (metric tons per day) 307, , , ,400 Average ore grades (percent): Copper Molybdenum Copper recovery rate (percent) Production (millions of recoverable pounds): Copper Molybdenum % South America Mining SX/EW Operations Leach ore placed in stockpiles (metric tons per day) 246, , , ,100 Average copper ore grade (percent) Copper production (millions of recoverable pounds) Mill Operations Ore milled (metric tons per day) 385, , , ,300 Average ore grades (percent): Copper Molybdenum Copper recovery rate (percent) Production (millions of recoverable pounds): Copper Molybdenum % Indonesia Mining Ore milled (metric tons per day): a Grasberg open pit 148,400 88, ,800 71,200 Deep Ore Zone underground mine 29,200 27,300 34,300 26,800 Deep Mill Level Zone (DMLZ) underground mine b 2,700 3,800 2,700 3,500 Grasberg Block Cave underground mine b 3,800 3,800 3,900 3,200 Big Gossan underground mine b 3,800 3, Total 187, , , ,500 Average ore grades: Copper (percent) Gold (grams per metric ton) Recovery rates (percent): Copper Gold Production (recoverable): Copper (millions of pounds) Gold (thousands of ounces) , % Molybdenum Mines Ore milled (metric tons per day) 28,900 22,000 26,000 21,800 Average molybdenum ore grade (percent) Molybdenum production (millions of recoverable pounds) a. Amounts represent the approximate average daily throughput processed at PT Freeport Indonesia's (PT-FI) mill facilities from each producing mine and from development activities that result in metal production. b. Targeted production rates once the DMLZ underground mine reaches full capacity are expected to approximate 80,000 metric tons of ore per day in 2022; production from the Grasberg Block Cave underground mine is expected to commence in the first half of 2019, and production from the Big Gossan underground mine restarted in fourth-quarter 2017.
18 III
19 FREEPORT-McMoRan INC. CONSOLIDATED STATEMENTS OF INCOME (Unaudited) Three Months Ended Six Months Ended June 30, June 30, a a (In Millions, Except Per Share Amounts) Revenues b $ 5,168 $ 3,711 $ 10,036 $ 7,052 Cost of sales: Production and delivery c 2,915 2,480 5,723 4,668 Depreciation, depletion and amortization Total cost of sales 3,357 2,930 6,616 5,507 Selling, general and administrative expenses c Mining exploration and research expenses Environmental obligations and shutdown costs 59 (21) 68 4 Net gain on sales of assets (45) (10) (56) (33) Total costs and expenses 3,504 3,025 6,913 5,769 Operating income 1, ,123 1,283 Interest expense, net c,d (142) (162) (293) (329) Net gain (loss) on early extinguishment of debt 9 (4) 8 (3) Other income (expense), net c 20 (7) 49 e Income from continuing operations before income taxes and equity in affiliated companies' net earnings (losses) 1, , Provision for income taxes f (515) (186) (1,021) (360) Equity in affiliated companies' net earnings (losses) 3 (1) 1 3 Net income from continuing operations 1, , Net (loss) income from discontinued operations g (4) 9 (15) 47 Net income 1, , Net income attributable to noncontrolling interests: Continuing operations (166) (66) (291) (141) Discontinued operations (1) (4) Net income attributable to FCX common stock h $ 869 $ 268 $ 1,561 $ 496 Basic net income (loss) per share attributable to common stock: Continuing operations $ 0.60 $ 0.18 $ 1.08 $ 0.31 Discontinued operations (0.01) 0.03 Diluted net income (loss) per share attributable to common stock: $ 0.60 $ 0.18 $ 1.07 $ 0.34 Continuing operations $ 0.59 $ 0.18 $ 1.08 $ 0.31 Discontinued operations (0.01) 0.03 Weighted-average common shares outstanding: $ 0.59 $ 0.18 $ 1.07 $ 0.34 Basic 1,449 1,447 1,449 1,447 Diluted 1,458 1,453 1,458 1,453 Dividends declared per share of common stock $ 0.05 $ $ 0.10 $ a. The adoption of accounting guidance related to the presentation of retirement benefits resulted in the reclassification of the non-service components of net periodic benefit cost to other income (expense), net. b. Revenues include adjustments to provisionally priced concentrate and cathode sales. For a summary of adjustments to provisionally priced copper sales, refer to the supplemental schedule, "Derivative Instruments," beginning on page VIII. c. Includes net mining and oil and gas charges that are summarized in the supplemental schedule, "Adjusted Net Income," on page VII. d. Consolidated interest costs (before capitalization) totaled $165 million in second-quarter 2018, $192 million in second-quarter 2017, $341 million for the first six months of 2018 and $387 million for the first six months of e. Includes interest received by PT-FI with the refund of prior years' tax receivables, which is summarized in the supplemental schedule, "Adjusted Net Income," on page VII. f. For a summary of FCX's provision for income taxes, refer to the supplemental schedule, "Income Taxes," on page VIII. g. Primarily reflects adjustments to the estimated fair value of contingent consideration related to the 2016 sale of FCX s interest in TF Holdings Limited (TFHL), which will continue to be adjusted through December 31, h. FCX defers recognizing profits on intercompany sales until final sales to third parties occur. Refer to the supplemental schedule, "Deferred Profits," on page IX for a summary of net impacts from changes in these deferrals. IV
20 FREEPORT-McMoRan INC. CONSOLIDATED BALANCE SHEETS (Unaudited) June 30, December 31, (In Millions) ASSETS Current assets: Cash and cash equivalents $ 3,859 $ 4,447 Trade accounts receivable 1,077 1,246 Income and other tax receivables Inventories: Mill and leach stockpiles 1,435 1,422 Materials and supplies, net 1,404 1,305 Product 1,337 1,166 Other current assets Held for sale Total current assets 10,343 10,689 Property, plant, equipment and mine development costs, net 22,923 22,934 Long-term mill and leach stockpiles 1,371 1,409 Other assets 2,391 2,270 Total assets $ 37,028 $ 37,302 LIABILITIES AND EQUITY Current liabilities: Accounts payable and accrued liabilities $ 2,420 $ 2,321 Accrued income taxes Current portion of environmental and asset retirement obligations Dividends payable 73 Current portion of debt 4 1,414 Held for sale Total current liabilities 3,799 5,011 Long-term debt, less current portion 11,123 11,703 Deferred income taxes 3,702 3,649 Environmental and asset retirement obligations, less current portion 3,631 3,631 Other liabilities 1,931 2,012 Total liabilities 24,186 26,006 Equity: Stockholders' equity: Common stock Capital in excess of par value 26,667 26,751 Accumulated deficit (13,161) (14,722) Accumulated other comprehensive loss (464) (487) Common stock held in treasury (3,726) (3,723) Total stockholders' equity 9,474 7,977 Noncontrolling interests 3,368 3,319 Total equity 12,842 11,296 Total liabilities and equity $ 37,028 $ 37,302 V
21 FREEPORT-McMoRan INC. CONSOLIDATED STATEMENTS OF CASH FLOWS (Unaudited) Six Months Ended June 30, (In Millions) Cash flow from operating activities: Net income $ 1,852 $ 641 Adjustments to reconcile net income to net cash provided by operating activities: Depreciation, depletion and amortization Net gain on sales of assets (56) (33) Stock-based compensation Payments for Cerro Verde royalty dispute (21) (21) Net charges for environmental and asset retirement obligations, including accretion Payments for environmental and asset retirement obligations (110) (59) Net charges for defined pension and postretirement plans Pension plan contributions (44) (56) Net (gain) loss on early extinguishment of debt (8) 3 Deferred income taxes Loss (gain) on disposal of discontinued operations 15 (38) Decrease in long-term mill and leach stockpiles Non-cash drillship settlements/idle rig costs and other oil and gas adjustments (33) Oil and gas contract settlement payments (70) Other, net 21 (23) Changes in working capital and other tax payments: Accounts receivable Inventories (468) (101) Other current assets (20) (2) Accounts payable and accrued liabilities 114 (267) Accrued income taxes and timing of other tax payments (148) 124 Net cash provided by operating activities 2,678 1,829 Cash flow from investing activities: Capital expenditures: North America copper mines (232) (67) South America (138) (45) Indonesia (449) (457) Molybdenum mines (2) (2) Other (63) (135) Intangible water rights and other, net (86) 3 Net cash used in investing activities (970) (703) Cash flow from financing activities: Proceeds from debt Repayments of debt (2,297) (1,250) Cash dividends paid: Common stock (73) (2) Noncontrolling interests (241) (39) Stock-based awards net proceeds (payments) 5 (8) Debt financing costs and other, net (23) (11) Net cash used in financing activities (2,277) (704) Net (decrease) increase in cash, cash equivalents, restricted cash and restricted cash equivalents (569) 422 Decrease in cash and cash equivalents in assets held for sale 44 7 Cash, cash equivalents, restricted cash and restricted cash equivalents at beginning of year 4,631 4,403 Cash, cash equivalents, restricted cash and restricted cash equivalents at end of period a $ 4,106 $ 4,832 a. Includes restricted cash and restricted cash equivalents of $247 million at June 30, 2018, and $165 million at June 30, VI
22 FREEPORT-McMoRan INC. ADJUSTED NET INCOME Adjusted net income is intended to provide investors and others with information about FCX's recurring operating performance. This information differs from net income attributable to common stock determined in accordance with U.S. generally accepted accounting principles (GAAP) and should not be considered in isolation or as a substitute for measures of performance determined in accordance with U.S. GAAP. FCX's adjusted net income follows, which may not be comparable to similarly titled measures reported by other companies (in millions, except per share amounts). Three Months Ended June 30, Pre-tax After-tax a Per Share Pre-tax After-tax a Per Share Net income attributable to common stock N/A $ 869 $ 0.59 N/A $ 268 $ 0.18 PT-FI net charges for workforce reductions (87) Other net mining credits (charges) 14 c b (46) (0.03) (9) (9) (0.01) Net oil and gas credits 6 6 Net adjustments to environmental obligations and related litigation reserves (50) (50) (0.03) Net gain on sales of assets 45 d Net gain (loss) on early extinguishment of debt (4) (4) Net tax credits e N/A 7 N/A (Loss) gain on discontinued operations f (4) (4) 10 8 $ 14 $ 16 $ 0.01 g $ (44) $ 27 $ 0.01 Adjusted net income attributable to common stock N/A $ 853 $ 0.58 N/A $ 241 $ 0.17 Six Months Ended June 30, Pre-tax After-tax a Per Share Pre-tax After-tax a Per Share Net income attributable to common stock N/A $ 1,561 $ 1.07 N/A $ 496 $ 0.34 PT-FI charges for workforce reductions $ $ $ $ (108) Other net mining credits (charges) 10 Net oil and gas credits 4 c b $ (57) $ (0.04) (28) (28) (0.02) h Net adjustments to environmental obligations and related litigation reserves (50) (50) (0.03) Net gain on sales of assets 56 d Net gain (loss) on early extinguishment of debt 8 8 (3) (3) PT-FI interest on tax refund 24 i Net tax credits e N/A 7 N/A (Loss) gain on discontinued operations f (15) (15) (0.01) $ 33 $ 27 $ 0.02 $ (40) $ 34 $ 0.02 g Adjusted net income attributable to common stock N/A $ 1,534 $ 1.05 N/A $ 462 $ 0.32 a. Reflects impact to FCX net income attributable to common stock (i.e., net of any taxes and noncontrolling interests). b. Includes charges totaling $82 million in second-quarter 2017 and $103 million for the first six months of 2017 in production and delivery costs and $5 million for the second quarter and first six months of 2017 in selling, general and administrative expenses. c. Includes net credits totaling $10 million for the second quarter and first six months of 2018 in production and delivery costs and $6 million for the second quarter and first six months of 2018 in other income (expense), net, partly offset by interest expense totaling $2 million in second-quarter 2018 and $6 million for the first six months of d. Reflects adjustments to the estimated fair value of the potential $150 million in contingent consideration related to the 2016 sale of onshore California oil and gas properties, which will continue to be adjusted through December 31, e. Refer to "Income Taxes" on page VIII, for further discussion of net tax credits. f. Primarily reflects adjustments to the estimated fair value of the potential $120 million in contingent consideration related to the 2016 sale of FCX s interest in TFHL, which will continue to be adjusted through December 31, g. Does not foot because of rounding. h. Includes adjustments to the fair value of contingent payments totaling $26 million in production and delivery costs related to the 2016 drillship settlements, partly offset by charges totaling $22 million in selling, general and administrative expenses primarily for contract termination costs. i. Reflects interest received with the refund of prior years' tax receivables. VII
23 FREEPORT-McMoRan INC. INCOME TAXES Following is a summary of the approximate amounts used in the calculation of FCX's consolidated income tax provision for the second quarters and first six months of 2018 and 2017 (in millions, except percentages): Three Months Ended June 30, Income Tax Income Tax Effective (Provision) Effective (Provision) Income a Tax Rate Benefit Income a Tax Rate Benefit U.S. $ 141 (4)% $ 5 b $ 51 (61)% $ 31 c South America % (108) d % (58) Indonesia 1,012 42% (429) % (135) Eliminations and other 122 N/A (28) 1 N/A (23) Rate adjustment e N/A 45 N/A (1) Continuing operations $ 1,551 33% $ (515) $ % $ (186) Six Months Ended June 30, Income Tax U.S. $ 311 (3)% $ 9 Income Tax Effective (Provision) Effective (Provision) Income a Tax Rate Benefit Income a Tax Rate Benefit d South America % (180) b $ 61 (39)% $ 24 c % (159) Indonesia 1,945 43% (830) % (202) Eliminations and other 172 N/A (31) 17 N/A (24) Rate adjustment e N/A 11 N/A 1 Continuing operations $ 2,887 35% f $ (1,021) $ % $ (360) a. Represents income from continuing operations by geographic location before income taxes and equity in affiliated companies' net earnings (losses). b. The second quarter and first six months of 2018 include a tax credit of $5 million associated with the settlement of a state income tax examination. c. Includes net tax credits of $32 million in second-quarter 2017 and $31 million for the first six months of 2017 associated with anticipated recovery of alternative minimum tax credit carryforwards. d. The second quarter and first six months of 2018 include a tax credit of $5 million ( $2 million net of noncontrolling interest) associated with Cerro Verde s disputed royalties and other related mining taxes. e. In accordance with applicable accounting rules, FCX adjusts its interim provision for income taxes equal to its consolidated tax rate. f. The consolidated effective income tax rate is a function of the combined effective tax rates for the jurisdictions in which FCX operates. Accordingly, variations in the relative proportions of jurisdictional income result in fluctuations to FCX's consolidated effective income tax rate. Assuming achievement of current sales volume and cost estimates and average prices of $2.75 per pound for copper, $1,250 per ounce for gold and $11.00 per pound for molybdenum for the second half of 2018, FCX estimates its consolidated effective tax rate for the year 2018 would approximate 38 percent, which would result in a consolidated effective tax rate of approximately 46 percent in third-quarter 2018 and 38 percent in fourth-quarter FCX expects that its consolidated effective tax rate for the year 2018 would decrease with higher prices. DERIVATIVE INSTRUMENTS For the first six months of 2018, FCX's mined copper was sold 59 percent in concentrate, 21 percent as cathode and 20 percent as rod from North America operations. Substantially all of FCX's copper concentrate and cathode sales contracts provide final pricing in a specified future month (generally one to four months from the shipment date) based primarily on quoted London Metal Exchange (LME) monthly average copper prices. FCX records revenues and invoices customers at the time of shipment based on thencurrent LME prices, which results in an embedded derivative on provisionally priced concentrate and cathode sales that is adjusted to fair value through earnings each period, using the period-end forward prices, until final pricing on the date of settlement. LME copper settlement prices averaged $3.12 per pound during second-quarter 2018 and settled at $3.01 per pound on June 30, Because a significant portion of FCX's copper concentrate and cathode sales in any quarterly period usually remain subject to final pricing, the quarter-end forward price is a major determinant of the average recorded copper price for the period. FCX's average realized copper price was $3.08 per pound in secondquarter VIII
24 FREEPORT-McMoRan INC. DERIVATIVE INSTRUMENTS (continued) Following is a summary of the adjustments to prior period and current period provisionally priced copper sales (in millions, except per share amounts): Prior Period a Three Months Ended June 30, Current Period b Total Prior Period a Current Period b Total Revenues $ 23 $ (37) $ (14) $ (20) $ 55 $ 35 Net income attributable to common stock $ 9 $ (15) $ (6) $ (8) $ 22 $ 14 Net income per share of common stock $ 0.01 $ (0.01) $ $ (0.01) $ 0.02 $ 0.01 a. Reflects adjustments to prior period provisionally priced copper sales (i.e., provisionally priced copper sales at March 31, 2018 and 2017). b. Reflects adjustments to provisionally priced copper sales in the second quarters of 2018 and Prior Period a Six Months Ended June 30, Current Period b Total Prior Period a Current Period b Total Revenues $ (70) $ (79) $ (149) $ 81 $ 61 $ 142 Net income attributable to common stock $ (31) $ (33) $ (64) $ 35 $ 26 $ 61 Net income per share of common stock $ (0.02) $ (0.02) $ (0.04) $ 0.02 $ 0.02 $ 0.04 a. Reflects adjustments to prior period provisionally priced copper sales (i.e., provisionally priced copper sales at December 31, 2017 and 2016). b. Reflects adjustments to provisionally priced copper sales for the first six months of 2018 and At June 30, 2018, FCX had provisionally priced copper sales at its copper mining operations totaling 336 million pounds of copper (net of intercompany sales and noncontrolling interests) recorded at an average of $3.01 per pound, subject to final pricing over the next several months. FCX estimates that each $0.05 change in the price realized from the June 30, 2018, provisional price recorded would have an approximate $10 million effect on 2018 net income attributable to common stock. The LME copper price settled at $2.80 per pound on July 24, DEFERRED PROFITS FCX defers recognizing profits on sales from its mining operations to Atlantic Copper and on 25 percent of PT-FI's sales to PT Smelting (PT-FI's 25 percent-owned Indonesian smelting unit) until final sales to third parties occur. Changes in these deferrals attributable to variability in intercompany volumes resulted in net additions (reductions) to net income attributable to common stock totaling $27 million in second-quarter 2018, $(51) million in second-quarter 2017, $20 million for the first six months of 2018 and $(24) million for the first six months of FCX's net deferred profits on its inventories at Atlantic Copper and PT Smelting to be recognized in future periods' net income attributable to common stock totaled $71 million at June 30, Quarterly variations in ore grades, the timing of intercompany shipments and changes in product prices will result in variability in FCX's net deferred profits and quarterly earnings. BUSINESS SEGMENTS FCX has organized its mining operations into four primary divisions North America copper mines, South America mining, Indonesia mining and Molybdenum mines, and operating segments that meet certain thresholds are reportable segments. Separately disclosed in the following tables are FCX's reportable segments, which include the Morenci, Cerro Verde and Grasberg (Indonesia Mining) copper mines, the Rod & Refining operations and Atlantic Copper Smelting & Refining. Intersegment sales between FCX s business segments are based on terms similar to arms-length transactions with third parties at the time of the sale. Intersegment sales may not be reflective of the actual prices ultimately realized because of a variety of factors, including additional processing, the timing of sales to unaffiliated customers and transportation premiums. FCX allocates certain operating costs, expenses and capital expenditures to its operating divisions and individual segments. However, not all costs and expenses applicable to an operation are allocated. U.S. federal and state income taxes are recorded and managed at the corporate level (included in Corporate, Other & Eliminations), whereas foreign income taxes are recorded and managed at the applicable country level. In addition, most mining exploration and research activities are managed on a consolidated basis, and those costs along with some selling, general and administrative costs, are not allocated to the operating divisions or individual segments. Accordingly, the following segment information reflects management determinations that may not be indicative of what the actual financial performance of each operating division or segment would be if it was an independent entity. IX
25 FREEPORT-McMoRan INC. BUSINESS SEGMENTS (continued) (In millions) Atlantic Corporate, North America Copper Mines South America Mining Copper Other Other Cerro Other Indonesia Molybdenum Rod & Smelting & Elimi- FCX Morenci Mines Total Verde Mines Total Mining Mines Refining & Refining nations a Total Three Months Ended June 30, 2018 Revenues: Unaffiliated customers $ 25 $ 13 $ 38 $ 719 $ 171 $ 890 $ 1,639 b $ $ 1,387 $ 602 $ 612 c $ 5,168 Intersegment , (1,429) Production and delivery , (916) 2,915 Depreciation, depletion and amortization Selling, general and administrative expenses Mining exploration and research expenses Environmental obligations and shutdown costs Net gain on sales of assets (45) (45) Operating income (loss) , (26) 1,664 Interest expense, net Provision for (benefit from) income taxes (22) 515 Total assets at June 30, ,819 4,374 7,193 8,630 1,715 10,345 10,911 1, ,550 37,028 Capital expenditures d Three Months Ended June 30, 2017 Revenues: Unaffiliated customers $ 45 $ 32 $ 77 $ 567 $ 111 $ 678 $ 1,065 b $ $ 1,046 $ 400 $ 445 c $ 3,711 Intersegment , (1,205) Production and delivery e 58 1, (755) 2,480 Depreciation, depletion and amortization Selling, general and administrative e expenses Mining exploration and research expenses Environmental obligations and shutdown costs (21) (21) Net gain on sale of assets (10) (10) Operating income (loss) (6) 2 (11) (86) 686 Interest expense, net Provision for (benefit from) income taxes (9) 186 Total assets at June 30, ,830 4,314 7,144 8,828 1,479 10,307 10,769 1, ,931 37,043 Capital expenditures a. Includes U.S. oil and gas operations, which were previously a reportable segment. b. Includes PT-FI's sales to PT Smelting totaling $649 million in second-quarter 2018 and $536 million in second-quarter c. Includes revenues from FCX's molybdenum sales company, which includes sales of molybdenum produced by the Molybdenum mines and by certain of the North America and South America copper mines. d. Includes assets held for sale, primarily Freeport Cobalt, totaling $625 million at June 30, 2018, and $373 million at June 30, e. Includes net charges at PT-FI associated with workforce reductions totaling $82 million in production and delivery costs and $5 million in selling, general and administrative expenses. d X
26 FREEPORT-McMoRan INC. BUSINESS SEGMENTS (continued) (In millions) Atlantic Corporate North America Copper Mines South America Mining Copper Other Other Cerro Other Indonesia Molybdenum Rod & Smelting & Elimi- FCX Morenci Mines Total Verde Mines Total Mining Mines Refining & Refining nations a Total Six Months Ended June 30, 2018 Revenues: Unaffiliated customers $ 28 $ 28 $ 56 $ 1,344 $ 321 $ 1,665 $ 3,160 b $ $ 2,772 $ 1,179 $ 1,204 c $ 10,036 Intersegment 1,169 1,330 2, (2,978) Production and delivery , , ,777 1,135 (1,910) 5,723 Depreciation, depletion and amortization Selling, general and administrative expenses Mining exploration and research expenses Environmental obligations and shutdown costs Net gain on sales of assets (56) (56) Operating income (loss) , (109) 3,123 Interest expense, net Provision for income taxes ,021 Capital expenditures Six Months Ended June 30, 2017 Revenues: Unaffiliated customers $ 111 $ 82 $ 193 $ 1,207 $ 223 $ 1,430 $ 1,599 b $ $ 2,153 $ 858 $ 819 c $ 7,052 Intersegment 894 1,156 2, (2,371) Production and delivery , d 110 2, (1,573) 4,668 Depreciation, depletion and amortization Selling, general and administrative d expenses Mining exploration and research expenses Environmental obligations and shutdown costs 4 4 Net gain on sales of assets (33) (33) Operating income (loss) (14) 6 (1) (217) 1,283 Interest expense, net Provision for (benefit from) income taxes (4) 360 Capital expenditures a. Includes U.S. oil and gas operations, which were previously a reportable segment. b. Includes PT-FI's sales to PT Smelting totaling $1.3 billion for the first six months of 2018 and $794 million for the first six months of c. Includes revenues from FCX's molybdenum sales company, which includes sales of molybdenum produced by the Molybdenum mines and by certain of the North America and South America copper mines. d. Includes net charges at PT-FI associated with workforce reductions totaling $103 million in production and delivery costs and $5 million in selling, general and administrative expenses. XI
27 FREEPORT-McMoRan INC. PRODUCT REVENUES AND PRODUCTION COSTS Unit net cash (credits) costs per pound of copper and molybdenum are measures intended to provide investors with information about the cash-generating capacity of FCX's mining operations expressed on a basis relating to the primary metal product for the respective operations. FCX uses this measure for the same purpose and for monitoring operating performance by its mining operations. This information differs from measures of performance determined in accordance with U.S. GAAP and should not be considered in isolation or as a substitute for measures of performance determined in accordance with U.S. GAAP. These measures are presented by other metals mining companies, although FCX's measures may not be comparable to similarly titled measures reported by other companies. FCX presents gross profit per pound of copper in the following tables using both a by-product method and a co-product method. FCX uses the by-product method in its presentation of gross profit per pound of copper because (i) the majority of its revenues are copper revenues, (ii) it mines ore, which contains copper, gold, molybdenum and other metals, (iii) it is not possible to specifically assign all of FCX's costs to revenues from the copper, gold, molybdenum and other metals it produces and (iv) it is the method used by FCX's management and Board to monitor FCX's mining operations and to compare mining operations in certain industry publications. In the co-product method presentations, shared costs are allocated to the different products based on their relative revenue values, which will vary to the extent FCX's metals sales volumes and realized prices change. FCX shows revenue adjustments for prior period open sales as a separate line item. Because these adjustments do not result from current period sales, these amounts have been reflected separately from revenues on current period sales. Noncash and other costs, which are removed from site production and delivery costs in the calculation of unit net cash (credits) costs, consist of items such as stock-based compensation costs, start-up costs, inventory adjustments, long-lived asset impairments, restructuring and/or unusual charges. As discussed above, gold, molybdenum and other metal revenues at copper mines are reflected as credits against site production and delivery costs in the by-product method. The following schedules are presentations under both the by-product and co-product methods together with reconciliations to amounts reported in FCX's consolidated financial statements. XII
28 FREEPORT-McMoRan INC. PRODUCT REVENUES AND PRODUCTION COSTS (continued) North America Copper Mines Product Revenues, Production Costs and Unit Net Cash Costs Three Months Ended June 30, 2018 (In millions) By-Product Co-Product Method Method Copper Molybdenum a Other b Total Revenues, excluding adjustments $ 1,126 $ 1,126 $ 91 $ 22 $ 1,239 Site production and delivery, before net noncash and other costs shown below By-product credits (90) Treatment charges Net cash costs Depreciation, depletion and amortization (DD&A) Noncash and other costs, net Total costs Other revenue adjustments, primarily for pricing on prior period open sales Gross profit $ 365 $ 343 $ 16 $ 6 $ 365 Copper sales (millions of recoverable pounds) Molybdenum sales (millions of recoverable pounds) a 8 Gross profit per pound of copper/molybdenum: Revenues, excluding adjustments $ 3.12 $ 3.12 $ Site production and delivery, before net noncash and other costs shown below By-product credits (0.25) Treatment charges Unit net cash costs DD&A Noncash and other costs, net Total unit costs Other revenue adjustments, primarily for pricing on prior period open sales Gross profit per pound $ 1.01 $ 0.95 $ 2.09 Reconciliation to Amounts Reported (In millions) Production Revenues and Delivery DD&A Totals presented above $ 1,239 $ 724 $ 91 Treatment charges (5) 32 Noncash and other costs, net 23 Other revenue adjustments, primarily for pricing on prior period open sales 1 Eliminations and other North America copper mines 1, Other mining c 4,738 3, Corporate, other & eliminations (817) (916) 14 As reported in FCX's consolidated financial statements $ 5,168 $ 2,915 $ 442 a. Reflects sales of molybdenum produced by certain of the North America copper mines to FCX's molybdenum sales company at market-based pricing. b. Includes gold and silver product revenues and production costs. c. Represents the combined total for FCX's other mining operations, including South America mining, Indonesia mining, Molybdenum mines, Rod & Refining and Atlantic Copper Smelting & Refining, as presented in the supplemental schedule, "Business Segments," beginning on page IX. XIII
29 FREEPORT-McMoRan INC. PRODUCT REVENUES AND PRODUCTION COSTS (continued) North America Copper Mines Product Revenues, Production Costs and Unit Net Cash Costs Three Months Ended June 30, 2017 (In millions) By-Product Co-Product Method Method Copper Molybdenum a Other b Total Revenues, excluding adjustments $ 1,068 $ 1,068 $ 63 $ 23 $ 1,154 Site production and delivery, before net noncash and other costs shown below By-product credits (65) Treatment charges Net cash costs DD&A Noncash and other costs, net Total costs Other revenue adjustments, primarily for pricing on prior period open sales (2) (2) (2) Gross profit $ 310 $ 295 $ 10 $ 5 $ 310 Copper sales (millions of recoverable pounds) Molybdenum sales (millions of recoverable pounds) a 8 Gross profit per pound of copper/molybdenum: Revenues, excluding adjustments $ 2.62 $ 2.62 $ 8.17 Site production and delivery, before net noncash and other costs shown below By-product credits (0.16) Treatment charges Unit net cash costs DD&A Noncash and other costs, net Total unit costs Other revenue adjustments, primarily for pricing on prior period open sales Gross profit per pound $ 0.76 $ 0.73 $ 1.34 Reconciliation to Amounts Reported (In millions) Production Revenues and Delivery DD&A Totals presented above $ 1,154 $ 666 $ 117 Treatment charges (19) 21 Noncash and other costs, net 19 Other revenue adjustments, primarily for pricing on prior period open sales (2) Eliminations and other North America copper mines 1, Other mining c 3,323 2, Corporate, other & eliminations (760) (755) 25 As reported in FCX's consolidated financial statements $ 3,711 $ 2,480 $ 450 a. Reflects sales of molybdenum produced by certain of the North America copper mines to FCX's molybdenum sales company at market-based pricing. b. Includes gold and silver product revenues and production costs. c. Represents the combined total for FCX's other mining operations, including South America mining, Indonesia mining, Molybdenum mines, Rod & Refining and Atlantic Copper Smelting & Refining, as presented in the supplemental schedule, "Business Segments," beginning on page IX. XIV
30 FREEPORT-McMoRan INC. PRODUCT REVENUES AND PRODUCTION COSTS (continued) North America Copper Mines Product Revenues, Production Costs and Unit Net Cash Costs Six Months Ended June 30, 2018 (In millions) By-Product Co-Product Method Method Copper Molybdenum a Other b Total Revenues, excluding adjustments $ 2,337 $ 2,337 $ 167 $ 45 $ 2,549 Site production and delivery, before net noncash and other costs shown below 1,405 1, ,452 By-product credits (165) Treatment charges Net cash costs 1,314 1, ,526 DD&A Noncash and other costs, net Total costs 1,541 1, ,753 Other revenue adjustments, primarily for pricing on prior period open sales (5) (5) (5) Gross profit $ 791 $ 746 $ 32 $ 13 $ 791 Copper sales (millions of recoverable pounds) Molybdenum sales (millions of recoverable pounds) a 15 Gross profit per pound of copper/molybdenum: Revenues, excluding adjustments $ 3.14 $ 3.14 $ Site production and delivery, before net noncash and other costs shown below By-product credits (0.22) Treatment charges Unit net cash costs DD&A Noncash and other costs, net Total unit costs Other revenue adjustments, primarily for pricing on prior period open sales (0.01) (0.01) Gross profit per pound $ 1.06 $ 1.00 $ 2.19 Reconciliation to Amounts Reported (In millions) Production Revenues and Delivery DD&A Totals presented above $ 2,549 $ 1,452 $ 185 Treatment charges (13) 61 Noncash and other costs, net 42 Other revenue adjustments, primarily for pricing on prior period open sales (5) Eliminations and other North America copper mines 2,555 1, Other mining c 9,255 6, Corporate, other & eliminations (1,774) (1,910) 35 As reported in FCX's consolidated financial statements $ 10,036 $ 5,723 $ 893 a. Reflects sales of molybdenum produced by certain of the North America copper mines to FCX's molybdenum sales company at market-based pricing. b. Includes gold and silver product revenues and production costs. c. Represents the combined total for FCX's other mining operations, including South America mining, Indonesia mining, Molybdenum mines, Rod & Refining and Atlantic Copper Smelting & Refining, as presented in the supplemental schedule, "Business Segments," beginning on page IX. XV
31 FREEPORT-McMoRan INC. PRODUCT REVENUES AND PRODUCTION COSTS (continued) North America Copper Mines Product Revenues, Production Costs and Unit Net Cash Costs Six Months Ended June 30, 2017 (In millions) By-Product Co-Product Method Method Copper Molybdenum a Other b Total Revenues, excluding adjustments $ 2,072 $ 2,072 $ 122 $ 43 $ 2,237 Site production and delivery, before net noncash and other costs shown below 1,207 1, ,250 By-product credits (122) Treatment charges Net cash costs 1,167 1, ,332 DD&A Noncash and other costs, net Total costs 1,452 1, ,617 Other revenue adjustments, primarily for pricing on prior period open sales Gross profit $ 624 $ 592 $ 20 $ 12 $ 624 Copper sales (millions of recoverable pounds) Molybdenum sales (millions of recoverable pounds) a 17 Gross profit per pound of copper/molybdenum: Revenues, excluding adjustments $ 2.65 $ 2.65 $ 7.56 Site production and delivery, before net noncash and other costs shown below By-product credits (0.15) Treatment charges Unit net cash costs DD&A Noncash and other costs, net Total unit costs Other revenue adjustments, primarily for pricing on prior period open sales Gross profit per pound $ 0.80 $ 0.76 $ 1.29 Reconciliation to Amounts Reported (In millions) Production Revenues and Delivery DD&A Totals presented above $ 2,237 $ 1,250 $ 233 Treatment charges (28) 54 Noncash and other costs, net 52 Other revenue adjustments, primarily for pricing on prior period open sales 4 Eliminations and other North America copper mines 2,243 1, Other mining c 6,361 4, Corporate, other & eliminations (1,552) (1,573) 54 As reported in FCX's consolidated financial statements $ 7,052 $ 4,668 $ 839 a. Reflects sales of molybdenum produced by certain of the North America copper mines to FCX's molybdenum sales company at market-based pricing. b. Includes gold and silver product revenues and production costs. c. Represents the combined total for FCX's other mining operations, including South America mining, Indonesia mining, Molybdenum mines, Rod & Refining and Atlantic Copper Smelting & Refining, as presented in the supplemental schedule, "Business Segments," beginning on page IX. XVI
32 FREEPORT-McMoRan INC. PRODUCT REVENUES AND PRODUCTION COSTS (continued) South America Mining Product Revenues, Production Costs and Unit Net Cash Costs Three Months Ended June 30, 2018 (In millions) By-Product Co-Product Method Method Copper Other a Total Revenues, excluding adjustments $ 958 $ 958 $ 81 $ 1,039 Site production and delivery, before net noncash and other costs shown below By-product credits (70) Treatment charges Royalty on metals Net cash costs DD&A Noncash and other costs, net Total costs Other revenue adjustments, primarily for pricing on prior period open sales Gross profit $ 278 $ 257 $ 21 $ 278 Copper sales (millions of recoverable pounds) Gross profit per pound of copper: Revenues, excluding adjustments $ 3.07 $ 3.07 Site production and delivery, before net noncash and other costs shown below By-product credits (0.22) Treatment charges Royalty on metals Unit net cash costs DD&A Noncash and other costs, net Total unit costs Other revenue adjustments, primarily for pricing on prior period open sales Gross profit per pound $ 0.89 $ 0.82 Reconciliation to Amounts Reported (In millions) Production Revenues and Delivery DD&A Totals presented above $ 1,039 $ 563 $ 133 Treatment charges (59) Royalty on metals (2) Noncash and other costs, net 17 Other revenue adjustments, primarily for pricing on prior period open sales 13 Eliminations and other (1) (2) South America mining Other mining b 4,995 3, Corporate, other & eliminations (817) (916) 14 As reported in FCX's consolidated financial statements $ 5,168 $ 2,915 $ 442 a. Includes silver sales of 1.1 million ounces ( $16.38 per ounce average realized price). Also reflects sales of molybdenum produced by Cerro Verde to FCX's molybdenum sales company at market-based pricing. b. Represents the combined total for FCX's other mining operations, including North America copper mines, Indonesia mining, Molybdenum mines, Rod & Refining and Atlantic Copper Smelting & Refining, as presented in the supplemental schedule, "Business Segments," beginning on page IX. XVII
33 FREEPORT-McMoRan INC. PRODUCT REVENUES AND PRODUCTION COSTS (continued) South America Mining Product Revenues and Production Costs and Unit Net Cash Costs Three Months Ended June 30, 2017 (In millions) By-Product Co-Product Method Method Copper Other a Total Revenues, excluding adjustments $ 766 $ 766 $ 47 $ 813 Site production and delivery, before net noncash and other costs shown below By-product credits (37) Treatment charges Royalty on metals Net cash costs DD&A Noncash and other costs, net Total costs Other revenue adjustments, primarily for pricing on prior period open sales (14) (14) (14) Gross profit $ 146 $ 140 $ 6 $ 146 Copper sales (millions of recoverable pounds) Gross profit per pound of copper: Revenues, excluding adjustments $ 2.67 $ 2.67 Site production and delivery, before net noncash and other costs shown below By-product credits (0.13) Treatment charges Royalty on metals Unit net cash costs DD&A Noncash and other costs, net Total unit costs Other revenue adjustments, primarily for pricing on prior period open sales (0.05) (0.05) Gross profit per pound $ 0.51 $ 0.49 Reconciliation to Amounts Reported (In millions) Production Revenues and Delivery DD&A Totals presented above $ 813 $ 458 $ 125 Treatment charges (63) Royalty on metals (2) Noncash and other costs, net 5 Other revenue adjustments, primarily for pricing on prior period open sales (14) Eliminations and other 1 South America mining Other mining b 3,736 2, Corporate, other & eliminations (760) (755) 25 As reported in FCX's consolidated financial statements $ 3,711 $ 2,480 $ 450 a. Includes silver sales of 848 thousand ounces ( $17.97 per ounce average realized price). Also reflects sales of molybdenum produced by Cerro Verde to FCX's molybdenum sales company at market-based pricing. b. Represents the combined total for FCX's other mining operations, including North America copper mines, Indonesia mining, Molybdenum mines, Rod & Refining and Atlantic Copper Smelting & Refining, as presented in the supplemental schedule, "Business Segments," beginning on page IX. XVIII
34 FREEPORT-McMoRan INC. PRODUCT REVENUES AND PRODUCTION COSTS (continued) South America Copper Mines Product Revenues, Production Costs and Unit Net Cash Costs Six Months Ended June 30, 2018 (In millions) By-Product Co-Product Method Method Copper Other a Total Revenues, excluding adjustments $ 1,859 $ 1,859 $ 167 $ 2,026 Site production and delivery, before net noncash and other costs shown below 1, ,092 By-product credits (144) Treatment charges Royalty on metals Net cash costs 1,046 1, ,213 DD&A Noncash and other costs, net Total costs 1,338 1, ,505 Other revenue adjustments, primarily for pricing on prior period open sales (37) (37) (37) Gross profit $ 484 $ 440 $ 44 $ 484 Copper sales (millions of recoverable pounds) Gross profit per pound of copper: Revenues, excluding adjustments $ 3.09 $ 3.09 Site production and delivery, before net noncash and other costs shown below By-product credits (0.24) Treatment charges Royalty on metals Unit net cash costs DD&A Noncash and other costs, net Total unit costs Other revenue adjustments, primarily for pricing on prior period open sales (0.06) (0.06) Gross profit per pound $ 0.81 $ 0.74 Reconciliation to Amounts Reported (In millions) Production Revenues and Delivery DD&A Totals presented above $ 2,026 $ 1,092 $ 260 Treatment charges (117) Royalty on metals (4) Noncash and other costs, net 32 Other revenue adjustments, primarily for pricing on prior period open sales (37) Eliminations and other (1) (3) South America mining 1,867 1, Other mining b 9,943 6, Corporate, other & eliminations (1,774) (1,910) 35 As reported in FCX's consolidated financial statements $ 10,036 $ 5,723 $ 893 a. Includes silver sales of 2.1 million ounces ( $16.45 per ounce average realized price). Also reflects sales of molybdenum produced by Cerro Verde to FCX's molybdenum sales company at market-based pricing. b. Represents the combined total for FCX's other mining operations, including North America copper mines, Indonesia mining, Molybdenum mines, Rod & Refining and Atlantic Copper Smelting & Refining, as presented in the supplemental schedule, "Business Segments," beginning on page IX. XIX
35 FREEPORT-McMoRan INC. PRODUCT REVENUES AND PRODUCTION COSTS (continued) South America Copper Mines Product Revenues, Production Costs and Unit Net Cash Costs Six Months Ended June 30, 2017 (In millions) By-Product Co-Product Method Method Copper Other a Total Revenues, excluding adjustments $ 1,581 $ 1,581 $ 115 $ 1,696 Site production and delivery, before net noncash and other costs shown below By-product credits (93) Treatment charges Royalty on metals Net cash costs ,061 DD&A Noncash and other costs, net Total costs 1,214 1, ,329 Other revenue adjustments, primarily for pricing on prior period open sales Gross profit $ 408 $ 387 $ 21 $ 408 Copper sales (millions of recoverable pounds) Gross profit per pound of copper: Revenues, excluding adjustments $ 2.65 $ 2.65 Site production and delivery, before net noncash and other costs shown below By-product credits (0.16) Treatment charges Royalty on metals Unit net cash costs DD&A Noncash and other costs, net Total unit costs Other revenue adjustments, primarily for pricing on prior period open sales Gross profit per pound $ 0.68 $ 0.65 Reconciliation to Amounts Reported (In millions) Production Revenues and Delivery DD&A Totals presented above $ 1,696 $ 927 $ 258 Treatment charges (130) Royalty on metals (4) Noncash and other costs, net 10 Other revenue adjustments, primarily for pricing on prior period open sales 41 Eliminations and other (1) South America mining 1, Other mining b 7,001 5, Corporate, other & eliminations (1,552) (1,573) 54 As reported in FCX's consolidated financial statements $ 7,052 $ 4,668 $ 839 a. Includes silver sales of 1.8 million ounces ( $16.95 per ounce average realized price). Also reflects sales of molybdenum produced by Cerro Verde to FCX's molybdenum sales company at market-based pricing. b. Represents the combined total for FCX's other mining operations, including North America copper mines, Indonesia mining, Molybdenum mines, Rod & Refining and Atlantic Copper Smelting & Refining, as presented in the supplemental schedule, "Business Segments," beginning on page IX. XX
36 Indonesia Mining Product Revenues, Production Costs and Unit Net Cash Costs FREEPORT-McMoRan INC. PRODUCT REVENUES AND PRODUCTION COSTS (continued) Three Months Ended June 30, 2018 (In millions) By-Product Co-Product Method Method Copper Gold Silver a Total Revenues, excluding adjustments $ 965 $ 965 $ 855 $ 17 $ 1,837 Site production and delivery, before net noncash and other credits shown below Gold and silver credits (871) Treatment charges Export duties Royalty on metals Net cash (credits) costs (243) DD&A Noncash and other credits, net (3) (1) (2) (3) Total (credits) costs (74) Other revenue adjustments, primarily for pricing prior period open sales (2) 1 11 PT Smelting intercompany loss (8) (4) (4) (8) Gross profit $ 1,043 $ 555 $ 478 $ 10 $ 1,043 Copper sales (millions of recoverable pounds) Gold sales (thousands of recoverable ounces) 671 Gross profit per pound of copper/per ounce of gold: Revenues, excluding adjustments $ 3.05 $ 3.05 $ 1,274 Site production and delivery, before net noncash and other credits shown below Gold and silver credits (2.76) Treatment charges Export duties Royalty on metals Unit net cash (credits) costs (0.77) DD&A Noncash and other credits, net (0.01) (2) Total unit (credits) costs (0.24) Other revenue adjustments, primarily for pricing prior period open sales (2) PT Smelting intercompany loss (0.03) (0.01) (6) Gross profit per pound/ounce $ 3.30 $ 1.76 $ 712 Reconciliation to Amounts Reported (In millions) Production Revenues and Delivery DD&A Totals presented above $ 1,837 $ 420 $ 172 Treatment charges (82) Export duties (55) Royalty on metals (71) Noncash and other credits, net (3) Other revenue adjustments, primarily for pricing prior period open sales 11 PT Smelting intercompany loss 8 Indonesia mining 1, Other mining b 4,345 3, Corporate, other & eliminations (817) (916) 14 As reported in FCX's consolidated financial statements $ 5,168 $ 2,915 $ 442 a. Includes silver sales of 1.1 million ounces ( $15.89 per ounce average realized price). b. Represents the combined total for FCX's other mining operations, including North America copper mines, South America mining, Molybdenum mines, Rod & Refining and Atlantic Copper Smelting & Refining, as presented in the supplemental schedule, "Business Segments," beginning on page IX. XXI
37 Indonesia Mining Product Revenues, Production Costs and Unit Net Cash Costs FREEPORT-McMoRan INC. PRODUCT REVENUES AND PRODUCTION COSTS (continued) Three Months Ended June 30, 2017 (In millions) By-Product Co-Product Method Method Copper Gold Silver a Total Revenues, excluding adjustments $ 660 $ 660 $ 531 $ 14 $ 1,205 Site production and delivery, before net noncash and other costs shown below Gold and silver credits (547) Treatment charges Export duties Royalty on metals Net cash costs DD&A Noncash and other costs, net 84 b Total costs Other revenue adjustments, primarily for pricing prior period open sales (7) (7) 2 (5) PT Smelting intercompany loss (26) (15) (11) (26) Gross profit $ 365 $ 197 $ 164 $ 4 $ 365 Copper sales (millions of recoverable pounds) Gold sales (thousands of recoverable ounces) 427 Gross profit per pound of copper/per ounce of gold: Revenues, excluding adjustments $ 2.67 $ 2.67 $ 1,243 Site production and delivery, before net noncash and other costs shown below Gold and silver credits (2.21) Treatment charges Export duties Royalty on metals Unit net cash costs DD&A Noncash and other costs, net 0.34 b Total unit costs Other revenue adjustments, primarily for pricing prior period open sales (0.03) (0.03) 5 PT Smelting intercompany loss (0.10) (0.06) (26) Gross profit per pound/ounce $ 1.48 $ 0.80 $ 385 Reconciliation to Amounts Reported (In millions) Production Revenues and Delivery DD&A Totals presented above $ 1,205 $ 437 $ 153 Treatment charges (65) Export duties (27) Royalty on metals (43) Noncash and other costs, net 84 Other revenue adjustments, primarily for pricing prior period open sales (5) PT Smelting intercompany loss 26 Indonesia mining 1, Other mining c 3,406 2, Corporate, other & eliminations (760) (755) 25 As reported in FCX's consolidated financial statements $ 3,711 $ 2,480 $ 450 a. Includes silver sales of 851 thousand ounces ( $16.26 per ounce average realized price). b. Includes $82 million ($0.33 per pound of copper) of costs charged directly to production and delivery costs as a result of the impact of workforce reductions. c. Represents the combined total for FCX's other mining operations, including North America copper mines, South America mining, Molybdenum mines, Rod & Refining and Atlantic Copper Smelting & Refining, as presented in the supplemental schedule, "Business Segments," beginning on page IX. XXII
38
39 Indonesia Mining Product Revenues, Production Costs and Unit Net Cash Costs FREEPORT-McMoRan INC. PRODUCT REVENUES AND PRODUCTION COSTS (continued) Six Months Ended June 30, 2018 (In millions) By-Product Co-Product Method Method Copper Gold Silver a Total Revenues, excluding adjustments $ 1,949 $ 1,949 $ 1,644 $ 36 $ 3,629 Site production and delivery, before net noncash and other costs shown below Gold and silver credits (1,697) Treatment charges Export duties Royalty on metals Net cash (credits) costs (445) ,252 DD&A Noncash and other costs, net Total (credits) costs (80) ,617 Other revenue adjustments, primarily for pricing on prior period open sales (34) (34) 17 (17) PT Smelting intercompany loss (17) (9) (8) (17) Gross profit $ 1,978 $ 1,039 $ 919 $ 20 $ 1,978 Copper sales (millions of recoverable pounds) Gold sales (thousands of recoverable ounces) 1,274 Gross profit per pound of copper/per ounce of gold: Revenues, excluding adjustments $ 3.07 $ 3.07 $ 1,291 Site production and delivery, before net noncash and other costs shown below Gold and silver credits (2.67) Treatment charges Export duties Royalty on metals Unit net cash (credits) costs (0.70) DD&A Noncash and other costs, net Total unit (credits) costs (0.13) Other revenue adjustments, primarily for pricing on prior period open sales (0.05) (0.05) 13 PT Smelting intercompany loss (0.04) (0.01) (7) Gross profit per pound/ounce $ 3.11 $ 1.64 $ 721 Reconciliation to Amounts Reported (In millions) Production Revenues and Delivery DD&A Totals presented above $ 3,629 $ 853 $ 353 Treatment charges (160) Export duties (101) Royalty on metals (138) Noncash and other costs, net 12 Other revenue adjustments, primarily for pricing on prior period open sales (17) PT Smelting intercompany loss 17 Indonesia mining 3, Other mining b 8,597 6, Corporate, other & eliminations (1,774) (1,910) 35 As reported in FCX's consolidated financial statements $ 10,036 $ 5,723 $ 893 a. Includes silver sales of 2.3 million ounces ( $15.93 per ounce average realized price). b. Represents the combined total for FCX's other mining operations, including North America copper mines, South America mining, Molybdenum mines, Rod & Refining and Atlantic Copper Smelting & Refining, as presented in the supplemental schedule, "Business Segments," beginning on page IX.
40 XXIII
41 FREEPORT-McMoRan INC. PRODUCT REVENUES AND PRODUCTION COSTS (continued) Indonesia Mining Product Revenues and Production Costs and Unit Net Cash Costs Six Months Ended June 30, 2017 (In millions) By-Product Co-Product Method Method Copper Gold Silver a Total Revenues, excluding adjustments $ 982 $ 982 $ 752 $ 21 $ 1,755 Site production and delivery, before net noncash and other costs shown below Gold and silver credits (782) Treatment charges Export duties Royalty on metals Net cash costs DD&A Noncash and other costs, net Total costs ,258 Other revenue adjustments, primarily for pricing on prior period open sales PT Smelting intercompany profit Gross profit $ 546 $ 319 $ 221 $ 6 $ 546 b Copper sales (millions of recoverable pounds) Gold sales (thousands of recoverable ounces) 604 Gross profit per pound of copper/per ounce of gold: Revenues, excluding adjustments $ 2.64 $ 2.64 $ 1,242 Site production and delivery, before net noncash and other costs shown below Gold and silver credits (2.10) Treatment charges Export duties Royalty on metals Unit net cash costs DD&A Noncash and other costs, net Total unit costs Other revenue adjustments, primarily for pricing on prior period open sales PT Smelting intercompany profit 1 Gross profit per pound/ounce $ 1.46 $ 0.86 $ 365 b Reconciliation to Amounts Reported (In millions) Production Revenues and Delivery DD&A Totals presented above $ 1,755 $ 702 $ 236 Treatment charges (100) Export duties (41) Royalty on metals (63) Noncash and other costs, net 116 Other revenue adjustments, primarily for pricing on prior period open sales 48 PT Smelting intercompany profit (1) Indonesia mining 1, Other mining c 7,005 5, Corporate, other & eliminations (1,552) (1,573) 54 As reported in FCX's consolidated financial statements $ 7,052 $ 4,668 $ 839 a. Includes silver sales of 1.3 million ounces ( $16.66 per ounce average realized price). b. Includes $103 million ($0.28 per pound of copper) of costs charged directly to production and delivery costs as a result of workforce reductions. c. Represents the combined total for FCX's other mining operations, including North America copper mines, South America mining, Molybdenum mining, Rod & Refining and Atlantic Copper Smelting and Refining, as presented in the supplemental schedule, "Business Segments," beginning on page IX.
42 XXIV
43 Molybdenum Mines Product Revenues, Production Costs and Unit Net Cash Costs FREEPORT-McMoRan INC. PRODUCT REVENUES AND PRODUCTION COSTS (continued) Three Months Ended June 30, (In millions) Revenues, excluding adjustments a $ 119 $ 78 Site production and delivery, before net noncash and other costs shown below Treatment charges and other 8 7 Net cash costs DD&A Noncash and other costs, net 2 Total costs Gross profit (loss) $ 19 $ (6) Molybdenum sales (millions of recoverable pounds) a 9 8 Gross profit (loss) per pound of molybdenum: Revenues, excluding adjustments a $ $ 9.57 Site production and delivery, before net noncash and other costs shown below Treatment charges and other Unit net cash costs DD&A Noncash and other costs, net Total unit costs Gross profit (loss) per pound $ 2.07 $ (0.75) Reconciliation to Amounts Reported (In millions) Production Three Months Ended June 30, 2018 Revenues and Delivery DD&A Totals presented above $ 119 $ 71 $ 21 Treatment charges and other (8) Noncash and other costs, net Molybdenum mines Other mining b 5,874 3, Corporate, other & eliminations (817) (916) 14 As reported in FCX's consolidated financial statements $ 5,168 $ 2,915 $ 442 Three Months Ended June 30, 2017 Totals presented above $ 78 $ 56 $ 19 Treatment charges and other (7) Noncash and other costs, net 2 Molybdenum mines Other mining b 4,400 3, Corporate, other & eliminations (760) (755) 25 As reported in FCX's consolidated financial statements $ 3,711 $ 2,480 $ 450 a. Reflects sales of the Molybdenum mines' production to FCX's molybdenum sales company at market-based pricing. On a consolidated basis, realizations are based on the actual contract terms for sales to third parties; as a result, FCX's consolidated average realized price per pound of molybdenum will differ from the amounts reported in this table. b. Represents the combined total for FCX's other mining operations, including North America copper mines, South America mining, Indonesia mining, Rod & Refining and Atlantic Copper Smelting & Refining, as presented in the supplemental schedule, "Business Segments," beginning on page IX. Also includes amounts associated with FCX's molybdenum sales company, which includes sales of molybdenum produced by the Molybdenum mines and by certain of the North America and South America copper mines. XXV
44 Molybdenum Mines Product Revenues, Production Costs and Unit Net Cash Costs FREEPORT-McMoRan INC. PRODUCT REVENUES AND PRODUCTION COSTS (continued) Six Months Ended June 30, (In millions) Revenues, excluding adjustments a $ 221 $ 148 Site production and delivery, before net noncash and other costs shown below Treatment charges and other Net cash costs DD&A Noncash and other costs, net 2 3 Total costs Gross profit (loss) $ 28 $ (14) Molybdenum sales (millions of recoverable pounds) a Gross profit (loss) per pound of molybdenum: Revenues, excluding adjustments a $ $ 9.07 Site production and delivery, before net noncash and other costs shown below Treatment charges and other Unit net cash costs DD&A Noncash and other costs, net Total unit costs Gross profit (loss) per pound $ 1.58 $ (0.86) Reconciliation to Amounts Reported (In millions) Production Six Months Ended June 30, 2018 Revenues and Delivery DD&A Totals presented above $ 221 $ 136 $ 40 Treatment charges and other (15) Noncash and other costs, net 2 Molybdenum mines Other mining b 11,604 7, Corporate, other & eliminations (1,774) (1,910) 35 As reported in FCX's consolidated financial statements $ 10,036 $ 5,723 $ 893 Six Months Ended June 30, 2017 Totals presented above $ 148 $ 107 $ 38 Treatment charges and other (14) Noncash and other costs, net 3 Molybdenum mines Other mining b 8,470 6, Corporate, other & eliminations (1,552) (1,573) 54 As reported in FCX's consolidated financial statements $ 7,052 $ 4,668 $ 839 a. Reflects sales of the Molybdenum mines' production to FCX's molybdenum sales company at market-based pricing. On a consolidated basis, realizations are based on the actual contract terms for sales to third parties; as a result, FCX's consolidated average realized price per pound of molybdenum will differ from the amounts reported in this table. b. Represents the combined total for FCX's other mining operations, including North America copper mines, South America mining, Indonesia mining, Rod & Refining and Atlantic Copper Smelting & Refining, as presented in the supplemental schedule, "Business Segments," beginning on page IX. Also includes amounts associated with FCX's molybdenum sales company, which includes sales of molybdenum produced by the Molybdenum mines and by certain of the North America and South America copper mines. XXVI

45

46

47

48

49
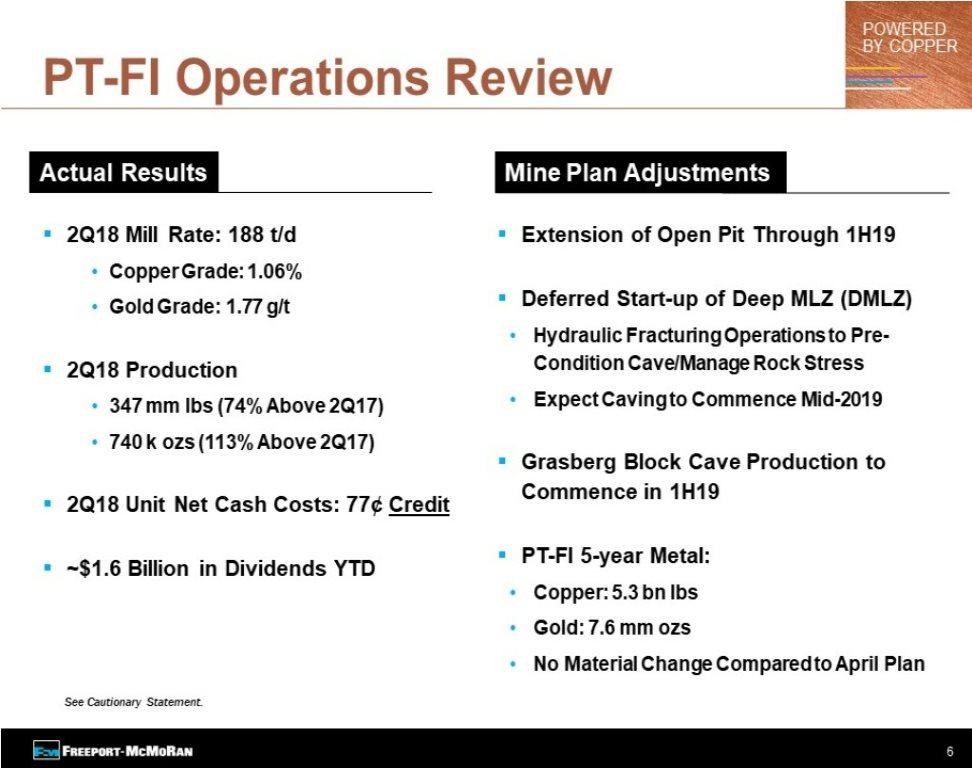
50

51

52

53

54

55

56

57

58

59

60

61

62

63

64
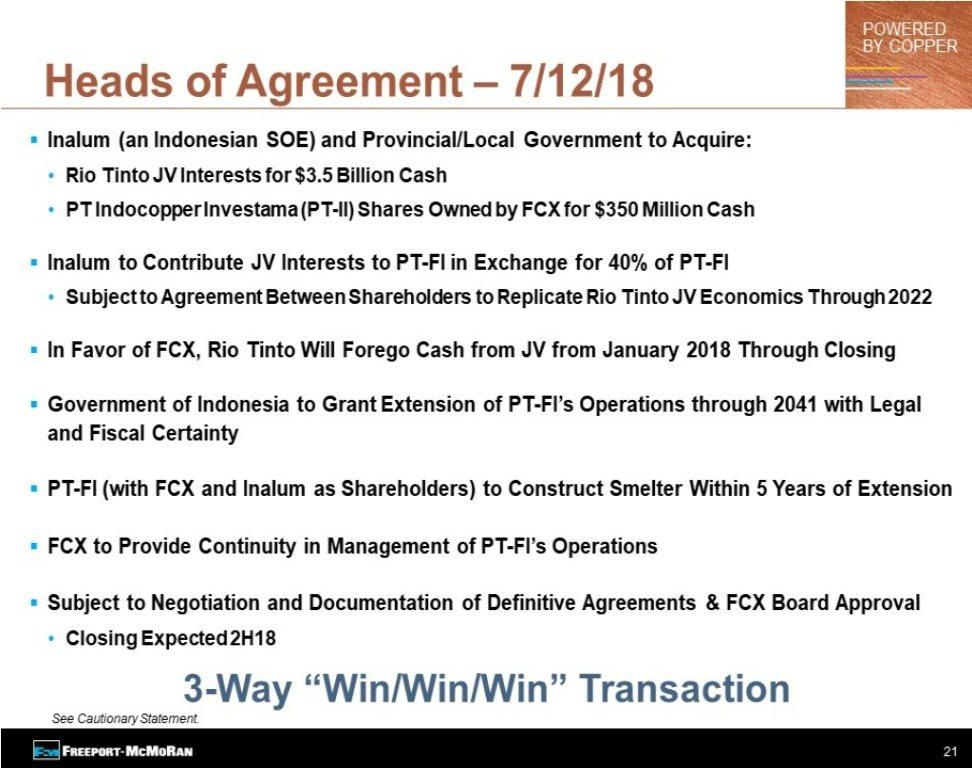
65

66

67

68
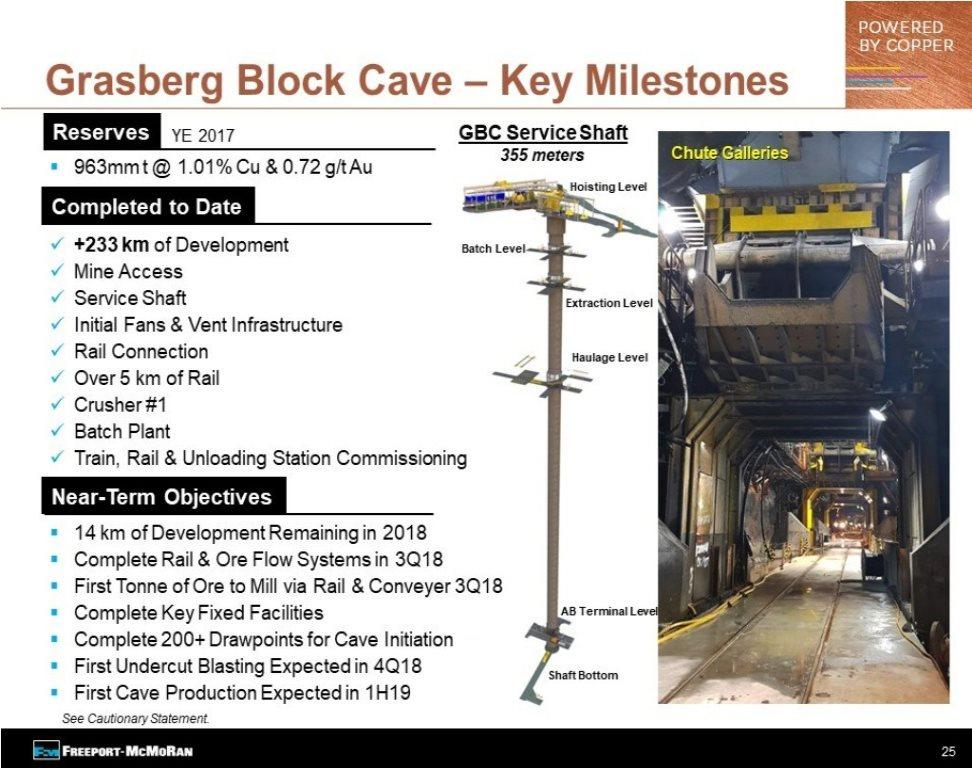
69
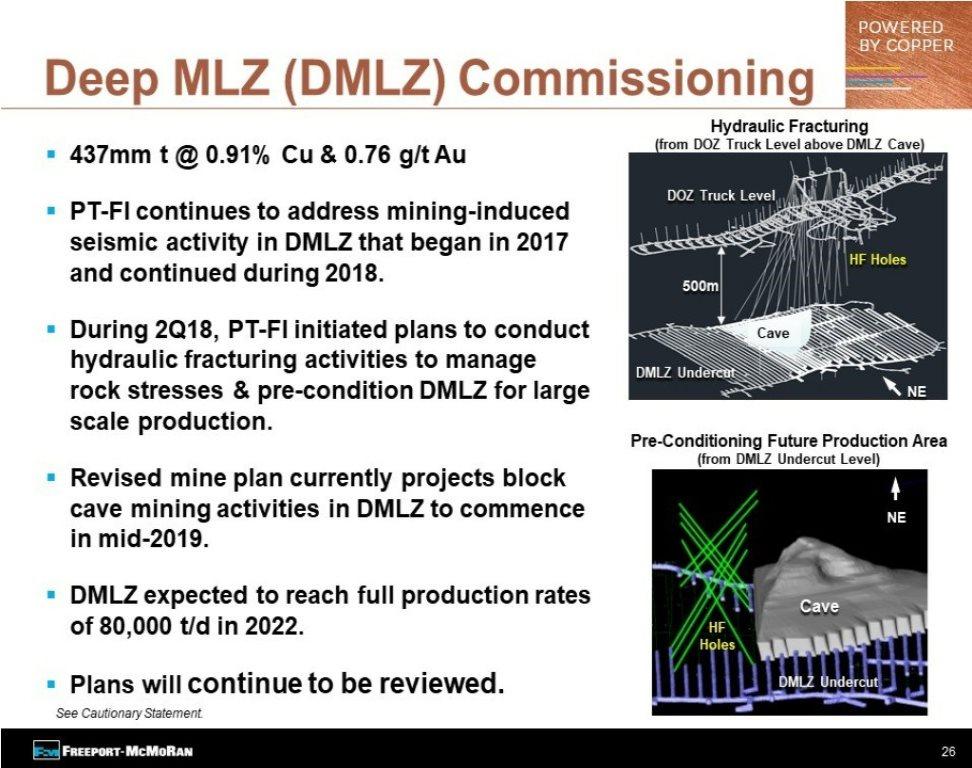
70

71
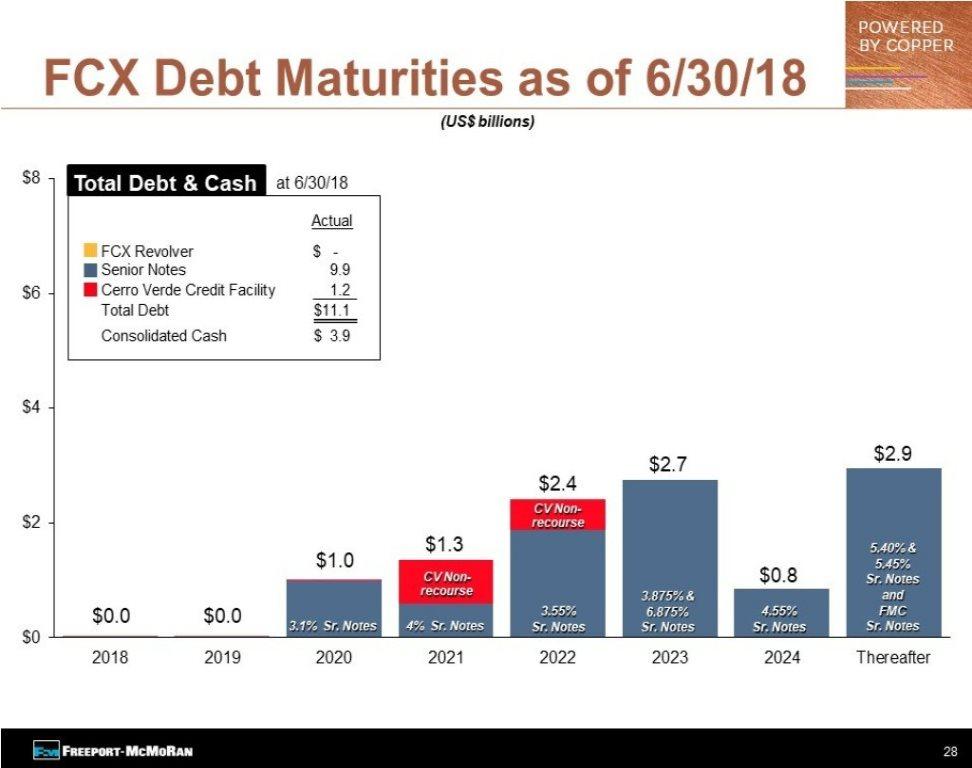
72

73

74
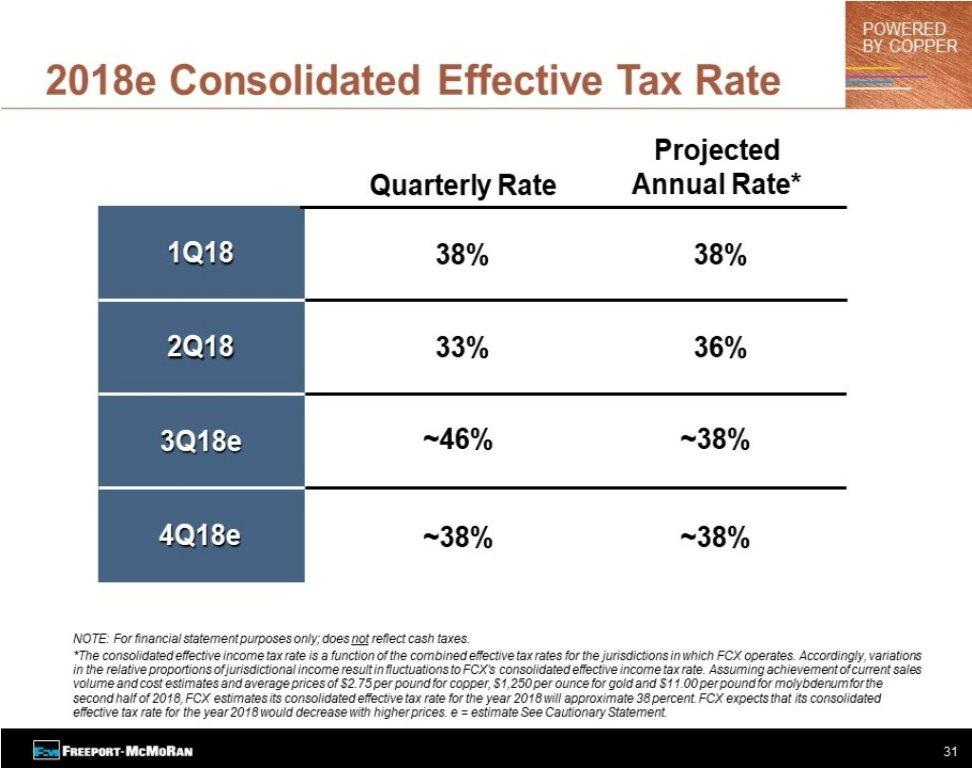
75
FREEPORT-McMoRan INC. (Exact name of registrant as specified in its charter)
") UNITED STATES SECURITIES AND EXCHANGE COMMISSION Washington, D.C. 20549 FORM 8-K CURRENT REPORT Pursuant to Section 13 OR 15(d) of The Securities Exchange Act of 1934 Date of Report (Date of earliest event
UNITED STATES SECURITIES AND EXCHANGE COMMISSION Washington, D.C. 20549 FORM 8-K CURRENT REPORT Pursuant to Section 13 OR 15(d) of The Securities Exchange Act of 1934 Date of Report (Date of earliest event
Freeport-McMoRan Copper & Gold Inc. Reports Third-Quarter and Nine-Month 2010 Results
 333 North Central Avenue Phoenix, AZ 85004 Financial Contacts: Media Contact: Kathleen L. Quirk David P. Joint William L. Collier (602) 366-8016 (504) 582-4203 (504) 582-1750 Freeport-McMoRan Copper &
Freeport-McMoRan Copper & Gold Inc. Reports Second-Quarter and Six-Month 2008 Results
 One North Central Avenue Phoenix, AZ 85004 Financial Contacts: Media Contact: Kathleen L. Quirk David P. Joint William L. Collier (602) 366-8016 (504) 582-4203 (504) 582-1750 Freeport-McMoRan Copper &
Richard C. Adkerson. President & Chief Executive Officer
 Richard C. Adkerson President & Chief Executive Officer February 27, 2017 Cautionary Statement Regarding Forward-Looking Statements This presentation contains forward-looking statements in which FCX discusses
FREEPORT-MCMORAN INC
 FREEPORT-MCMORAN INC FORM 8-K (Current report filing) Filed 01/27/15 for the Period Ending 01/27/15 Address 333 NORTH CENTRAL AVENUE PHOENIX, AZ 85004 Telephone 6023668100 CIK 0000831259 Symbol FCX SIC
1 st Quarter 2018 Earnings Conference Call
 1 st Quarter 2018 Earnings Conference Call April 24, 2018 fcx.com Cautionary Statement Regarding Forward-Looking Statements This presentation contains forward-looking statements in which FCX discusses
Annual Metals, Mining, and Steel Conference
 Annual Metals, Mining, and Steel Conference Kathleen L. Quirk Executive VP & CFO November 28, 2012 www.fcx.com CONNECTING THE FUTURE Cautionary Statement This presentation contains forward-looking statements
27th Global Metals & Mining Conference
 27th Global Metals & Mining Conference Richard C. Adkerson Vice Chairman, President & CEO February 26, 2018 fcx.com Cautionary Statement Regarding Forward-Looking Statements This presentation contains
1 st Quarter 2010 Earnings Conference Call
 1 st Quarter 2010 Earnings Conference Call PROVEN PERFORMANCE SHINING FUTURE www.fcx.com April 21, 2010 Cautionary Statement Regarding Forward-Looking Statements This presentation contains forward-looking
3 rd Quarter 2012 Earnings Conference Call
 3 rd Quarter 2012 Earnings Conference Call October 22, 2012 www.fcx.com CONNECTING THE FUTURE Cautionary Statement This presentation contains forward-looking statements in which we discuss factors we believe
2 nd Quarter 2018 Earnings Conference Call
 2 nd Quarter 2018 Earnings Conference Call July 25, 2018 fcx.com Cautionary Statement Regarding Forward-Looking Statements This presentation contains forward-looking statements in which FCX discusses its
FREEPORT-McMoRan INC. (Exactnameofregistrantasspecifiedinitscharter) Delaware (Stateorotherjurisdictionof
 Delaware (Stateorotherjurisdictionof") UNITED STATES SECURITIES AND EXCHANGE COMMISSION Washington, D.C. 20549 FORM 8-K CURRENT REPORT Pursuant to Section 13 OR 15(d) of The Securities Exchange Act of 1934 Date of Report (Date of earliest event
UNITED STATES SECURITIES AND EXCHANGE COMMISSION Washington, D.C. 20549 FORM 8-K CURRENT REPORT Pursuant to Section 13 OR 15(d) of The Securities Exchange Act of 1934 Date of Report (Date of earliest event
Richard C. Adkerson. President & CEO
 Richard C. Adkerson President & CEO December 6, 2016 Cautionary Statement Regarding Forward-Looking Statements This presentation contains forward-looking statements in which FCX discusses its potential
Richard C. Adkerson Vice Chairman of the Board, President & Chief Executive Officer February 25, 2019
 Richard C. Adkerson Vice Chairman of the Board, President & Chief Executive Officer February 25, 2019 fcx.com Cautionary Statement Regarding Forward-Looking Statements This presentation contains forward-looking
1 st Quarter 2012 Earnings Conference Call. CONNECTING THE FUTURE
 1 st Quarter 2012 Earnings Conference Call April 19, 2012 www.fcx.com CONNECTING THE FUTURE Cautionary Statement This presentation contains forward-looking statements in which we discuss factors we believe
Connecting the World. Richard C. Adkerson. President & CEO.
 Connecting the World Richard C. Adkerson President & CEO www.fcx.com May 10, 2011 Cautionary Statement This presentation contains forward-looking statements in which we discuss factors we believe may affect
BMO Capital Markets 2008 Global Metals and Mining Conference
 FREEPORT-MCMORAN COPPER & GOLD BMO Capital Markets 2008 Global Metals and Mining Conference Richard C. Adkerson President & CEO February 25, 2008 www.fcx.com Cautionary Statement Regarding Forward-Looking
Goldman Sachs Basic Materials Conference 2008
 Goldman Sachs Basic Materials Conference 2008 Richard C. Adkerson President & CEO New York City May 20, 2008 www.fcx.com Cautionary Statement Regarding Forward-Looking Statements This presentation contains
2018 Global Metals, Mining & Steel Conference
 2018 Global Metals, Mining & Steel Conference Richard C. Adkerson President & CEO May 15, 2018 fcx.com Cautionary Statement Regarding Forward-Looking Statements This presentation contains forward-looking
3 rd Quarter 2018 Earnings Conference Call
 3 rd Quarter 2018 Earnings Conference Call October 24, 2018 fcx.com Cautionary Statement Regarding Forward-Looking Statements This presentation contains forward-looking statements in which FCX discusses
Richard C. Adkerson. President & CEO. CONNECTING THE FUTURE
 Richard C. Adkerson President & CEO May 15, 2012 www.fcx.com CONNECTING THE FUTURE Cautionary Statement This presentation contains forward-looking statements in which we discuss factors we believe may
Richard C. Adkerson. President & Chief Executive Officer.
 Richard C. Adkerson President & Chief Executive Officer www.fcx.com March 1, 2010 Cautionary Statement Regarding Forward-Looking Statements This presentation contains forward-looking statements in which
Kathleen L. Quirk Executive Vice President & CFO
 MACQUARIE CONNECTIONS MACQUARIE CAPITAL (USA) INC. Global Metals & Mining Conference Kathleen L. Quirk Executive Vice President & CFO www.fcx.com New York City November 30, 2009 Cautionary Statement Regarding
Denver Gold Forum 2008
 Denver Gold Forum 2008 Richard C. Adkerson President & CEO September 10, 2008 www.fcx.com Cautionary Statement Regarding Forward-Looking Statements This presentation contains forward-looking statements
Connecting the World. Richard C. Adkerson President & Chief Executive Officer.
 Connecting the World Richard C. Adkerson President & Chief Executive Officer www.fcx.com November 16, 2011 Cautionary Statement This presentation contains forward-looking statements in which we discuss
Richard C. Adkerson. President & CEO. November 11,
 Richard C. Adkerson President & CEO November 11, 2008 www.fcx.com Cautionary Statement Regarding Forward-Looking Statements This presentation contains forward-looking statements in which we discuss factors
Freeport-McMoRan Copper & Gold Inc. (Exact name of registrant as specified in its charter)
") UNITED STATES SECURITIES AND EXCHANGE COMMISSION Washington, D.C. 20549 FORM 10-Q (Mark One) [X] QUARTERLY REPORT PURSUANT TO SECTION 13 OR 15(d) OF THE SECURITIES EXCHANGE ACT OF 1934 For the quarterly
UNITED STATES SECURITIES AND EXCHANGE COMMISSION Washington, D.C. 20549 FORM 10-Q (Mark One) [X] QUARTERLY REPORT PURSUANT TO SECTION 13 OR 15(d) OF THE SECURITIES EXCHANGE ACT OF 1934 For the quarterly
Global Metals & Mining Conference
 Global Metals & Mining Conference Kathleen L. Quirk Executive Vice President & CFO November 16, 2016 Cautionary Statement Regarding Forward-Looking Statements This presentation contains forward-looking
4 th Quarter 2008 Earnings Conference Call
 4 th Quarter 2008 Earnings Conference Call January 26, 2009 www.fcx.com Cautionary Statement Regarding Forward-Looking Statements This presentation contains forward-looking statements in which we discuss
4 th Quarter 2017 Earnings Conference Call
 4 th Quarter 2017 Earnings Conference Call January 25, 2018 fcx.com Cautionary Statement Regarding Forward-Looking Statements This presentation contains forward-looking statements in which FCX discusses
2018 Basic Materials Conference
 2018 Basic Materials Conference Kathleen L. Quirk Executive Vice President & Chief Financial Officer November 27, 2018 fcx.com Cautionary Statement Regarding Forward-Looking Statements This presentation
4 th Quarter 2018 Earnings Conference Call
 4 th Quarter 2018 Earnings Conference Call January 24, 2019 fcx.com Cautionary Statement Regarding Forward-Looking Statements This presentation contains forward-looking statements in which FCX discusses
FCX Conference Call to Discuss Revised Operating Plans
 FCX Conference Call to Discuss Revised Operating Plans December 3, 2008 www.fcx.com Cautionary Statement Regarding Forward-Looking Statements This presentation contains forward-looking statements in which
3 rd Quarter 2017 Earnings Conference Call
 3 rd Quarter 2017 Earnings Conference Call October 25, 2017 fcx.com 2 Cautionary Statement Regarding Forward-Looking Statements This presentation contains forward-looking statements in which FCX discusses
Goldman Sachs Basic Materials Conference
 Goldman Sachs Basic Materials Conference Kathleen L. Quirk Executive Vice President & Chief Financial Officer June 4, 2009 www.fcx.com Cautionary Statement Regarding Forward-Looking Statements This presentation
Freeport-McMoRan Inc. (Exactnameofregistrantasspecifiedinitscharter)
") UNITED STATES SECURITIES AND EXCHANGE COMMISSION Washington, D.C. 20549 FORM 8-K CURRENT REPORT Pursuant to Section 13 OR 15(d) of The Securities Exchange Act of 1934 Date of Report (Date of earliest event
UNITED STATES SECURITIES AND EXCHANGE COMMISSION Washington, D.C. 20549 FORM 8-K CURRENT REPORT Pursuant to Section 13 OR 15(d) of The Securities Exchange Act of 1934 Date of Report (Date of earliest event
SECURITIES AND EXCHANGE COMMISSION FORM 8-K SOUTHERN PERU COPPER CORPORATION
 SECURITIES AND EXCHANGE COMMISSION Washington, D.C. 20549 FORM 8-K CURRENT REPORT Pursuant to Section 13 or 15(d) of the Securities Exchange Act of 1934 Date of report (Date of earliest event reported):
NEWMONT MINING CORP /DE/
 NEWMONT MINING CORP /DE/ FORM 8-K (Current report filing) Filed 02/21/14 for the Period Ending 02/20/14 Address 6363 SOUTH FIDDLERS GREEN CIRCLE GREENWOOD VILLAGE, CO 80111 Telephone 303-863-7414 CIK 0001164727
4th Quarter 2015 Earnings Conference Call. January 26, 2016
 4th Quarter 2015 Earnings Conference Call January 26, 2016 Cautionary Statement Regarding Forward-Looking Statements This presentation contains forward-looking statements in which FCX discusses its potential
FREEPORT-McMoRan INC. (Exactnameofregistrantasspecifiedinitscharter)
") UNITED STATES SECURITIES AND EXCHANGE COMMISSION Washington, D.C. 20549 FORM 8-K CURRENT REPORT Pursuant to Section 13 OR 15(d) of The Securities Exchange Act of 1934 Date of Report (Date of earliest event
UNITED STATES SECURITIES AND EXCHANGE COMMISSION Washington, D.C. 20549 FORM 8-K CURRENT REPORT Pursuant to Section 13 OR 15(d) of The Securities Exchange Act of 1934 Date of Report (Date of earliest event
3rd Quarter 2015 Earnings Conference Call. October 22, 2015
 3rd Quarter 2015 Earnings Conference Call October 22, 2015 Cautionary Statement Regarding Forward-Looking Statements This presentation contains forward-looking statements in which FCX discusses its potential
Freeport-McMoRan Inc.
 February 05, 2015 Freeport-McMoRan Inc. Current Recommendation Prior Recommendation Neutral Date of Last Change 11/05/2014 Current Price (02/03/15) $18.98 Target Price $17.00 UNDERPERFORM (FCX-NYSE) SUMMARY
Royal Gold Reports Third Quarter 2018 Results
 Royal Gold Reports Third Quarter 2018 Results DENVER, COLORADO. MAY 2, 2018: ROYAL GOLD, INC. (NASDAQ: RGLD) (together with its subsidiaries, Royal Gold or the Company, we or our ) reports a net loss of
6th Annual Global Industrials and Basic Materials Conference
 6th Annual Global Industrials and Basic Materials Conference Kathleen L. Quirk Executive Vice President & CFO June 3, 2015 Cautionary Statement Regarding Forward-Looking Statements This presentation contains
UNITED STATES SECURITIES AND EXCHANGE COMMISSION Washington, D.C FORM 8-K
 UNITED STATES SECURITIES AND EXCHANGE COMMISSION Washington, D.C. 20549 FORM 8-K Current Report Pursuant to Section 13 or 15(d) of the Securities Exchange Act of 1934 Date of Report (Date of earliest event
NEWS RELEASE. Coeur Reports Second Quarter 2014 Results
 NEWS RELEASE Coeur Reports Second Quarter 2014 Results Cash flow from operating activities increased by $40 million; Rochester cash flow and production growth accelerates; Full-year cost guidance reduced
Freeport-McMoRanInc.
 UNITEDSTATES SECURITIESANDEXCHANGECOMMISSION Washington,D.C.20549 FORM10-Q (MarkOne) [X]QUARTERLYREPORTPURSUANTTOSECTION13OR15(d)OFTHESECURITIESEXCHANGEACTOF1934 ForthequarterlyperiodendedMarch31,2018
Royal Gold Reports Record Operating Cash Flow in its Third Quarter 2017
 Royal Gold Reports Record Operating Cash Flow in its Third Quarter 2017 DENVER, COLORADO. MAY 10, 2017: ROYAL GOLD, INC. (NASDAQ: RGLD) (together with its subsidiaries, Royal Gold or the Company, we or
Royal Gold Reports Record Annual Revenue, Earnings and Cash Flow
 Royal Gold Reports Record Annual Revenue, Earnings and Cash Flow DENVER, COLORADO. AUGUST 9, 2017: ROYAL GOLD, INC. (NASDAQ: RGLD) (together with its subsidiaries, Royal Gold or the Company, we or our
Cash generated by operating activities was $184.8 million in 2014 compared to $44.8 million in 2013.
 February 19, 2015 news release Thompson Creek Reports Significantly Improved 2014 Financial Results Revenue of $807 Million, up 86%, Operating Cash Flow of $185 Million, up 313% and Cash Balance of $266
NEWMONT MINING CORPORATION (Exact name of registrant as specified in its charter)
") UNITED STATES SECURITIES AND EXCHANGE COMMISSION Washington, D. C. 20549 Form 10-Q (Mark One) QUARTERLY REPORT PURSUANT TO SECTION 13 OR 15(d) OF THE SECURITIES EXCHANGE ACT OF 1934 For the Quarterly Period
UNITED STATES SECURITIES AND EXCHANGE COMMISSION Washington, D. C. 20549 Form 10-Q (Mark One) QUARTERLY REPORT PURSUANT TO SECTION 13 OR 15(d) OF THE SECURITIES EXCHANGE ACT OF 1934 For the Quarterly Period
Freeport-McMoRanInc.
 UNITEDSTATES SECURITIESANDEXCHANGECOMMISSION Washington,D.C.20549 FORM10-K (MarkOne) [X]ANNUALREPORTPURSUANTTOSECTION13OR15(d)OFTHESECURITIESEXCHANGEACTOF1934 ForthefiscalyearendedDecember31,2017 OR []TRANSITIONREPORTPURSUANTTOSECTION13OR15(d)OFTHESECURITIESEXCHANGEACTOF1934
UNITED STATES SECURITIES AND EXCHANGE COMMISSION Washington, D.C FORM 8-K
 UNITED STATES SECURITIES AND EXCHANGE COMMISSION Washington, D.C. 20549 FORM 8-K CURRENT REPORT Pursuant to Section 13 or 15(d) of the Securities Exchange Act of 1934 Date of Report (Date of earliest event
TASEKO ANNOUNCES 43 MILLION POUNDS OF COPPER PRODUCTION AND FINANCIAL RESULTS FOR THE THIRD QUARTER
 TASEKO ANNOUNCES 43 MILLION POUNDS OF COPPER PRODUCTION AND FINANCIAL RESULTS FOR THE THIRD QUARTER This release should be read with the Company s Financial Statements and Management Discussion & Analysis
WEATHERFORD INTERNATIONAL LTD.
 UNITED STATES SECURITIES AND EXCHANGE COMMISSION Washington, D.C. 20549 FORM 8K CURRENT REPORT Pursuant to Section 13 or 15(d) of the Securities Exchange Act of 1934 Date of Report (Date of earliest event
TASEKO ANNOUNCES 43 MILLION POUNDS OF COPPER PRODUCTION AND FINANCIAL RESULTS FOR THE THIRD QUARTER
 TASEKO ANNOUNCES 43 MILLION POUNDS OF COPPER PRODUCTION AND FINANCIAL RESULTS FOR THE THIRD QUARTER This release should be read with the Company s Financial Statements and Management Discussion & Analysis
UNITED STATES SECURITIES AND EXCHANGE COMMISSION Washington, D.C
 UNITED STATES SECURITIES AND EXCHANGE COMMISSION Washington, D.C. 20549 FORM 8-K CURRENT REPORT Pursuant to Section 13 or 15(d) of the Securities Exchange Act of 1934 February 12, 2019 Date of Report (Date
NEWMONT MINING CORP /DE/
 NEWMONT MINING CORP /DE/ FORM 8-K (Current report filing) Filed 07/26/13 for the Period Ending 07/25/13 Address 6363 SOUTH FIDDLERS GREEN CIRCLE GREENWOOD VILLAGE, CO 80111 Telephone 303-863-7414 CIK 0001164727
Gardner Denver Holdings, Inc. (Exact name of registrant as specified in its charter)
") UNITED STATES SECURITIES AND EXCHANGE COMMISSION Washington, D.C. 20549 FORM 8-K CURRENT REPORT Pursuant to Section 13 or 15(d) of the Securities Exchange Act of 1934 Date of Report (Date Earliest Event
UNITED STATES SECURITIES AND EXCHANGE COMMISSION Washington, D.C. 20549 FORM 8-K CURRENT REPORT Pursuant to Section 13 or 15(d) of the Securities Exchange Act of 1934 Date of Report (Date Earliest Event
NEWMONT MINING CORPORATION (Exact name of registrant as specified in its charter)
") UNITED STATES SECURITIES AND EXCHANGE COMMISSION Washington, D. C. 20549 Form 10-Q (Mark One) QUARTERLY REPORT PURSUANT TO SECTION 13 OR 15(d) OF THE SECURITIES EXCHANGE ACT OF 1934 For the Quarterly Period
UNITED STATES SECURITIES AND EXCHANGE COMMISSION Washington, D. C. 20549 Form 10-Q (Mark One) QUARTERLY REPORT PURSUANT TO SECTION 13 OR 15(d) OF THE SECURITIES EXCHANGE ACT OF 1934 For the Quarterly Period
FAIRMOUNT SANTROL HOLDINGS INC. (Exact name of registrant as specified in its charter)
") UNITED STATES SECURITIES AND EXCHANGE COMMISSION Washington, D.C. 20549 FORM 8-K CURRENT REPORT Pursuant to Section 13 or 15(d) of the Securities Exchange Act of 1934 Date of Report (Date of earliest event
UNITED STATES SECURITIES AND EXCHANGE COMMISSION Washington, D.C. 20549 FORM 8-K CURRENT REPORT Pursuant to Section 13 or 15(d) of the Securities Exchange Act of 1934 Date of Report (Date of earliest event
Capstone Mining 2017 Production Results and 2018 Operating and Capital Guidance
 Suite 2100 510 West Georgia Street Vancouver, BC, V6B 0M3, Canada Tel: 604-684-8894 Fax: 604-688-2180 www.capstonemining.com January 10, 2018 Capstone Mining 2017 Production Results and 2018 Operating
Freeport-McMoRan Copper & Gold Inc. (Exact name of registrant as specified in its charter)
") UNITED STATES SECURITIES AND EXCHANGE COMMISSION Washington, D.C. 20549 FORM 10-K (Mark One) [X] ANNUAL REPORT PURSUANT TO SECTION 13 OR 15(d) OF THE SECURITIES EXCHANGE ACT OF 1934 For the fiscal year
UNITED STATES SECURITIES AND EXCHANGE COMMISSION Washington, D.C. 20549 FORM 10-K (Mark One) [X] ANNUAL REPORT PURSUANT TO SECTION 13 OR 15(d) OF THE SECURITIES EXCHANGE ACT OF 1934 For the fiscal year
news release November 9, 2015
 news release November 9, Thompson Creek Reports Third Quarter Cash Balance of $217 Million and Non-GAAP Unit Cash Cost on a By-Product Basis of Negative $0.16 per Pound of Copper Produced Denver, CO Thompson
LKQ CORPORATION (Exact name of registrant as specified in its charter)
") UNITED STATES SECURITIES AND EXCHANGE COMMISSION WASHINGTON, DC 20549 FORM 8-K Current Report Pursuant to Section 13 or 15(d) of The Securities Exchange Act of 1934 Date of Report (Date of earliest event
UNITED STATES SECURITIES AND EXCHANGE COMMISSION WASHINGTON, DC 20549 FORM 8-K Current Report Pursuant to Section 13 or 15(d) of The Securities Exchange Act of 1934 Date of Report (Date of earliest event
CLEVELAND-CLIFFS INC. (Exact name of registrant as specified in its charter)
") UNITED STATES SECURITIES AND EXCHANGE COMMISSION WASHINGTON, D.C. 20549 FORM 8-K CURRENT REPORT PURSUANT TO SECTION 13 OR 15(d) OF THE SECURITIES EXCHANGE ACT OF 1934 Date of Report (Date of earliest event
UNITED STATES SECURITIES AND EXCHANGE COMMISSION WASHINGTON, D.C. 20549 FORM 8-K CURRENT REPORT PURSUANT TO SECTION 13 OR 15(d) OF THE SECURITIES EXCHANGE ACT OF 1934 Date of Report (Date of earliest event
International Paper Company (Exact name of registrant as specified in its charter)
") UNITED STATES SECURITIES AND EXCHANGE COMMISSION Washington, D.C. 20549 FORM 8-K CURRENT REPORT Pursuant to Section 13 or 15(d) of the Securities Exchange Act of 1934 Date of Report (Date of Earliest Event
UNITED STATES SECURITIES AND EXCHANGE COMMISSION Washington, D.C. 20549 FORM 8-K CURRENT REPORT Pursuant to Section 13 or 15(d) of the Securities Exchange Act of 1934 Date of Report (Date of Earliest Event
THOMPSON CREEK METALS COMPANY REPORTS INCREASE IN SECOND QUARTER 2014 OPERATING INCOME OF 233% AND POSITIVE NET CASH FLOW
 news release August 5, 2014 NYSE: TC TSX: TCM THOMPSON CREEK METALS COMPANY REPORTS INCREASE IN SECOND QUARTER 2014 OPERATING INCOME OF 233% AND POSITIVE NET CASH FLOW Denver, CO Thompson Creek Metals
LKQ CORPORATION (Exact name of registrant as specified in its charter)
") UNITED STATES SECURITIES AND EXCHANGE COMMISSION WASHINGTON, D.C. 20549 FORM 8-K Current Report Pursuant to Section 13 or 15(d) of The Securities Exchange Act of 1934 Date of Report (Date of earliest event
UNITED STATES SECURITIES AND EXCHANGE COMMISSION WASHINGTON, D.C. 20549 FORM 8-K Current Report Pursuant to Section 13 or 15(d) of The Securities Exchange Act of 1934 Date of Report (Date of earliest event
LKQ CORPORATION (Exact name of registrant as specified in its charter)
") UNITED STATES SECURITIES AND EXCHANGE COMMISSION WASHINGTON, DC 20549 FORM 8-K Current Report Pursuant to Section 13 or 15(d) of The Securities Exchange Act of 1934 Date of Report (Date of earliest event
UNITED STATES SECURITIES AND EXCHANGE COMMISSION WASHINGTON, DC 20549 FORM 8-K Current Report Pursuant to Section 13 or 15(d) of The Securities Exchange Act of 1934 Date of Report (Date of earliest event
UNITED STATES SECURITIES AND EXCHANGE COMMISSION FORM 8-K HAYNES INTERNATIONAL, INC.
 hayn_currentfolio_8k Page 1 of 2 2/2/2017 UNITED STATES SECURITIES AND EXCHANGE COMMISSION Washington, D.C. 20549 FORM 8-K CURRENT REPORT Pursuant to Section 13 or 15(d) of the Securities Exchange Act
UNITED STATES SECURITIES AND EXCHANGE COMMISSION Washington, D.C FORM 8-K. Aon plc (Exact Name of Registrant as Specified in Charter)
") UNITED STATES SECURITIES AND EXCHANGE COMMISSION Washington, D.C. 20549 FORM 8-K CURRENT REPORT Pursuant to Section 13 or 15(d) of the Securities Exchange Act of 1934 Date of report (Date of earliest event
UNITED STATES SECURITIES AND EXCHANGE COMMISSION Washington, D.C. 20549 FORM 8-K CURRENT REPORT Pursuant to Section 13 or 15(d) of the Securities Exchange Act of 1934 Date of report (Date of earliest event
UNITED STATES SECURITIES AND EXCHANGE COMMISSION Washington, D.C FORM 8-K
 UNITED STATES SECURITIES AND EXCHANGE COMMISSION Washington, D.C. 20549 FORM 8-K CURRENT REPORT Pursuant to Section 13 or 15(d) of the Securities Exchange Act of 1934 Date of Report (Date of Earliest Event
PROLOGIS, INC. PROLOGIS, L.P. (Exact name of registrant as specified in charter)
") UNITED STATES SECURITIES AND EXCHANGE COMMISSION WASHINGTON, D.C. 20549 -------------- FORM 8-K CURRENT REPORT Pursuant to Section 13 or 15(d) of the Securities Exchange Act of 1934 Date of Report (Date
UNITED STATES SECURITIES AND EXCHANGE COMMISSION WASHINGTON, D.C. 20549 -------------- FORM 8-K CURRENT REPORT Pursuant to Section 13 or 15(d) of the Securities Exchange Act of 1934 Date of Report (Date
NEWMONT MINING CORP /DE/
 NEWMONT MINING CORP /DE/ FORM 8-K (Current report filing) Filed 09/28/05 for the Period Ending 09/28/05 Address 6363 SOUTH FIDDLERS GREEN CIRCLE GREENWOOD VILLAGE, CO 80111 Telephone 303-863-7414 CIK 0001164727
Jacobs Engineering Group Inc. (Exact name of Registrant as specified in its charter)
") UNITED STATES SECURITIES AND EXCHANGE COMMISSION Washington, DC 20549 Form 8-K Current Report Pursuant to Section 13 or 15(d) of The Securities Exchange Act of 1934 Date of Report (date of earliest event
UNITED STATES SECURITIES AND EXCHANGE COMMISSION Washington, DC 20549 Form 8-K Current Report Pursuant to Section 13 or 15(d) of The Securities Exchange Act of 1934 Date of Report (date of earliest event
UNITED STATES ANTIMONY CORP
 SECURITIES & EXCHANGE COMMISSION EDGAR FILING UNITED STATES ANTIMONY CORP Form: 8-K Date Filed: 2014-11-20 Corporate Issuer CIK: 101538 Symbol: UAMY SIC Code: 3330 Fiscal Year End: 12/31 Copyright 2014,
SKECHERS U.S.A., INC. (Exact name of registrant as specified in its charter)
") UNITED STATES SECURITIES AND EXCHANGE COMMISSION WASHINGTON, D.C. 20549 FORM 8-K CURRENT REPORT Pursuant to Section 13 or 15(d) of the Securities Exchange Act of 1934 Date of Report (Date of Earliest Event
UNITED STATES SECURITIES AND EXCHANGE COMMISSION WASHINGTON, D.C. 20549 FORM 8-K CURRENT REPORT Pursuant to Section 13 or 15(d) of the Securities Exchange Act of 1934 Date of Report (Date of Earliest Event
TASEKO REPORTS FIRST QUARTER 2018 FINANCIAL RESULTS
 TASEKO REPORTS FIRST QUARTER 2018 FINANCIAL RESULTS This release should be read with the Company s Financial Statements and Management Discussion & Analysis ("MD&A"), available at www.tasekomines.com and
Royal Gold Reports Record Quarterly Revenue and Earnings Per Share
 Royal Gold Reports Record Quarterly Revenue and Earnings Per Share DENVER, COLORADO. NOVEMBER 2, 2016: ROYAL GOLD, INC. (NASDAQ: RGLD) (together with its subsidiaries, Royal Gold or the Company, we or
InfraREIT, Inc. (Exact name of registrant as specified in its charter)
") UNITED STATES SECURITIES AND EXCHANGE COMMISSION WASHINGTON, D.C. 20549 FORM 8-K CURRENT REPORT Pursuant to Section 13 or 15(d) of the Securities Exchange Act of 1934 Date of Report (date of earliest event
UNITED STATES SECURITIES AND EXCHANGE COMMISSION WASHINGTON, D.C. 20549 FORM 8-K CURRENT REPORT Pursuant to Section 13 or 15(d) of the Securities Exchange Act of 1934 Date of Report (date of earliest event
Third Quarter 2018 Results. October 25, 2018
 Third Quarter 2018 Results October 25, 2018 Caution Regarding Forward-Looking Statements Both these slides and the accompanying oral presentation contain certain forward-looking statements within the meaning
Matrix Service Company (Exact Name of Registrant as Specified in Its Charter)
") UNITED STATES SECURITIES AND EXCHANGE COMMISSION WASHINGTON, DC 20549 FORM 8-K CURRENT REPORT PURSUANT TO SECTION 13 OR 15(d) OF THE SECURITIES EXCHANGE ACT OF 1934 Date of report (Date of earliest event
UNITED STATES SECURITIES AND EXCHANGE COMMISSION WASHINGTON, DC 20549 FORM 8-K CURRENT REPORT PURSUANT TO SECTION 13 OR 15(d) OF THE SECURITIES EXCHANGE ACT OF 1934 Date of report (Date of earliest event
NEWS RELEASE Lundin Mining Second Quarter Results
 Corporate Office 150 King Street West, Suite 2200 P.O. Box 38 Toronto, ON M5H 1J9 Phone: +1 416 342 5560 Fax: +1 416 348 0303 NEWS RELEASE Lundin Mining Second Quarter Results Toronto, July 25, 2018 (TSX:
MILLER INDUSTRIES, INC. (Exact Name of Registrant as Specified in Its Charter)
") UNITED STATES SECURITIES AND EXCHANGE COMMISSION Washington, DC 20549 FORM 8-K CURRENT REPORT Pursuant to Section 13 or 15(d) of the Securities Exchange Act of 1934 Date of Report (Date of earliest event
UNITED STATES SECURITIES AND EXCHANGE COMMISSION Washington, DC 20549 FORM 8-K CURRENT REPORT Pursuant to Section 13 or 15(d) of the Securities Exchange Act of 1934 Date of Report (Date of earliest event
UNITED STATES SECURITIES AND EXCHANGE COMMISSION Washington, D.C FORM 8-K
 UNITED STATES SECURITIES AND EXCHANGE COMMISSION Washington, D.C. 20549 FORM 8-K CURRENT REPORT Pursuant to Section 13 or 15(d) of the Securities Exchange Act of 1934 Date of Report (date of earliest event
Coeur Provides Updated Palmarejo Mine Plan
 NEWS RELEASE Coeur Provides Updated Palmarejo Mine Plan Chicago, Illinois - July 20, 2014 - Coeur Mining, Inc. ( Coeur or the Company ) (NYSE: CDE) announced an updated and re-scoped mine plan and preliminary
UNION PACIFIC CORPORATION (Exact name of registrant as specified in its charter)
") UNITED STATES SECURITIES AND EXCHANGE COMMISSION Washington, D.C. 20549 FORM 8-K CURRENT REPORT Pursuant to Section 13 or 15(d) of the Securities Exchange Act of 1934 Date of Report (Date of earliest event
UNITED STATES SECURITIES AND EXCHANGE COMMISSION Washington, D.C. 20549 FORM 8-K CURRENT REPORT Pursuant to Section 13 or 15(d) of the Securities Exchange Act of 1934 Date of Report (Date of earliest event
TASEKO REPORTS 2017 FOURTH QUARTER AND ANNUAL FINANCIAL RESULTS
 TASEKO REPORTS 2017 FOURTH QUARTER AND ANNUAL FINANCIAL RESULTS This release should be read with the Company s Financial Statements and Management Discussion & Analysis ("MD&A"), available at www.tasekomines.com
2017 Actual Guidance Guidance Guidance
 Total Gold Equivalent Production (oz.) (1,2) 1. 2. 2017 Actual 2018 2019 2020 892,006 1,013,000 1,084,000 1,149,000 The following table presents per unit cost expectations on a GEO basis for 2018. 2017
UNITED TECHNOLOGIES CORPORATION (Exact name of registrant as specified in its charter)
") UNITED STATES SECURITIES AND EXCHANGE COMMISSION Washington, D.C. 20549 FORM 8-K CURRENT REPORT Pursuant to Section 13 OR 15(d) of The Securities Exchange Act of 1934 Date of Report (Date of earliest event
UNITED STATES SECURITIES AND EXCHANGE COMMISSION Washington, D.C. 20549 FORM 8-K CURRENT REPORT Pursuant to Section 13 OR 15(d) of The Securities Exchange Act of 1934 Date of Report (Date of earliest event
MICROCHIP TECHNOLOGY INCORPORATED (Exact name of registrant as specified in its charter)
") UNITED STATES SECURITIES AND EXCHANGE COMMISSION Washington, DC 20549 FORM 8-K CURRENT REPORT Pursuant to Section 13 or 15(d) of The Securities Exchange Act of 1934 April 4, 2016 Date of Report (Date of
UNITED STATES SECURITIES AND EXCHANGE COMMISSION Washington, DC 20549 FORM 8-K CURRENT REPORT Pursuant to Section 13 or 15(d) of The Securities Exchange Act of 1934 April 4, 2016 Date of Report (Date of
UNITED STATES SECURITIES AND EXCHANGE COMMISSION Washington, D.C FORM 8-K
 UNITED STATES SECURITIES AND EXCHANGE COMMISSION Washington, D.C. 20549 FORM 8-K CURRENT REPORT PURSUANT TO SECTION 13 OR 15(D) OF THE SECURITIES EXCHANGE ACT OF 1934 Date of Report (Date of earliest event
Newmont Announces First Quarter 2018 Results
 NEWS RELEASE NYSE: NEM newmont.com Newmont Announces First Quarter 2018 Results DENVER, April 26, 2018 Newmont Mining Corporation (NYSE: NEM) (Newmont or the Company) announced first quarter 2018 results.
Allied Nevada Reports Second Quarter 2014 Financial Results
 Allied Nevada Gold Corp. 9790 Gateway Drive Suite 200 Reno, NV 89521 USA NEWS RELEASE Allied Nevada Reports Second Quarter 2014 Financial Results August 4, 2014 Reno, Nevada - Allied Nevada Gold Corp.
CLEVELAND-CLIFFS INC. (Exact name of registrant as specified in its charter)
") UNITED STATES SECURITIES AND EXCHANGE COMMISSION WASHINGTON, D.C. 20549 FORM 8-K CURRENT REPORT PURSUANT TO SECTION 13 OR 15(d) OF THE SECURITIES EXCHANGE ACT OF 1934 Date of Report (Date of earliest event
UNITED STATES SECURITIES AND EXCHANGE COMMISSION WASHINGTON, D.C. 20549 FORM 8-K CURRENT REPORT PURSUANT TO SECTION 13 OR 15(d) OF THE SECURITIES EXCHANGE ACT OF 1934 Date of Report (Date of earliest event
PARKER DRILLING COMPANY (Exact name of registrant as specified in its charter)
") UNITED STATES SECURITIES AND EXCHANGE COMMISSION WASHINGTON, D.C. 20549 FORM 8-K CURRENT REPORT PURSUANT TO SECTION 13 OR 15(D) OF THE SECURITIES EXCHANGE ACT OF 1934 Date of report (Date of earliest event
UNITED STATES SECURITIES AND EXCHANGE COMMISSION WASHINGTON, D.C. 20549 FORM 8-K CURRENT REPORT PURSUANT TO SECTION 13 OR 15(D) OF THE SECURITIES EXCHANGE ACT OF 1934 Date of report (Date of earliest event
VISTRA ENERGY CORP. (Exact name of registrant as specified in its charter)
") UNITED STATES SECURITIES AND EXCHANGE COMMISSION Washington, DC 20549 FORM 8-K CURRENT REPORT Pursuant to Section 13 or 15(d) of the Securities Exchange Act of 1934 Date of Report (Date of earliest event
UNITED STATES SECURITIES AND EXCHANGE COMMISSION Washington, DC 20549 FORM 8-K CURRENT REPORT Pursuant to Section 13 or 15(d) of the Securities Exchange Act of 1934 Date of Report (Date of earliest event