FREE CASH FLOW DISCLOSURE IN EARNINGS ANNOUNCEMENTS. Katharine Adame, Jennifer Koski, and Sarah McVay University of Washington
|
|
|
- Sabina Lindsey
- 5 years ago
- Views:
Transcription
1 FREE CASH FLOW DISCLOSURE IN EARNINGS ANNOUNCEMENTS Katharine Adame, Jennifer Koski, and Sarah McVay University of Washington
2 Background In recent years, more companies have been disclosing free cash flow in their earnings announcements.
3 While GE is a serial tweaker of financial disclosure, the company is doing the right thing by shifting its focus to more transparent free cash flow. Unfortunately, it paints an unflattering picture. Spencer Jacab, Heard on the Street, The Wall Street Journal, Jan. 25, 2018, p. B14
4 The Big Picture Does free cash flow disclosure provide incremental information to the market? Free cash flow is a critical input for valuation. But, it is not a required part of financial statement disclosure. There is no standard accounting definition of free cash flow under GAAP. The company must provide a definition and reconciliation with reported financial statements. Is free cash flow a redundant repackaging of information readily available in financial statements, or does it provide new value-relevant information?
5 Research Questions Which companies choose to disclose free cash flow, and why? Information vs. opportunism? How does the stock market react to free cash flow disclosure? Free cash flow Free cash flow disclosure Choice of definition
6 Free Cash Flow- Overview (Unlevered) free cash flow is often defined as FCF = EBIT(1-Tax Rate) + Depreciation (and Other Non-Cash Charges) Net Capital Expenditures Change in Net Working Capital Berk and DeMarzo (2017, Chapter 8) Higgins (2016, Chapter 9) Welch (2009, Chapter 13)
7 Free Cash Flow- Overview (Unlevered) free cash flow is often defined as EBIAT FCF = EBIT(1-Tax Rate) + Depreciation (and Other Non-Cash Charges) Net Capital Expenditures Change in Net Working Capital
8 Free Cash Flow- Overview (Unlevered) free cash flow is often defined as EBIAT FCF = Net Income + Interest Expense (1-Tax Rate) + Depreciation (and Other Non-Cash Charges) Net Capital Expenditures Change in Net Working Capital CFA Exam Review Materials
9 Free Cash Flow- Overview (Unlevered) free cash flow is often defined as FCF = Net Income + Interest Expense (1-Tax Rate) + Depreciation (and Other Non-Cash Charges) Net Capital Expenditures Change in Net Working Capital = Operating Cash Flow
10 Free Cash Flow- Overview (Unlevered) free cash flow is often defined as FCF = Operating Cash Flow + Interest Expense (1-Tax Rate) Net Capital Expenditures This definition corresponds most closely to the components as they are reported on publicly available GAAP financial statements.
11 Challenges Estimating FCF in Practice Marginal tax rate is not directly observed. Difficult to identify Net Capital Expenditures. Lack of disclosure of distinct values for purchases and sales of capital assets? Capitalized software? Capital expenditures financed using leases or installment notes? Excess (versus working) cash? Transitory (cash) charges?
12 Sample S&P 1500 firms from Use Python to identify earnings announcements that mention free cash flow. Hand collect data for 1,975 earnings announcements that disclose annual FCF number.
13 Sample S&P 1500 firms from Use Python to identify earnings announcements that mention free cash flow Hand collect data for 1,975 earnings announcements that disclose annual FCF number. 14.1% of 13,992 total firm-year observations in our sample.
14 Sample S&P 1500 firms from Use Python to identify earnings announcements that mention free cash flow Hand collect data for 1,975 earnings announcements that disclose annual FCF number. The most common definition of disclosed FCF (in 38% of disclosures) is Operating Cash Flow Gross Capital Expenditures
15 Sample S&P 1500 firms from Use Python to identify earnings announcements that mention free cash flow Hand collect data for 1,975 earnings announcements that disclose annual FCF number. The most common definition of disclosed FCF (in 38% of disclosures) is Simple FCF Operating Cash Flow Gross Capital Expenditures (OCF) (Gross CapEx)
16 Free Cash Flow Disclosure: Example

17 Free Cash Flow Disclosure: Example FCF = OCF CapEx Simple FCF

18
19 Definition of Disclosed FCF Another 21% of firms report some variation of Simple FCF. The remaining 41% report another definition, with very little consensus. No sample firms disclose FCF as defined by finance theory.
20 Definition of Disclosed FCF Another 21% of firms report some variation of Simple FCF. The remaining 41% report another definition, with very little consensus. No sample firms disclose FCF as defined by finance theory. A majority (68%) disclose FCF greater than net income.
21 Definition of Disclosed FCF Another 21% of firms report some variation of Simple FCF. The remaining 41% report another definition, with very little consensus. No sample firms disclose FCF as defined by finance theory. 37% disclose FCF greater than Simple FCF
22 Definition of Disclosed FCF Another 21% of firms report some variation of Simple FCF. The remaining 41% report another definition, with very little consensus. No sample firms disclose FCF as defined by finance theory. 25% disclose FCF less than Simple FCF.
23 Which companies choose to disclose FCF, and why? We explore two alternative hypotheses Information Opportunism We estimate a logit regression: Dependent variable equals 1 for FCF disclosers (initial versus ongoing). Explanatory variables include Firm characteristics that proxy for information and opportunism. Control variables.
24 Determinants- Information FCF is likely to be incrementally more informative for firms with: Larger accruals: capital intensity and deferred revenues Higher leverage Less volatile free cash flow An interest in attracting an acquirer Non-GAAP earnings tend to be disclosed when GAAP earnings are less informative (Loguee and Marquardt (2004)). Growth firms Firms with higher market-to-book ratios Firms with more transitory one-time events
25 Determinants- Opportunism Disclosure is more likely to be opportunistic when Earnings are negative and/or decreasing. FCF is positive and/or increasing. Firms have more leases. Control variables: Firm size (assets) Analyst following Institutional ownership Firm age Industry disclosure Year fixed effects
26 Which companies disclose FCF and why? Information Opportunism Controls Variable Initial Disclosure Ongoing Disclosure FCF volatility (-) (-) Sales growth (-) Market-to-book (+) One-time event (+) Earnings decrease (+) Positive FCF (+) (+) Increase in FCF (+) Firm size (+) (+) Firm age (-) (-) Industry average (+) (+)
27 Which companies disclose FCF and why? Initial disclosure is more strongly related to proxies for opportunism. Information Opportunism Controls Variable Initial Disclosure Ongoing Disclosure FCF volatility (-) (-) Sales growth (-) Market-to-book (+) One-time event (+) Earnings decrease (+) Positive FCF (+) (+) Increase in FCF (+) Firm size (+) (+) Firm age (-) (-) Industry average (+) (+)
28 Which companies disclose FCF and why? Ongoing disclosure is more strongly related to information proxies. Information Opportunism Controls Variable Initial Disclosure Ongoing Disclosure FCF volatility (-) (-) Sales growth (-) Market-to-book (+) One-time event (+) Earnings decrease (+) Positive FCF (+) (+) Increase in FCF (+) Firm size (+) (+) Firm age (-) (-) Industry average (+) (+)
29 Which companies disclose FCF and why? Effects are material. Firms with one-time events are 4-5 percentage points more likely to disclose (vs. unconditional mean disclosure of 14.1%). Information Opportunism Controls Variable Initial Disclosure Ongoing Disclosure FCF volatility (-) (-) Sales growth (-) Market-to-book (+) One-time event (+) Earnings decrease (+) Positive FCF (+) (+) Increase in FCF (+) Firm size (+) (+) Firm age (-) (-) Industry average (+) (+)
30 How does the market react? Is there information in Free Cash Flow itself? The decision to disclose FCF? The choice of definition? Simple FCF vs. adjusted definition
31 Does the market react to FCF itself? Regress three-day CARs on earnings surprise and FCF surprise: CAR = + (Earnings Surprise ) + (Simple FCF Surprise ) + i 0 1 i 2 i i CAR is 3-day abnormal return around earnings announcement Surprise is measured relative to trailing-12-months (ttm) results for the same figure reported as of the prior quarter end. Simple FCF is defined as (OCF Gross CapEx) and is computed using Compustat data for all firms. Estimate this equation for non-disclosers and Simple FCF disclosers.
 Simple FCF Surprise 0.0032*** 0.0028*** (0.0000) (0.0000) Constant -0.0143*** -0.0119*** -0.0272*** (0.0005) (0.0021) (0.")
32 Does the market react to FCF itself? Confirm prior research: Unexpected earnings are positively related to earnings (1) (2) announcement (3) returns Earnings Surprise *** *** (0.0000) (0.0000) Simple FCF Surprise *** *** (0.0000) (0.0000) Constant *** *** *** (0.0005) (0.0021) (0.0000) Fixed Effects Year & Industry Year & Industry Year & Industry Observations 11,795 11,795 11,795 Observations with FCF disclosure R-squared
33 Does the market react to FCF itself? Coefficient on Simple FCF Surprise is also significant, similar in magnitude (1) (2) (3) Earnings Surprise *** *** (0.0000) (0.0000) Simple FCF Surprise *** *** (0.0000) (0.0000) Constant *** *** *** (0.0005) (0.0021) (0.0000) Fixed Effects Year & Industry Year & Industry Year & Industry Observations 11,795 11,795 11,795 Observations with FCF disclosure R-squared
34 Does the market react to FCF disclosure? Indicator variable, FCF Discloser, for subset of firms that disclose simple FCF. Earnings Surprise *** (0.0000) Simple FCF Surprise *** (0.0000) Simple FCF Surprise*FCF Discloser ** (0.0366) FCF Discloser * (0.0543) Constant *** (0.0000) Year & Fixed Effects Industry Observations 11,795 Observations with FCF disclosure 668 R-squared
35 Does the market react to FCF disclosure? Indicator variable, FCF Discloser, for subset of firms that disclose simple FCF. The market reacts incrementally when a firm chooses to disclose FCF. Earnings Surprise *** (0.0000) Simple FCF Surprise *** (0.0000) Simple FCF Surprise*FCF Discloser ** (0.0366) FCF Discloser * (0.0543) Constant *** (0.0000) Year & Fixed Effects Industry Observations 11,795 Observations with FCF disclosure 668 R-squared
36 Does the market react to the choice of definition of disclosed FCF? Examine the subset of firms that disclose FCF, distinguish between those that disclose Simple FCF and those that disclose something different. CAR = + (Earnings Surprise) + (Simple FCF Surprise) i (FCF Diff) + 3 i where FCF Diff is (Disclosed FCF Simple FCF), the incremental adjustments some firms make beyond Simple FCF.
37 Does the market react to choice of definition? (1) (2) (3) (4) The market reacts incrementally to individual adjustments Earnings Surprise *** *** *** *** (0.0000) (0.0000) (0.0000) (0.0000) Simple FCF Surprise *** *** *** *** (0.0000) (0.0000) (0.0000) (0.0000) FCF Diff ** (0.0294) Positive FCF Diff ** ** (0.0189) (0.0234) Negative FCF Diff (0.4616) (0.7523) Constant *** *** *** *** (0.0002) (0.0002) (0.0018) (0.0022) Fixed effects Year and Industry Year and Industry Year and Industry Year and Industry Observations 1,955 1,955 1,955 1,955 R-squared
 (0.0000) (0.0000) (0.0000) FCF Diff 0.0015** (0.0294) Positive FCF Diff 0.0013** 0.0014** (0.0189) (0.0234) Negative FCF Diff 0.0019-0.0009 (0.4616) (0.")
38 Does the market react to choice of definition? (1) (2) (3) (4) in particular when they are positive. Earnings Surprise *** *** *** *** (0.0000) (0.0000) (0.0000) (0.0000) Simple FCF Surprise *** *** *** *** (0.0000) (0.0000) (0.0000) (0.0000) FCF Diff ** (0.0294) Positive FCF Diff ** ** (0.0189) (0.0234) Negative FCF Diff (0.4616) (0.7523) Constant *** *** *** *** (0.0002) (0.0002) (0.0018) (0.0022) Fixed effects Year and Industry Year and Industry Year and Industry Year and Industry Observations 1,955 1,955 1,955 1,955 R-squared
39 Summary Free cash flow disclosures are increasing in frequency. There is considerable variation in the definition of disclosed FCF. (OCF Gross Cap Exp) is the most common definition. No company uses the definition from theory. Determinants suggest the decision to initiate FCF disclosure has an opportunistic motive, while ongoing disclosure is more strongly related to information proxies. Markets appear to price free cash flow surprises incrementally over earnings. There is value-relevant information in FCF itself, in the decision to disclose FCF, and in the choice of definition.
40 Extra Exhibits
41 Frequency of Non-GAAP Disclosure
42 Transitory Cash Charges (Example) Invacare Corporate reported adjusted net earnings for the year ended Dec. 21, 2006 that excluded $21.25 million related to restructuring charges. Not all of this amount was cash. Some portion reflects accruals. Invacare provided a free cash flow disclosure that added $9.935 million to free cash flow. The remaining amount was non-cash.

43 Figure 1. (Format of Disclosure)
44
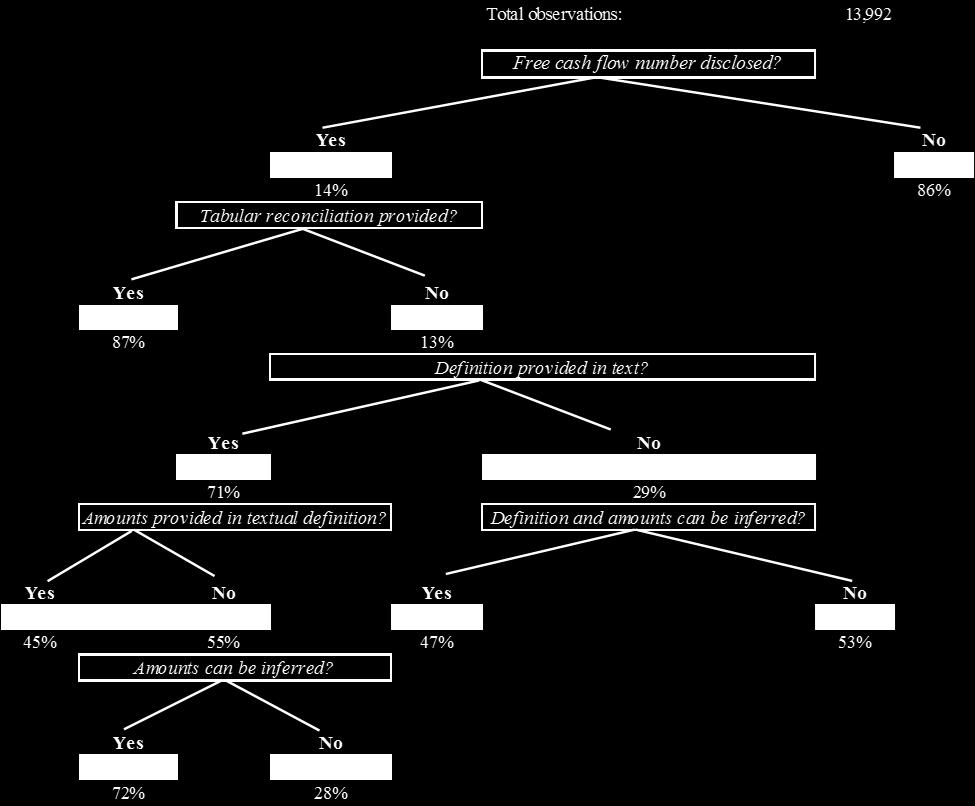
45 Table 1, Panel A (Sample Selection) Number of Filings Firms Number of fourth quarter filings identfied by Python web crawler 23,659 2,333 Less: filings for firms with missing sequential Python identified earnings announcements 9, Remaining fourth quarter filings (full sample) 13,992 1,393 Number of earnings announcements with mention of "free cash flow" identified by Python text scraper (hand-collected data for these filings) 2,418 Less: generic mention of "free cash flow;" no value disclosed 388 Less: filings with only quarterly "free cash flow;" no annual value disclosed 55 Number of fourth quarter earnings announcements with annual FCF disclosed (FCF disclosure sample) 1,
46 Table 1, Panel B (Format of Disclosure) Number of FCF Disclosures Percent of FCF Disclosures Unique firms Tabular reconciliation (components explicitly provided) 1, % 283 Textual definition (components explicity provided) % 26 Textual definition (components can be inferred) % 40 No reconciliation or definition (components can be inferred) % 23 Components of FCF are explicitly provided or can be inferred 1, % Components cannot be inferred given available information % 42 Total 1, %
47 Table 1, Panel C (Disclosure by Year) Total firmyear observations in sample Firm-years disclosing FCF Percent of firm-years disclosing FCF First-time Free Cash Flow Disclosures Percent of First Time Disclosures by Year Percent of Disclosures that are First Time Year % , % % 15.7% , % % 19.5% , % % 14.8% , % % 14.7% , % % 21.3% , % % 13.9% , % % 12.0% , % % 11.0% % % 8.6% % % 8.2% % % 6.2% % % 6.3% Total 13,992 1, % %
48 Table 1, Panel D (Disclosure by Industry) Percent of Total Observations Number of Free Cash Flow Disclosures Industry Disclosure Proportion Number of GICS Sector (Sector Number) Observations Energy (10) % % Materials (15) % % Industrials (20) 2, % % Consumer Discretionary (25) 2, % % Consumer Staples (30) % % Healthcare (35) 1, % % Financials (40) 1, % % Information Technology (45) 2, % % Telecom (50) % % Utilities (55) % % Real Estate (60) % % Total 13, % 1,975
49 Table 2, Panel A (Common Definitions) Number of Disclosures Percent of Disclosures Unique Firms Simple FCF (operating CF - gross capex) % Modified Simple FCF (modified operating CF or gross capex) % Start from operating cash flows, other definition % Start from version of operating cash flows 1,794 94% 308 FCF starting point is not operating CF 112 6% 23 Total 1, %
50 Table 3, Panel A (Descriptive Statistics) Variable N Mean StdDev Min 25th Median 75th Max Disclosed FCF 1, ,324-3, ,282 CF from Operations 1,794 1,676 4,384-2, ,105 39,300 Capex 1, , ,400 Other capitalized assets ,686 Dividends ,262 Sale of PPE ,562 Special items ,754 Other Adjustments , ,400 Simple FCF 1, ,313-7, ,214 Net Income 1, ,145-17, ,864
51 Table 4, Panel B (Descriptive Statistics) Free cash flow disclosers Free cash flow non-disclosers Test of differences Variable N Mean Median N Mean Median Mean Median Capital intensity 1, , Deferred revenue 1, , Leverage 1, , FCF volatility 1, , Acquired indicator 1, , Sales growth 1, , MTB 1, , One-time event 1, , Loss 1, , Earnings decrease 1, , Positive simple FCF 1, , Increase in simple FCF 1, , Lease obligations 1, , Assets 1,975 14,969 3,809 12,017 12,187 2, Analyst following 1, , Institutional ownership 1, , Age 1, ,
52 Table 5 (Determinants Logit) (1) (2) (3) (4) Initial Disclosures Initial Disclosures All Disclosures All Disclosures Coeff (p-values) Marginal Effects Coeff (p-values) Marginal Effects Coeff (p-values) Marginal Effects Coeff (p-values) Marginal Effects Information Variables Capital intensity 0.535* (0.098) (0.824) (0.828) (0.877) Deferred revenue (0.856) (0.617) (0.979) (0.854) Leverage * 0.008* (0.757) (0.331) (0.810) (0.073) FCF volatility * *** *** *** *** (0.680) (0.099) (0.009) (0.002) Acquired indicator (0.791) (0.928) (0.794) (0.922) Sales growth * * ** ** (0.924) (0.780) (0.092) (0.048) MTB *** 0.005** 0.037** 0.004** (0.657) (0.603) (0.009) (0.012) One-time event *** 0.052*** 0.408*** 0.042*** (0.164) (0.204) (0.000) (0.000)
53 Table 5 (Determinants Logit, cont.) (1) (2) (3) (4) Initial Disclosures Initial Disclosures All Disclosures All Disclosures Coeff (p-values) Marginal Effects Coeff (p-values) Marginal Effects Coeff (p-values) Marginal Effects Coeff (p-values) Marginal Effects Opportunism Variables Loss (0.917) (0.646) (0.955) (0.565) Earnings decrease 0.358** 0.008** 0.356** 0.007** (0.015) (0.015) (0.530) (0.594) Positive simple FCF 0.914*** 0.019*** 0.877*** 0.018*** 0.557*** 0.061*** 0.577*** 0.060*** (0.002) (0.004) (0.000) (0.000) Increase in simple FCF 0.596*** 0.013*** 0.584*** 0.012*** (0.000) (0.000) (0.240) (0.313) Lease obligations (0.767) (0.559) (0.612) (0.229)
54 Determinants Logit (cont.) (1) (2) (3) (4) Initial Disclosures Initial Disclosures All Disclosures All Disclosures Coeff (p-values) Marginal Effects Coeff (p-values) Marginal Effects Coeff (p-values) Marginal Effects Coeff (p-values) Marginal Effects Control Variables Ln(Assets) 0.137** 0.003** 0.321*** 0.007*** 0.351*** 0.038*** 0.512*** 0.053*** (0.025) (0.000) (0.000) (0.000) Ln(Analyst following) (0.971) (0.120) (0.927) (0.122) Institutional ownership (0.597) (0.820) (0.397) (0.448) Ln(Age) ** ** ** ** *** *** (0.728) (0.041) (0.017) (0.002) Lagged industry disclosure 5.256*** 0.112*** 8.632*** 0.938*** (0.000) (0.000) Fixed effects Year Year & Industry Year Year & Industry Observations Obs. for which DV = 1 Pseudo R2 10, , Average marginal effects are reported in columns (2), (4), and (6). 12, ,841 1,
55 Market Reaction (Table 6, Panel B) (1) (2) (3) (4) (5) (6) (7) Earnings Surprise *** *** *** *** *** *** (0.0000) (0.0000) (0.0000) (0.0000) (0.0000) (0.0000) Simple FCF Surprise *** *** *** *** *** *** (0.0000) (0.0000) (0.0000) (0.0000) (0.0000) (0.0000) FCF Diff ** (0.0294) Positive FCF Diff ** ** (0.0189) (0.0234) Negative FCF Diff (0.4616) (0.7523) Constant ** ** *** *** *** *** *** (0.0378) (0.0239) (0.0012) (0.0002) (0.0002) (0.0018) (0.0022) Fixed effects Year and Industry Year and Industry Year and Industry Year and Industry Year and Industry Year and Industry Year and Industry Observations 1,955 1,955 1,955 1,955 1,955 1,955 1,955 R-squared
Free Cash Flow Disclosure in Earnings Announcements*
 Free Cash Flow Disclosure in Earnings Announcements* Katharine Adame kadame@uw.edu Jennifer Koski jkoski@uw.edu Sarah McVay smcvay@uw.edu University of Washington September 7, 2018 Abstract More companies
R&D and Stock Returns: Is There a Spill-Over Effect?
 R&D and Stock Returns: Is There a Spill-Over Effect? Yi Jiang Department of Finance, California State University, Fullerton SGMH 5160, Fullerton, CA 92831 (657)278-4363 yjiang@fullerton.edu Yiming Qian
Company Stock Price Reactions to the 2016 Election Shock: Trump, Taxes, and Trade INTERNET APPENDIX. August 11, 2017
 Company Stock Price Reactions to the 2016 Election Shock: Trump, Taxes, and Trade INTERNET APPENDIX August 11, 2017 A. News coverage and major events Section 5 of the paper examines the speed of pricing
Market reaction to Non-GAAP Earnings around SEC regulation
 Market reaction to Non-GAAP Earnings around SEC regulation Abstract This paper examines the consequences of the non-gaap reporting resulting from Regulation G as required by Section 401(b) of the Sarbanes-Oxley
A Synthesis of Accrual Quality and Abnormal Accrual Models: An Empirical Implementation
 A Synthesis of Accrual Quality and Abnormal Accrual Models: An Empirical Implementation Jinhan Pae a* a Korea University Abstract Dechow and Dichev s (2002) accrual quality model suggests that the Jones
Research Methods in Accounting
 01130591 Research Methods in Accounting Capital Markets Research in Accounting Dr Polwat Lerskullawat: fbuspwl@ku.ac.th Dr Suthawan Prukumpai: fbusswp@ku.ac.th Assoc Prof Tipparat Laohavichien: fbustrl@ku.ac.th
Online Appendix to. The Value of Crowdsourced Earnings Forecasts
 Online Appendix to The Value of Crowdsourced Earnings Forecasts This online appendix tabulates and discusses the results of robustness checks and supplementary analyses mentioned in the paper. A1. Estimating
Market Perceptions of the Informational and Comparability Effects of Fair Value Reporting for Tangible Assets: US and Cross-Country Evidence
 Market Perceptions of the Informational and Comparability Effects of Fair Value Reporting for Tangible Assets: US and Cross-Country Evidence Jenelle Conaway (Boston University, PhD Student) Lihong Liang
The Free Cash Flow Effects of Capital Expenditure Announcements. Catherine Shenoy and Nikos Vafeas* Abstract
 The Free Cash Flow Effects of Capital Expenditure Announcements Catherine Shenoy and Nikos Vafeas* Abstract In this paper we study the market reaction to capital expenditure announcements in the backdrop
Why Do Companies Choose to Go IPOs? New Results Using Data from Taiwan;
 University of New Orleans ScholarWorks@UNO Department of Economics and Finance Working Papers, 1991-2006 Department of Economics and Finance 1-1-2006 Why Do Companies Choose to Go IPOs? New Results Using
Do the Market Analysts Earnings Forecast Errors Matter with Earnings Management in the U.S. Banking Industry?
 Min-Lee Chan Kai-Li Wang & Pin-Shiuan Chen o the Market Analysts Earnings Forecast Errors Matter with Earnings Management in the U.S. Banking Industry? (Received Sep 30 2008; First Revision Jan 15 2009;
Complete Dividend Signal
 Complete Dividend Signal Ravi Lonkani 1 ravi@ba.cmu.ac.th Sirikiat Ratchusanti 2 sirikiat@ba.cmu.ac.th Key words: dividend signal, dividend surprise, event study 1, 2 Department of Banking and Finance
Do Investors Value Dividend Smoothing Stocks Differently? Internet Appendix
 Do Investors Value Dividend Smoothing Stocks Differently? Internet Appendix Yelena Larkin, Mark T. Leary, and Roni Michaely April 2016 Table I.A-I In table I.A-I we perform a simple non-parametric analysis
Investment and Capital Constraints: Repatriations Under the American Jobs Creation Act
 Investment and Capital Constraints: Repatriations Under the American Jobs Creation Act Online Appendix: Additional Results I) Description of AJCA Repatriation Restrictions. This is a more complete description
Core CFO and Future Performance. Abstract
 Core CFO and Future Performance Rodrigo S. Verdi Sloan School of Management Massachusetts Institute of Technology 50 Memorial Drive E52-403A Cambridge, MA 02142 rverdi@mit.edu Abstract This paper investigates
VALCON Morningstar v. Duff & Phelps
 VALCON 2010 Size Premia: Morningstar v. Duff & Phelps Roger J. Grabowski, ASA Duff & Phelps, LLC Co-author with Shannon Pratt of Cost of Capital: Applications and Examples, 3 rd ed. (Wiley 2008) and 4th
Conflict in Whispers and Analyst Forecasts: Which One Should Be Your Guide?
 Abstract Conflict in Whispers and Analyst Forecasts: Which One Should Be Your Guide? Janis K. Zaima and Maretno Agus Harjoto * San Jose State University This study examines the market reaction to conflicts
Do Auditors Use The Information Reflected In Book-Tax Differences? Discussion
 Do Auditors Use The Information Reflected In Book-Tax Differences? Discussion David Weber and Michael Willenborg, University of Connecticut Hanlon and Krishnan (2006), hereinafter HK, address an interesting
Do Corporate Managers Time Stock Repurchases Effectively?
 Do Corporate Managers Time Stock Repurchases Effectively? Michael Lorka ABSTRACT This study examines the performance of share repurchases completed by corporate managers, and compares the implied performance
Corporate cash shortfalls and financing decisions
 Corporate cash shortfalls and financing decisions Rongbing Huang and Jay R. Ritter December 5, 2015 Abstract Immediate cash needs are the primary motive for debt issuances and a highly important motive
How Markets React to Different Types of Mergers
 How Markets React to Different Types of Mergers By Pranit Chowhan Bachelor of Business Administration, University of Mumbai, 2014 And Vishal Bane Bachelor of Commerce, University of Mumbai, 2006 PROJECT
The Effect of Financial Constraints, Investment Policy and Product Market Competition on the Value of Cash Holdings
 The Effect of Financial Constraints, Investment Policy and Product Market Competition on the Value of Cash Holdings Abstract This paper empirically investigates the value shareholders place on excess cash
Post-Earnings-Announcement Drift (PEAD): The Role of Revenue Surprises
: The Role of Revenue Surprises") Post-Earnings-Announcement Drift (PEAD): The Role of Revenue Surprises Joshua Livnat Department of Accounting Stern School of Business Administration New York University 311 Tisch Hall 40 W. 4th St. New
Post-Earnings-Announcement Drift (PEAD): The Role of Revenue Surprises Joshua Livnat Department of Accounting Stern School of Business Administration New York University 311 Tisch Hall 40 W. 4th St. New
Stock Price Reaction to Brokers Recommendation Updates and Their Quality Joon Young Song
 Stock Price Reaction to Brokers Recommendation Updates and Their Quality Joon Young Song Abstract This study presents that stock price reaction to the recommendation updates really matters with the recommendation
Bank Monitoring and Managerial Procrastination: Evidence from the Timing of Earnings Announcements
 Bank Monitoring and Managerial Procrastination: Evidence from the Timing of Earnings Announcements Chih-Huei (Debby) Su University of St. Thomas Version: July 25, 2015 Abstract I examine the role of bank
Dividend Changes and Future Profitability
 THE JOURNAL OF FINANCE VOL. LVI, NO. 6 DEC. 2001 Dividend Changes and Future Profitability DORON NISSIM and AMIR ZIV* ABSTRACT We investigate the relation between dividend changes and future profitability,
Did the Adoption of IAS/IFRS by German Firms in 2005 Improve Earnings Predictive Power with regard to Forecasting Future Operating Cash Flows?
 Did the Adoption of IAS/IFRS by German Firms in 2005 Improve Earnings Predictive Power with regard to Forecasting Future Operating Cash Flows? An Empirical Analysis of German Publicly Listed Firms. Stephan
INSTITUTIONAL TRADING STRATEGIES AND CONTAGION AROUND CRISIS PERIODS. V. Ravi Anshuman Rajesh Chakrabarti Kiran Kumar
 INSTITUTIONAL TRADING STRATEGIES AND CONTAGION AROUND CRISIS PERIODS V. Ravi Anshuman Rajesh Chakrabarti Kiran Kumar How do FII Investments affect stock market? April 2, 2012, MINT LITERATURE Brennan and
Market Overreaction to Bad News and Title Repurchase: Evidence from Japan.
 Market Overreaction to Bad News and Title Repurchase: Evidence from Japan Author(s) SHIRABE, Yuji Citation Issue 2017-06 Date Type Technical Report Text Version publisher URL http://hdl.handle.net/10086/28621
Sources of Financing in Different Forms of Corporate Liquidity and the Performance of M&As
 Sources of Financing in Different Forms of Corporate Liquidity and the Performance of M&As Zhenxu Tong * University of Exeter Jian Liu ** University of Exeter This draft: August 2016 Abstract We examine
Elisabetta Basilico and Tommi Johnsen. Disentangling the Accruals Mispricing in Europe: Is It an Industry Effect? Working Paper n.
 Elisabetta Basilico and Tommi Johnsen Disentangling the Accruals Mispricing in Europe: Is It an Industry Effect? Working Paper n. 5/2014 April 2014 ISSN: 2239-2734 This Working Paper is published under
DISCRETIONARY DELETIONS FROM THE S&P 500 INDEX: EVIDENCE ON FORECASTED AND REALIZED EARNINGS Stoyu I. Ivanov, San Jose State University
 DISCRETIONARY DELETIONS FROM THE S&P 500 INDEX: EVIDENCE ON FORECASTED AND REALIZED EARNINGS Stoyu I. Ivanov, San Jose State University ABSTRACT The literature in the area of index changes finds evidence
CAPITAL STRUCTURE AND THE 2003 TAX CUTS Richard H. Fosberg
 CAPITAL STRUCTURE AND THE 2003 TAX CUTS Richard H. Fosberg William Paterson University, Deptartment of Economics, USA. KEYWORDS Capital structure, tax rates, cost of capital. ABSTRACT The main purpose
Internet Appendix to Broad-based Employee Stock Ownership: Motives and Outcomes *
 Internet Appendix to Broad-based Employee Stock Ownership: Motives and Outcomes * E. Han Kim and Paige Ouimet This appendix contains 10 tables reporting estimation results mentioned in the paper but not
Short Selling and Earnings Management: A Controlled Experiment
 Short Selling and Earnings Management: A Controlled Experiment Vivian Fang, University of Minnesota Allen Huang, Hong Kong University of Science and Technology Jonathan Karpoff, University of Washington
Online Appendix What Does Health Reform Mean for the Healthcare Industry? Evidence from the Massachusetts Special Senate Election.
 Online Appendix What Does Health Reform Mean for the Healthcare Industry? Evidence from the Massachusetts Special Senate Election. BY MOHAMAD M. AL-ISSISS AND NOLAN H. MILLER Appendix A: Extended Event
EVA and Valuation EVA Financial Management, 2018 Konan Chan Evidence on EVA (BBW, 1999) Evidence on EVA
 Evidence on EVA") EVA and Valuation EVA Financial Management, 2018 Konan Chan Does EVA better explain stock returns? Does EVA better motivate managers? Does EVA lead to a better performance? Evidence on EVA Regress stock
EVA and Valuation EVA Financial Management, 2018 Konan Chan Does EVA better explain stock returns? Does EVA better motivate managers? Does EVA lead to a better performance? Evidence on EVA Regress stock
Chapter 9 Valuing Stocks
 Chapter 9 Valuing Stocks Copyright 2011 Pearson Prentice Hall. All rights reserved. Chapter Outline 9.1 The Dividend Discount Model 9.2 Applying the Dividend Discount Model 9.3 Total Payout and Free Cash
Caught on Tape: Institutional Trading, Stock Returns, and Earnings Announcements
 Caught on Tape: Institutional Trading, Stock Returns, and Earnings Announcements The Harvard community has made this article openly available. Please share how this access benefits you. Your story matters.
Online Appendix Results using Quarterly Earnings and Long-Term Growth Forecasts
 Online Appendix Results using Quarterly Earnings and Long-Term Growth Forecasts We replicate Tables 1-4 of the paper relating quarterly earnings forecasts (QEFs) and long-term growth forecasts (LTGFs)
Earnings Management: Do Firms Play Follow the Leader?
 Earnings Management: Do Firms Play Follow the Leader? Brian Bratten Von Allmen School of Accountancy Gatton College of Business and Economics University of Kentucky Jeff L. Payne Von Allmen School of Accountancy
Do Investors Fully Understand the Implications of the Persistence of Revenue and Expense Surprises for Future Prices?
 Do Investors Fully Understand the Implications of the Persistence of Revenue and Expense Surprises for Future Prices? Narasimhan Jegadeesh Dean s Distinguished Professor Goizueta Business School Emory
Fiscal 2019 First Quarter Results. October 30, 2018
 Fiscal 2019 First Quarter Results October 30, 2018 Safe Harbor This presentation contains forward-looking statements within the meaning of Section 27A of the Securities Act of 1933, as amended, and Section
Differential Cash versus Accrual Persistence and Performance Target Setting
 Differential Cash versus Accrual Persistence and Performance Target Setting Laura Li liyue@illinois.edu Shuyang Wang swang162@illinois.edu Wei Zhu zhuwei@illinois.edu May 2017 Abstract We examine the extent
Transparency and the Response of Interest Rates to the Publication of Macroeconomic Data
 Transparency and the Response of Interest Rates to the Publication of Macroeconomic Data Nicolas Parent, Financial Markets Department It is now widely recognized that greater transparency facilitates the
1. Logit and Linear Probability Models
 INTERNET APPENDIX 1. Logit and Linear Probability Models Table 1 Leverage and the Likelihood of a Union Strike (Logit Models) This table presents estimation results of logit models of union strikes during
Accruals Management to Achieve Earnings Benchmarks: A Comparison of Pre-managed Profit and Loss Firms
 Journal of Business Finance & Accounting, 33(5) & (6), 653 670, June/July 2006, 0306-686X doi: 10.1111/j.1468-5957.2006.00017.x Accruals Management to Achieve Earnings Benchmarks: A Comparison of Pre-managed
The Impact of Analysts Forecast Errors and Forecast Revisions on Stock Prices
 The Impact of Analysts Forecast Errors and Forecast Revisions on Stock Prices William Beaver, 1 Bradford Cornell, 2 Wayne R. Landsman, 3 and Stephen R. Stubben 3 April 2007 1. Graduate School of Business,
The Journal of Applied Business Research Fourth Quarter 2007 Volume 23, Number 4 SYNOPSIS
 The Incremental Usefulness Of Income Tax Allocations In Predicting One-Year-Ahead Future Cash Flows Benjamin P. Foster, (E-mail: ben.foster@louisville.edu), University of Louisville Terry J. Ward, (E-mail:
Appendix A. Mathematical Appendix
 Appendix A. Mathematical Appendix Denote by Λ t the Lagrange multiplier attached to the capital accumulation equation. The optimal policy is characterized by the first order conditions: (1 α)a t K t α
Fiscal 2018 Fourth Quarter Results. July 26, 2018
 Fiscal 2018 Fourth Quarter Results July 26, 2018 Safe Harbor This presentation contains forward-looking statements within the meaning of Section 27A of the Securities Act of 1933, as amended, and Section
The predictive power of investment and accruals
 The predictive power of investment and accruals Jonathan Lewellen Dartmouth College and NBER jon.lewellen@dartmouth.edu Robert J. Resutek Dartmouth College robert.j.resutek@dartmouth.edu This version:
Internet Appendix for Corporate Cash Shortfalls and Financing Decisions. Rongbing Huang and Jay R. Ritter. August 31, 2017
 Internet Appendix for Corporate Cash Shortfalls and Financing Decisions Rongbing Huang and Jay R. Ritter August 31, 2017 Our Figure 1 finds that firms that have a larger are more likely to run out of cash
Discussion Reactions to Dividend Changes Conditional on Earnings Quality
 Discussion Reactions to Dividend Changes Conditional on Earnings Quality DORON NISSIM* Corporate disclosures are an important source of information for investors. Many studies have documented strong price
Audit Opinion Prediction Before and After the Dodd-Frank Act
 Audit Prediction Before and After the Dodd-Frank Act Xiaoyan Cheng, Wikil Kwak, Kevin Kwak University of Nebraska at Omaha 6708 Pine Street, Mammel Hall 228AA Omaha, NE 68182-0048 Abstract Our paper examines
Fundamental Analysis, B7021, Spring 2016
 Fundamental Analysis, B7021, Spring 2016 Course Syllabus This draft: October 21, 2015 I. CONTACT DETAILS Prof. Doron Nissim Email: dn75@columbia.edu Office hours (604 Uris): by appointment II. COURSE DESCRIPTION
Discontinued Operations: Earnings Management, Value Relevance, and the Role of ASU
 Discontinued Operations: Earnings Management, Value Relevance, and the Role of ASU 2014-08 Yuan Ji The Hong Kong Polytechnic University yuan.af.ji@polyu.edu.hk James Potepa The George Washington University
A Study of the Relationship between Free Cash Flow and Debt
 A Study of the Relationship between Free Cash Flow and Debt Peyman Imanzadeh 1, Rademan Malihi Shoja 2, Akbar Poursaleh 3 1. Talesh branch, Islamic Azad University, Talesh, Iran 2. MSc Student in Accounting,
Sustainable Free Cash Flow Analysis: A Better Measure for Resource Equities
 Sustainable Free Cash Flow Analysis: A Better Measure for Resource Equities Authors: Benoit Gervais, MSc., CFA Senior Vice President, Portfolio Manager Mackenzie Resource Team Onno Rutten, MSc., MBA Vice
ACCRUALS MANAGEMENT, INVESTOR SOPHISTICATION, AND EQUITY VALUATION: EVIDENCE FROM 10-Q FILINGS
 ACCRUALS MANAGEMENT, INVESTOR SOPHISTICATION, AND EQUITY VALUATION: EVIDENCE FROM 10-Q FILINGS Steven Balsam Fox School of Business and Management Temple University Philadelphia, PA 19122 Eli Bartov and
Finance and Accounting for Interviews
 This document was developed and written by Ian Lee. All information is meant for public use and purposed for the free transfer of knowledge to interested parties. Send questions and comments to ianlee@uclalumni.net
Leveraging Minimum Variance to Enhance Portfolio Returns Ruben Falk, Capital IQ Quantitative Research December 2010
 Leveraging Minimum Variance to Enhance Portfolio Returns Ruben Falk, Capital IQ Quantitative Research December 2010 1 Agenda Quick overview of the tools employed in constructing the Minimum Variance (MinVar)
Zacks Earning Trends
 October 8, 2015 Zacks Earning Trends Sheraz Mian SMian@Zacks.com Earnings Weakness Isn t Just Energy Driven The ramp up of the Q3 earnings season in the coming days will put the spotlight on the weak state
BIS working paper No. 271 February 2009 joint with M. Loretan, J. Gyntelberg and E. Chan of the BIS
 2 Private information, stock markets, and exchange rates BIS working paper No. 271 February 2009 joint with M. Loretan, J. Gyntelberg and E. Chan of the BIS Tientip Subhanij 24 April 2009 Bank of Thailand
MIT Sloan School of Management
 MIT Sloan School of Management Working Paper 4262-02 September 2002 Reporting Conservatism, Loss Reversals, and Earnings-based Valuation Peter R. Joos, George A. Plesko 2002 by Peter R. Joos, George A.
DETERMINING THE EFFECT OF POST-EARNINGS-ANNOUNCEMENT DRIFT ON VARYING DEGREES OF EARNINGS SURPRISE MAGNITUDE TOM SCHNEIDER ( ) Abstract
 Abstract") DETERMINING THE EFFECT OF POST-EARNINGS-ANNOUNCEMENT DRIFT ON VARYING DEGREES OF EARNINGS SURPRISE MAGNITUDE TOM SCHNEIDER (20157803) Abstract In this paper I explore signal detection theory (SDT) as an
DETERMINING THE EFFECT OF POST-EARNINGS-ANNOUNCEMENT DRIFT ON VARYING DEGREES OF EARNINGS SURPRISE MAGNITUDE TOM SCHNEIDER (20157803) Abstract In this paper I explore signal detection theory (SDT) as an
Zacks Earning Trends
 September 23, 2015 Zacks Earning Trends Sheraz Mian SMian@Zacks.com Are We in an Earnings Recession? We are still more than a week away from the end of the September quarter, but the 2015 Q3 earnings season
Appendices For Online Publication
 Appendices For Online Publication This Online Appendix contains supplementary material referenced in the main text of Credit- Market Sentiment and the Business Cycle, by D. López-Salido, J. C. Stein, and
Q Earnings Call. April 24, 2013
 Q2 2013 Earnings Call April 24, 2013 Forward-Looking Statements and Non-GAAP Measures Forward-Looking Statements -- This presentation contains certain forward-looking statements within the meaning of the
Cash Flow, Earning Opacity and its Impact on Stock Price Crash Risk in Tehran Stock Exchange
 Vol. 3, No. 4, October 2013, pp. 138 145 E-ISSN: 2225-8329, P-ISSN: 2308-0337 2013 HRMARS www.hrmars.com Cash Flow, Earning Opacity and its Impact on Stock Price Crash Risk in Tehran Stock Exchange Hossein
Executive Influence Over Tax Expense: The Interactive Role of Incentives and Opportunities
 Executive Influence Over Tax Expense: The Interactive Role of Incentives and Opportunities Erik L. Beardsley* University of Notre Dame Erik.L.Beardsley.1@nd.edu Mehmet C. Kara Texas A&M University mkara@mays.tamu.edu
***************************** SAMPLE PAGES FROM TUTORIAL GUIDE *****************************
 DCF Modeling Copyright 2008 by Wall Street Prep, Inc. Table of contents SECTION 1: OVERVIEW DCF in theory and in practice Unlevered vs. levered DCF SECTION 2: MODELING THE DCF Modeling unlevered free cash
XYLEM INC. Q EARNINGS RELEASE FEBRUARY 1, 2018
 XYLEM INC. Q4 2017 EARNINGS RELEASE FEBRUARY 1, 2018 Q4 2017 EARNINGS RELEASE FORWARD-LOOKING STATEMENTS This presentation contains information that may constitute forward-looking statements. Forward-looking
Finance Recruiting Interview Preparation
 Finance Recruiting Interview Preparation Discounted Cash Flows Session #3 This presentation is for informational purposes only, and is not an offer to buy or sell or a solicitation to buy or sell any securities,
Lessons from Hedge Fund Registration. Stephen Brown, William Goetzmann, Bing Liang, Christopher Schwarz
 Lessons from Hedge Fund Registration Stephen Brown, William Goetzmann, Bing Liang, Christopher Schwarz Motivation Operational Risk Not Market Risk SEC registration: file a Form ADV by February 1 st, 2006.
Cumulative Abnormal Returns
 Cumulative Abnormal Returns 0.800000 DAY - 20 T0 +186 0.600000 CUMULATIVE ABNORMAL RETURNS 0.400000 0.200000 0.000000-0.200000-0.400000-0.600000-0.800000 3 5 13 16 7 15 17 23 12-20 -10 0 10 20 30 40 50
This document consists of three sections: Section IA.1 examines the sensitivity of our
 Internet Appendix for Determinants and Consequences of Information Processing Delay: Evidence from Thomson Reuters Institutional Brokers Estimate System This document consists of three sections: Section
THE OPTION MARKET S ANTICIPATION OF INFORMATION CONTENT IN EARNINGS ANNOUNCEMENTS
 THE OPTION MARKET S ANTICIPATION OF INFORMATION CONTENT IN EARNINGS ANNOUNCEMENTS - New York University Robert Jennings - Indiana University October 23, 2010 Research question How does information content
FOREIGN EXCHANGE EFFECTS AND SHARE PRICES
 FOREIGN EXCHANGE EFFECTS AND SHARE PRICES Arnold L. Redman, College of Business and Global Affairs, The University of Tennessee at Martin, Martin, TN 38238, aredman@utm.edu Nell S. Gullett, College of
The Characteristics of Bidding Firms and the Likelihood of Cross-border Acquisitions
 The Characteristics of Bidding Firms and the Likelihood of Cross-border Acquisitions Han Donker, Ph.D., University of orthern British Columbia, Canada Saif Zahir, Ph.D., University of orthern British Columbia,
Investor Reaction to the Stock Gifts of Controlling Shareholders
 Investor Reaction to the Stock Gifts of Controlling Shareholders Su Jeong Lee College of Business Administration, Inha University #100 Inha-ro, Nam-gu, Incheon 212212, Korea Tel: 82-32-860-7738 E-mail:
FIRM SIZE AND THE GAINS FROM ACQUISITIONS. Sara B. Moeller, Frederik P. Schlingemann, Rene M. Stulz. Journal of Financial Economics 73 (2004)
") FIRM SIZE AND THE GAINS FROM ACQUISITIONS Sara B. Moeller, Frederik P. Schlingemann, Rene M. Stulz Journal of Financial Economics 73 (2004) 201 228 Presenter: Anh Tran 1. Introduction What is the size
FIRM SIZE AND THE GAINS FROM ACQUISITIONS Sara B. Moeller, Frederik P. Schlingemann, Rene M. Stulz Journal of Financial Economics 73 (2004) 201 228 Presenter: Anh Tran 1. Introduction What is the size
Why Do Non-Financial Firms Select One Type of Derivatives Over Others?
 Why Do Non-Financial Firms Select One Type of Derivatives Over Others? Hong V. Nguyen University of Scranton The increase in derivatives use over the past three decades has stimulated both theoretical
August 8, Conduent Q Earnings Results
 August 8, 2018 Conduent Q2 2018 Earnings Results Cautionary Statements Forward-Looking Statements This report contains forward-looking statements, as defined in the Private Securities Litigation Reform
FOREIGN FUND FLOWS AND STOCK RETURNS: EVIDENCE FROM INDIA
 FOREIGN FUND FLOWS AND STOCK RETURNS: EVIDENCE FROM INDIA Viral V. Acharya (NYU-Stern, CEPR and NBER) V. Ravi Anshuman (IIM Bangalore) K. Kiran Kumar (IIM Indore) 5 th IGC-ISI India Development Policy
Behavioral Finance 1-1. Chapter 4 Challenges to Market Efficiency
 Behavioral Finance 1-1 Chapter 4 Challenges to Market Efficiency 1 Introduction 1-2 Early tests of market efficiency were largely positive However, more recent empirical evidence has uncovered a series
Effect of Earnings Growth Strategy on Earnings Response Coefficient and Earnings Sustainability
 European Online Journal of Natural and Social Sciences 2015; www.european-science.com Vol.4, No.1 Special Issue on New Dimensions in Economics, Accounting and Management ISSN 1805-3602 Effect of Earnings
A Portrait of Hedge Fund Investors: Flows, Performance and Smart Money
 A Portrait of Hedge Fund Investors: Flows, Performance and Smart Money Guillermo Baquero and Marno Verbeek RSM Erasmus University Rotterdam, The Netherlands mverbeek@rsm.nl www.surf.to/marno.verbeek FRB
Non-GAAP Financial Measures Free Cash Flow ( FCF )
") Non-GAAP Financial Measures Free Cash Flow ( FCF ) Our measure of FCF meets the definition of a non-gaap financial measure. FCF is used in addition to and in conjunction with results presented in accordance
Non-GAAP Financial Measures Free Cash Flow ( FCF ) Our measure of FCF meets the definition of a non-gaap financial measure. FCF is used in addition to and in conjunction with results presented in accordance
The Golub Capital Altman Index
 The Golub Capital Altman Index Edward I. Altman Max L. Heine Professor of Finance at the NYU Stern School of Business and a consultant for Golub Capital on this project Robert Benhenni Executive Officer
2019 Proxy Statement Supplemental Information
 2019 Proxy Statement Supplemental Information March 18, 2019 Imagination at work. Non-GAAP Financial Measures Used in 2019 Proxy Statement 2 Non-GAAP financial measures The table below lists the non-gaap
2011 Senior Management Compensation Survey
 2011 Senior Management Compensation Survey www.rccf.com 221 East 4 th Street, Suite 2400, Cincinnati, Ohio 45202 (513) 621-9700 Attached are the results of the 2011 River Cities Capital Funds Senior Management
On the Investment Sensitivity of Debt under Uncertainty
 On the Investment Sensitivity of Debt under Uncertainty Christopher F Baum Department of Economics, Boston College and DIW Berlin Mustafa Caglayan Department of Economics, University of Sheffield Oleksandr
Can the Source of Cash Accumulation Alter the Agency Problem of Excess Cash Holdings? Evidence from Mergers and Acquisitions ABSTRACT
 Can the Source of Cash Accumulation Alter the Agency Problem of Excess Cash Holdings? Evidence from Mergers and Acquisitions ABSTRACT This study argues that the source of cash accumulation can distinguish
The Effect of Sarbanes-Oxley on Earnings Management Behavior
 Journal of Accounting, Finance and Economics Vol. 3. No. 1. July 2013. Pp. 1 21 The Effect of Sarbanes-Oxley on Earnings Management Behavior George R. Wilson* This paper investigates the impact of Sarbanes-Oxley
THREE ESSAYS ON FINANCIAL ANALYSTS
 THREE ESSAYS ON FINANCIAL ANALYSTS By Dong Hyun Son A dissertation submitted to the Graduate School-Newark Rutgers, the State University of New Jersey in partial fulfillment of requirements for the degree
RESEARCH REPOSITORY. Authors Version
 RESEARCH REPOSITORY Authors Version Gasbarro, D., Monroe, G.S., Schwebach, R.G. and Teh, S.T. (2013) Comparative Value-relevance of GAAP, IBES, S&P Core, Cash Earnings and Cash Flows. In: Accounting and
Note on Cost of Capital
 DUKE UNIVERSITY, FUQUA SCHOOL OF BUSINESS ACCOUNTG 512F: FUNDAMENTALS OF FINANCIAL ANALYSIS Note on Cost of Capital For the course, you should concentrate on the CAPM and the weighted average cost of capital.
2013 Senior Management Compensation Survey
 2013 Senior Management Compensation Survey Attached are the results of the 2013 River Cities Capital Funds Senior Management Compensation Survey. Twenty-four private-growth companies from the IT and healthcare
The Effect of Earnings Management and Earnings Persistence on Earnings Response Coefficient: Evidence from Indonesia
 The Effect of Earnings Management and Earnings Persistence on Earnings Response Coefficient: Evidence from Indonesia Suwarno Universitas Muhammadiyah Gresik, Indonesia E-mail: suwarno@umg.ac.id Received: