Ainsworth Game Technology Limited
|
|
|
- Mercy King
- 5 years ago
- Views:
Transcription


1 FY18 Annual Results Announcement Ainsworth Game Technology Limited
2 Disclaimer IMPORTANT NOTICE This presentation has been prepared by Ainsworth Game Technology Limited ACN (AGT) in good faith.no express or implied warranty is given as to the accuracy or completeness of the information in this document or the accompanying presentation. All statutory representations and warranties are excluded, and any liability in negligence is excluded, in both cases to the fullest extent permitted by law. No responsibility is assumed for any reliance by any person on this document or the accompanying presentation. Summary information The information contained in this presentation is a summary overview of the current activities of AGT. This presentation does not purport to be all inclusive or to contain all the information that a prospective investor may require in evaluating a possible investment. This presentation is for general information purposes and is not intended to be and does not constitute a prospectus, product disclosure statement, pathfinder document or other disclosure document for the purposes of the Corporations Act and has not been, and is not required to be, lodged with the Australian Securities & Investments Commission. This presentation should be read in conjunction with all other periodic and continuous disclosure announcements lodged by AGT with the Australian Securities Exchange, available at Not financial product advice The material contained in this presentation is not, and should not be considered as, financial product or investment advice. This presentation is not an offer, invitation or recommendation to acquire New Shares, and does not take into account the investment objectives, financial situation or particular needs of any particular investor. You must make your own independent assessment and review of AGT, and the information contained, or referred to, in this presentation, including its financial condition, assets and liabilities, financial position, profits and losses, prospects and business affairs, including the merits and risks involved. Nothing in this presentation constitutes investment, legal, tax or other advice. You should seek legal, financial, tax and other advice appropriate for your jurisdiction. Past and future performance This presentation contains information as to past performance of AGT. Such information is given for illustrative purposes only, and is not and should not be relied upon as an indication of future performance of AGT. The historical information in this presentation is, or is based upon, information contained in previous announcements made by AGT to the market. These announcements are available at This presentation contains certain forward looking statements. Forward looking words such as expect, should, could, may, will, believe, forecast, estimate and other similar expressions are intended to identify forward-looking statements. Such statements are subject to various known and unknown risks, uncertainties and other factors that are in some cases beyond AGT's control. These risks, uncertainties and factors may cause actual results, performance or achievements to differ materially from those expressed or implied by the forward-looking statements and from past results, performance or achievements. AGT cannot give any assurance or guarantee that the assumptions upon which management based its forward-looking statements will prove to be correct or exhaustive beyond the date of its making, or that AGT's business and operations will not be affected by other factors not currently foreseeable by management or beyond its control. Such forward-looking statements only speak as at the date of this announcement and AGT assumes no obligation to update such information. 2

3 Strategy to expand international footprint and higher quality earnings delivering results 3
4 1. Results Highlights 2. Consolidated Results 3. Segment Results - Americas 4. Segment Results - Australia 5. Segment Results - Rest of the World 6. Gaming Products 7. Regulatory Update 8. Online 9. Outlook 4 4
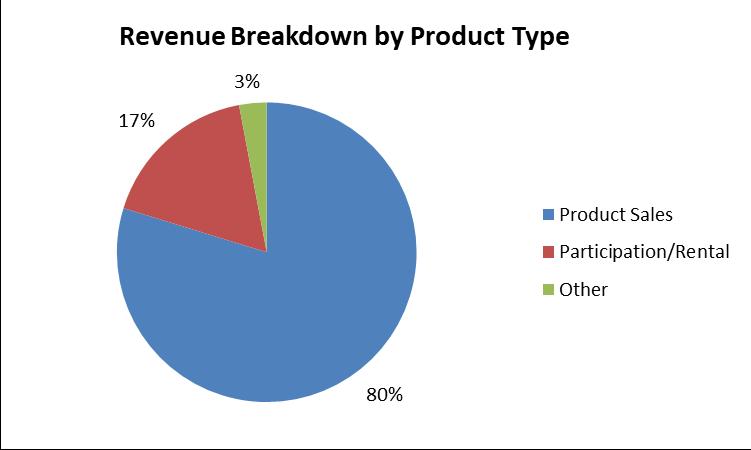
5 Key Highlights FY18 Results: Profit before tax (excluding currency impacts) is $39.2m delivered on guidance Total sales revenue of $265.6m, decrease of 6% on pcp EPS of 9.0 cents (PCP: 12.0 cents) Final dividend declared cents per share fully franked Continued growth in International footprint: International revenue $202m, -3%, 76% of total North America revenues +4%, profit -9% and Latin America revenues similar to pcp with less than 1% increase, profit -19% Historical Horse Racing products sold to Churchill Downs Inc during the year is a result of leveraging the previously acquired Nova Technologies game design expertise Encouraging early signs of improving share in Australia: Australia revenues -14%, profit -19% New product launches boosted June NSW market share to 15%, more than twice the average share for the year Further improvement in quality of earnings: 5,852 units on participation, 10% increase on FY17 as a result of increased placement in Latin America Strong cash flow with intention to commence debt repayment in FY19: Closing cash balance $35.7m, up by $14.6m on pcp FY19 Outlook: Reclaiming market share through product performance 5
6 1. Results Highlights 2. Consolidated Results 3. Segment Results - Americas 4. Segment Results - Australia 5. Segment Results - Rest of the World 6. Gaming Products 7. Regulatory Update 8. Online 9. Novomatic Update 10. Outlook 6
7 Profit & Loss Summary Profit before tax (excluding currency impacts) is $39.2m Included in results is a gain on sale of land of $2.5m pre tax profit and $5.2m of non-recurring costs including $2.7m loss on impairment of receivables and $2.5m impairment on 616 Digital LLC investment Slight decrease in international sales (-3% v pcp) -14% decline in domestic revenue compared to FY17 Gross Profit decreased by 8% due to the decrease in number of units sold and the full release of the A600 cabinet range in FY18 which has a higher componentry cost compared to legacy cabinets Pre tax contributions from currency gain in FY18, $3.1m v currency loss of $10.5m in FY17 Total dividend of 4.0c per share totalling $13.3m for FY18 A$m 30-Jun Jun-2017 Change (%) Domestic revenue (14%) International revenue (3%) Total revenue (6%) Gross profit (8%) EBITDA (3%) PBT (10%) Income tax expense (10.4) (9.0) (16%) NPAT (16%) R&D (% of revenue) 13% 12% 1% EPS (diluted) (A$) (25%) DPS (A$) % 7
8 A$m Results Adjusted for Currency (Gain) / Loss 30-Jun Jun-2017 Change (%) PBT (10%) Currency (gain) / loss (before tax) (3.1) 10.5 (130%) Adjusted PBT (32%) NPAT (16%) Currency (gain) / loss (after tax) (1) (2.6) 9.7 (127%) Adjusted NPAT (38%) (1) No tax effect on $1.5m currency gain in FY18 (FY17: $7.5m currency loss) Calculation of currency (gain)/ loss after tax: FY18: ($1.5m + ($1.6m x 0.7) = $2.6m gain), FY17 ($7.5m + ($3m x 0.7) = $9.7m loss). These currency (gain)/ loss relate to balance sheet translation originated from investment in the Americas. 8
9 Reconciliation Profit before Tax to EBITDA A$m 30-Jun Jun-2017 Change % Reconciliation: Profit before tax (10%) Net interest (2.3) (2.4) 4% Depreciation and amortisation % Reported EBITDA (3%) Foreign currency (gain) / loss (3.1) 10.5 (130%) Impairment losses (Receivables) (18%) Impairment losses (616 Digital LLC) % Gain on sale of land (2.5) - (100%) Underlying EBITDA (20%) Impairment losses on receivables $2.7m predominately relates to the write down of two long outstanding receivables from distributors in North America ($0.9m) and Asia ($0.9m). These receivables are behind from previously negotiated payment plans. Impairment losses on 616 Digital LLC $2.5m 616 s earnings growth has been adversely affected by the ongoing maturation of the North American and Australian social gaming market and an increase in player acquisition and retention costs. These market conditions have been to the disadvantage of smaller operations like 616 in favour of larger scale competitors, and are reflected in lower than anticipated year on year revenue and EBITDA growth, requiring a write down in the carrying value of AGT s 40% interest in 616 by $2.5m. 9
10 A$m Operating Costs 30-Jun Jun-2017 Change % Sales, service and marketing ('SSM') % R&D % Administration (11%) Total Operating costs % 4% increase in total costs with resources reallocated to revenue growth and customer support: Increase in SSM expenses primarily due to: - Additional depreciation expense due to increase in machines placed under participation and lease - Establishment of engineers to support server based products in Washington, Kentucky and Class II - Increased selling and marketing costs in the Americas - Acceleration of depreciation in older style cabinets Decrease in Administration expenses is primarily due to: - $2.5m reversal of previously recognised 2015 Performance Rights share-based payment expense amortisation 10
11 Staff Headcount Australia and Rest of the World # Staff FY18 FY17 Sales Service Production Administration R&D Total Staff Numbers - Australia & Rest of the World Americas # Staff FY18 FY17 Sales Service Production Administration R&D Total Staff Numbers - North and Latin America FY18 FY17 Total Staff Numbers Consolidated AGT The increase in total staff numbers is a result of additional investments in Game Design, Technology, Production, Sales and Customer support to drive future revenue. 11
12 Net Profit Bridge (1) No tax effect on $1.5m currency gain in FY18 (FY17: $7.5m currency loss) Calculation of currency (gain)/ loss after tax: FY18: ($1.5m + ($1.6m x 0.7) = $2.6m gain), FY17 ($7.5m + ($3m x 0.7) = $9.7m loss). These currency (gain)/ loss relate to balance sheet translation originated from investment in the Americas. $21.1m decrease in machine sales due to decrease in number of units sold in FY18 $4.7m increase in participation and lease due to Pacman TM placement and increased install base in Latin America $13.6m increase in forex represents a foreign currency gain of $3.1m (versus a currency loss pcp of $10.5m) $29.3m currency adjusted PAT in FY18 (versus $47.6m pcp). Excludes $2.6m after tax currency gain (versus $9.7m currency loss pcp) (1) 12

13 Ainsworth at a Glance 13
14 Balance Sheet Strong balance sheet to self fund growth strategies A$90m multi-option facility arrangement extended to 30 September 2021 Receivables totalled to $192.8m (FY17: $168.5m). Cash collection expected in H1FY19 should reduce receivables Net debt of ($36.2m) improved as a result of higher cash balance at June 18 (at June 17 net debt was ($44.6m)). Expect to commence debt reduction strategy supported by continuous strong cash flow Expect cash payment of CDI 900 machine order on opening of Derby City Gaming facility - September 2018 A$m 30-Jun Jun-17 Cash Receivables Other Current Assets Total Current Assets Non-Current Receivables Deferred Tax Assets Other Non-Current Assets Total Non-Current Assets Payables Loans and borrowings Current Tax Liability Other Current Liabilities Total Current Liabilities Loans and borrowings Employee Benefits Deferred Tax Liabilities Total Non-Current Liabilities Share Capital Other Equity Total Equity
15 Balance Sheet Ratios Financial covenants ratios FY18 Interest cover ratio - (EBITDA/Interest Expense) Gearing Ratio - (Debt)/(Debt + Equity) 15.92% Leverage Ratio - (Debt/EBITDA) 1.05 Debt ratios 30/06/ /06/2017 Debt ratio (Total Liabilities/Total Assets) 25.19% 25.84% Debt to Equity ratio (Total Liabilities/Total Equity) 33.67% 34.85% Cash Flow to Debt ratio (Cash Flow from Operations/Total Liabilities) 14.40% 3.63% 15
16 Cashflow Statement Net cash from operating activities is $18.4m, resulting from improved working capital management Increase in net cash from financing activities due to additional USD2.5m drawdown Included in acquisitions of PPE is the purchase of land in Las Vegas amounting to A$4.1m Strong closing cash balance of $35.7m, an increase of $14.6m A$m 30-Jun Jun-2017 Change Net cash from operating activities Interest received Proceeds from sale of PPE (1.7) Acquisitions of PPE (8.3) (5.4) (2.9) Development expenditure (5.6) (4.5) (1.1) Net cash (used in) / from investing activities (5.4) 0.1 (5.5) Proceeds from borrowings Proceeds from finance leases Payment of finance lease liabilities (0.2) (0.1) (0.1) Dividend paid (2.2) (9.9) 7.7 Net cash from / (used in) financing activities 1.0 (9.9) 10.9 Net increase / (decrease) in cash and cash equivalents 14.0 (4.6) 18.6 Cash and cash equivalents at 1 July (5.2) Effect of exchange rate fluctuations on cash held 0.6 (0.7) 1.3 Cash and cash equivalents at 30 June
17 1. Results Highlights 2. Consolidated Results 3. Segment Results - Americas 4. Segment Results - Australia 5. Segment Results - Rest of the World 6. Gaming Products 7. Regulatory Update 8. Online 9. Outlook 17
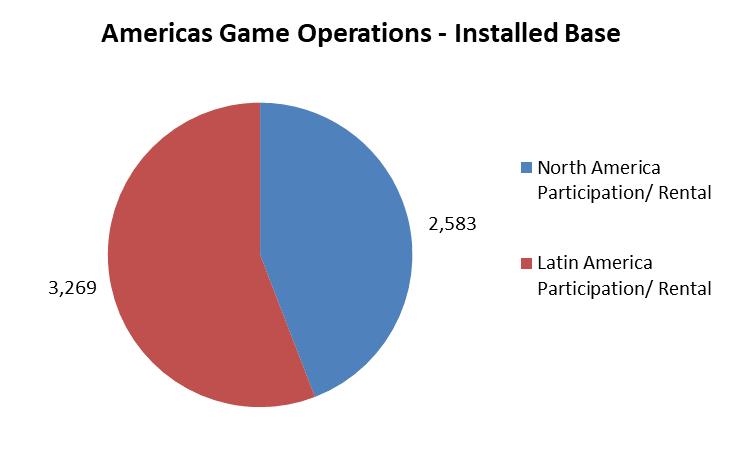
18 Segment Results North America North America consolidating market position: Slight revenue growth driven by strong ASP and increased win per day on route 900 Historical Horse Racing units delivered to Churchill Downs (CDI), leveraged off Nova Technologies game design expertise Included in Segment profit is $2.5m gain from sale of land and a one-off impairment loss of $0.9m relating to a North America distributor Maintained Gaming Operations install base while increasing win per day Strong win per day driven by PacMan TM placements Sale of initial units for Washington State Electronic Scratch Ticket System A$m North America 30-Jun-2018 *Excludes distributor sales, reworks and on-charges 30-Jun-2017 Change (%) Revenue % Segment Profit (9%) Segment Profit (%) 39% 44% (5%) Unit Volume (no.) 3,021 3,105 (3%) ASP (US$ 000 s) * % Game Operations Installed Base 2,583 2,669 (3%) Ave per Day (US$) % 18

19 Continued Development of Top Performing Brands in North America Top Performing Brands All brands listed are performing at an average index of 1.0x to 3.1x of house average based on sample data obtained from customers 19
20 Segment Results Latin America Latin America: Solid growth in gaming operations installing 1,600 new units. Converted to sale 900 existing units for a net install base increase of 23% Increase in the number of used machine sales to meet market demand for lower price point resulted in lower ASP Mexico remains an important market with significant market share increases and strong results Strong 2H result, 15% growth on 1H with new game titles and broader product offering Strong product performance in core Multi Games, Quad Shot TM series, Oriental Fortune TM and Pac Man TM A$m *Excludes distributor sales, reworks and on-charges Latin America 30-Jun Jun-2017 Change (%) Revenue Segment Profit (19%) Segment Profit (%) 39% 48% (9%) Unit Volume (no.) 3,322 3,188 4% ASP (US$ 000 s) * (3%) Game Operations Installed Base 3,269 2,648 23% Ave per Day (US$) (6%) 20

21 Continued Development of Top Performing Brands in Latin America Top Performing Brands All brands listed are performing at an average index of 1.5x to 3.4x and above of house average based on sample data obtained from customers 21
22 1. Results Highlights 2. Consolidated Results 3. Segment Results - Americas 4. Segment Results - Australia 5. Segment Results - Rest of the World 6. Gaming Products 7. Regulatory Update 8. Online 9. Outlook 22
23 Segment Results - Australia Successful launch of EVO cabinet and Golden Cash TM game series driving improvement in market share. NSW share increased to 15% in June, more than twice the average share for the year Decrease in revenue of 14% on pcp, due to lower sales made Despite challenging period for volume and revenue growth, ASP has increased Machines under service in NSW is 14,301 Continuous recovery in market share in FY19 is expected to be driven by the initial positive response of Golden Cash TM game series and further new game portfolio offerings A$m 30-Jun Jun-2017 Change (%) Revenue (14%) Segment Profit (19%) Segment Profit (%) 30% 32% (2%) Unit Volume (no.) 2,156 2,607 (17%) ASP (ex rebuilds) ($A 000 s) % Service Revenue % 23
24 1. Results Highlights 2. Consolidated Results 3. Segment Results - Americas 4. Segment Results - Australia 5. Segment Results - Rest of the World 6. Gaming Products 7. Regulatory Update 8. Online 9. Outlook 24
25 Segment Results Rest of the World Revenue drop due to lower Asia, NZ and Europe sales compared to pcp Online contributed $4.1m in revenue, +15% on pcp Included in the segment profit is a one-off impairment loss recognised for an Asian trade receivable of $0.9m A$m *Units Volume include Kits to Europe (Novomatic) 30-Jun Jun-2017 Change (%) Revenue (37%) Segment Profit (31%) Segment Profit (%) 59% 53% 6% Unit Volume (no.)* 1,215 1,807 (33%) Delivered 1,000 units to Novomatic in FY18. Novomatic contributed revenue of $6.8m in FY18 ($11.4m pcp) and profit of $4.4m ($5.5m pcp) 25
26 1. Results Highlights 2. Consolidated Results 3. Segment Results - Americas 4. Segment Results - Australia 5. Segment Results - Rest of the World 6. Gaming Products 7. Regulatory Update 8. Online 9. Outlook 26


27 Gaming Products FY18 Key Highlights Launch of 70 new game titles into key class II and class III markets Continued global rollout of the EVO cabinet Enhanced core product offerings through a diversified range of game mechanics 27
28 Server Based Gaming Products Highlights Delivered Electronic Scratch Ticket System in Washington State Completed Four Winds Casino install which included 270 units Historical Horse racing system for Churchill Down was approved, which included 900 units and over 60 games Delivered 60 approved games across our Class II server based business 28
29 Global Gaming Products for FY19 Continue executing on our global game strategy to: Launch eight major proprietary brands with a balanced diversified portfolio Schedule rollout of 75 new proprietary titles across the EVO and A640 cabinets Rollout of 45 new and ported titles to Class II markets Engagement of 2 external game development studios to increase diversity, which will accelerate new game titles capacity Continued build-up of internal studio capacity and quality to enable increased productivity 29
30 1. Results Highlights 2. Consolidated Results 3. Segment Results - Americas 4. Segment Results - Australia 5. Segment Results - Rest of the World 6. Gaming Products 7. Regulatory Update 8. Online 9. Outlook 30
31 Regulatory Update Continuing strategy to deliver new jurisdictions based on detailed market assessment of commercial opportunities From 1 July 2017 to current, the AGT group has secured new tribal gaming licenses in the key commercial markets California, Colorado, North Dakota and Washington. 31
32 1. Results Highlights 2. Consolidated Results 3. Segment Results - Americas 4. Segment Results - Australia 5. Segment Results - Rest of the World 6. Gaming Products 7. Regulatory Update 8. Online 9. Outlook 32


33 Online and Social Real Money Gaming: Focus on expanding our content offerings into the North and Latin American markets with a primary focus on New Jersey and Mexico Announced online agreement with GVC to launch exclusive Ainsworth casino content for the first time in New Jersey at MGM Resorts and Borgata casino Reached agreement with The Logrand Group to introduce Ainsworth games for the first time into Mexico on Strendus.com.mx Expand Ainsworth online content including more than 40 new land-based titles into our existing European partners and operators Social Gaming: Completed development of 40 Ainsworth slot titles for Novomatic s social casino platform for North American land-based casinos Adding newest Ainsworth game titles to our Player s Paradise social casino App 33
34 1. Results Highlights 2. Consolidated Results 3. Segment Results - Americas 4. Segment Results - Australia 5. Segment Results - Rest of the World 6. Gaming Products 7. Regulatory Update 8. Online 9. Outlook 34
35 Outlook Purposeful strategies to regain market share, expand international footprint, invest in game technologies and drive higher quality earnings are expected to result in improvement in financial results Leverage off Nova Technologies system and game design expertise to further release Historical Horse Racing products Machines on participation, generating daily recurring revenues of $29.8m in North America and $16.1m in Latin America Domestic market share, despite competition, expected to continue to recover. June s share of 15% in NSW, more than twice FY18 average Investing in product quality and innovation is the solution to market competition Strong financial position with balance sheet organic deleveraging in FY19. Dividend payments declared during the year as a signal of confidence Although facing intense competition, AGT will continue to invest in new product offering to reclaim market share in Class III & Class II markets, while also pursuing new markets Continue to invest cash flow in product improvements, innovation, sales and marketing while retiring debt and rewarding our shareholders 35
FY17 Annual Results Announcement
 FY17 Annual Results Announcement Ainsworth Game Technology Limited www.agtslots.com.au Disclaimer IMPORTANT NOTICE This presentation has been prepared by Ainsworth Game Technology Limited ACN 068 516 665
1HFY17 Results Announcement
 1HFY17 Results Announcement Ainsworth Game Technology Limited 21 st February, 2017 Danny Gladstone CEO Mark Ludski CFO Disclaimer IMPORTANT NOTICE This presentation has been prepared by Ainsworth Game
Agenda. Welcome Chairman s Address Chief Executive Officer s Address Annual General Meeting
 1 Agenda Welcome Chairman s Address Chief Executive Officer s Address Annual General Meeting 2 Chairman s Address Presentation by Graeme Campbell 3 2017 Financial Highlights FY17 Profit exceed guidance:
Agenda. Welcome Executive Chairman s Address Chief Executive Officer s Overview including proposed Nova acquisition Annual General Meeting
 17 th November 2015 Agenda Welcome Executive Chairman s Address Chief Executive Officer s Overview including proposed Nova acquisition Annual General Meeting 2 Executive Chairman s Address Presentation
The attached Revised FY2018 Results Presentation corrects this error.
 29 November 2018 Company Announcements Office Australian Securities Exchange Limited Exchange Centre 20 Bridge Street Sydney NSW 2000 Aristocrat Leisure Limited Formatting Error Revised FY2018 Results
Aristocrat Leisure Limited Investor Presentation 29 November Results Presentation 12 months to 30 September 2018
 Aristocrat Leisure Limited Investor Presentation 29 November 2018 Results Presentation 12 months to 30 September 2018 Disclaimer This document and any oral presentation accompanying it has been prepared
For personal use only
 Annual General Meeting 2018 CEO Presentation 29 November 2018 ASX: SKF www.skyfii.io Important Notice and Disclaimer 2 This presentation has been prepared by Skyfii Limited (ACN 009 264 699) (Skyfii or
Aristocrat Leisure Limited Investor Presentation 24 May Results Presentation 6 months to 31 March 2018
 Aristocrat Leisure Limited Investor Presentation 24 May 2018 Results Presentation 6 months to 31 March 2018 Disclaimer This document and any oral presentation accompanying it has been prepared in good
FY16 AGM Presentation
 FY16 AGM Presentation TATTS GROUP LIMITED ABN 19 108 686 040 INTRODUCTION Harry Boon Chairman 2 2016 ANNUAL REPORT Tabling of Financial Report, Directors Report and Auditor s Report: Financial Report of
FY Alliance Aviation Services Limited Results Presentation. August 2018
 FY 2018 Alliance Aviation Services Limited Results Presentation August 2018 Key Messages Alliance Aviation Services Limited announces a full year result which includes: $ 26.1m A strong financial performance
FY18 Results Presentation Bravura Solutions Limited. 28 August 2018
 FY18 Results Presentation Bravura Solutions Limited 28 August 2018 Important notice and disclaimer The information contained in this document (including this notice) and discussed at this presentation
Full Year 2017 Results Presentation Bravura Solutions Limited
 Full Year 2017 Results Presentation Bravura Solutions Limited 23 rd August 2017 Important notice and disclaimer The information contained in this document (including this notice) or discussed at this presentation
For personal use only ANNUAL GENERAL MEETING CEO PRESENTATION 21 NOVEMBER 2017
 ANNUAL GENERAL MEETING CEO PRESENTATION 21 NOVEMBER 2017 2 COMPANY OVERVIEW 3 PERFORMANCE UPDATE 7 MARKET OPPORTUNITY 12 OPERATING & FINANCIAL HIGHLIGHTS 15 SUMMARY & OUTLOOK 18 3 COMPANY OVERVIEW Company
Interim FY 2015 results 6 months ended 31 December February 2015
 Interim FY 2015 results 31 December 2014 18 February 2015 Highlights Solid trading result for 1H FY2015; change in accounting policy for acquisition of healthcare practices First half result highlights
FY18 1 ST HALF RESULTS
 26 FEBRUARY 2018 FY18 1 ST HALF RESULTS Chief Executive Officer : Chief Financial Officer : John Croll James Orlando isentia.com AGENDA Overview of H1 FY18 Results Strategic Focus H1 FY18 Financial Performance
HALF-YEAR RESULTS FY15 HALF-YEAR PAGE 1
 HALF-YEAR RESULTS FY15 PAGE 1 HEADLINES Strong profit outcome: NPAT up 14.6% to $139.8 million 12.5% lift in interim dividend (9.0 cents per share) - 93.1% payout Digital sales momentum: Lotteries up 18.4%
Shaver Shop Group Limited 1H FY18 RESULTS INVESTOR PRESENTATION. 23 February 2018
 Shaver Shop Group Limited 1H FY18 RESULTS INVESTOR PRESENTATION 23 February 2018 1 TABLE OF CONTENTS 01 Key business highlights 02 Financial results 03 Key growth drivers 04 Trading update& outlook 05
Tabcorp Holdings Limited 2015/16
 Tabcorp Holdings Limited ABN 66 063 780 709 2015/16 Full Year Results Presentation 4 August 2016 Draft version 15 (01-08-13) FY16 overview Statutory results NPAT $169.7m, down 49.3% EPS 20.4 cents per
26 November Company Announcements Office Australian Securities Exchange Limited Exchange Centre 20 Bridge Street Sydney NSW 2000
 26 November 2013 Company Announcements Office Australian Securities Exchange Limited Exchange Centre 20 Bridge Street Sydney NSW 2000 Aristocrat Leisure Limited 2013 Aristocrat Leisure Limited will make
ANNUAL GENERAL MEETING
 For personal use only ANNUAL GENERAL MEETING 29 OCTOBER 2014 Tatts Group Limited ABN 19 108 686 040 HARRY BOON Chairman THE 2014 FINANCIAL YEAR WAS A LANDMARK YEAR FOR TATTS WITH TWO DEFINING SUCCESSES
1H 19 Investor Presentation February 2019
 1H 19 Investor Presentation February 2019 1 About Raiz Raiz (formerly Acorns) is a mobile first micro-investing platform via mobile phone or web app, which allows customers to invest in a portfolio of
FY19 half year results
 FY19 half year results For the six months ended 31 December 2018 14 February 2019 Gordon Ballantyne Managing Director & Chief Executive Officer Michael Sammells Chief Financial Officer 1 1HFY19 returned
NOT FOR RELEASE OR DISTRIBUTION IN THE UNITED STATES OR TO US PERSONS
 Ainsworth Game Technology Limited Equity Raising 23 April 2012 Important notice and disclaimer IMPORTANT NOTICE This presentation has been prepared by Ainsworth Game Technology Limited ACN 068 516 665
AUB GROUP LTD HALF YEAR RESULTS
 AUB GROUP LTD HALF YEAR RESULTS FOR THE PERIOD ENDED 31 DECEMBER 2017 (1H18) 26 FEBRUARY 2018 Page 1 - AUB Group Ltd 1H18 Results NOTICE SUMMARY INFORMATION This document has been prepared by AUB Group
AINSWORTH GAME TECHNOLOGY ANNUAL REPORT 2018
 AINSWORTH GAME TECHNOLOGY ANNUAL REPORT 2018 Welcome to our 2018 Annual Report Within the global gaming industry, Ainsworth Game Technology has continued to strive towards future visions built upon constant
FY12 Results 22 May 2012
 FY12 Results 22 May 2012 DISCLAIMER --- Important Notice This presentation has been prepared by Thorn Group Limited (Thorn). This presentation is not a financial product or investment advice or recommendation,
Investor & Analyst Presentation
 Investor & Analyst Presentation FY18 H1 Results For the six monthsended 31 December 2017 15 th February 2018 Rebekah O Flaherty-CEO I Jonathan Kenny-CFO Agenda 1 2 3 4 5 6 Overview Strategic Priorities
For personal use only. 30 June 2016 Full Year Results Presentation
 30 June 2016 Full Year Results Presentation 30 August 2016 FY16 Financial Results Highlights Group Revenue A$143.4m Underlying 1 EBITDA A$87.6m Underlying 1 NPAT A$54.4m Operating Cashflow A$48.7m Maiden
Tabcorp Holdings Limited. 2014/15 Full Year Results Presentation 13 August 2015
 Tabcorp Holdings Limited ABN 66 063 780 709 2014/15 Full Year Results Presentation 13 August 2015 Draft version 15 (01-08-13) FY15 overview Statutory NPAT $334.5m, up 157.5%, comprising of: NPAT from continuing
Chief Executive Officer : John Croll Chief Financial Officer : James Orlando
 23 AUGUST 2017 FY17 RESULTS Chief Executive Officer : John Croll Chief Financial Officer : James Orlando isentia.com AGENDA Overview of FY17 Results Strategic Focus FY17 Financial Performance Q&A John
For personal use only
 Click to edit Master text styles IDP Education FY16 Results Presentation Twelve months to 30 June 2016 11 February 2016 Important notice and disclaimer Click Disclaimer to edit Master text styles The material
Investor & Analyst Presentation Ful YearResults 30 June2016 For personal use only 25th August 2016 Rebekah O Flaherty - CEO I Jonathan Kenny - CFO
 Investor & Analyst Presentation Full YearResults 30 June2016 25th August 2016 Rebekah O Flaherty - CEO I Jonathan Kenny - CFO Agenda 1 Overview 2 Strategic Priorities 3 FY16 Financial Results 4 FY17 Outlook
QANTM. Full Year Results Presentation. Leon Allen, Managing Director and CEO Martin Cleaver, Chief Financial Officer. 12 months to 30 June 2017
 Full Year Results Presentation 12 months to 30 June 2017 QANTM 30 AUGUST 2017 Leon Allen, Managing Director and CEO Martin Cleaver, Chief Financial Officer Disclaimer This presentation has been prepared
ASX: DDR FY16 Results Presentation. March 2017
 ASX: DDR FY16 Results Presentation March 2017 Corporate Headlines Capital Structure Share Price (24 Mar 2017) $2.17 Fully paid ordinary shares 160.0m Options 0.0m Market Capitalisation $347.2m Shareholders
AUB GROUP LTD FULL YEAR RESULTS
 AUB GROUP LTD FULL YEAR RESULTS FOR THE PERIOD ENDED 30 JUNE 207 (FY7) 28 TH AUGUST 207 Page - AUB Group Ltd FY7 Results NOTICE SUMMARY INFORMATION This document has been prepared by AUB Group Limited
FUA. For personal use only INVESTOR PRESENTATION. $5b $4b. $3b 7 months $2b 11 months $1b 27 months $100m June 12
 FUA INVESTOR PRESENTATION UBS - Emerging Companies Conference Series: Fintechs 30 May 2017 $5b $4b May 17 5 months 7 months $3b 7 months $2b 11 months $1b 27 months $100m June 12 2 Overview 4 7 13 19 20
FY2017 Result Presentation. 21 August 2017
 FY2017 Result Presentation 21 August 2017 The Hansen journey growing and diversifying by geography, industry, propriety products and customer Early 1990 s Today Revenue by geography Industry verticals
For personal use only
 ASX ANNOUNCEMENT 10 August 2016 Results for year ended 30 June 2016 (ASX: EGG) today announced its results for the year ended 30 June 2016. Summary: Net Revenue up 3% and Operating EBITDA up 44% on prior
Prime Financial Group Ltd (ASX: PFG) Full Year 2018 Results Presentation
 Full Year 2018 Results Presentation") Prime Financial Group Ltd (ASX: PFG) Full Year 2018 Results Presentation 29 August 2018 Click here to access accompanying Full Year 2018 Results Presentation podcast Key Points 1. Exposure to favourable
Prime Financial Group Ltd (ASX: PFG) Full Year 2018 Results Presentation 29 August 2018 Click here to access accompanying Full Year 2018 Results Presentation podcast Key Points 1. Exposure to favourable
2017 Interim Results. 14 September 2017
 2017 Interim Results 14 September 2017 1 Disclaimer NOT FOR PUBLICATION OR DISTRIBUTION IN WHOLE OR IN PART IN, INTO OR FROM ANY JURISDICTION WHERE TO DO SO WOULD CONSTITUTE A VIOLATION OF THE RELEVANT
FY17 RESULTS. Tuesday 20 February 2018
 FY17 RESULTS Tuesday 20 February 2018 Agenda 2017 Highlights Results 2018 Observations Out-of-Home industry APN Outdoor Contract renewals Focus and objectives Trading update 2 2017 Highlights 3 2017 highlights
PMP LIMITED. For personal use only INVESTOR PRESENTATION. Results for the 6 months ended 31 December February 2016
 PMP LIMITED ABN 39 050 148 644 Results for the 6 months ended 31 December 2015 22 February 2016 Peter George, CEO Geoff Stephenson, CFO INVESTOR PRESENTATION 2016 HALF YEAR RESULTS Contents Pages H1 FY16
H1 FY15 Results Presentation
 H1 FY15 Results Presentation 10 February 2015 Andrew Grech Group Managing Director Wayne Brown CFO Ken Fowlie CEO Australia 1 Disclaimer This document has been prepared by Slater and Gordon Limited (Slater
FY2018 Half Year Results Presentation 1 March 2018
 FY2018 Half Year Results Presentation Brands AMA Group Overview Vehicle Panel Repair Vehicle Protection Products & Accessories Automotive Electrical & Cable Accessories Automotive Component Remanufacturing
For personal use only
 DWS Limited 2018 Full Year Results Presentation Contents Introduction Danny Wallis (CEO) / Stuart Whipp (CFO) Results Highlights Full Year Results Capital Management Operations Update Summary and Outlook
OneVue Holdings Limited (OVH)
") OneVue Holdings Limited (OVH) H1 FY 2018 results presentation 26 February 2018 1 HIGHLIGHTS 2 FINANCIALS 3 OUTLOOK 4 APPENDICES Page 2 1 HIGHLIGHTS . BENEFITTING FROM SECTORAL GROWTH AND STRUCTURAL DISRUPTION
OneVue Holdings Limited (OVH) H1 FY 2018 results presentation 26 February 2018 1 HIGHLIGHTS 2 FINANCIALS 3 OUTLOOK 4 APPENDICES Page 2 1 HIGHLIGHTS . BENEFITTING FROM SECTORAL GROWTH AND STRUCTURAL DISRUPTION
Full Year Results Centrepoint Alliance Limited
 Full Year Results Centrepoint Alliance Limited 30 June 2016 ASX:CAF Our competitive advantage Centrepoint Alliance is uniquely positioned as a leader in Australia s contemporary financial advice industry
2011 Interim Results. Keith Gordon, Managing Director & Chief Executive Officer Stephen Gobby, Chief Financial Officer
 2011 Interim Results Keith Gordon, Managing Director & Chief Executive Officer Stephen Gobby, Chief Financial Officer Emeco 2011 Interim Results Overview Financials Strategy & Outlook Questions Appendices
1H18 Results Presentation Sid Takla Interim Chief Executive Officer Lyndal York Chief Financial Officer
 1H18 Results Presentation Sid Takla Interim Chief Executive Officer Lyndal York Chief Financial Officer 21 August 2018 Important Notice and Disclaimer This presentation has been prepared by Asaleo Care
For personal use only
 Mantra Group H1FY2015 Results Presentation 26 February 2015 Important notice and disclaimer Important notice and disclaimer This document is a presentation of general background information about the activities
Xenith IP Group Limited
 Xenith IP Group Limited Results Financial Year to 30 June 2017 29 August 2017 Craig Dower Stuart Smith Lesley Kennedy CEO and Managing Director Executive Director and Head of Corporate Development CFO
For personal use only
 FY16 RESULTS BRIEFING H U G H M A R K S C H I E F E X E C U T I V E O F F I C E R G R E G B A R N E S C H I E F F I N A N C I A L O F F I C E R M I C H A E L S T E P H E N S O N C H I E F S A L E S O F
Bell Potter Emerging Leaders Conference
 Bell Potter Emerging Leaders Conference Sydney, 24 October 2017 Leon Allen, Managing Director and CEO Disclaimer This presentation has been prepared by QANTM Intellectual Property Limited ACN 612 441 326
Business Update. USPP Conference Miami. Luis Damasceno Group CFO Michael Williams Group Finance Director & Treasurer January 2019
 Business Update USPP Conference Miami Luis Damasceno Group CFO Michael Williams Group Finance Director & Treasurer 23-25 January 2019 www.alsglobal.com IMPORTANT NOTICE AND DISCLAIMER This presentation
TechKnow Conference Sydney, 30 October Melbourne, 1 November ASX: SKF
 TechKnow Conference Sydney, 30 October Melbourne, 1 November ASX: SKF www.skyfii.io Omnidata intelligence is the practice of analysing multiple data sets to create a complete understanding of experiences
INVESTOR PRESENTATION SG FLEET GROUP LIMITED - FY2016 RESULTS
 INVESTOR PRESENTATION SG FLEET GROUP LIMITED - FY2016 RESULTS 16 August 2016 Important Notice and Disclaimer IMPORTANT INFORMATION The information in this presentation is general in nature and does not
Thorn Group Ltd John Hughes Managing Director & CEO
 Thorn Group Ltd John Hughes Managing Director & CEO ASX Conference Presentation 2013 John Hughes CEO & Managing Director Peter Eaton CFO Vision To be Australia s leading provider of a broad range of financial
Full Year Results Briefing 27 August 2015
 Full Year Results Briefing 27 August 2015 David Gyngell CEO Simon Kelly COO/CFO Amanda Laing Commercial Director and Group General Counsel Alex Parsons MD, Nine Digital Peter Wiltshire Group Sales Director
For personal use only. Mantra Group. FY2015 Results Presentation 27 August 2015
 Mantra Group FY2015 Results Presentation 27 August 2015 IMPORTANT NOTICE AND DISCLAIMER Important notice and disclaimer This document is a presentation of general background information about the activities
Investor Presentation Full Year CY 2017 Results
 Investor Presentation Full Year CY 2017 Results Deven Billimoria Managing Director and CEO Tim Looi Chief Financial Officer 22 February 2018 PAGE 0 Smartgroup has had another successful year... 1 2 3 4
INVESTOR PRESENTATION
 INVESTOR PRESENTATION December 2013 MGAM SAFE HARBOR STATEMENT In addition to historical facts or statements of current conditions, this presentation contains forward-looking statements that are intended
Investor Presentation
 Investor Presentation 1 Disclaimer This document has been prepared by Energy One Limited (EOL) and comprises written materials and slides for a presentation concerning EOL. This presentation is for information
For personal use only. FY17 H1 Results. John Croll - Chief Executive Officer Nimesh Shah - Chief Financial Officer 22 February 2017
 FY17 H1 Results John Croll - Chief Executive Officer Nimesh Shah - Chief Financial Officer 22 February 2017 Agenda Overview of FY17 H1 Results and Business Performance Strategy Update FY17 H1 Financial
Acquisition of European herbicide product portfolio from FMC
 Acquisition of European herbicide product portfolio from FMC 8 November 2017 Important notice and disclaimer This presentation has been prepared by Nufarm Limited ACN 091 2 12 ( Nufarm" or the "Company").
ASX Small Cap Conference Hong Kong
 ASX Small Cap Conference Hong Kong 21 st October 2010 John DeLano Chief Executive Officer and Managing Director Not for distribution or release in the United States or to U.S. persons 1 Disclaimer Important
Miclyn Express Offshore
 Miclyn Express Offshore FY13 Results Presentation 26 August, 2013 Live Webcast Details Presenter: Diederik de Boer, CEO Date: 26 August, 2013 Time: 11:00am AEST Access: http://www.brrmedia.com/event/114725
For personal use only
 Affinity Education Group Full Year 2014 Results 27 February 2015 2014 Highlights FY 2014 Earnings Growth Underlying EBITDA of $17.9m (1) and underlying NPAT of $11.4m (1) Underlying EPS of 8.1 cents (1)
PMP LIMITED INVESTOR PRESENTATION. Results for the 12 months ended 30 June August Peter George, CEO Geoff Stephenson, CFO
 PMP LIMITED ABN 39 050 148 644 Results for the 12 months ended 30 June 2016 29 August 2016 Peter George, CEO Geoff Stephenson, CFO INVESTOR PRESENTATION 2016 FULL YEAR RESULTS Contents Pages FY16 Highlights
TOURISM HOLDINGS LTD FY16 INTERIM RESULTS PRESENTATION. 23 February 2016
 TOURISM HOLDINGS LTD FY16 INTERIM RESULTS PRESENTATION 23 February 2016 $M H1 FY16 Highlights Revenue $134M up 20% Earnings before interest and tax* $15.0M up 42% Net profit after tax $8.2M up 45% H1 EBIT
ASX Media Release WORLEYPARSONS LIMITED (ASX: WOR) FULL YEAR 2017 RESULT
 FULL YEAR 2017 RESULT") 23 August 2017 ASX Media Release WORLEYPARSONS LIMITED (ASX: WOR) FULL YEAR 2017 RESULT Professional services company WorleyParsons Limited today announced a statutory net profit after tax (NPAT) of $33.5
23 August 2017 ASX Media Release WORLEYPARSONS LIMITED (ASX: WOR) FULL YEAR 2017 RESULT Professional services company WorleyParsons Limited today announced a statutory net profit after tax (NPAT) of $33.5
7 March Senior Executive, Financial Market Infrastructure. Level 5, 100 Market Street SYDNEY NSW 2000 SYDNEY NSW 2000
 7 March 2016 Australian Securities and Investments Commission ASX Market Announcements Office Mr Oliver Harvey ASX Limited Senior Executive, Financial Market Infrastructure 20 Bridge Street Level 5, 100
For personal use only
 FY14 RESULTS John Croll Chief Executive Officer Nimesh Shah Chief Financial Officer AGENDA OVERVIEW OF FY14 RESULT FINANCIAL PERFORMANCE FY15 OUTLOOK GROWTH STRATEGY Q&A JOHN CROLL NIMESH SHAH JOHN CROLL
For personal use only
 MMS Group 18 October 2016 Presenters Mike Salisbury, CEO Mark Blackburn, CFO McMillanShakespeareGroup Overview Record FY16 profit result with strong free cash flow Segment revenue of $503.2m, +29.9% EBITDA
Cleanaway Waste Management Limited
 Cleanaway Waste Management Limited Australia s leading total waste management services company FY16 Results Presentation For the twelve months ended 30 June 2016 19 August 2016 Vik Bansal CEO and Managing
For personal use only. Appen Limited. Global Leader in Language Technology Solutions. FY2014 Results Presentation
 Appen Limited Global Leader in Language Technology Solutions FY2014 Results Presentation Agenda Topic: Introduction to Appen Financial Performance Growth and Outlook People and Leadership Speaker: Chris
Financial Year 1H19 Results
 Financial Year 1H19 Results Investor presentation 20 November 2018 1 Agenda 1. 1H19 Summary 2. 1H19 Financial results 3. FY19 Outlook 4. Q&A 5. Appendix 2 1H19 Summary Skander Malcolm Chief Executive Officer
For personal use only
 FY16 FULL YEAR RESULTS REVIEW Agenda GROUP RESULTS OVERVIEW BUSINESS UNIT REVIEW OUTLOOK Eastlands Shopping Centre BSA completed the mechanical services upgrade and extension to one 29/08/2016 BSA Limited
Following is a copy of the Presentation of Results for the financial half-year ended 29 December 2012.
 20 February 2013 Company Announcements Office Australian Securities Exchange Limited 20 Bridge Street Sydney NSW 2000 By electronic lodgment Total Pages: 27 (including covering letter) PRESENTATION OF
For personal use only
 Identify. Acquire. Grow Global Software Products, Capturing Asian Growth AGM Presentation 30 November 2016 Nic Lim Executive Chairman 2 Highlights Lowlights Expense8 product is clearly a leading product
ARISTOCRAT LEISURE LIMITED 2017 HALF YEAR PROFIT ANNOUNCEMENT RESULTS TO BE RELEASED TO THE MARKET
 ARISTOCRAT LEISURE LIMITED ABN 44 002 818 368 2017 HALF YEAR PROFIT ANNOUNCEMENT RESULTS TO BE RELEASED TO THE MARKET ANNUAL INFORMATION GIVEN TO THE ASX UNDER LISTING RULE 4.3A ARISTOCRAT LEISURE LIMITED
FY2018 Half Year Results Investor Presentation
 FY2018 Half Year Results Investor Presentation February 2018 DISCLAIMER The material in this presentation has been prepared by IMF Bentham Limited (IMF) and is general background information about IMF's
Full Year Results Presentation (ASX Code: HIT) 31 AUGUST 2018
 31 AUGUST 2018") Full Year Results Presentation (ASX Code: HIT) 31 AUGUST 2018 Consistent track record is being rewarded in share price. HIT.ASX Share Price Aug 15 Nov 15 Feb 16 May 16 Aug 16 Nov 16 Feb 17 May 17 Aug 17
Full Year Results Presentation (ASX Code: HIT) 31 AUGUST 2018 Consistent track record is being rewarded in share price. HIT.ASX Share Price Aug 15 Nov 15 Feb 16 May 16 Aug 16 Nov 16 Feb 17 May 17 Aug 17
GENTRACK GROUP LTD (GTK) FY18 Results Presentation. November 2018
 FY18 Results Presentation. November 2018") GENTRACK GROUP LTD (GTK) FY18 Results Presentation November 2018 Disclaimer This presentation may contain forward looking statements. Forward looking statements often include words such as anticipate,
GENTRACK GROUP LTD (GTK) FY18 Results Presentation November 2018 Disclaimer This presentation may contain forward looking statements. Forward looking statements often include words such as anticipate,
UXC Limited ACN
 UXC Limited ACN 067 682 928 2015 Annual General Meeting Geoff Cosgriff, Chairman Cris Nicolli, Managing Director 29 October 2015 Welcome and introductions 2 Chairman s Address Mr. Geoff Cosgriff Recap
For personal use only. Investor Presentation Bravura Solutions Limited
 Investor Presentation Bravura Solutions Limited Tony Klim CEO 27 April 2017 The information contained in this document (including this notice) or discussed at this presentation (collectively, the Presentation)
SKYCITY Entertainment Group Limited. FY16 Full-Year Result Presentation 10 August SKYCITY Entertainment Group Limited
 SKYCITY Entertainment Group Limited FY16 Full-Year Result Presentation 10 August 2016 SKYCITY Entertainment Group Limited Disclaimer All information included in this presentation is provided as at 10 August
Cover-More Group. UBS Australasia Conference. November 2015
 Cover-More Group UBS Australasia Conference November 2015 Executive summary: FY15 overview Cover-More delivered another year of double digit earnings growth, with offshore business growing substantially.
For personal use only
 NATIONAL STORAGE REIT JP MORGAN AUSTRALIAN REIT FORUM ASIA MARCH 2017 IMPORTANT NOTE & DISCLAIMER This presentation has been prepared by National Storage REIT ( NSR ) comprising National and may involve
For personal use only
 Preliminary Final Report Appendix 4E Results for announcement to the market Pulse Health Limited (ACN 104 113 760) This Preliminary Final Report is provided to the Australian Securities Exchange (ASX)
Monash IVF Group. FY16 Results Presentation 26 August 2016
 Monash IVF Group FY16 Results Presentation 26 August 2016 Disclaimer The presentation has been prepared by Monash IVF Group Limited (ACN 169 302 309) ( MVF ) (including its subsidiaries, affiliates and
FY2016 H1 Results Presentation. September 2016
 FY2016 H1 Results Presentation September 2016 Corporate Headlines Capital Structure Share Price (1 Sep 2016) $1.97 Fully paid ordinary shares 159.4m Options 0.0m Shareholders Founder -David Dicker 60.6m
For personal use only
 AGENDA 10-20 Bond Street: Chillers with variable speed drives BSA RESULTS AND OVERVIEW FINANCIAL REVIEW BUSINESS UNIT REVIEW SUMMARY 2 BSA RESULTS Fiona Stanley Hospital: Central Energy Services Plant
AUB GROUP LTD FULL YEAR RESULTS FOR THE PERIOD ENDED 30 JUNE 2018 (FY18) 27 AUGUST 2018
 27 AUGUST 2018") AUB GROUP LTD FULL YEAR RESULTS FOR THE PERIOD ENDED 30 JUNE 2018 (FY18) 27 AUGUST 2018 NOTICE SUMMARY INFORMATION This document has been prepared by AUB Group Limited(ABN 60 000 000 715)(AUB). It is a
AUB GROUP LTD FULL YEAR RESULTS FOR THE PERIOD ENDED 30 JUNE 2018 (FY18) 27 AUGUST 2018 NOTICE SUMMARY INFORMATION This document has been prepared by AUB Group Limited(ABN 60 000 000 715)(AUB). It is a
Qube Holdings Limited Investor Presentation FY 16 Interim Results
 Qube Holdings Limited Investor Presentation FY 16 Interim Results 1 Disclaimer Important Notice ABN 141 497 230 53 The information contained in this Presentation or subsequently provided to the recipient
FINANCIAL RESULTS PRESENTATION FY2018
 Virtus Health (ASX:VRT) FINANCIAL RESULTS PRESENTATION FY2018 Tuesday 21 August, 2018 AEST DISCLAIMER The material in this presentation has been prepared by Virtus Health Limited ABN 80 129 643 492 ( Virtus
For personal use only
 DWS Limited 2016 Half Year Results Presentation Contents Introduction Danny Wallis (CEO) / Stuart Whipp (CFO) Results Highlights Half Year Results Capital Management Operations Update DWS Growth Strategy
Investor Presentation
 NZX Code: ATM ASX Code: A2M 3 May 2017 NZX/ASX Market Release Investor Presentation Please find attached a presentation to be given today by The a2 Milk Company Limited at Macquarie s annual Australia
OneVue Holdings Limited (OVH)
") OneVue Holdings Limited (OVH) Morgan Stanley Emerging Companies Conference Thursday 7 June 2018 A FINTECH COMPANY THAT PARTNERS TO DISRUPT ALONG THE SUPERANNUATION VALUE CHAIN Market leading businesses,
OneVue Holdings Limited (OVH) Morgan Stanley Emerging Companies Conference Thursday 7 June 2018 A FINTECH COMPANY THAT PARTNERS TO DISRUPT ALONG THE SUPERANNUATION VALUE CHAIN Market leading businesses,
1H18 RESULTS 6 MONTHS ENDED 31 DECEMBER 2017
 1H18 RESULTS 6 MONTHS ENDED 31 DECEMBER 2017 GROUP RESULTS 2 GROWTH IN PROFIT AND FCF Group Underlying 1 Reported 2 1H 2018 1H 2017 1H 2018 1H 2017 Revenue 856.5 808.7 856.5 808.7 EBIT 81.3 81.9 61.6 61.1
IFRS 15 / AASB 15 International Financial Reporting Standards
 IFRS 15 / AASB 15 International Financial Reporting Standards Edward Chung Chief Executive Officer Gareth Pye Deputy Chief Financial Officer 17 July 2018 Commercial in confidence 129 FINAL Disclosure Statement