Bank Financial Analysis. Georgia Bankers Association
|
|
|
- Blake Crawford
- 5 years ago
- Views:
Transcription
1 Bank Financial Analysis Georgia Bankers Association
2 Learning Objectives Recognize the basic balance sheet accounts and income statement components and understand their relationship Grasp the ROE model to analyzing bank profitability Comprehend the importance of net interest margin, earning assets and operating efficiency to bank profitability Identify and understand key ratios Familiarity with the CAMELS ratings Understand performance characteristics of small and large banks Relate key financial concepts and data to planning and managing a bank
3 Balance Sheet Assets = Liabilities + Equity What a Bank Owns What a bank owes Ownership interest of Shareholders A snapshot of a point in time Provided quarterly to the regulators via the Call Report on schedule RC Example in Exhibit 1 presents average data
4 First State Bank Balance Sheets YTD Avg YTD Avg Assets Cash and due from banks $ 3,700 $ 4,118 Investments Time deposits at other institutions 600 2,114 Federal funds sold & repos 1,380 3,190 US Government securities 4,790 10,794 Federal Agency securities 7,950 5,450 Municipal securities 5,620 9,620 Other securities 1,400 1,200 Total investments 21,740 32,368 Loans & Leases Commercial and industrial $18,670 $15,150 Real estate 19,740 7,740 Consumer 14,010 11,955 Other 1,430 1,390 Total Loans & leases 53,850 36,235 Less reserve for loan and lease losse 1,950 1,800 Net loans & leases 51,900 34,435 Other assets 2,660 2,082 Total assets 80,000 73,003
5 Assets Cash & Due From Banks Investments Held to Maturity (historical cost) Trading Account (fair value changes flow to I/S) Available for sale (fair value, changes flow to equity) Loans Fixed Assets Other Assets
6 Investments Typically fixed income investments Categorized as held-to-maturity or available-forsale. Exhibit 1 The Bank presents the securities by type of issuer. In the notes to the financial statements information regarding remaining life would be provided. Type of security is important to evaluate the amount of risk accepted by the Bank. Regulators require banks to hold investment grade securities must not rely only on credit rating agencies to determine credit quality
7 Why do Banks have an investment portfolio? Maintain liquidity with better yields than overnight funds. Can be pledged for repurchase lines or borrowings Structure to modify or offset other interest rate risk. For example, a bank with mostly variable rate loans might use the investment portfolio to reduce asset sensitivity. May make a market in securities by making them available for customers to purchase Trading Account securities. May recognize gains (or losses) on either trading accounts or AFS securities when sold. May provide income with minimal credit risk (but not necessarily) May classify as HTM to avoid affect of market swings on book value
8 Why would investment portfolio yeild s (returns) vary among banks given that what we are allowed to purchase for our portfolio s is restricted by regulations?
9 Loans Generally the bank s most important earning asset Commercial & Industrial Real estate CRE Owner Occupied Consumer Consumer Agricultural Other
10 Bank Liabilities Deposits Transaction accounts: DDA, NOW, MMDA Non-transaction accounts: Savings and Time Deposit Accounts Which type of accounts usually have more rate sensitive customers? Which are core deposits? Which are non-core (volatile) deposits?
11 Other Non-core liabilities Borrowings Fed Funds Purchased Repurchase agreements Term Borrowings: FHLB - volatile or non volatile?
12 Other Non-core liabilities Brokered Deposits Jumbo CD s Internet CD s Advantages and disadvantages of these?
13 Capital or shareholder s equity Preferred Stock Trust Preferred (being phased out under Dodd Frank) Common Stock Subordinated notes and debentures Retained earnings
14 The Income Statement A flow statement represents what happened during a specified time period. The annual income statement should be compared to average balance sheet data for the YTD in order to calculate meaningful ratios. Bank income statements differ from manufacturing concerns or other industries due to the importance of interest income and expense.
15 First State Bank (Exhibit 2) YTD Interest Income Interest on loans $ 3,963 Interest on federal funds sold and Repos 15 Interest on time deposits at institutions 12 Interest on U.S. Gov t. & Agency sec. s 809 Interest on municipal securities b 306 Interest on other securities 95 Total interest income 5,200 Interest Expense Interest on checking accounts 113 Interest on regular savings 341 Interest on MMDAs 219 Interest on small time deposits 1,233 Interest on CDs 296 Interest on deposits 2,202 Interest on subordinated debt 108 Total interest expense 2,310 Net interest income 2,890 Provision for loan losses 250 Net interest income after provision 2,640
16 First State Bank Noninterest Income Service charges 1,037 Fee income 314 Other income 289 Total noninterest income 1,640 Noninterest Expense Salaries & employee benefits 1,388 Occupancy expense 229 Furniture & equipment expense 271 Other operating expense 812 Total noninterest expense 2,700 Securities gains 60 Income before taxes 1,640 Income taxes 300 Net income 1,340
17 5 general components Net Interest Income (NII) Provision for Losses (PL) Burden (OI-OE) Securities gains/losses (SG) Taxes (T) Net Income = NII PL Burden +/- SG T $1,340 = $2, (2,700-1,640)
18
19
20 Statement of Cash Flows Net cash provided by operations Net cash used by investment activities Net cash provided by financing activities Net change in cash
21 Typical sources and uses of cash Results of operations as adjusted for what items? Depreciation? LLP? Changes in payables or accruals? Loans use or source? Deposits use or source? Capital considerations use or source?
22 First State Bank, Exhibit 3 Net Change in cash = $(418) Resulting from: Net cash provided by ops $1,312 Net cash used by investing $(7,379) Mostly growth in loans Net cash provided by financing $5,649 Mostly growth in deposits
23 Banking Risk
24 Types of Banking Risk Credit Risk Liquidity risk, Interest rate risk Capital risk Operational risk Off Balance Sheet risk, and Foreign exchange risk
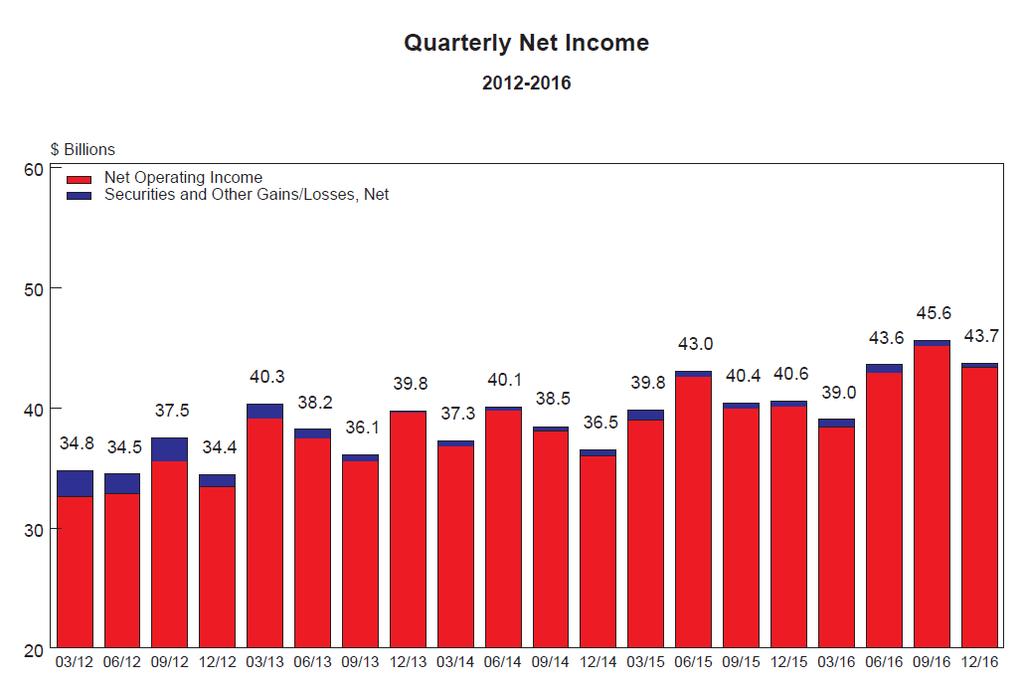
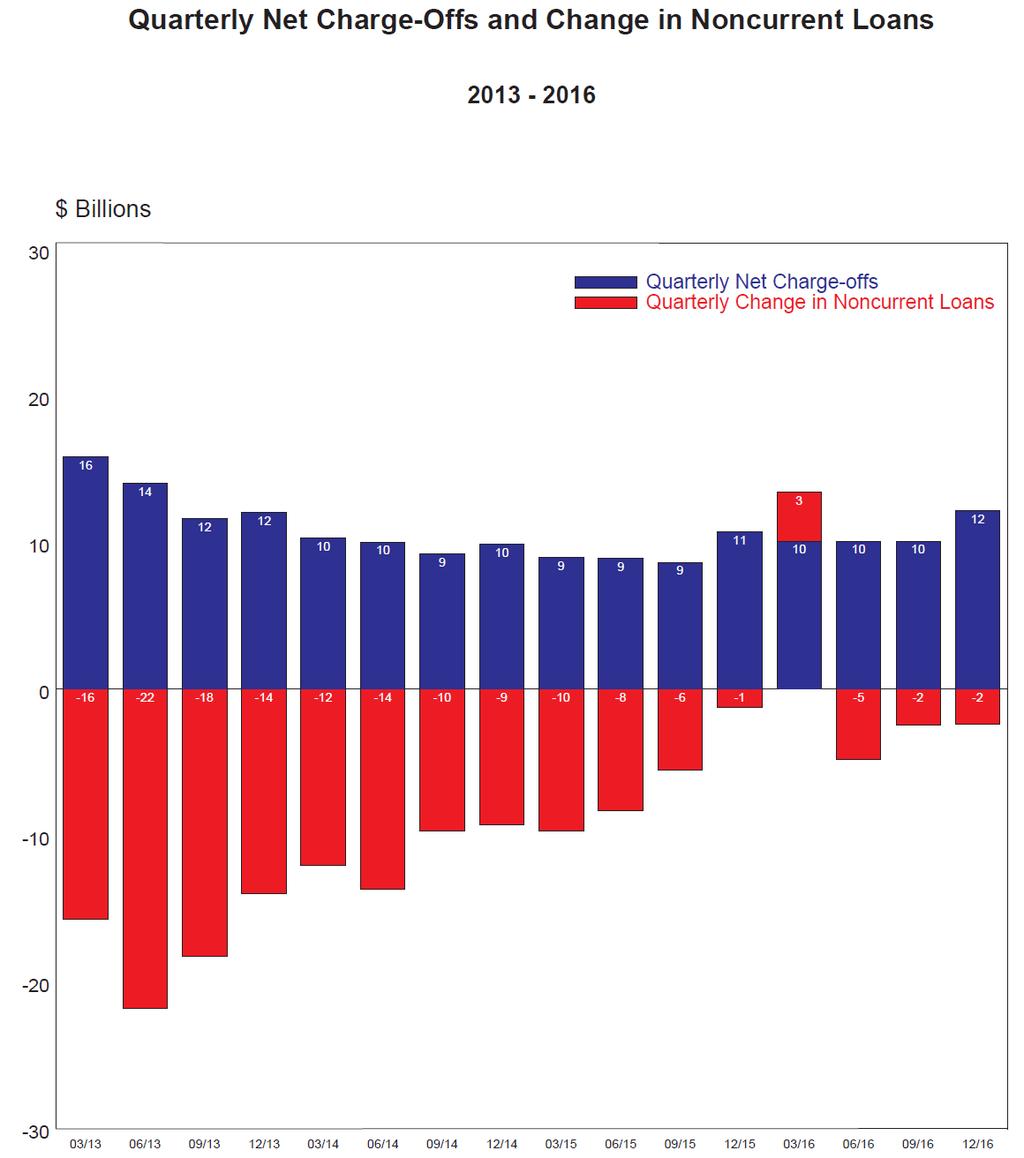
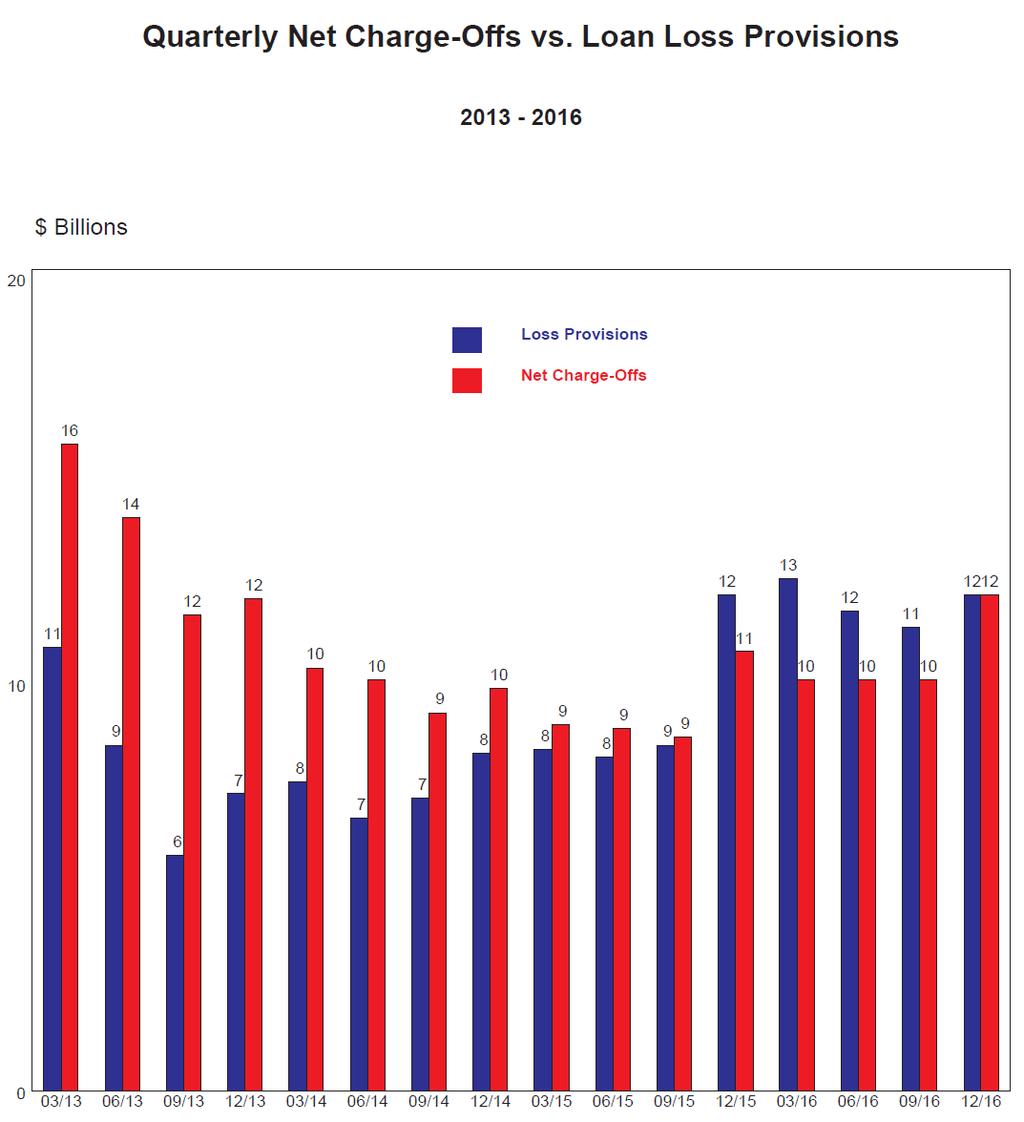
25 Credit Risk Primary source of bank failures Reflects the quality of assets or risk of borrower default Major sources of asset quality problems? What caused to significant decline in asset quality from ? Current status of asset quality in banking
26
27
28


29 Fourth Quarter, 2016
30 In Q there were 2,222 institutions with construction loan concentrations
31 Liquidity Risk Liquid vs. less liquid assets Which assets are most liquid and where do they appear on the Balance Sheet? Who monitors and manages liquidity at your bank? What areas are involved? How did liquidity effect the banking crisis from ? What did the FRB and US Treasury do to address pressures on liquidity?
32 Liquidity Ratios GA State Avg Ratio Net Non core Funding Dependency Loans to Deposits Brokered Deposits to Deposits Listing Service Deposits to Deposits Core Deposits to Total Deposits Source State Average Report UPBR data
33 Interest Rate Risk Two major measures of IRR today Effect on earnings Effect on the economic value of stockholders equity In the past, GAP was also utilized Who is responsible for measuring and managing interest rate risk at your banks? Is your bank Asset Sensitive and why should you care?
34 Capital Risk Overall solvency risk Insolvency = market value of assets < market value of liabilities (Capital is the buffer or safety margin) Capital adequacy depends on asset quality, interest rate sensitivity and the level of earnings. Basel III is being phased in beginning in through2019.
35 Capital Ratios GA State Averages Ratio Req d Tier One RBC to Risk Weighted Assets Total RBC to Risk Weighted Assets Tier One Leverage Capital
36 Basil III New Risk-Weighted Asset Requirements 150% risk-weight for high volatility commercial real estate and non-residential loans 90+ days delinquent 20% risk-weight on loan commitments with an original maturity less than one year that are not unconditionally cancellable Mortgage servicing rights and deferred tax assets (not related to net operating loss carryforwards) that remain under a 10% individual limit and 15% aggregate limit are not deducted from capital, but carry a 250% risk-weight Additional Information Becomes effective on January 1, 2015 (with a transition phase until January 1, 2019) for financial institutions with less than $250 billion in consolidated assets Revises the Prompt Corrective Action (PCA) framework by introducing Common Equity Tier 1 Capital (CET1) and requiring higher levels of regulatory capital Common Equity Tier 1 Capital is composed of common stock, retained earnings and limited recognition of minority interests; deductions include goodwill and other intangibles, deferred tax assets from net operating loss and tax credit carryforwards, gain on securitization sales and certain defined benefit pension fund assets Introduces a Capital Conservation Buffer that requires banks to hold CET1 in excess of minimum risk-based capital ratios by 2.5% (when fully phased in as of 2019) to avoid limits on capital distributions and certain discretionary bonus payments to executive officers; phased in beginning in 2016 For banks with consolidated assets less than $250 billion, accumulated other comprehensive income (AOCI) can be permanently excluded from regulatory capital through a one-time irrevocable opt-out provision
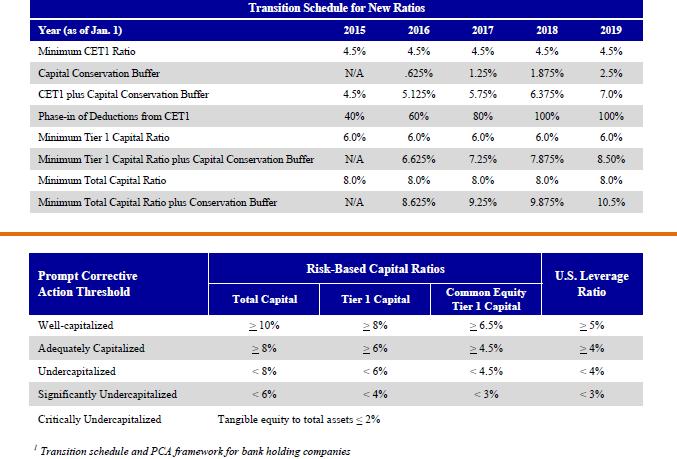
37 Implementation Schedule
38 Other major risks Operational- risk of fraud and errors. Quality of technology, internal controls, and bank policies Off Balance Sheet Risk Commitments and exposures not enumerated on the Balance Sheet unfunded loan commitments, guarantees, derivative positions Price Risk or Foreign Exchange Risk unanticipated changes in trading account assets or asset or liabilities in different currencies.
39 Regulatory Risk Ratings C = Capital adequacy A = Asset quality M = Management quality E = Earnings quality L = Liquidity S = Sensitivity Ratings scale is 1 5 for each component and an overall composite score.
40 Evaluating Bank Performance
41 Performance Measures Indicate the institution s risk profile and overall financial performance as it presently exists in comparison to its peers Understand history and the causes of bank performance Identify trends to head off potential future problems Understand the relationship of performance ratios to draw valid conclusions regarding causation
42 Return on Equity (ROE) ROE = net income/average book equity Best overall measurement of profits to shareholders Relates to the bank s common stock price Major analyst benchmark for comparing banks
43 9.31% 9.03%
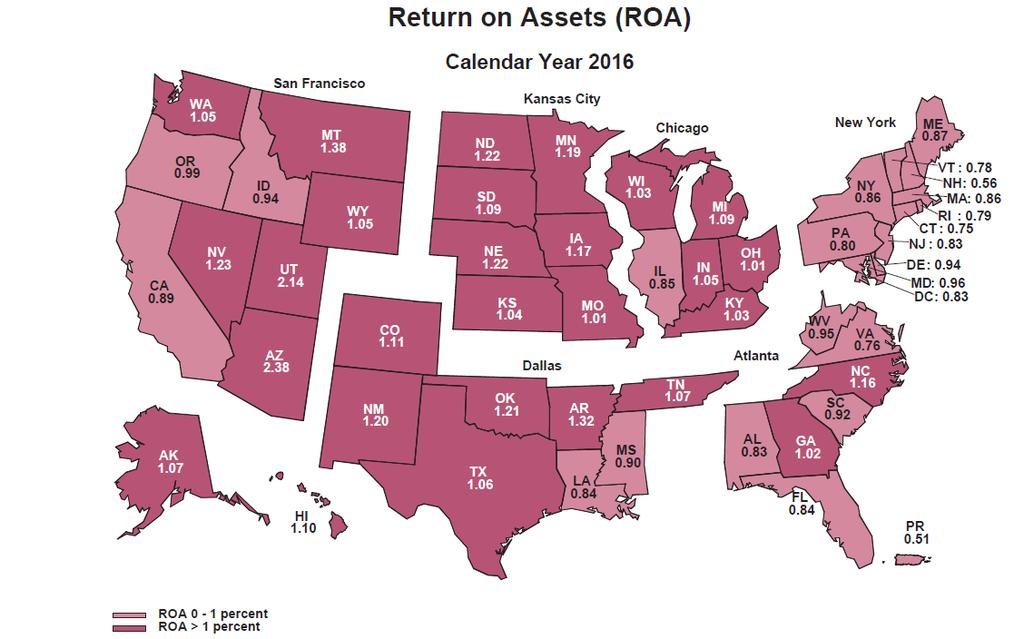
44 Return on Assets (ROA) ROA = net income/average total assets Measure of return relative to total bank resources Varies substantially among size tiers of banks ROA = Profit Margin x Asset Utilization PM = Net income/operating income AU = Total Operating income/total Assets
45 1.04%
46
47 Equity Multiplier (EM) EM = average total assets/average book equity Measures financial leverage Limited by regulatory policy Strategically increasing leverage increases utilization of capital and may increase ROE
48 Inter-relation ROE=ROA x EM ROE/EM=ROA ROE/ROA=EM
49 City Bank vs County Bank (pg 25) City Bank County Bank Assets = $100 Debt = $90 Assets = $100 Debt = $95 Equity = $10 Equity = $5 Equity Multiplier $100/$10=10X Equity Multiplier $100/$5=20X ROA = 1% ROE = 10% ROA = 1% ROE = 20% ROA = -1% ROE = -10% ROA = -1% ROE = -20% EM can be an indicator of risk in terms of debt levels. The Best value depends on the bank s tolerance for risk and levels of other types of risk.
50 Most Common Measures Net Interest Margin NIM NIM = Net interest income/earning assets Represents the net interest return on income producing assets Efficiency Ratio Non interest expense/(non interest income + Net interest income) Overhead cost per each dollar of net operating revenue generated (lower ratios are better)
51
52
53
54
55
56 Discussion Questions
57 Calculation exercise
58 First State Bank performance First State Bank is a high performance bank in relation to its peers. What causes this? Exhibit 5
59 First State Bank Risk Profile Exhibit 6 provides risk data not pulled from financial statements, but gleaned from footnotes to financial statements. How does credit risk compare? How does Liquidity risk compare? Capital Risk?
60 Uniform Bank Performance Report
Bank Management, 6th edition. Timothy W. Koch and S. Scott MacDonald Copyright 2006 by South-Western, a division of Thomson Learning
 Bank Management, 6th edition. Timothy W. Koch and S. Scott MacDonald Copyright 2006 by South-Western, a division of Thomson Learning ANALYZING BANK PERFORMANCE: USING THE UBPR Chapter 2 William Chittenden
Chapter 2 Analyzing Bank Performance
 Chapter 2 Analyzing Bank Performance Balance Sheet It is a statement of financial position listing assets owned, liabilities owed, and owner s equity as of a specific date. Assets = Liabilities + Equity.
Revised Capital Rules for Banking Organizations
 Revised Capital Rules for Banking Organizations the most substantial revisions to the capital rules since the adoption of risk-based capital in 1988 Southeast Banker Outreach Forum The opinions expressed
Tackling the Revised Call Report Schedule RC-R:
 2015 CliftonLarsonAllen LLP Tackling the Revised Call Report Schedule RC-R: What Community Banks Need to Know to Implement Basel III CLAconnect.com Disclaimers The information contained herein is general
Bank Assets BANK FINANCIAL STATEMENTS. The Balance Sheet Conceptually. Bank Securities. Types of Loans. Balance Sheet Deposits. Cash & Due from Banks
 BANK FINANCIAL STEMENTS Bank Assets Cash and due from banks Vault cash, deposits held at the Fed and other financial institutions, and cash items in the process of collection Investment Securities Bonds,
Liquidity & Capital Management
 Liquidity & Capital Management David Hart SunTrust Bank May 5, 2016 Unprecedented Times Current Events 2007-2010: A difficult period marked by bank failures and challenging economic conditions 2012 2014:
PNC Bank, NA. Board Report. June 30, Pittsburgh, PA. A/L BENCHMARKS Standards for Asset/Liability Management
 A/L BENCHMARKS Standards for Asset/Liability Management Board Report PNC Bank, NA June 30, 2006 Olson Research Associates, Inc. 10290 Old Columbia Road, Columbia, MD 21046 Phone: 888-657-6680 Web: http://www.olsonresearch.com
Basel III Standardized Approach Disclosures
 Disclosures September 30, 2016 Table of Contents Introduction 1 Background 1 Overview 1 Disclosure Matrix 3 Components of Capital 10 Capital Adequacy 10 Standardized Risk-Weighted Assets 11 Capital Ratios
PRO FORMA COMBINED FINANCIAL SUPPLEMENT FIRST QUARTER 2005
 PRO FORMA COMBINED FINANCIAL SUPPLEMENT FIRST QUARTER 2005 TABLE OF CONTENTS Page Consolidated Results Financial Highlights 3 Statements of Income - Reported Basis 4 Consolidated Balance Sheets 5 Condensed
2Q15 Quarterly Supplement
 2Q15 Quarterly Supplement July 14, 2015 2015 Wells Fargo & Company. All rights reserved. Table of contents 2Q15 Results - 2Q15 Highlights Page 2 - Year-over-year results 3 - Balance Sheet and credit overview
Huntington Bancshares Incorporated. Basel III Regulatory Capital Disclosures December 31, 2017
 Disclosures Disclosures Glossary of Acronyms Acronym AFS ALLL C&I CAP CRE EAD GAAP HTM HVCRE ISDA MD&A MDB OTC PFE PSE RWA SPE SSFA T-Bill T-Bond T-Note VIE Description Available For Sale Allowance for
银行管理学 作业习题. Chapter 1 Fundamental Forces of Change in Banking
 银行管理学 作业习题 Chapter 1 Fundamental Forces of Change in Banking 1. Many experts argue that it was not deregulation that brought about fundamental change in the banking industry rather increases in competition
The Goldman Sachs Group, Inc. PILLAR 3 DISCLOSURES
 The Goldman Sachs Group, Inc. PILLAR 3 DISCLOSURES For the period ended September 30, 2017 TABLE OF CONTENTS Page No. Index of Tables 1 Introduction 2 Regulatory Capital 5 Capital Structure 6 Risk-Weighted
The Goldman Sachs Group, Inc. PILLAR 3 DISCLOSURES
 The Goldman Sachs Group, Inc. PILLAR 3 DISCLOSURES For the period ended December 31, 2016 TABLE OF CONTENTS Page No. Index of Tables 1 Introduction 2 Regulatory Capital 5 Capital Structure 6 Risk-Weighted
The PNC Financial Services Group, Inc. Basel III Pillar 3 Report: Standardized Approach June 30, 2018
 The PNC Financial Services Group, Inc. Basel III Pillar 3 Report: Standardized Approach June 30, 2018 Page References Pillar 3 Disclosure Description Pillar 3 Report June 30, 2018 Form 10-Q Introduction
Credit Suisse Financial Services Forum. Tim Sloan Chief Financial Officer
 Credit Suisse Financial Services Forum Tim Sloan Chief Financial Officer February 12, 2014 Wells Fargo vision Wells Fargo Vision We want to satisfy all our customers financial needs and help them succeed
Basel Pillar 3 Disclosures
 Basel Pillar 3 Disclosures September 30, 2017 TABLE OF CONTENTS Introduction................................................................................... Regulatory Framework........................................................................
Supplemental Financial Information For the Quarter Ended April 30, 2017 (unaudited)
") Supplemental Financial Information For the Quarter Ended April 30, 2017 Non-IFRS Measures 1 Highlights 2 Net Income and Comprehensive Income 3 Earnings Per Share, Non-IFRS Measures and Other Statistics
Supplemental Financial Information For the Quarter Ended April 30, 2017 Non-IFRS Measures 1 Highlights 2 Net Income and Comprehensive Income 3 Earnings Per Share, Non-IFRS Measures and Other Statistics
3Q18 Quarterly Supplement
 3Q18 Quarterly Supplement October 12, 2018 2018 Wells Fargo & Company. All rights reserved. Table of contents 3Q18 Results 3Q18 Highlights Pages 2 3Q18 Earnings 3 Year-over-year results 4 Balance Sheet
With Competitor Analysis
 With Competitor Analysis Sample Bank Quarter Analyzed 2015Q4 THE S&B PHILOSOPHY Seifried & Brew provides dynamic content, context, and education to community financial institutions through client specific
FIRST REPUBLIC BANK. Basel III Regulatory Capital Disclosures
 FIRST REPUBLIC BANK TABLE OF CONTENTS Section 1. Introduction....................................................................... 2. Capital Structure...................................................................
FIRST BANK OF KENTUCKY CORPORATION Maysville, Kentucky. CONSOLIDATED FINANCIAL STATEMENTS December 31, 2016 and 2015
 Maysville, Kentucky CONSOLIDATED FINANCIAL STATEMENTS Maysville, Kentucky CONSOLIDATED FINANCIAL STATEMENTS CONTENTS INDEPENDENT AUDITOR S REPORT... 1 FINANCIAL STATEMENTS CONSOLIDATED BALANCE SHEETS...
3Q17 Quarterly Supplement
 3Q17 Quarterly Supplement October 13, 2017 2017 Wells Fargo & Company. All rights reserved. Table of contents 3Q17 Results 3Q17 Highlights Year-over-year results Page 2 Balance Sheet and credit overview
PILLAR 3 REGULATORY CAPITAL DISCLOSURES
 PILLAR 3 REGULATORY CAPITAL DISCLOSURES For the quarterly period ended Table of Contents Disclosure map 1 Introduction 2 Report overview 2 Basel III overview 2 Enterprise-wide risk management 3 Governance
The Goldman Sachs Group, Inc. PILLAR 3 DISCLOSURES
 The Goldman Sachs Group, Inc. PILLAR 3 DISCLOSURES For the period ended March 31, 2018 TABLE OF CONTENTS Page No. Index of Tables 1 Introduction 2 Regulatory Capital 5 Capital Structure 6 Risk-Weighted
4Q15 Quarterly Supplement
 4Q15 Quarterly Supplement January 15, 2016 These results do not reflect the impact of the agreement in principle Wells Fargo & Company reached with the United States government on February 1, 2016 to pay
1Q15 Quarterly Supplement
 1Q15 Quarterly Supplement April 14, 2015 2015 Wells Fargo & Company. All rights reserved. Table of contents 1Q15 Results - 1Q15 Highlights Page 2 - Year-over-year results 3-1Q15 Revenue diversification
Basel III Standardized Approach Disclosures
 Disclosures March 31, 2018 Table of Contents Introduction 1 Overview 1 Disclosure Matrix 3 Components of Capital 10 Capital Adequacy Standardized Risk-Weighted Assets 10 Capital Adequacy Capital Ratios
Basel III Standardized Approach Disclosures
 Basel III Standardized Approach Disclosures September 30, 2018 Table of Contents Introduction 1 Overview 1 Disclosure Matrix 3 Components of Capital 10 Capital Adequacy Standardized Risk-Weighted Assets
Capital in the Capitol: The New U.S. Regulatory Capital Framework August 7, 2013 Presented By Augus Oliver I. Ireland Morrison & Foerster LLP
 2013 Morrison & Foerster LLP All Rights Reserved mofo.com Capital in the Capitol: The New U.S. Regulatory Capital Framework August 7, 2013 Presented By Augus Oliver I. Ireland Morrison & Foerster LLP Introduction
The PNC Financial Services Group, Inc. Basel III Pillar 3 Report: Standardized Approach September 30, 2016
 The PNC Financial Services Group, Inc. Basel III Pillar 3 Report: Standardized Approach September 30, 2016 Page References Pillar 3 Disclosure Description Pillar 3 Report September 30, 2016 Form 10-Q 2015
First Bancorp of Indiana, Inc.
 Accountants Reports and Consolidated Financial Statements Contents Independent Accountants Report... 1 Consolidated Financial Statements Balance Sheets... 2 Statements of Income... 3 Statements of Stockholders
Balance Sheet and Income Statement of a Commercial Bank
 Balance Sheet and Income Statement of a Commercial Bank Economics of Financial Intermediation March 7, 2017 Financial information on commercial banks is reported in two basic documents: The report of condition
Wells Fargo & Company. Basel III Pillar 3 Regulatory Capital Disclosures
 Wells Fargo & Company Basel III Pillar 3 Regulatory Capital Disclosures For the quarter ended June 30, 2018 1 Table of Contents Disclosure Map.. 3 Introduction... 6 Executive Summary... 6 Company Overview
Wells Fargo & Company. Basel III Pillar 3 Regulatory Capital Disclosures
 Wells Fargo & Company Basel III Pillar 3 Regulatory Capital Disclosures For the quarter ended September 30, 2018 1 Table of Contents Disclosure Map.. 3 Introduction... 6 Executive Summary... 6 Company
Risk-Based Capital Final Rule Applicable to Community Banks
 Risk-Based Capital Final Rule Applicable to Community Banks July 11, 2013 Contacts: Chris Cole SVP/Senior Regulatory Counsel chris.cole@icba.org James Kendrick Vice President/Accounting & Capital Policy
BAR HARBOR SAVINGS AND LOAN ASSOCIATION
 BAR HARBOR SAVINGS AND LOAN ASSOCIATION FINANCIAL STATEMENTS With Independent Auditor's Report INDEPENDENT AUDITOR'S REPORT Board of Directors Bar Harbor Savings and Loan Association We have audited the
BancFirst Corporation (Exact name of registrant as specified in charter)
") UNITED STATES SECURITIES AND EXCHANGE COMMISSION Washington, D.C. 20549 FORM 10-Q QUARTERLY REPORT PURSUANT TO SECTION 13 OR 15(d) OFTHE SECURITIES EXCHANGE ACT OF 1934 For the quarterly period ended March
UNITED STATES SECURITIES AND EXCHANGE COMMISSION Washington, D.C. 20549 FORM 10-Q QUARTERLY REPORT PURSUANT TO SECTION 13 OR 15(d) OFTHE SECURITIES EXCHANGE ACT OF 1934 For the quarterly period ended March
Supplemental Financial Information For the Quarter Ended October 31, 2017 (unaudited)
") Supplemental Financial Information For the Quarter Ended October 31, 2017 Non-IFRS Measures 1 Highlights 2 Net Income and Comprehensive Income 3 Earnings Per Share, Non-IFRS Measures and Other Statistics
Supplemental Financial Information For the Quarter Ended October 31, 2017 Non-IFRS Measures 1 Highlights 2 Net Income and Comprehensive Income 3 Earnings Per Share, Non-IFRS Measures and Other Statistics
Supplemental Financial Information
 Supplemental Financial Information For the First Quarter Ended January, 08 For further information, please contact: Investor Relations Department Gillian Manning 46-08-900 www.td.com/investor Basis of
KeyCorp Beth E. Mooney Don Kimble
 KeyCorp Fourth Quarter 2017 Earnings Review January 18, 2018 Beth E. Mooney Chairman and Chief Executive Officer Don Kimble Chief Financial Officer FORWARD-LOOKING STATEMENTS AND ADDITIONAL INFORMATION
EARNINGS RELEASE FINANCIAL SUPPLEMENT FIRST QUARTER 2006
 EARNINGS RELEASE FINANCIAL SUPPLEMENT FIRST QUARTER 2006 TABLE OF CONTENTS Page Consolidated Results Consolidated Financial Highlights 2 Statements of Income 3 Consolidated Balance Sheets 4 Condensed Average
2Q18 Quarterly Supplement
 2Q18 Quarterly Supplement July 13, 2018 2018 Wells Fargo & Company. All rights reserved. Table of contents 2Q18 Results 2Q18 Highlights Page 2 Update on customer remediation for previously disclosed matters
Financial Summary and Key Metrics (Unaudited) (In Thousands, Except Share Data and % )
 (In Thousands, Except Share Data and % )") Second Quarter Page 1 Financial Summary and Key Metrics (In Thousands, Except Share Data and % ) Second Quarter First Quarter Fourth Quarter Third Quarter Second Quarter Statement of Income Data Total
Second Quarter Page 1 Financial Summary and Key Metrics (In Thousands, Except Share Data and % ) Second Quarter First Quarter Fourth Quarter Third Quarter Second Quarter Statement of Income Data Total
The Goldman Sachs Group, Inc. PILLAR 3 DISCLOSURES
 The Goldman Sachs Group, Inc. PILLAR 3 DISCLOSURES For the period ended December 31, 2015 TABLE OF CONTENTS Page No. Index of Tables 1 Introduction 2 Regulatory Capital 5 Capital Structure 6 Risk-Weighted
Basel III Standardized Approach Disclosures
 Disclosures December 31, 2017 Table of Contents Introduction 1 Overview 1 Disclosure Matrix 3 Components of Capital 10 Capital Adequacy Standardized Risk-Weighted Assets 10 Capital Adequacy Capital Ratios
Basel III Standardized Approach Disclosures
 Disclosures September 30, 2017 Table of Contents Page No. Introduction 1 Background 1 Overview 1 Disclosure Matrix 3 Components of Capital 10 Capital Adequacy Standardized Risk-Weighted Assets 10 Capital
3Q 18 EARNINGS PRESENTATION
 3Q 18 EARNINGS PRESENTATION October 19, 2018 2018 SunTrust Banks, Inc. SunTrust is a federally registered trademark of SunTrust Banks, Inc. IMPORTANT CAUTIONARY STATEMENT This presentation should be read
EARNINGS RELEASE FINANCIAL SUPPLEMENT FIRST QUARTER 2018
 EARNINGS RELEASE FINANCIAL SUPPLEMENT FIRST QUARTER 2018 TABLE OF CONTENTS Page(s) Consolidated Results Consolidated Financial Highlights 2 3 Consolidated Statements of Income 4 Consolidated Balance Sheets
Wells Fargo & Company. Basel III Pillar 3 Regulatory Capital Disclosures
 Wells Fargo & Company Basel III Pillar 3 Regulatory Capital Disclosures For the quarter ended September 30, 2017 1 Table of Contents Disclosure Map... 3 Introduction... 6 Executive Summary... 6 Company
Wells Fargo & Company. Basel III Pillar 3 Regulatory Capital Disclosures
 Wells Fargo & Company Basel III Pillar 3 Regulatory Capital Disclosures For the quarter ended June 30, 2017 1 Table of Contents Disclosure Map... 3 Introduction... 6 Executive Summary... 6 Company Overview...
PEOPLE'S UNITED BANK, N.A Dodd-Frank Act Stress Test (DFAST) Disclosure. June 18, 2015
 Disclosure. June 18, 2015") PEOPLE'S UNITED BANK, N.A. 2015 Dodd-Frank Act Stress Test (DFAST) Disclosure June 18, 2015 1. Requirements for Dodd-Frank Stress Test In accordance with the Dodd-Frank Wall Street Reform and Consumer
PEOPLE'S UNITED BANK, N.A. 2015 Dodd-Frank Act Stress Test (DFAST) Disclosure June 18, 2015 1. Requirements for Dodd-Frank Stress Test In accordance with the Dodd-Frank Wall Street Reform and Consumer
Georgia Banking School
 GEORGIA BANKERS ASSOCIATION Georgia Banking School Asset/Liability Management I 2016 Georgia Banking School May 5, 2016 Rachel Woods, CFA Associate, ALM SunTrust Robinson Humphrey Important Disclosure
Wells Fargo & Company. Basel III Pillar 3 Regulatory Capital Disclosures
 Wells Fargo & Company Basel III Pillar 3 Regulatory Capital Disclosures For the quarter ended December 31, 2017 1 Table of Contents Disclosure Map... 3 Introduction... 5 Executive Summary... 5 Company
Schedule RC-R: Risk Based Capital Call Report Preparation under BASEL III
 2014 CliftonLarsonAllen LLP Schedule RC-R: Risk Based Capital Call Report Preparation under BASEL III CLAconnect.com Your Instructor: Amanda Garnett Amanda Garnett, CPA is a manager with the Financial
EARNINGS RELEASE FINANCIAL SUPPLEMENT FIRST QUARTER 2009
 EARNINGS RELEASE FINANCIAL SUPPLEMENT FIRST QUARTER 2009 TABLE OF CONTENTS Page Consolidated Results Consolidated Financial Highlights 2 Statements of Income 3 Consolidated Balance Sheets 4 Condensed Average
Dodd-Frank Act Company-Run Stress Test Disclosures
 Dodd-Frank Act Company-Run Stress Test Disclosures June 21, 2018 Table of Contents The PNC Financial Services Group, Inc. Table of Contents INTRODUCTION... 3 BACKGROUND... 3 2018 SUPERVISORY SEVERELY ADVERSE
1Q17 Quarterly Supplement
 1Q17 Quarterly Supplement April 13, 2017 2017 Wells Fargo & Company. All rights reserved. Table of contents 1Q17 Results Year-over-year results Retail Banking customer activity 1Q17 Highlights Page 2 Balance
PILLAR 3 DISCLOSURES
 The Goldman Sachs Group, Inc. December 2012 PILLAR 3 DISCLOSURES For the period ended June 30, 2014 TABLE OF CONTENTS Page No. Index of Tables 2 Introduction 3 Regulatory Capital 7 Capital Structure 8
Supplemental Financial Information For the Quarter Ended January 31, 2018 (unaudited)
") Supplemental Financial Information For the Quarter Ended January 31, 2018 Non-IFRS Measures 1 Highlights 2 Net Income and Comprehensive Income 3 Earnings Per Share, Non-IFRS Measures and Other Statistics
Supplemental Financial Information For the Quarter Ended January 31, 2018 Non-IFRS Measures 1 Highlights 2 Net Income and Comprehensive Income 3 Earnings Per Share, Non-IFRS Measures and Other Statistics
THIRD QUARTER 2018 FINANCIAL SUPPLEMENT
 THIRD QUARTER 2018 FINANCIAL SUPPLEMENT 1 FORWARD-LOOKING STATEMENTS AND ADDITIONAL INFORMATION This document and related communications should be read in conjunction with the financial statements, notes,
SECOND QUARTER 2018 FINANCIAL SUPPLEMENT
 SECOND QUARTER 2018 FINANCIAL SUPPLEMENT 1 FORWARD-LOOKING STATEMENTS AND ADDITIONAL INFORMATION This document and related communications should be read in conjunction with the financial statements, notes,
Supplemental Information First Quarter 2018
 Supplemental Information Current period information is preliminary and based on company data available at the time of the earnings presentation. It speaks only as of the particular date or dates included
Ally Financial Inc. 3Q 2018 Earnings Review
 Ally Financial Inc. 3Q 2018 Earnings Review October 25, 2018 Contact Ally Investor Relations at (866) 710-4623 or investor.relations@ally.com Forward-Looking Statements and Additional Information This
4Q 18 EARNINGS PRESENTATION
 4Q 18 EARNINGS PRESENTATION January 18, 2019 2019 SunTrust Banks, Inc. SunTrust is a federally registered trademark of SunTrust Banks, Inc. IMPORTANT CAUTIONARY STATEMENT This presentation should be read
IMPACT OF BASEL III ON COMMUNITY BANKS
 August 2012 InSIGHTS IMPACT OF BASEL III ON COMMUNITY BANKS www.equiasalliance.com IMPACT OF BASEL III ON COMMUNITY BANKS Table of Contents Introduction...1 Basel III NPR...2 New Capital Requirements...2
E RNIN I GS G S R EL E EA E SE S E F IN I ANCIA I L S U S PP P L P EM E E M N E T FIRST QUARTER
 EARNINGS RELEASE FINANCIAL SUPPLEMENT FIRST QUARTER 2011 TABLE OF CONTENTS Page(s) Consolidated Results Consolidated Financial Highlights 2-3 Statements of Income 4 Consolidated Balance Sheets 5 Condensed
Supplemental Financial Information For the Quarter Ended October 31, 2018 (unaudited)
") Supplemental Financial Information For the Quarter Ended October 31, 2018 Non-IFRS Measures 1 Highlights 2 Net Income and Comprehensive Income 3 Earnings Per Share, Non-IFRS Measures and Other Statistics
Supplemental Financial Information For the Quarter Ended October 31, 2018 Non-IFRS Measures 1 Highlights 2 Net Income and Comprehensive Income 3 Earnings Per Share, Non-IFRS Measures and Other Statistics
PILLAR 3 DISCLOSURES
 . The Goldman Sachs Group, Inc. December 2012 PILLAR 3 DISCLOSURES For the period ended December 31, 2014 TABLE OF CONTENTS Page No. Index of Tables 2 Introduction 3 Regulatory Capital 7 Capital Structure
KeyCorp. Third Quarter 2017 Earnings Review. Don Kimble Chief Financial Officer. Beth E. Mooney Chairman and Chief Executive Officer.
 KeyCorp Third Quarter 2017 Earnings Review October 19, 2017 Beth E. Mooney Chairman and Chief Executive Officer Don Kimble Chief Financial Officer FORWARD-LOOKING STATEMENTS AND ADDITIONAL INFORMATION
FPB FINANCIAL CORP. (OTCQB: FPBF), the Holding Company for Florida Parishes Bank, Announces Record 2018 First Quarter Results and Declares Dividends
, the Holding Company for Florida Parishes Bank, Announces Record 2018 First Quarter Results and Declares Dividends") Press Release: April 30, 2018 FOR IMMEDIATE RELEASE For More Information Contact: Fritz W. Anderson, II Chief Executive Officer, and Chairman, FPB Financial Corp. Chairman, Florida Parishes Bank (985)
Press Release: April 30, 2018 FOR IMMEDIATE RELEASE For More Information Contact: Fritz W. Anderson, II Chief Executive Officer, and Chairman, FPB Financial Corp. Chairman, Florida Parishes Bank (985)
CITIGROUP - QUARTERLY FINANCIAL DATA SUPPLEMENT
 CITIGROUP - QUARTERLY FINANCIAL DATA SUPPLEMENT 4Q17 Page Citigroup Consolidated Financial Summary 1 Consolidated Statement of Income 2 Consolidated Balance Sheet 3 Segment Detail Net Revenues 4 Income
Q Earnings Call April 26, 2017
 Q1 2017 Earnings Call April 26, 2017 Forward-Looking Statements Forward-Looking Statements: Certain of the statements made in this Release are forward-looking statements within the meaning and protections
Bank of Ocean City. Financial Statements. December 31, 2015
 Financial Statements December 31, 2015 Table of Contents Page Report of Independent Auditors 1 Financial Statements Balance Sheets 2 Statements of Income 3 Statements of Comprehensive Income 4 Statements
Capital Planning Under Basel III
 Capital Planning Under Basel III Thomas A. Farin Chairman of the Board tfarin@farin.com 1 FMS Capital Planning Workshop Charting your way through troubling waters 2 Capital Planning 3 Part Series Session
Contact: Alan Gulick Doug Lambert Corporate Communications Investor Relations (425) (212)
 (212)") MUFG Americas Holdings Corporation A member of MUFG, a global financial group FOR IMMEDIATE RELEASE (Tuesday, October 28, 2014) Contact: Alan Gulick Doug Lambert Corporate Communications Investor Relations
MUFG Americas Holdings Corporation A member of MUFG, a global financial group FOR IMMEDIATE RELEASE (Tuesday, October 28, 2014) Contact: Alan Gulick Doug Lambert Corporate Communications Investor Relations
Lakeland Financial Reports Record Performance Second Quarter Net Income Increases 31%
 NEWS FROM LAKELAND FINANCIAL CORPORATION FOR IMMEDIATE RELEASE Contact Lisa M. O Neill Executive Vice President and Chief Financial Officer (574) 267 9125 lisa.oneill@lakecitybank.com Lakeland Financial
The Goldman Sachs Group, Inc. PILLAR 3 DISCLOSURES
 The Goldman Sachs Group, Inc. PILLAR 3 DISCLOSURES For the period ended June 30, 2015 TABLE OF CONTENTS Page No. Index of Tables 1 Introduction 2 Regulatory Capital 5 Capital Structure 6 Risk-Weighted
LBC BANCSHARES,INC. AND SUBSIDIARY. Financial Statements December 31, 2014 and (with Independent Auditor s Report thereon)
") LBC BANCSHARES,INC. AND SUBSIDIARY Financial Statements December 31, 2014 and 2013 (with Independent Auditor s Report thereon) INDEPENDENT AUDITOR S REPORT To the Board of Directors and Stockholders LBC
LBC BANCSHARES,INC. AND SUBSIDIARY Financial Statements December 31, 2014 and 2013 (with Independent Auditor s Report thereon) INDEPENDENT AUDITOR S REPORT To the Board of Directors and Stockholders LBC
MUFG Americas Holdings Corporation A member of MUFG, a global financial group
 Press Release MUFG Americas Holdings Corporation A member of MUFG, a global financial group April 27, Press Contact: Alan Gulick (425) 423-7317 Investor Relations Doug Lambert (212) 782-5911 MUFG AMERICAS
Ben Franklin Financial, Inc Annual Report
 Ben Franklin Financial, Inc. 2017 Annual Report Ben Franklin Financial, Inc. Annual Report For the Year Ended December 31, 2017 Table of Contents Business... 1 Management s Discussion and Analysis of
Bank of Ocean City. Financial Statements. December 31, 2016
 Financial Statements December 31, 2016 Table of Contents Page Report of Independent Auditors 1 Financial Statements Balance Sheets 2 Statements of Income 3 Statements of Comprehensive Income 4 Statements
The Goldman Sachs Group, Inc. PILLAR 3 DISCLOSURES
 The Goldman Sachs Group, Inc. PILLAR 3 DISCLOSURES For the period ended September 30, 2016 TABLE OF CONTENTS Page No. Index of Tables 1 Introduction 2 Regulatory Capital 5 Capital Structure 6 Risk-Weighted
Bank Financial Statements
 5-1 Bank Financial Statements Report of Condition Balance Sheet Report of Income Income Statement Key Items on Bank Financial Statements 5-3 Report of Condition The Balance Sheet of a Bank Showing its
EARNINGS RELEASE FINANCIAL SUPPLEMENT SECOND QUARTER 2010
 EARNINGS RELEASE FINANCIAL SUPPLEMENT SECOND QUARTER 2010 TABLE OF CONTENTS Page(s) Consolidated Results Consolidated Financial Highlights 2-3 Statements of Income 4 Consolidated Balance Sheets 5 Condensed
EXHIBIT INFORMATION Financial Statements OFFERING
 EXHIBIT INFORMATION Financial Statements OFFERING Consolidated Financial Statements (with Independent Auditors Report) TABLE OF CONTENTS Independent Auditors Report... 1-2 Consolidated Financial Statements:
EARNINGS RELEASE FINANCIAL SUPPLEMENT (REVISED AS OF AUGUST 9, 2012) FIRST QUARTER 2012
 FIRST QUARTER 2012") EARNINGS RELEASE FINANCIAL SUPPLEMENT (REVISED AS OF AUGUST 9, 2012) FIRST QUARTER 2012 On August 9, 2012, JPMorgan Chase & Co. ( the Firm ) restated its previously-filed interim financial statements for
EARNINGS RELEASE FINANCIAL SUPPLEMENT (REVISED AS OF AUGUST 9, 2012) FIRST QUARTER 2012 On August 9, 2012, JPMorgan Chase & Co. ( the Firm ) restated its previously-filed interim financial statements for
4Q18 Quarterly Supplement
 4Q18 Quarterly Supplement January 15, 2019 2019 Wells Fargo & Company. All rights reserved. Table of contents 4Q18 Results 4Q18 Highlights Pages 2 4Q18 Earnings 3 2018 year-over-year results 4 Balance
Bank of Ocean City. Financial Statements. December 31, 2017
 Financial Statements December 31, 2017 Table of Contents Page Report of Independent Auditors 1 Financial Statements Balance Sheets 2 Statements of Income 3 Statements of Comprehensive Income 4 Statements
PILLAR 3 REGULATORY CAPITAL DISCLOSURES
 PILLAR 3 REGULATORY CAPITAL DISCLOSURES For the quarterly period ended Table of Contents Disclosure map 1 Introduction 2 Report overview 2 Basel III overview 2 Enterprise-wide risk management 3 Governance
Huntington Bancshares Incorporated. Basel III Regulatory Capital Disclosures March 31, 2016
 Huntington Bancshares Incorporated March 31, 2016 Glossary of Acronyms Acronym AFS ALLL C&I CAP CRE EAD GAAP HTM HVCRE ISDA MD&A MDB OTC PFE PSE RWA SSFA T-Bill T-Bond T-Note VIE Description Available
The PNC Financial Services Group, Inc. Basel III Pillar 3 Report: Standardized Approach June 30, 2015
 The PNC Financial Services Group, Inc. Basel III Pillar 3 Report: Standardized Approach June 30, 2015 Page References Pillar 3 Disclosure Description Pillar 3 Report June 30, 2015 Form 10-Q 2014 Form 10-K
Pillar 3 Regulatory Capital Disclosures Advanced Approaches. For the quarter ended March 31, 2017
 Pillar 3 Regulatory Capital Disclosures Advanced Approaches For the quarter ended March 31, 2017 TABLE OF CONTENTS DISCLOSURE MAP... 3 SCOPE OF APPLICATION... 4 CAPITAL STRUCTURE... 5 CAPITAL ADEQUACY...
Supplemental Financial Information
 Supplemental Financial Information For the First Quarter Ended January, 09 For further information, please contact: TD Investor Relations 6-08-900 www.td.com/investor Gillian Manning Head, Investor Relations
Huntington Bancshares Incorporated. Basel III Regulatory Capital Disclosures March 31, 2015
 March 31, 2015 Glossary of Acronyms Acronym AFS ALLL C&I CAP CRE EAD GAAP HTM HVCRE ISDA MD&A MDB OTC PSE RWA SSFA T-Bill T-Bond T-Note VIE Description Available For Sale Allowance for Loan and Lease Losses
Wells Fargo & Company. Basel III Pillar 3 Regulatory Capital Disclosures
 Wells Fargo & Company Basel III Pillar 3 Regulatory Disclosures For the quarter ended March 31, 2018 1 Table of Contents Disclosure Map Introduction Executive Summary Company Overview Basel III Overview
UNITED STATES SECURITIES AND EXCHANGE COMMISSION Washington D.C FORM 10-Q
 UNITED STATES SECURITIES AND EXCHANGE COMMISSION Washington D.C. 20549 FORM 10-Q (Mark One) [X] QUARTERLY REPORT UNDER SECTION 13 OR 15(d) OF THE SECURITIES EXCHANGE ACT OF 1934 For the quarterly period
BNY Mellon Third Quarter 2017 Financial Highlights
 BNY Mellon Third Quarter 2017 Financial Highlights October 19, 2017 Cautionary Statement A number of statements in the accompanying slides and the responses to your questions are forward-looking statements.
Supplemental Information First Quarter 2016
 Supplemental Information This information is preliminary and based on company data available at the time of the earnings presentation. It speaks only as of the particular date or dates included in the
TOUCHMARK BANCSHARES, INC.
 TOUCHMARK BANCSHARES, INC. AND SUBSIDIARY Consolidated Financial Statements December 31, 2017 and 2016 (with Independent Auditor s Report thereon) To the Board of Directors and Stockholders Touchmark Bancshares,