Geberit Group Summary Report
|
|
|
- Clementine Collins
- 5 years ago
- Views:
Transcription
1 Geberit Group 2016 Summary Report

2 Geberit abstains from printing in a full-length version of the annual report and makes the most of multimedia instead. Detailed information available anytime and anywhere can be found online: interactive financial tables analysis tools videos and photo galleries
3 Key Figures in CHF million Net sales 2,809.0 Change in % +8.3 Adjusted operating cashflow (EBITDA) Change in % Margin in % of net sales 28.3 Adjusted operating profit (EBIT) Change in % Margin in % of net sales 24.4 Adjusted net income Change in % Margin in % of net sales 20.8 Adjusted earnings per share (CHF) Change in % Free cashflow Change in % Net debt Equity 1,635.2 Equity ratio in % 45.4 Adjusted return on invested capital (ROIC) in % 21.5 Number of employees 11,592
4 Main developments in 2016 Net sales % organic, currency-adjusted growth Adjusted earnings per share (in CHF) % versus prior year Company Sanitec integration proceeding according to plan Capacity expansion at the logistics centre in Pfullendorf (DE) on track Share price with new all-time high of CHF 434 Consolidation of the position as the leading supplier of sanitary products in Europe Sale of the Koralle Group Products New innovative products such as the building drainage system Silent-Pro, the new urinal system and the bathroom series Glow Finance Increase in net sales of 6.4% in organic, currency-adjusted terms Adjusted operating cashflow margin of 28.3% (previous year 26.7%) Adjusted earnings per share of CHF (+19.8%) Free cashflow of CHF million (+16.5%) Dividend increase of 19.0% to CHF proposed
5 At a glance Net sales development (in CHF million) EBIT, EBITDA, Net income Earnings per share (EPS) (in CHF million) (EPS: in CHF) * 16* 1 EBIT 2 EBITDA 3 Net income 4 EPS * Adjusted for acquisition, divestment and integration costs and income in connection with the Sanitec acquisition net sales by markets/regions 1 Germany (30.7%) 2 Nordic Countries (10.9%) 3 Switzerland (10.0%) 4 Central/Eastern Europe (9.1%) 5 Benelux (7.8%) 6 Italy (6.6%) 7 France (6.1%) 8 Austria (5.2%) 9 United Kingdom/Ireland (4.4%) 10 Iberian Peninsula (0.7%) 11 America (3.3%) 12 Far East/Pacific (2.8%) 13 Middle East/Africa (2.4%)
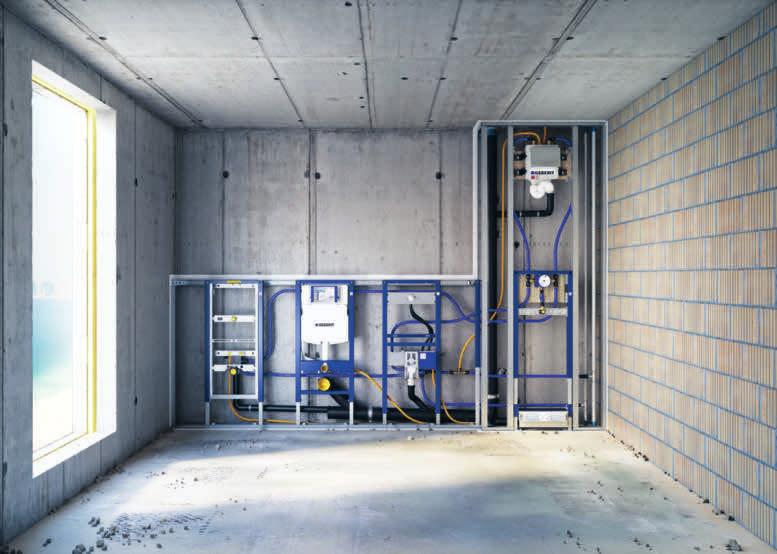
6 Added value by design The name Geberit stands for superior sanitary technology and perfectly designed bathroom equipment. Geberit is a system provider. In other words, every product is developed and optimised within its overall context. This applies to the sanitary technology behind the wall such as installation, piping and flushing systems as well as to the products in front of the wall, such as the bathroom series with their ceramic sanitary appliances, bathroom furniture, mirror cabinets and so on. This systems thinking is based on decades of experience and the know-how of proven specialists and scientists. No other company in the sanitary industry invests as many resources in the research and development of new technologies and products each year as Geberit. Learn more: Competences

7
8 To our shareholders The 2016 financial year was shaped by a positive environment in the construction industry and the integration of the ceramics business. The sales growth was attributable to convincing developments in many markets and to sales synergies from the integration of the ceramics business that were achieved earlier than expected. The very good development of the operating margins was supported by synergies derived from the integration of the Sanitec business, volume growth and lower raw material prices. The excellent results allowed Geberit to further consolidate the position as the leading supplier of sanitary products in Europe. Convincing developments in European markets Cumulative net sales in 2016 increased by 8.3% to CHF 2,809.0 million. Total growth comprised organic growth in local currencies of 6.4%, a foreign currency effect of +0.7% and an acquisition- and divestment-related increase of 1.2%. The following changes in net sales in the markets and product areas relate to currencyadjusted, organic developments. The biggest region, Europe, grew by 6.8%. Austria (+12.3%), the Nordic Countries (+11.1%) and Central/Eastern Europe (+10.4%) posted double-digit growth. The other European markets/countries also reported convincing growth, with +7.9% for the Benelux Countries, +6.5% for the Iberian Peninsula, +6.4% for Switzerland, +5.4% for United Kingdom/Ireland, +4.8% for France, +4.7% for Germany and +3.9% for Italy. Far East/Pacific (+4.3%), Middle East/Africa (+3.5%) and America (+0.2%) posted below-average growth compared to the European markets. Net sales for the Sanitary Systems product area amounted to CHF 1,263.5 million, corresponding to growth of 9.2%. The Piping Systems product area recorded an increase of 2.5% to CHF million. As in the previous year, growth for this product area lagged behind Sanitary Systems. The Sanitary Ceramics product area posted growth of 6.5% to CHF million. Measured for the year as a whole (inclusive of Sanitec s sales for January 2016), currency-adjusted growth was 4.9%. Improved profitability In the 2016 financial year, the results of the Geberit Group were once again impacted by acquisition, divestment and integration costs, and income related to the Sanitec acquisition albeit much lower than in the previous year. For better comparability, adjusted figures are shown and commented on. The adjusted operating cashflow (adj. EBITDA) rose by 14.6% to CHF million, its highest ever level in Geberit s history. The adjusted EBITDA margin came to 28.3% compared with 26.7% in the previous year. Foreign currency developments did not have any material impact on the adjusted EBITDA margin. The adjusted operating profit (adj. EBIT) rose by 16.2% to CHF million, and the adjusted EBIT margin reached 24.4% (previous year 22.8%). The very good devel- 4
9 opment of the operating margins was supported by synergies derived from the integration of the Sanitec business, volume growth and in spite of an increase in the second half of the year lower raw material prices. Adjusted net income improved by 18.4% to CHF million, which led to an adjusted return on sales of 20.8% (previous year 19.0%). The adjusted earnings per share were up by 19.8% to CHF (previous year CHF 13.23). This above-average increase when compared with the operating results is explained by an improved financial result and a slightly smaller number of shares. The negative special effects arising from the Sanitec acquisition/integration amounted to CHF 10 million as regards EBITDA, CHF 46 million as regards EBIT, and CHF 36 million as regards net income. The non-adjusted figures were CHF million for EBITDA, CHF million for EBIT, CHF million for net income, and CHF for earnings per share. Increase in free cashflow The considerably higher operating cashflow (EBITDA) and an improved financial result on the one hand and higher absolute tax expenditure on the other led to an increase in net cashflow of 17.2% to CHF million. A slight decline in the investments in pro perty, plant and equipment and negative effects of the change in net working capital resulted in an increase in free cashflow of 16.5% to CHF million. Free cashflow was used to pay distributions of CHF million to shareholders, to repay debts of net CHF million and, as part of the last phase of the share buyback programme, to buy back shares for CHF 50.7 million. Solid financial foundation Once again, the substantial contribution from free cashflow allowed the attractive dividend policy and the share buyback programme to be continued while also maintaining the very healthy financial foundation of the Group. Total assets increased from CHF 3,553.8 million to CHF 3,601.1 million. Liquid funds increased from CHF million to CHF million. In addition, the Group had access to undrawn operating credit lines for the operating business of CHF million. Debts were reduced to CHF million (previous year CHF 1,139.2 million). This resulted in a reduction in net debt by CHF million to CHF million at the end of The equity ratio reached a very solid 45.4% (previous year 41.7%). Based on average equity, the adjusted return on equity (ROE) was 38.3% (previous year 32.2%). The adjusted return on invested capital (ROIC) was 21.5% (previous year 20.1%). Again higher distribution The Board of Directors wishes to let the shareholders participate in the excellent development of the business and will maintain the attractive distribution policy of previous years. Therefore, a dividend of CHF will be proposed at the General Meeting, which is 19.0% higher than in the previous year. The payout ratio of 63.4% of adjusted net income is in the upper range of the 50% to 70% corridor defined by the Board of Directors. 5
10 Slightly lower investments In 2016, investments in property, plant and equipment and intangible assets amounted to CHF million, CHF 8.2 million or 5.6% less than in the previous year. As a percentage of net sales, the investment ratio was 5.0% (previous year 5.7%). All larger investment projects were carried out as planned. The bulk of investments went toward machinery, building conversions and new building projects, and the procurement of tools and moulds for new products. The biggest project was the expansion of the Logistics Centre in Pfullendorf (DE), which will commence operations in spring Additionally, investments were made in important development projects and the further optimisation of production processes. Decreasing number of employees At the end of 2016, the Geberit Group employed 11,592 staff worldwide, which is 534 employees or 4.4% less than in the previous year. This is mainly due to fewer people employed in the ceramics plants, synergies as a result of the consolidation of functions and efficiency-enhancing measures, as well as the sale of the Koralle Group. Outlook 2017 The construction industry should develop favourably in However, the individual regions/markets and construction sectors will carry on performing very differently. In Europe, the recovery that began in the previous year should continue. Overall, a favour able market environment is expected for Germany, the Nordic Countries, Switzerland, Austria, France, the Benelux Countries and the countries of Eastern Europe. The situation in Italy should stabilise, while the uncertainty in the United Kingdom will continue as a result of Brexit. In North America, stagnation is predicted in the public sector construction industry, which is important to Geberit s business in the USA, along with moderate growth in residential construction. In the Far East/ Pacific region, the Chinese residential con struction sector should stabilise, while the business climate in Australia and India is expected to be positive. In terms of the Middle East/Africa region, the outlook in South Africa remains sound, whereas the construction industry in the Gulf countries will continue to see low activity due to the depressed oil price. Fluctuations in the Swiss francs compared to other important currencies used by the Geberit Group will continue to affect sales and earnings. In the first half of 2017, raw material prices are likely to exceed their prior-year level driven mainly by higher prices for industrial metals and, to a lesser extent, for plastics. The Geberit Group s 2017 financial year will see further progress with the integration of the ceramics business. A focus will be on continuing to consolidate the sales teams in the countries; another emphasis will be on the further harmonisation of systems and processes, further development of the product range, and continuous improvements in the ceramics manufacturing. However, Geberit will pay just as much attention to its daily business. The objective will be to perform strongly in all markets and, as in previous 6
11 years, to gain market shares. There will be concerted marketing of the new products that have been introduced in recent years, focusing on greater penetration of markets in which Geberit products or technologies are still under-represented, and on further expansion of the very promising shower toilet business. In line with the Geberit strategy, these measures shall be accompanied by efforts to continuously optimise business processes. The Board of Directors and the Group Executive Board are convinced that the company is very well equipped for the upcoming opportunities and challenges. The opportunities offered as a result of combining technical know-how in sanitary technology behind the wall and design expertise in front of the wall will be firmly seized. Experienced and highly motivated employees, a number of promising products that have been launched in recent years and product ideas for the more distant future, a lean and market-oriented organisation, an established cooperation based on trust with our market partners in both commerce and trade, and the Group s continued solid financial foundation are vital to our future success. we also wish to express our gratitude, esteemed shareholders, for your continued confidence in our company. Yours sincerely, Albert M. Baehny Chairman Christian Buhl CEO Thank you We owe the good results in 2016 and the successful integration of the Sanitec activities to the high degree of motivation and professionalism of our employees. We wish to express our thanks and appreciation for their exemplary performance. Our customers in the commercial and trade sectors again deserve special thanks for their trust and constructive collaboration. Last but not least, 7
12 Consolidated Balance Sheets Assets Current assets Cash and cash equivalents Trade accounts receivable Other current assets and current financial assets Inventories Total current assets ,070.7 Non-current assets Property, plant and equipment Deferred tax assets Other non-current assets and non-current financial assets Goodwill and intangible assets 1, ,681.1 Total non-current assets 2, ,530.4 Total assets 3, ,
13 Liabilities and equity Current liabilities Short-term debt Trade accounts payable Tax liabilities and tax provisions Other current liabilities Current provisions Total current liabilities Non-current liabilities Long-term debt 1, Accrued pension obligations Deferred tax liabilities Other non-current liabilities Non-current provisions Total non-current liabilities 1, ,428.2 Equity Capital stock Reserves 1, ,084.9 Cumulative translation adjustments Total equity 1, ,635.2 Total liabilities and equity 3, ,
14 Consolidated Income Statements Net sales 2, ,809.0 Cost of materials Personnel expenses Depreciation Amortisation of intangible assets Other operating expenses, net Total operating expenses, net 2, ,168.9 Operating profit (EBIT) Financial expenses Financial income Foreign exchange loss (-)/gain Financial result, net Profit before income tax expenses Income tax expenses Net income Attributable to shareholders of Geberit AG EPS (CHF) EPS diluted (CHF)
15 Consolidated Statements of Comprehensive Income Net income according to the income statement Cumulative translation adjustments Taxes Cumulative translation adjustments, net of tax Cashflow hedge accounting Taxes Cashflow hedge accounting, net of tax Total other comprehensive income to be reclassified to the income statement in subsequent periods, net of tax Remeasurements of pension plans Taxes Remeasurements of pension plans, net of tax Total other comprehensive income not to be reclassified to the income statement in subsequent periods, net of tax Total other comprehensive income, net of tax Total comprehensive income Attributable to shareholders of Geberit AG : The Swiss National Bank abandoned the minimum exchange rate of CHF 1.20 per euro on 15 January This decision triggered currency fluctuations and led to an appreciation of the Swiss franc against all other key currencies. As Geberit is exposed to currency risks on both the assets and liabilities side, this contributed significantly to the negative translation effect of CHF million. 11
16 Consolidated Statements of Cashflows Cash provided by operating activities Net income Depreciation and amortisation Financial result, net Income tax expenses Other non-cash income and expenses Operating cashflow before changes in net working capital and taxes Income taxes paid Changes in trade accounts receivable Changes in inventories Changes in trade accounts payable Changes in other positions of net working capital Net cash from/used (-) in operating activities Cash from/used (-) in investing activities Acquisitions of subsidiaries -1, Sales of subsidiaries Purchase of property, plant & equipment and intangible assets Proceeds from sale of property, plant & equipment and intangible assets Interest received Other, net Net cash from/used (-) in investing activities -1,
17 Cash from/used (-) in financing activities Proceeds from borrowings 1, Repayments of borrowings -1, Interest paid Distribution Share buyback programme Purchase (-)/Sale of treasury shares Financing cost paid Other, net Net cash from/used (-) in financing activities Effects of exchange rates on cash and cash equivalents Net increase/decrease (-) in cash and cash equivalents Cash and cash equivalents at beginning of year Cash and cash equivalents at end of year
18 Consolidated Statements of Changes in Equity Ordinary shares Attributable to shareholders of Geberit AG Reserves Treasury shares Pension plans Hedge accounting Cum. transl. adjustments Total equity Balance at , ,717.1 Net income Other comprehensive income Distribution Share buyback programme Purchase (-) /Sale of treasury shares Management option plans Balance at , ,482.2 Net income Other comprehensive income Distribution Share buyback programme Purchase (-) /Sale of treasury shares Capital reduction Management option plans Balance at , ,
19 This page has been intentionally left blank. 15
20 Balance Sheets Geberit AG Assets Current assets Cash Accounts receivable Prepaid expenses Total current assets Non-current assets Loan to group companies Investments Total non-current assets 1, ,296.9 Total assets 1, ,321.5 Liabilities Current liabilities Total current liabilities Bonds Total long term interest-bearing liabilities Shareholders equity Capital stock Legal reserves Free reserves Treasury shares Retained earnings Total shareholders equity ,014.5 Total liabilities and shareholders equity 1, ,
21 Income Statements Geberit AG Income Dividends from Group companies Financial income and other operating income Total income Expenses Administrative expenses Financial expenses Direct tax expenses Total expenses Net income
22 Appropriation of available earnings of Geberit AG Proposal by the Board of Directors to the General Meeting: CHF CHF Available earnings Net income 300,924, ,770,714 Withdrawal from free reserves 10,000,000 0 Balance brought forward 4,036,493 3,812,822 Total available earnings 314,960, ,583,536 Transfer to free reserves 0 20,000,000 Proposed/paid dividend 311,147, ,414,270 Balance to be carried forward 3,812,822 3,169,266 Total appropriation of available earnings 314,960, ,583,536 18
23 Time schedule Ordinary General Meeting Dividend payment Interim report first quarter Half-year report Interim report third quarter April 11 April 2 May 17 August 31 October First information on the year 2017 Results full year 2017 Ordinary General Meeting Dividend payment Interim report first quarter January 13 March 4 April 10 April 3 May Subject to minor changes 19
24 This summary report and the online annual report 2016 are published in English and German. The German online version of the annual report is binding. The consolidated financial statements of the Geberit Group are created in accordance with the International Financial Reporting Standards (IFRS). Additional information is available at > financial report. The statements in this review relating to matters that are not historical facts are forward-looking statements that are not guarantees of future performance and involve risks and uncertainties, including but not limited to: future global economic conditions, foreign exchange rates, regu - la tory rules, market conditions, the actions of competitors and other factors beyond the control of the company. 20
25
26 Geberit AG Schachenstrasse 77 CH-8645 Jona T corporate.communications@geberit.com
Geberit Group Summary Report
 Geberit Group 2014 Summary Report Geberit abstains from printing in a full-length version of the annual report and makes the most of multimedia instead. Detailed information available anytime and anywhere
Geberit Group Summary Report
 Geberit Group 2013 Summary Report For reasons of sustainability and due to the increasing importance of electronic media, Geberit has decided no longer to print the Annual Report in its entirety. In our
Geberit Group Half-Year Report
 Geberit Group 2017 Half-Year Report Net sales + 2.8% Currency-adjusted growth in organic terms Adjusted operating cashflow (EBITDA) -1.6% versus prior year Adjusted earnings per share -3.9% versus prior
Half-Year Report Geberit Group
 Half-Year Report 2007 Geberit Group 1 Key Figures First Half of 2007 MCHF Sales 1,311.2 Change in % +20.8 Operating profi t (EBIT) 305.3 Change in % +17.2 Margin in % 23.3 Net income 227.8 Change in %
H Results. Christian Buhl, CEO Roland Iff, CFO August 14, 2018
 H1 2018 Results Christian Buhl, CEO Roland Iff, CFO August 14, 2018 Agenda H1 2018 at a glance Building industry outlook 2018 Outlook 2018 SLIDE 2 Successful first half of 2018 with strong earnings growth
9M 2018 Results. Christian Buhl, CEO Roland Iff, CFO October 30, 2018
 9M 2018 Results Christian Buhl, CEO Roland Iff, CFO October 30, 2018 Agenda Q3 2018 key figures 9 months 2018 results Building industry outlook Outlook SLIDE 2 Q3 2018 results Sales growth (reported) Sales
Half-Year Report 2009
 Half-Year Report 2009 Key Figures First Half of2009 Sales 1,099.1 Change in% -14.9 Operating cashflow (EBITDA) 307.8 Change in% -15.5 Margin in % 28.0 Operating profit (EBIT) 267.5 Change in% -17.6 Margin
Analyst conference. Full year review Christian Buhl, CEO Roland Iff, CFO March 13, 2018
 Analyst conference Full year review 2017 Christian Buhl, CEO Roland Iff, CFO March 13, 2018 Agenda Review Sales development Financial Results Sanitec integration Building construction outlook Geberit outlook
SEMI-ANNUAL REPORT JANUARY JUNE 2017
 SEMI-ANNUAL REPORT JANUARY JUNE 2017 LETTER TO SHAREHOLDERS - 2 LETTER TO SHAREHOLDERS Market share gains in strategically important markets Group s organic growth +3.6%, excluding Russell Stover +6.6%
Half-Year Report 2010
 Half-Year Report 2010 Hügli Holding AG, Steinach Key figures in brief million CHF Jan.-June Variance in Jan.-June Key figures of the group 2010 CHF local currency 2009 Sales 196.0 1.6% 4.6% 192.9 Operating
First semester. Letter to Shareholders Your Swiss insurer.
 First semester Letter to Shareholders 2016 Your Swiss insurer. 30.6.2016 31.12.2015 30.6.2015 Key share data Helvetia Holding AG Group underlying earnings per share in CHF 22.9 42.1 20.5 Group profit for
Interim Financial Report as at 31 March 2018
 Interim Financial Report as at 31 March 2018 Interim Report as at 31 March 2018 TRANSLATION FROM THE ORIGINAL ITALIAN TEXT INDEX PREFACE... 4 INTERIM MANAGEMENT REPORT AS AT 31 MARCH 2018... 5 CHANGES
highlights key figures dividend outlook organic revenue growth +5% earnings per share +16% continued investments in growth and innovations
 organic revenue growth +5% earnings per share +16% continued investments in growth and innovations Utrecht, 26 February 2019 highlights revenue +2% to EUR 2,759 million (organic +5%) operating profit (EBITA)
Interim Financial Report as at 30 September 2017
 Interim Financial Report as at 30 September 2017 Interim Report as at 30 September 2017 TRANSLATION FROM THE ORIGINAL ITALIAN TEXT INDEX PREFACE... 4 INTERIM MANAGEMENT REPORT AS AT 30 SEPTEMBER 2017...
Facts and figures. Interim Report as of June 30, 2017
 Facts and figures. Interim Report as of June 30, 2017 2 Key figures as of June 30, 2017 3 Sustained growth and improved results 5 Consolidated interim financial statements 8 Notes to the consolidated interim
GEBERIT GROUP FINANCIAL REPORT 2018
 GEBERIT GROUP FINANCIAL REPORT 2018 FINANCIAL REPORT GEBERIT GROUP 2018 CONSOLIDATED BALANCE SHEETS Note 31.12.2018 31.12.2017 Assets Current assets Cash and cash equivalents 282.2 412.7 Trade accounts
Sales Operating profit Operating profit margin (%) Net income EBITDA
 Net income EBITDA") Half-Year Report 2 A Successful New Start Givaudan was successfully spun off from Roche on 8 June 2 and Givaudan s shares were floated and listed on the Swiss Stock exchange. In the first half-year 2,
Half-Year Report 2 A Successful New Start Givaudan was successfully spun off from Roche on 8 June 2 and Givaudan s shares were floated and listed on the Swiss Stock exchange. In the first half-year 2,
Adecco maintains strong double-digit revenue growth in Q1
 Adecco maintains strong double-digit revenue growth in Q1 Solid EBITA margin progression as profitable growth remains key focus Q1 HIGHLIGHTS (Q1 2011 versus Q1 2010) Revenues of EUR 4.9 billion, up 24%
Half year financial report
 Half year financial report Six-month period ended June 30, 2016 Condensed Consolidated Financial Statements Management Report CEO Attestation Statutory Auditors Review Report Table of contents Condensed
Media release. Winterthur, March 18, 2015 Page 1/7
 Media release Rieter Holding Ltd. Klosterstrasse 32 P.O. Box CH-8406 Winterthur T +41 52 208 71 71 F +41 52 208 70 60 www.rieter.com Winterthur, March 18, 2015 Page 1/7 2014 financial year: double-digit
INTERIM FINANCIAL REPORT Third quarter 2013 Company Announcement No. 521
 INTERIM FINANCIAL REPORT Third quarter 2013 Company Announcement No. 521 29 October 2013 Selected financial and operating data for the period 1 January - 30 September 2013 Q3 2013 Q3 2012 YTD 2013 YTD
HALF-YEAR REPORT Bobst Group SA
 HALF-YEAR REPORT 2017 Bobst Group SA Bobst Group SA Half-year report 2017 KEY FIGURES In million CHF June 2017 June 2016 June 2015 Sales 643.2 600.4 524.7 Operating result (EBIT) 39.8 18.0 14.7 In % of
INTERIM REPORT FIRST HALF YEAR
 INTERIM REPORT 2008 FIRST HALF YEAR Contents 3 Letter to shareholders 7 Interim consolidated balance sheet 8 Interim consolidated income statement 9 Interim consolidated statement of changes in shareholders
INTERIM FINANCIAL REPORT Third quarter 2014 Company Announcement No. 568
 INTERIM FINANCIAL REPORT Third quarter 2014 Company Announcement No. 568 29 October 2014 Selected financial and operating data for the period 1 January - 30 September 2014 (DKKm) Q3 2014 Q3 2013 YTD 2014
Adecco delivers on gross margin improvements and cost cuts
 Adecco delivers on gross margin improvements and cost cuts Despite weak topline net profit remains in the black and operating cash flow is robust Q1 HIGHLIGHTS (Q1 2009 versus Q1 2008) Revenues of EUR
Net income for the period % %
 QUARTERLY STATEMENT Q3 2018 Key figures KION Group overview in million Q3 2018 Q3 2017 * Change Q1 Q3 2018 Q1 Q3 2017 * Change Order intake 2,060.3 1,847.2 11.5% 6,369.3 5,699.5 11.8% Revenue 1,895.9 1,832.4
Content. 3 Letter to the Shareholders 4 Overview 6 Key Figures. 7 Management Report. 10 Mikron Automation. 12 Mikron Machining
 Semiannual Report 2018 Content 3 Letter to the Shareholders 4 Overview 6 Key Figures 7 Management Report 10 Mikron Automation 12 Mikron Machining 14 Semiannual Financial Statements 2018 14 Income statement
Adjusted earnings per share were 54.1p (2016: 58.8p). Statutory results. Underlying. growth
. Statutory results. Underlying. growth") 34 Pearson plc Annual report and accounts We expect ongoing headwinds in our US higher education courseware business to be offset by improving conditions in our other businesses. Coram Williams Chief Financial
34 Pearson plc Annual report and accounts We expect ongoing headwinds in our US higher education courseware business to be offset by improving conditions in our other businesses. Coram Williams Chief Financial
Financial report to 31 March 2010
 Dear shareholder, After the crisis year 2009, which tipped Germany and the entire global economy into the deepest recession in the post-war period, the effects are still being felt by the Einhell Group.
Facts and figures. Interim Report as of June 30, 2018
 Facts and figures. Interim Report as of June 30, 2018 2 Key figures as of June 30, 2018 4 Balanced growth 6 Consolidated interim financial statements 10 Notes to the consolidated interim financial statements
Interim Report. January September NIVEA Deodorant: Successful worldwide.
 Interim Report January September 2010 NIVEA Deodorant: Successful worldwide. 2 contents highlights in the third quarter Contents 03 Business Developments Overview 04 Segment Overview 05 Beiersdorf s Shares
11% 10% Operating result (EBIT) EBIT margin in % Equity and equity ratio in EUR millions and in % % 56% 39% Equity Equity ratio in %
 EBIT margin in % Equity and equity ratio in EUR millions and in % % 56% 39% Equity Equity ratio in %") 2017 Interim Report Kardex Group at a glance Net revenues 1.1.-30.6. in EUR millions Operating result (EBIT) and EBIT margin 1.1.-30.6. in EUR millions and in % 200 25 160 20 11% 11% 120 80 15 10 7% 8%
2017 Interim Report Kardex Group at a glance Net revenues 1.1.-30.6. in EUR millions Operating result (EBIT) and EBIT margin 1.1.-30.6. in EUR millions and in % 200 25 160 20 11% 11% 120 80 15 10 7% 8%
Consolidated Financial Results for the Fiscal Year Ended March 31, 2017 [Japanese GAAP]
![Consolidated Financial Results for the Fiscal Year Ended March 31, 2017 [Japanese GAAP]](/thumbs/95/125130905.jpg "Consolidated Financial Results for the Fiscal Year Ended March 31, 2017 [Japanese GAAP]") Consolidated Financial Results for the Fiscal Year Ended March 31, 2017 [Japanese GAAP] Company name: TOA Corporation Stock exchange listing: Tokyo Stock Exchange Code number: 6809 URL: http://www.toa.co.jp/
Consolidated Financial Results for the Fiscal Year Ended March 31, 2017 [Japanese GAAP] Company name: TOA Corporation Stock exchange listing: Tokyo Stock Exchange Code number: 6809 URL: http://www.toa.co.jp/
Half-Year Report 2017
 Half-Year Report Think Asia. Think DKSH. Contents Key figures 3 Interim consolidated financial statements Interim consolidated income statement 4 Interim consolidated statement of comprehensive income
Q2 net income of $126 million
 Q2 net income of $126 million n EBIT up 16 percent to $371 million on strong operational performance, despite a number of special charges n Group orders grew 8 percent, revenues 10 percent n Cash fl ow
INTERIM FINANCIAL REPORT First quarter 2013 Company Announcement No. 493
 INTERIM FINANCIAL REPORT First quarter 2013 Company Announcement No. 493 30 April 2013 Selected financial and operating data for the period 1 January 31 March 2013 2013 2012 Revenue 10,981 10,819 Gross
Burckhardt Compression: growth in both divisions, operating income within guidance
 Burckhardt Compression Holding AG Im Link 5, 8404 Winterthur, Switzerland Tel.: +41 52 262 55 00 www.burckhardtcompression.com Page 1/9 Media Release of Burckhardt Compression: growth in both divisions,
WAVIN GROUP REPORTS STRONG INCREASE IN REVENUE AND OPERATING RESULTS IN FIRST HALF YEAR 2007
 WAVIN GROUP REPORTS STRONG INCREASE IN REVENUE AND OPERATING RESULTS IN FIRST HALF YEAR 2007 Zwolle, 6 September 2007 Wavin N.V., leading supplier of plastic pipe systems and solutions in Europe, today
STATEMENT JANUARY TO MARCH 2018
 QUARTERLY STATEMENT JANUARY TO MARCH 2018 A good first quarter Organic sales growth (5 percent) thanks to higher volumes (1 percent) and prices (4 percent) Overall, sales grew by 1 percent to 3.7 billion
INTERIM FINANCIAL REPORT H Company Announcement No. 556
 INTERIM FINANCIAL REPORT H1 2014 Company Announcement No. 556 30 July 2014 Selected financial and operating data for the period 1 January - 30 June 2014 (DKKm) Q2 2014 Q2 2013 YTD 2014 YTD 2013 Net revenue
INTERIM FINANCIAL REPORT First quarter 2016 Company announcement No. 634
 INTERIM FINANCIAL REPORT First quarter 2016 Company announcement No. 634 12 May 2016 Selected financial and operating data for the period 1 January 31 March 2016 (DKKm) Q1 2016 Q1 2015 Net revenue 15,319
INTERIM REPORT FOURTH QUARTER 2017 PANDORA REPORTS 15% REVENUE GROWTH IN LOCAL CURRENCY FOR 2017 AND 37.3% EBITDA MARGIN
 PANDORA A/S Havneholmen 17-19 DK-1561 Copenhagen V Denmark Tel. +45 3672 0044 www.pandoragroup.com CVR: 28 50 51 16 No. 431 COMPANY ANNOUNCEMENT 6 February 2018 INTERIM REPORT FOURTH QUARTER 2017 PANDORA
January 1 to March 31. Interim Report January to March 2004
 25 26 27 January 1 to March 31 Interim Report 24 First Quarter 24 Linde Financial Highlights 24 23 Change Year 23 Share Closing price 43.9 29.15 47.8% 42.7 3 month high 45.9 36.69 25.1% 43.4 3 month low
Uponor Corporation Stock exchange release 3 Aug :00 JANUARY-JUNE 2006: UPONOR REPORTS CONTINUED STRONG DEVELOPMENT
 Uponor Corporation Stock exchange release 3 Aug. 11:00 JANUARY-JUNE : UPONOR REPORTS CONTINUED STRONG DEVELOPMENT - Net sales and results remained strong in the second quarter - Net sales (January-June)
Dear Shareholders, The Tecan Group closed the first half of 2015 with double-digit sales growth and record net profit.
 Interim Report 2015 Contents 3 Letter to the Shareholders 6 Interim consolidated statement of profit or loss 7 Interim consolidated balance sheet 8 Interim consolidated statement of cash flows 9 Interim
Adecco continues to deliver double-digit revenue growth
 Adecco continues to deliver double-digit revenue growth The EBITA margin improves to 3.9% and cost control is strongly maintained Q2 HIGHLIGHTS (Q2 2011 versus Q2 2010) Revenues of EUR 5.2 billion, up
1 STATUS REPORT ECONOMIC ENVIRONMENT
 Status Report 217 1 STATUS REPORT ECONOMIC ENVIRONMENT In 217, Kuehne + Nagel expanded its global leading position in Seafreight with 4.4 million TEUs managed in container traffic. The Group confirmed
Financial Review NINE MONTHS / THIRD QUARTER. 29 October Rothausstrasse Muttenz Switzerland CLARIANT INTERNATIONAL LTD
 Financial Review NINE MONTHS / THIRD QUARTER CLARIANT INTERNATIONAL LTD Rothausstrasse 61 4132 Muttenz Switzerland Page 1 of 21 Key Financial Group Figures Continuing operations: Nine Months Third Quarter
Driving profitable growth
 Mid-Year Report 2017 Driving profitable growth Key figures as of 30 June 2017 Sales in CHF million 1 992 EBIT in CHF million Net profit in CHF million 1 863 1 802 168 42% GF Piping Systems 826 CHF million
Consolidated Statement of Profit or Loss (in million Euro)
") Consolidated Statement of Profit or Loss (in million Euro) Q3 2015 Q3 2016 % change 9m 2015 9m 2016 % change Revenue 661 625-5.4% 1,974 1,873-5.1% Cost of sales (453) (415) -8.4% (1,340) (1,239) -7.5%
Consolidated Statement of Profit or Loss (in million Euro) Q3 2015 Q3 2016 % change 9m 2015 9m 2016 % change Revenue 661 625-5.4% 1,974 1,873-5.1% Cost of sales (453) (415) -8.4% (1,340) (1,239) -7.5%
Interim management statement
 Interim management statement 1st to 3rd quarter of 2017 FIRST TO THIRD QUARTER AT A GLANCE DEUTZ Group: Overview 7 9/2017 7 9/2016 1 9/2017 1 9/2016 New orders 370.8 258.1 1,173.8 935.3 Unit sales (units)
Consolidated Statement of Profit or Loss (in million Euro)
") Consolidated Statement of Profit or Loss (in million Euro) Q1 2016 Q1 2017 % change Revenue 603 588-2.5% Cost of sales (408) (396) -2.9% Gross profit 195 192-1.5% Selling expenses (84) (86) 2.4% Research
Consolidated Statement of Profit or Loss (in million Euro) Q1 2016 Q1 2017 % change Revenue 603 588-2.5% Cost of sales (408) (396) -2.9% Gross profit 195 192-1.5% Selling expenses (84) (86) 2.4% Research
Orders received in CHF million. Sales in CHF million. EBIT in CHF million. Capital expenditures in CHF million
 Semi-Annual Report 2 Rieter. Semi-Annual Report. Rieter at a glance Rieter at a glance Orders received in Sales in EBIT in Capital expenditures in HY1 15 HY2 15 HY1 16 HY1 15 HY2 15 HY1 16 HY1 15 HY2 15
Consolidated Financial Statements Second Quarter
 Consolidated Financial Statements 1 2014 Second Quarter Consolidated Financial Statements 2 CONDENSED INTERIM CONSOLI- DATED FINANCIAL STATEMENTS CONTENTS Key Developments in Second Quarter 2014 Consolidated
FINANCIAL REPORT. Semi-Annual Report
 FINANCIAL REPORT Semi-Annual Report 2017 18 Highlights & key figures First half 2017 18 In the first half of fiscal year 2017/18, the Sonova Group achieved strong growth across all businesses, driven by
Nine-month figures for 2018: Sartorius Stedim Biotech continues to grow by double digits
 Nine-month figures for : Sartorius Stedim Biotech continues to grow by double digits Group sales revenue up 13.8%; order intake up 14.5%; earnings margin 28.1% Dynamic development across all product categories
QUARTERLY REPORT. 30 September 2017
 QUARTERLY REPORT 2017 CONTENTS 1 Page 4 BMW GROUP IN FIGURES 2 INTERIM GROUP MANAGEMENT REPORT Page 11 Page 11 Page 13 Page 18 Page 19 Page 21 Page 31 Page 31 Page 38 Page 39 Report on Economic Position
Orders received in CHF million. Sales in CHF million. EBIT in CHF million. Net result in CHF million
 Semi-Annual Report 2 Rieter Group. Semi-Annual Report. Rieter at a glance Rieter at a glance Orders received in Sales in EBIT in Net result in HY1 09 HY2 09 HY1 10 HY1 09 HY2 09 HY1 10 HY1 09 HY2 09 HY1
Interim Report. First Quarter of Fiscal siemens.com. Energy efficiency. Intelligent infrastructure solutions. Next-generation healthcare
 Energy efficiency Next-generation healthcare Industrial productivity Intelligent infrastructure solutions Interim Report First Quarter of Fiscal 2014 siemens.com Key to references REFERENCE WITHIN THE
Interim report for Q1 2015/16
 Interim report for got off to a good start, posting revenue of DKK 462m and organic growth of 11% in local currencies, and 19% in Danish kroner. Earnings increased significantly to DKK 46m. is traditionally
Cavotec 4th Quarter Report 2013 and full year 2013 summary
 Cavotec 4th Quarter Report and full year summary Cavotec 4th Quarter Report and full year summary Order Intake increased 5.8% quarter on quarter at EUR 64,645 thousands (4Q12: 61,113). Revenues amounted
Financial Highlights in EURO Danfoss ready for the future
 Financial Highlights in EURO Danfoss ready for the future www.danfoss.com www.danfoss.com Danfoss at a glance Danfoss is a world-leading supplier of technologies that meet the growing need for food supply,
Quarterly Report 03/2018
 Q3 Quarterly Report 03/2018 CENTROTEC The European Energy-Saving Company Highlights > Positive business development in German heating and ventilation market; CHP market well below expectations > Group
SIX-MONTH REPORT 17 Halbjahresbericht_2017_en.indd :55:59
 SIX-MONTH REPORT 17 Sales by segment EUR million 38.7 (14 %) China & North America Sales by business area EUR million 123.5 (44 %) Ventilation 157.2 (56 %) Radiators 241.9 (86 %) Europe At the world s
HALF-YEAR REPORT FEBRUARY TO JULY
 CARING FOR PEOPLE HALF-YEAR REPORT FEBRUARY TO JULY 2017 We deliver health. Each and every day. Across Europe. > The PHOENIX group is a leading pharmaceutical trader in Europe, reliably supplying people
Interim Financial Report as at 30 June 2018
 Interim Financial Report as at 30 June 2018 Interim Report as at 30 June 2018 TRANSLATION FROM THE ORIGINAL ITALIAN TEXT INDEX PREFACE... 4 INTERIM MANAGEMENT REPORT AS AT 30 JUNE 2018... 5 CHANGES TO
+2 % Earnings (EBIT) increase
 increase") Statement as at September 30 Q3Quarterly 2017 Sales revenues rise by 9 % to 1,862 million +2 % Earnings (EBIT) increase Earnings outlook adjusted to 281 million Content FUCHS at a glance 03 Business development
Statement as at September 30 Q3Quarterly 2017 Sales revenues rise by 9 % to 1,862 million +2 % Earnings (EBIT) increase Earnings outlook adjusted to 281 million Content FUCHS at a glance 03 Business development
METRO QUARTERLY STATEMENT 9M/Q3 2017/18
 CONTENT 2 Overview 4 Sales, earnings and financial position 5 Earnings position of the sales lines 5 8 Real 9 Others 10 Outlook 11 Store network 12 Income statement 13 Balance sheet 15 Cash flow statement
Fiscal year 2013: Order intake at all-time high strong sales growth net income slightly lower than in prior year dividend increased outlook positive
 Burckhardt Compression Holding AG CH-8404 Winterthur Switzerland Tel.: +4 (0)52 262 55 00 Fax: +4 (0)52 262 00 5 Page /7 Media Release of Fiscal year 203: Order intake at all-time high strong sales growth
ABB proposes to raise dividend on the back of solid growth and near-record cash flow
 ABB proposes to raise dividend on the back of solid growth and near-record cash flow Full-year 2012 orders and revenues higher 1 despite difficult business climate Continued growth in automation supported
Interim report for the first half of Interim Report. First half year 201 1
 Interim report for the first half of 2011 1 Interim Report First half year 201 1 2 Tecan Interim consolidated financial statements as of June 30, 2011 About Tecan Tecan (www.tecan.com) is a leading global
Good performance in a weak market
 1 7 February 2013 No. 2/13 Good performance in a weak market Fourth quarter Sales increased by 4% in the quarter, with 0% organic growth, and totaled SEK 12,239 M (11,744). Good growth in Americas and
Expecting ongoing positive sales trend supported by stronger business model
 report 2011 Net sales growth of 16.8% on a FX-adjusted basis for the first half-year of 2011 EBIT margin of 8.0%, operational EBIT margin of 6.0% for first half of 2011 Expecting ongoing positive sales
INTERIM FINANCIAL REPORT H Company announcement no. 637
 INTERIM FINANCIAL REPORT H1 2016 Company announcement no. 637 5 August 2016 Selected financial and operating data for the period 1 January 30 June 2016 (DKKm) Q2 2016 Q2 2015 YTD 2016 YTD 2015 Net revenue
Q Results. Adecco Group
 Adecco Group Zurich, Disclaimer and Note on Terminology Forward-looking statements Information in this release may involve guidance, expectations, beliefs, plans, intentions or strategies regarding the
Volvo Car GROUP interim report Second Quarter 2016
 INTERIM REPORT SECOND QUARTER Volvo Car GROUP interim report Second Quarter i OF 24 VOLVO CAR AB (PUBL.) (556810 8988) VOLVO CAR GROUP INTERIM REPORT SECOND QUARTER, INTERIM GOTHENBURG REPORT JULY SECOND
CONSOLIDATED FINANCIAL STATEMENTS
 CONSOLIDATED FINANCIAL STATEMENTS FOR THE YEAR ENDED 31 DECEMBER ENDESA, S.A. AND SUBSIDIARIES CONSOLIDATED STATEMENTS OF FINANCIAL POSITION AT 31 DECEMBER AND 31 DECEMBER ASSETS 31 December 31 December
record your global partner for entrance solutions agta record ltd interim report 2017 your global partner for entrance solutions
 record your global partner for entrance solutions agta record ltd interim report 2017 your global partner for entrance solutions interim report 2017 Half-year report 30 June 2017 Trade activity Markets
+ 6 % Earnings (EBIT) increase to 297 million
 increase to 297 million") Quarterly statement as at September 30, 2018 Q3 / 2018 Sales revenues up by 5 % to 1,953 million + 6 % Earnings (EBIT) increase to 297 million (including one-off effect) Outlook updated: Sales revenue
Quarterly statement as at September 30, 2018 Q3 / 2018 Sales revenues up by 5 % to 1,953 million + 6 % Earnings (EBIT) increase to 297 million (including one-off effect) Outlook updated: Sales revenue
Consolidated interim financial statements
 Consolidated interim financial statements 1 July 2011 to 31 December 2011 Letter to Shareholders: results as at 31 December 2011 Solid result despite strong Swiss franc > > Growth in local currency terms
K E N D R I O N N. V. P R E S S R E L E A S E. 1 9 F e b r u a r y
 K E N D R I O N N. V. P R E S S R E L E A S E 1 9 F e b r u a r y 2 0 1 9 KENDRION MAINTAINS PROFITABILITY FOR THE YEAR DESPITE DIFFICULT AUTOMOTIVE MARKET - Full-year revenue declined by 3% to EUR 448.6
CONDENSED CONSOLIDATED INTERIM FINANCIAL STATEMENTS 2016
 JANUARY MARCH 2016 CONDENSED CONSOLIDATED INTERIM FINANCIAL STATEMENTS 2016 (UNAUDITED) CONTENTS 1. INCOME STATEMENT 1 2. STATEMENT OF COMPREHENSIVE INCOME 2 3. BALANCE SHEET 3 4. STATEMENT OF CHANGES
SWATCH GROUP: KEY FIGURES 2018
 PRESS RELEASE Biel/Bienne, 31 January 2019 SWATCH GROUP: KEY FIGURES 2018 Group net sales increased by 6.1% to CHF 8 475 million at current exchange rates (+5.7% at constant rates). Operating result increased
HALF-YEAR REPORT 2010: SWATCH GROUP - RECORD HALF-YEAR RESULTS IN TERMS OF BOTH SALES AND PROFIT
 PRESS RELEASE BIEL/BIENNE, 4 August 2010 HALF-YEAR REPORT 2010: SWATCH GROUP - RECORD HALF-YEAR RESULTS IN TERMS OF BOTH SALES AND PROFIT Sales in the Watches & Jewelry segment rose in local currency by
published % % % %
 Synergies from the Sagem Monetel merger greater than expected PRESS RELEASE 2009 ANNUAL RESULTS Solid results in 2009: Reduction of operating expenses in line with cost savings plan 15.0% EBITDA 1 margin
OPEN INNOVATIVE FOCUSED SOLID
 OPEN INNOVATIVE FOCUSED SOLID QUARTERLY STATEMENT AS OF MARCH 31, 2018 To our shareholders Patrik Heider, Spokesman of the Executive Board and CFOO The Nemetschek Group began the 2018 fiscal year according
GERMAN MAILGENEERING. 1 / 2018 Quarterly report
 GERMAN MAILGENEERING 1 / 2018 Quarterly report Key Figures REVENUE BY QUARTER (in EUR thousand) 60,000 50,000 51,302 49,015 49,059 53,593 55,480 CAGR 3.4%* 48,941 49,447 52,475 52,978 40,000 30,000 20,000
HeidelbergCement reports results for the first quarter of 2017
 10 May 2017 HeidelbergCement reports results for the first quarter of 2017 Italcementi acquisition strengthens sales volumes, revenue and result Sales volumes: 28 million tonnes of cement (+58%); 61 million
Schaffner Group. Half-Year Report 2013/14
 Schaffner Group Half-Year Report 2013/14 To our shareholders 1 Considerable improvement of net sales and profits The Schaffner Group made significant progress in implementing its strategy in the first
Interim report Q2 2018
 Interim report Q2 2018 MANAGEMENT REPORT FINANCIAL STATEMENTS Contents Management report 3 Highlights 4 Key figures and financial ratios 5 Developments in Q2 2018 8 Outlook 9 Risk Financial statements
INTERIM MANAGEMENT STATEMENT
 INTERIM MANAGEMENT STATEMENT 1st quarter of 2018 DEUTZ AT A GLANCE DEUTZ Group: Overview 1 3/2018 1 3/2017 New orders 574.9 403.2 Unit sales (units) 48,458 37,153 Revenue 414.5 352.5 EBITDA 40.9 38.7 EBITDA
CONSOLIDATED FINANCIAL STATEMENTS
 CONSOLIDATED FINANCIAL STATEMENTS FOR THE SIX MONTHS ENDED 30 JUNE 2017 ENDESA, S.A. AND SUBSIDIARIES CONSOLIDATED STATEMENTS OF FINANCIAL POSITION AT 30 JUNE 2017 AND 31 DECEMBER 2016 (*) Unaudited ASSETS
Interim report Q2 2017
 Interim report Q2 2017 MANAGEMENT REPORT FINANCIAL STATEMENTS Contents Management report 3 Highlights 4 Key figures and financial ratios 5 Developments in Q2 2017 8 Outlook 9 Risk Financial statements
Consolidated Income Statements Note 2, ,089.1 Cost of materials Personnel expenses Amortization of intangibl
 Consolidated Balance Sheets Note 31.12. 31.12. 459.6 749.7 Assets Current assets Cash and cash equivalents Trade accounts receivable 6 130.6 125.3 Other current assets and current financial assets 7 90.7
Interim report Q1 2017
 Interim report Q1 2017 MANAGEMENT REPORT FINANCIAL STATEMENTS Contents Management report 3 Highlights 4 Key figures and financial ratios 5 Developments in Q1 2017 8 Outlook 9 Risk Financial statements
Quarterly Report 01/2018
 Q1 Quarterly Report 01/2018 CENTROTEC The European Energy-Saving Company Highlights > International expansion continues; stable development in German heating market > Group revenue up 1.5% on prior-year
Shareholder Letter To the shareholders of Sonova Holding AG
 Shareholder Letter To the shareholders of Sonova Holding AG 22 May 2012 Dear Shareholders We are pleased to present the financial results of Sonova Holding AG for the 2011/12 financial year. Despite significant
We benefit from our global presence. Third Quarter Interim Report 2002 Holcim Ltd
 We benefit from our global presence. Third Quarter Interim Report 2002 Holcim Ltd Our efficiency enhancement programs ensure further progress at operating level. Distinctly stronger third quarter In terms
Interim Financial Report as at 30 September 2018
 Interim Financial Report as at 30 September 2018 Interim Report as at 30 September 2018 TRANSLATION FROM THE ORIGINAL ITALIAN TEXT INDEX PREFACE... 4 INTERIM MANAGEMENT REPORT AS AT 30 SEPTEMBER 2018...
Interim report for Q1 2014/15 (1 October - 31 December)
") Interim report for 2014/15 (1 October - 31 December) continues to consolidate its global market position, posting revenue of DKK 388m and organic growth of 13% in Danish kroner, and 9% in local currencies.
Interim report for 2014/15 (1 October - 31 December) continues to consolidate its global market position, posting revenue of DKK 388m and organic growth of 13% in Danish kroner, and 9% in local currencies.