2018 Retail Roadshow Presentation
|
|
|
- Quentin Chambers
- 5 years ago
- Views:
Transcription


1 2018 Retail Roadshow Presentation Argosy Property Limited 28 May 2018 to 18 June


2 AGENDA Highlights Page 4 Financials Page 6 Strategy Page 16 Leasing Update Page 31 Outlook Page 35 PRESENTED BY: Peter Mence CEO Dave Fraser CFO Note: This result should be read in conjunction with the NZX stock exchange release dated 23 May Due to rounding, numbers presented in this presentation may not add up exactly to the totals provided and percentages may not exactly reflect absolute figures. 2


3 Our strength lies in the diversity of our properties across sectors, grades, sizes and locations allowing us to adapt to the changing needs of our growing family of tenants. Peter Mence CEO 3

4 HIGHLIGHTS Change image 4
5 HIGHLIGHTS $101m Net property income 6.62c 1.55c Net Distributable Income per share +1.1% 4 th Quarter Dividend +1.6% $ % $48.8m completed, including $33.8m of green projects NTA +5.5% on prior year Annualised rent review increase Value Add Developments 98.8% 6.1 years Occupancy (by rental) WALT 6.25c FY19 dividend guidance, +1% 5

6 FINANCIALS Change image 6
7 Rental income $m Income Reconciliation Gross Property Income FY17 Acquisitions / developments Disposals Rent reviews Vacancy & leasing up Other Net movement re NZ Post House Gross Property Income FY18 7
8 Financial Performance FY18 F17 $m $m Net property income Administration expenses (9.9) (9.3) Profit before financial income/(expenses), other gains/(losses) and tax Interest expense (25.5) (25.9) Gain/(loss) on derivatives (4.1) 11.0 Revaluation gains Realised gains/(losses) on disposal Net: Insurance proceeds & earthquake expense 0.2 (1.2) Profit before tax Taxation expense (11.1) (16.8) Profit after tax Net income stable year on year Expenses up due to additional resourcing costs across the business Non cash impact of derivatives Solid year-on-year revaluation gains largely driven by cap rate firming Lower taxation expense primarily due to deferred tax movements Basic and diluted earnings per share (cents) Note: Due to rounding, numbers presented in this presentation may not add up exactly to the totals provided and percentages may not exactly reflect the absolute figures. 8
9 Distributable Income FY18 FY17 $m $m Profit before income tax Adjusted for: Revaluations gains (47.3) (42.3) Realised losses/(gains) on disposal (0.3) (2.7) Derivative fair value loss/(gain) 4.1 (11.0) Earthquake expense net of recoveries Gross distributable income Depreciation recovered Current tax expense¹ (11.6) (13.1) Net distributable income Weighted average number of ordinary shares (m) Gross distributable income per share (cents) Net distributable income per share (cents) Current tax lower due to higher capitalised interest, depreciation and nonassessable insurance proceedsreinstatement Net distributable income increased 1.1% 9
10 Investment Properties $m Investment Properties Portfolio growth driven by a combination of developments completed and revaluation gains 1, , , , , , , , , ,200.0 Investment Properties FY17 Capitalised costs Disposals Transfer to properties held for sale Revaluations Other Investment Properties FY18 10
11 $ per share Movement in NTA per share Annual revaluation gain key driver of 5.5% NTA uplift year on year (0.06) NTA at FY17 Profit for the year* Revaluations DRP & other Dividends paid NTA at FY18 * Excluding revaluations 11
12 Gearing FY18 FY17 $m $m Investment properties 1, ,442.2 Assets held for sale Other assets Total assets 1, ,458.6 Bank debt (excl. capitalised borrowing costs) Debt-to-total-assets ratio 35.9% 36.3% Further divestment of non Core assets will see the portfolio repositioned to the lower end of its retail band (15-25%) and higher end of industrial band (40-50%) over next months. The asset held for sale is 7 Wagener Place (Auckland), sold for $31.0m and which settles in July New target policy gearing range of between 30-40% (previously 35-40%). 35.9% Debt-to-total assets ratio 12
13 Portfolio Snapshot Our focus is delivering improved portfolio quality and is reflected in our strong portfolio metrics Occupancy WALT (years) 100.0% 98.0% 96.0% % 92.0% 90.0% % % 84.0% 82.0% % FY14 FY15 FY16 FY17 FY FY14 FY15 FY16 FY17 FY18 Net Tangible Assets Debt-to-total-assets $ % $ % 35.0% $ % $ % 20.0% $ % $ % 5.0% $0.85 FY14 FY15 FY16 FY17 FY18 0.0% FY14 FY15 FY16 FY17 FY18 13

14 Funding & Interest Rate Management Argosy maintains strong relationships with its banking partners ANZ Bank New Zealand Limited, Bank of New Zealand and The Hongkong and Shanghai Banking Corporation Limited, and remains well within its banking covenants. FY18 Argosy restructured its syndicated bank facility in May 2017 and February FY17 Weighted average duration of bank facility 3.1 years 2.5 years Weighted average interest rate % 4.88% Interest Cover Ratio 3.3x 3.4x % of fixed rate borrowings 62% 65% Average fixed interest rate % 4.56% 3.1 years ¹ Including margin and line fees 2 Excluding margin and line fees 14 Weighted avg. bank facility term
15 Dividends A final quarter cash dividend of 1.55 cents per share has been declared, with imputation credits of cents per share attached, and will be paid on 27 June 2018 FY19 dividend guidance of 6.25 cents per share is an increase of ~1.0% on the FY18 full year dividend The FY19 dividend reflects the Boards wish for shareholders to share in the continued strong results whilst allowing Argosy to maintain its momentum towards an AFFO based dividend policy over the medium term 6.25c 27 June FY19 dividend guidance Final quarter dividend paid 15

16 Strategy Overview 16
17 Strategy Argosy will continue to invest in a diverse range of properties across sectors, grades, sizes and locations. Our Investment Strategy consists of Core and Value Add properties. Core properties between 75-90% of the portfolio by value. Our Investment Policy sector band parameters (by value) are: Industrial 40-50% Office 30-40% Retail 15-25% As at 31 March 2018, Argosy was operating within the parameters of its Investment Policy. Argosy strives to deliver reliable and sustainable returns to shareholders. We take a considered approach to acquisition, divestment, development, leasing and capital management decisions, reflecting our proposition to shareholders as a dividend stock, with all the advantages of the PIE Regime. 17
18 Portfolio at a glance TOTAL PORTFOLIO VALUE BY SECTOR TOTAL PORTFOLIO VALUE BY REGION PORTFOLIO MIX BY VALUE 20% 5% 7% 6% 42% 24% 38% 71% 87% Industrial Office Retail Auckland Wellington Regional North Island & South Island Core properties Properties and land to divest Value Add properties Focus on continuing the divestment programme of non Core assets Expect to move towards the higher end of the industrial band and lower end of the retail band over the medium term 18
19 Portfolio Metrics The strength of our diversified portfolio is in the breadth and depth of our tenant base and sectors they represent. Rent Roll by Industry Government Administration Retail Top 10 Customers by Rent MBIE NZ Post General Distributors Transport and Storage Cardinal Logistics Manufacturing The Warehouse Property & Business Services Wholesale Trade Ezibuy Ministry of Primary Industries Mitre 10 Finance and Insurance Te Puni Kokiri Electricity, Gas and Water Supply All other Tonkin & Taylor All other Note: Data as at 31 March
20 Revaluations 31 March 18 Book Value ($m) 31 Mar 18 Valuation ($m) Δ $m Δ % Market Yield 1 31 Mar Mar 18 Auckland 1, , % 7.14% 6.75% Wellington (9.0) -2.5% 7.53% 7.60% North Island Regional & South Island % 8.70% 7.96% Total 1, , % 7.31% 6.98% 31 March 18 Book Value ($m) 31 Mar 18 Valuation ($m) Δ $m Δ % Market Yield 31 Mar Mar 18 Industrial % 7.12% 6.74% Office % 7.58% 7.37% Retail % 7.27% 6.80% Total 1, , % 7.31% 6.98% Strong revaluation gain 3.2% above book value Regionally, Auckland biggest contributor Wellington office: Stout Street recorded $13m increase but overall result offset by 7 Waterloo Quay (earthquake) and Stewart Dawson Corner which is currently under development At 83%, the Industrial portfolio biggest contributor of the total gain followed by office (12%) and retail (5%) Portfolio market yield firmed 33bps with Auckland firming 39bps and Industrial 38bps 1 Yields exclude 7 Waterloo Quay and Stewart Dawson Corner 20

21 Value Add The following properties have been designated as Value Add, which make up ~6% of the total portfolio: Property Sector Location Market Value 1 $m Springs Road Industrial Auckland Springs Road Industrial Auckland Albany Highway Industrial Auckland Great South Road Industrial Auckland Khyber Pass Road Office Auckland Willis Street / Stewart Dawson Cnr Office/Retail Wellington Hutt Road Retail Wellington 9.3 TOTAL $m (excl. land) Jamaica Drive Land Wellington Unity Drive Land Auckland Puhinui Road Land Auckland 3.2 TOTAL $m 94.9 ¹ At 31 March


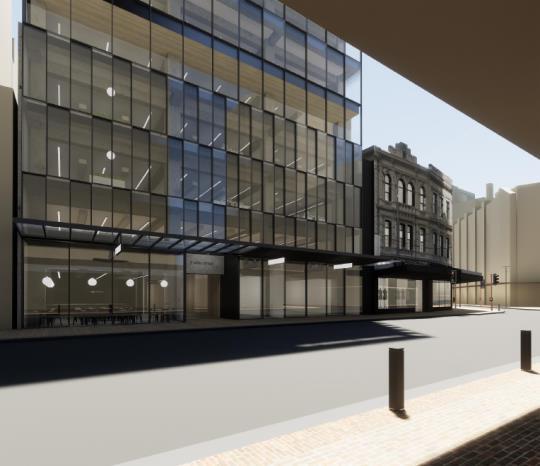
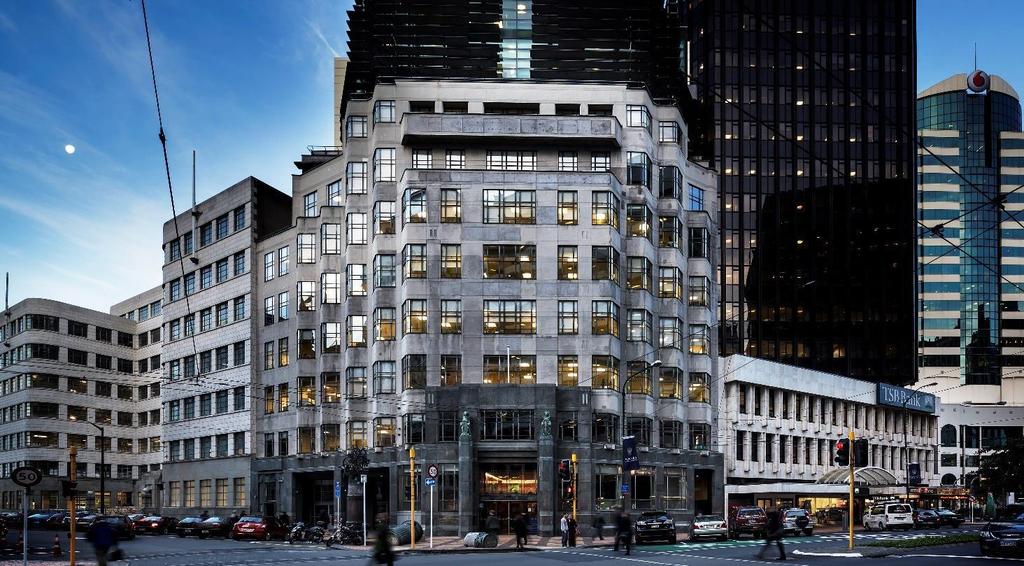
22 Value Add Stewart Dawson Corner 22


23 Value Add Stewart Dawson Corner 23


 7.")
24 Industrial NUMBER OF BUILDINGS 36 MARKET VALUE OF ASSETS ($M) $637.6 OCCUPANCY (BY INCOME) 99.9% WALT (YEARS) 7.4 PASSING YIELD 6.7% 24
 $577.")
 5.")
25 Office NUMBER OF BUILDINGS 17 MARKET VALUE OF ASSETS ($M) $577.3 OCCUPANCY (BY INCOME) 97.3% WALT (YEARS) 5.0 PASSING YIELD 7.0% 25


 5.")
26 Retail NUMBER OF BUILDINGS 8 MARKET VALUE OF ASSETS ($M) $298.3 OCCUPANCY (BY INCOME) 100% WALT (YEARS) 5.7 PASSING YIELD 7.1% 26
27 Completed Developments Development Major Tenant Type Location Total Cost $m Highgate Business Park Mighty Ape IND AKL Wyndham Panuku OFF AKL 9.1 Foundry Drive Polarcold Stores Ltd IND CHC 7.5 Snickel Lane Various OFF AKL 7.5 TOTAL 48.8 Argosy completed two green developments totalling $33.8m during the period being Highgate Business Park (targeting 4 Green Star Industrial Built Rating) and 82 Wyndham Street (targeting 5 Green Star Office Built Rating). 82 Wyndham will be targeting a 4 Star NabersNZ energy efficient rating now the building is fully occupied. 27
 Building rating: nil Targeting 5 Star Office Built Rating NABERSNZ rating:")


28 Green Case Study 82 Wyndham Street, Auckland BEFORE: AFTER: Valuation $29.0m (31 March 2017) $42.3m (31 March 2018) Building rating: nil Targeting 5 Star Office Built Rating NABERSNZ rating: Total project capex¹ nil Targeting 5 Star Office Base Build Rating $9.1m NEW FEATURES: Replaced air conditioning system to 100% above building code with CO 2 sensors LED lighting with intelligent controls (daylight & occupancy) Material increase in the building s end of trip facilities Energy monitoring capability to facilitate NABERSNZ measurement and emission reporting 1. Including green aspects 28


29 Green Case Study Highgate Business Park, Auckland Valuation Building rating: BEFORE: NABERSNZ rating: nil nil Total project capex¹ $16.6m NEW FEATURES: Air conditioning system to 50% above building code with CO 2 sensors LED with intelligent controls for daylight and occupancy sensors throughout Energy metering meets Green Star requirements and separates lighting, air-condition and three point power Rain water harvesting, for use in the gardens and toilets with water meters 1. Excluding land valued at $8.1m, making a total value of $24.7m 29 AFTER: Nil $28.2m (31 March 2018) nil Targeting 4 Star Office Built Rating
30 NZ Post House, at 7 Waterloo Quay Damage Assessment Interim damage assessment reports now with insurers. Insurance Claim Three interim claims made under Argosy s material damage and business interruption insurance. Total recognised to 31 March was $9.8m (after deductible) and allocated as follows; Loss of rents: $5.7m, Material damage expense: $2.3m and Expense recoveries: $1.8m. Reinstatement Proceeding swiftly with affected floors ready for occupation during FY19. Reinstatement work on Levels 1-4 & 7 and Levels Programme cost estimated at $41 million to complete. Leasing Levels are expected to be ready for occupation by March-19. Very strong market enquiry. 30
31 Leasing Update Change image 31
32 Leasing Success Excellent leasing results over the back half of the year driving the higher WALT of 6.1 years During the period Argosy completed 51 leasing transactions totalling ~150,000m² of NLA. Notable leasing successes include: Property Tenant NLA (sqm) Lease Term 9 Ride Way, Albany Amcor Flexibles (New Zealand) Limited 9, years 8 Forge Way, Panmure Eclipx Fleet Holdings 4, years 143 Lambton Quay Te Puni Kokiri 6,215 6 years 105 Carlton Gore Rd, Newmarket Tonkin & Taylor 4,377 3 years 147 Lambton Quay MBIE 5, years Some larger FY19 lease expiries include: Property Tenant NLA (sqm) Status 147 Gracefield Rd, Seaview The Information Management Group 8,018 In discussion with tenant 80 Springs Road, East Tamaki Coda GP Limited 9,675 Extension to 31-Aug Bell Avenue, Mt Wellington Mainfreight Limited 5,046 In discussion with tenant for extension 32
33 Percentage of portfolio (by income) Lease Maturity Lease maturity profile relatively stable over the medium term, no material single tenant exposure 22% 20% 18% % 14% 12% 10% 8% 6% 4% 2% % 10.0% % % % % % % % 4 2.6% % % 1.2% 0 Total Expiry Vacancy Largest Expiry The number above each bar denotes the total tenant expires per year (excluding monthly carparks and tenants with multiple leases within one property) Year ending 33
34 Market Update Modest economic growth still forecast which will drive steady net absorption. The mixture of a stable economy and continued technology change is driving demand for industrial assets. Growth in Auckland office supply is yet to cause concern, projections for increased vacancy around 2020 are unchanged. Wellington office vacancy continues to reduce with rental growth resulting. Tougher funding environment will continue to impact developers. This will create potential opportunities for Argosy. Increasing construction costs and slowing of cap rate compression positives for rental growth if net absorption continues. Land values easing. Focus on green assets, seismic performance and hazard management. 34

35 Outlook Change image 35
36 Outlook Fundamental real estate drivers remain sound. Whilst global volatility is still present, the New Zealand economic outlook is still positive with economic growth forecast and resilient local equity markets. Argosy s diversified portfolio provides balance across sectors allowing it to make the most of market conditions. Argosy will continue to focus on resolving near term expiries, maintaining high tenant retention rates and ensuring core portfolio metrics remain strong. Given the market appears to be firmly valued, divesting non Core assets to reinvest elsewhere or to the balance sheet is more attractive versus acquiring. We will continue to focus on our existing portfolio of value add properties in the context of sustainability given the environmental and business benefits they can bring. We remain focused on creating value and delivering sustainable and attractive risk adjusted returns to shareholders. Rental growth to continue. Green assets will continue to see increase in demand. 36

37 Thank you. 37
38 Disclaimer This presentation has been prepared by Argosy Property Limited. The details in this presentation provide general information only. It is not intended as investment or financial advice and must not be relied upon as such. You should obtain independent professional advice prior to making any decision relating to your investment or financial needs. This presentation is not an offer or invitation for subscription or purchase of securities or other financial products. Past performance is no indication of future performance. All values are expressed in New Zealand currency unless otherwise stated. 28 May
FY19 Interim Results Presentation
 FY19 Interim Results Presentation Argosy Property Limited 20 November 2018 www.argosy.co.nz AGENDA Highlights Page 4 Strategy / Portfolio Page 6 Financials Page 13 Leasing Update Page 22 Looking Ahead
Annual Results Presentation
 Annual Results Presentation Argosy Property Limited 25 May 2017 www.argosy.co.nz Agenda Highlights Page 4 Financials Page 6 Strategy Overview Page 16 Leasing Update Page 26 Outlook Page 30 PRESENTED BY:
MARKET RELEASE ARGOSY 2018 ANNUAL RESULT FOR THE 12 MONTHS TO 31 MARCH May 2018
 23 May 2018 MARKET RELEASE ARGOSY 2018 ANNUAL RESULT FOR THE 12 MONTHS TO 31 MARCH 2018 Argosy will present the 2018 annual results via a teleconference and webcast at 10am today. Please visit https://edge.media-server.com/m6/go/argosy-annual-results-2018
MARKET RELEASE ARGOSY 2018 INTERIM RESULT FOR THE SIX MONTHS TO 30 SEPTEMBER November 2017
 21 November 2017 MARKET RELEASE ARGOSY 2018 INTERIM RESULT FOR THE SIX MONTHS TO 30 SEPTEMBER 2017 Argosy will present the 2018 interim results via a teleconference and webcast at 10am today. Please visit
MARKET RELEASE ARGOSY 2019 INTERIM RESULT BUILDING MOMENTUM FOR THE 6 MONTHS TO 30 SEPTEMBER November 2018
 20 November 2018 MARKET RELEASE ARGOSY 2019 INTERIM RESULT BUILDING MOMENTUM FOR THE 6 MONTHS TO 30 SEPTEMBER 2018 Argosy will present the 2019 interim results via a teleconference and webcast at 10am
BNZ/NAB First Look Investor Conference Sydney, st October 2018
 BNZ/NAB First Look Investor Conference Sydney, 30-31 st October 2018 Strength in diversity Argosy Property Limited www.argosy.co.nz Agenda 1. Argosy at a Glance 3 2. History 4 3. Investment Strategy /
HIGHLIGHTS PROPERTY FOR INDUSTRY 2017 ANNUAL RESULTS BRIEFING
 HIGHLIGHTS Significant acquisition activity: $84.3 million of property acquired, improving portfolio metrics and providing significant medium to long-term development potential Transition of the Penrose
HIGHLIGHTS PROPERTY FOR INDUSTRY 2018 INTERIM RESULTS BRIEFING
 HIGHLIGHTS Significant portfolio activity: 58,000 square metres or 8% of the portfolio leased during the interim period to 11 tenants for an average increase in term of 6.5 years Increased earnings and
HIGHLIGHTS PROPERTY FOR INDUSTRY 2017 INTERIM RESULTS BRIEFING
 HIGHLIGHTS Internalisation of management on 30 June 2017 Increased guidance: distributable profit of between 7.70 and 7.90 cents per share, cash dividend of 7.45 cents per share Transition of the Penrose
PRESENTING TODAY. Craig Peirce Chief Finance and Operating Officer. Simon Woodhams Chief Executive Officer
 PRESENTING TODAY Simon Woodhams Chief Executive Officer Craig Peirce Chief Finance and Operating Officer 2 2018 HIGHLIGHTS Increased earnings and dividends: profit after tax up $58.4 million, 3.2% increase
PCT announces full year profit of $162.1 million
 NZX announcement 17 August 2017 PCT announces full year profit of $162.1 million Performance summary for the twelve months ended 30 June 2017 17.3% rise in net profit after tax and 3.6% increase in dividend
AGENDA. 1. Highlights 2. Portfolio 3. Market & Strategy Annual Results 5. Capital Management 6. Closing & Questions 7.
 AGENDA 1. Highlights 2. Portfolio 3. Market & Strategy 4. 2015 Annual Results 5. Capital Management 6. Closing & Questions 7. Appendices 2 HIGHLIGHTS Profit after tax for the year of $72.8 million or
Interim Results. For the six months ended 30 September 2016
 Interim Results For the six months ended 30 September 2016 Agenda & Contents Highlights Financial Performance Capital Management Portfolio Overview Development Projects Acquisitions Strategy Overview Conclusion
INTERIM RESULTS 31 DECEMBER 2016
 INTERIM RESULTS 31 DECEMBER 2016 BUILDING A HEALTHY FUTURE 23 February 2017 David Carr, Chief Executive Officer Stuart Harrison, Chief Financial Officer AGENDA Highlights Strategy Financials Portfolio
Stride Property Group (NS) Interim Results For the six months ended 30 September 2016
 Interim Results For the six months ended 30 September 2016") Stride Property Group (NS) Interim Results For the six months ended 30 September 2016 17 November 2016 Agenda & Contents Page Highlights 3 Peter Alexander Chief Executive Financial Performance 7 Capital
Stride Property Group (NS) Interim Results For the six months ended 30 September 2016 17 November 2016 Agenda & Contents Page Highlights 3 Peter Alexander Chief Executive Financial Performance 7 Capital
EARNINGS AND DIVIDEND GROWTH, MANAGEMENT TRANSITION
 EARNINGS AND DIVIDEND GROWTH, MANAGEMENT TRANSITION The PFI management team will present these results via live webcast from 10.30 am NZT today. To view and listen to the webcast, please visit https://edge.media-server.com/m6/p/3d97n233.
Stride Property Group (NS) Annual Results For the year ended 31 March 2018
 Annual Results For the year ended 31 March 2018") Stride Property Group (NS) Annual Results For the year ended 31 March 2018 30 May 2018 Agenda and Contents Page Welcome Highlights 3 Strategy 5 Philip Littlewood Chief Executive Officer Financial Performance
Stride Property Group (NS) Annual Results For the year ended 31 March 2018 30 May 2018 Agenda and Contents Page Welcome Highlights 3 Strategy 5 Philip Littlewood Chief Executive Officer Financial Performance
Interim Results For the six months ended 30 September 2017
 Interim Results For the six months ended 30 September 2017 Agenda & Contents Page Welcome Highlights 3 Financial Performance 6 Capital Management 10 Portfolio Overview 12 Development Project 16 Asset Management
Overview 3 Financial Summary 5 Investment Portfolio 11 Development Update 15 Summary & Outlook 22. Appendices 25. Presented by:
 1 Presented by: John Dakin Chief Executive Officer Andy Eakin Chief Financial Officer James Spence Director Investment Management Overview 3 Financial Summary 5 Investment Portfolio 11 Development Update
Stride Property Group. Interim Report For the six months ended 30 September 2017
 Stride Property Group Interim Report For the six months ended 30 September 2017 Contents 2 Highlights 4 Stride Property Group s Leading Business Model 6 Owned and Managed Properties 7 Portfolio Composition
Precinct Properties New Zealand Interim Results. 28 February 2018
 Precinct Properties New Zealand Interim Results 28 February 2018 Agenda Highlights Page 3 Section 1 Strategy progress Page 4 Section 2 Development summary Page 6 Section 3 Interim results and capital management
INTERIM REPORT THE PROPERTIES OF QUALITY GMT BOND ISSUER LIMITED GOODMAN PROPERTY TRUST. Interim Report Interim Report 2017
 INTERIM REPORT 2017 THE PROPERTIES OF QUALITY GOODMAN PROPERTY TRUST Interim Report 2017 GMT BOND ISSUER LIMITED Interim Report 2017 CONTENTS GOODMAN PROPERTY TRUST Interim Report 2017 GMT BOND ISSUER
2016 FINANCIAL YEAR RESULTS PRESENTATION
 2016 FINANCIAL YEAR RESULTS PRESENTATION 22 August 2016 www.industriareit.com.au ASX CODE: IDR Agenda 01 Highlights and Investment Proposition 02 Financial results 03 Portfolio performance 04 Capital management
PFI s strategy is to invest in quality industrial property in prime locations in order to deliver attractive returns with a low level of volatility
 PFI OVERVIEW Property for Industry (PFI) is an NZX listed property vehicle focused on industrial property PFI s strategy is to invest in quality industrial property in prime locations in order to deliver
ANNUAL RESULTS 30 JUNE 2015
 ANNUAL RESULTS 30 JUNE 2015 SECURING TODAY, WITH A FOCUS ON TOMORROW 12 August 2015 David Carr, Chief Executive Officer Stuart Harrison, Chief Financial Officer AGENDA Result summary Financial summary
FIXED RATE SENIOR SECURED BOND OFFER
 FIXED RATE SENIOR SECURED BOND OFFER July 2014 Arranger and Joint Lead Manager Joint Lead Manager Joint Lead Manager 1 DISCLAIMER A simplified disclosure prospectus (SDP) dated 1 July 2014 has been prepared
GMT+ Full year results to 31 March 2013
 GMT+ Full year results to 31 March 2013 Contents + Section 01 Overview + Section 02 Financial overview + Section 03 Investment activity + Section 04 Investment portfolio + Section 05 Development portfolio
ASX/Media Announcement
 ASX/Media Announcement 13 February 2018 Propertylink delivers a strong HY18 result, well positioned to deliver FY18 guidance Propertylink Group (ASX:PLG) today announces strong financial and operational
Precinct Properties New Zealand Annual Results. August Developing the future
 Precinct Properties New Zealand Annual Results August 2017 Developing the future Agenda Highlights Page 3 Section 1 Strategy Page 4 Section 2 Major initiatives Page 12 Section 3 Financial results and capital
ING Medical Properties Trust (NZSX: IMP)
") ING Medical Properties Trust (NZSX: IMP) Investor roadshow presentation May/June 2010 David Carr, General Manager and Stuart Harrison, Chief Financial Officer www.ingmedicalproperties.co.nz Columba, Ascot
ING Medical Properties Trust (NZSX: IMP) Investor roadshow presentation May/June 2010 David Carr, General Manager and Stuart Harrison, Chief Financial Officer www.ingmedicalproperties.co.nz Columba, Ascot
OPERATIONAL HIGHLIGHTS
 Dexus (ASX:DXS) ASX release 14 February 2018 2018 Half year results Positive momentum Dexus today announced a strong result for the first six months of FY18 and upgraded its guidance for distribution per
Arena Office Fund FY14 annual results presentation. 3 September 2014
 Arena Office Fund FY14 annual results presentation 3 September 2014 www.arenainvest.com.au Presenters James Goodwin Andrew Nicol Rob de Vos Joint Managing Director Appointed to the Board in January 2012.
Australian Unity Office Fund
 Australian Unity Office Fund (ASX: AOF) 2018 Full Year Results Presentation 24 August 2018 Webcast: https://fnn.webex.com/fnn/onstage/g.php?mtid=e0f48b0535622fe807610ffb3ef1ac4ab Teleconference details:
Sales increased 8.1% to $128.0m (HY17: $118.4m)
") Nick Scali Limited NCK.ASX HY18 Results Presentation 7th February 2018 Key Highlights Sales increased 8.1% to $128.0m (HY17: $118.4m) Sales Like for like sales growth of +2.6% for Nick Scali Furniture
Nick Scali Limited NCK.ASX HY18 Results Presentation 7th February 2018 Key Highlights Sales increased 8.1% to $128.0m (HY17: $118.4m) Sales Like for like sales growth of +2.6% for Nick Scali Furniture
16.1c c c
 1 2016 Interim Result Highlights Successful delivery, ahead of PDS 2 Exceeded revised earnings guidance Six months to 31 Dec 15 Solid capital management 7.97c 7.65c $2.15 28.3% Earnings per unit Distribution
THE PROPERTIES OF QUALITY GOODMAN PROPERTY TRUST
 THE PROPERTIES OF QUALITY GOODMAN PROPERTY TRUST INTERIM RESULT 2017 CONTENTS 01 OVERVIEW 02 FINANCIAL RESULT 03 INVESTMENT PORTFOLIO 04 DEVELOPMENT PORTFOLIO 05 OUTLOOK Appendices 01 OVERVIEW Highbrook
Interim Result. Goodman Property Trust
 Interim Result 2019 Goodman Property Trust Contents Overview 3 Presented by: John Dakin Chief Executive Officer Andy Eakin Chief Financial Officer James Spence Director Investment Management Financial
2017 Annual General Meeting Chairman and CEO Addresses
 ASX Announcement 27 October 2017 2017 Annual General Meeting Chairman and CEO Addresses In accordance with ASX Listing Rule 3.13, attached are the addresses and accompanying presentation slides to be given
AIMS AMP CAPITAL INDUSTRIAL REIT
 AIMS AMP CAPITAL INDUSTRIAL REIT FY2013: 2 nd Quarter Ended 30 September 2012 Results Presentation 24 October 2012 Important Notice Disclaimer This Presentation is focused on comparing actual results for
Infratil Full Year Results Presentation 18 MAY 2016
 Infratil 2016 Full Year Results Presentation 18 MAY 2016 Full Year Overview Successful divestments lead to record net surplus and opportunity for renewal Record net parent surplus of $438 million boosted
For personal use only
 NATIONAL STORAGE REIT JP MORGAN AUSTRALIAN REIT FORUM ASIA MARCH 2017 IMPORTANT NOTE & DISCLAIMER This presentation has been prepared by National Storage REIT ( NSR ) comprising National and may involve
nzx release+ GMT Strategy Delivering Quality Results Date 18 May 2017 Release Immediate
 nzx release+ GMT Strategy Delivering Quality Results Date 18 May 2017 Release Immediate, the manager of Goodman Property Trust ( GMT or Trust ) is pleased to announce the Trust s financial results for
For personal use only
 17 August 2016 2016 Annual results Positioned for future growth DEXUS Property Group (DEXUS) today posted a strong 2016 financial result, with Funds from Operations and distribution per security growth
Augusta Capital Annual Result
 Augusta Capital Annual Result For the year ended 31 March 2016 20 May 2016 KEY HIGHLIGHTS FY2016 Financial Performance Strong overall result NPAT of $13.52m up 30% compared to $10.39m in FY2015 Unrealised
Record after-tax profit delivered in strong year
 NZX RELEASE 16 May 2016 Record after-tax profit delivered in strong year Kiwi Property today announced a record result, delivering an after-tax profit of $250.8 million 1 for the year ended 31 March 2016,
Metlifecare Limited Interim Group Financial Statements
 Metlifecare Limited Interim Group Financial Statements for the half year ended Group Financial Statements For the half year ended Directors' Report 3 Consolidated Statement of Comprehensive Income 4 Consolidated
Australian Education Trust
 Australian Education Trust ASX ANNOUNCEMENT 18 February 2014 AET Results for the Half-Year Ended 31 December 2013 Folkestone Investment Management Limited (FIML) as the Responsible Entity of the Australian
Amount $000's. Amount. Imputed amount Foreign tax credit per share. per share per share Dividend payable N/A. N/A N/A Special dividend payable
 Trustpower Limited Results for announcement to the market Reporting period 6 months to 30 September 2016 Previous reporting period 6 months to 30 September 2015 Amount $000's Percentage change Revenue
INTERIM RESULTS 31 DECEMBER 2014
 INTERIM RESULTS 31 DECEMBER 2014 DEVELOPING OUR PORTFOLIO DELIVERING ON STRATEGY 26 February 2015 David Carr, Chief Executive Officer Stuart Harrison, Chief Financial Officer AGENDA Result summary Financial
DEXUS Property Group. Institutional placement 3 December m securities at $0.73 to $0.84 raising $286m - $329m
 DEXUS Property Group Institutional placement 3 December 2008 391.7m securities at $0.73 to $0.84 raising $286m - $329m DEXUS Funds Management Limited ABN 24 060 920 783 Australian Financial Services Licence
WELLINGTON INTERNATIONAL AIRPORT LIMITED (WIAL)
") WELLINGTON INTERNATIONAL AIRPORT LIMITED (WIAL) Annual Report For the Year Ended 31 March 2013 DIRECTORS' REPORT The s have pleasure in presenting to shareholders their twenty-third annual report for Wellington
WELLINGTON INTERNATIONAL AIRPORT LIMITED (WIAL) Annual Report For the Year Ended 31 March 2013 DIRECTORS' REPORT The s have pleasure in presenting to shareholders their twenty-third annual report for Wellington
The National Property Trust 2011 Annual Meeting Presentation and NPT Limited Shareholder Briefing
 The National Property Trust 2011 Annual Meeting Presentation and NPT Limited Shareholder Briefing Presented 29 August 2011 by: Jim Sherwin Chairman, The National Property Trust Limited (as at 31 March
Stride Property Group (NS) Annual Shareholder Meetings
 Annual Shareholder Meetings") Stride Property Group (NS) Annual Shareholder Meetings 2018 Board of Directors Tim Storey Independent John Harvey Independent Michelle Tierney Independent David van Schaardenburg Independent Philip Ling
Stride Property Group (NS) Annual Shareholder Meetings 2018 Board of Directors Tim Storey Independent John Harvey Independent Michelle Tierney Independent David van Schaardenburg Independent Philip Ling
Multiplex Prime Property Fund
 Multiplex Prime Property Fund 2009 Interim Results 23 February 2009 1 Important Notices Whilst every effort is made to provide accurate and complete information, this presentation has been prepared in
Corporate profile. Strong foundations Positive momentum. years being listed as Dexus
 Corporate profile Strong foundations Positive momentum years being listed as Dexus Company overview Dexus is a Top 50 entity by market capitalisation listed on the Australian Securities Exchange (trading
FY2014 Financial Results Presentation
 FY2014 Financial Results Presentation 16 January 2015 16 International Business Park Important Notice This material shall be read in conjunction with CIT s results announcements for the financial period
Fliway Group Limited Results for announcement to the market NZX Appendix 1. 6 months to 31 December months to 31 December 2015
 Fliway Group Limited Results for announcement to the market NZX Appendix 1 Reporting Period 6 months to 31 December 2016 Previous Reporting Period 6 months to 31 December 2015 Amount (000s) Percentage
Goodman Property Trust Financial Statements For the year ended 31 March 2018
 Goodman Property Trust Financial Statements The Board of Goodman (NZ) Limited, the Manager of Goodman Property Trust, authorised these financial statements for issue on 28 May 2018. For and on behalf of
31 DECEMBER 2014 HALF YEAR RESULTS PRESENTATION. 19 February 2015
 31 DECEMBER 2014 HALF YEAR RESULTS PRESENTATION 19 February 2015 Contents Results Highlights Financial Results Portfolio Performance Capital Management Industria REIT Overview Outlook & Guidance Appendices
Profit Announcement. For the six months ended 31 March 2007
 Profit Announcement For the six months ended 3 March 2007 Incorporating the requirements of Appendix 4D This interim profit announcement has been prepared for distribution in the United States of America
GOODMAN BONDS FEBRUARY 2018
 GOODMAN BONDS FEBRUARY 2018 Arranger and Joint Lead Manager Joint Lead Managers This presentation contains the key terms of an offer of fixed rate secured debt securities by GMT Bond Issuer Limited (Issuer),
Financial Results for the Quarter / Year Ended 31 Mar April 2012
 Financial Results for the Quarter / Year Ended 31 Mar 2012 19 April 2012 Disclaimer This Presentation is focused on comparing results for the three months ended 31 Mar 2012 versus results achieved in the
For personal use only
 GROWTHPOINT PROPERTIES AUSTRALIA TRUST ARSN 120 121 002 GROWTHPOINT PROPERTIES AUSTRALIA LIMITED ABN 33 124 093 901 AFSL 316409 ASX ANNOUNCEMENT GROWTHPOINT PROPERTIES AUSTRALIA (ASX Code: GOZ) RESULTS
SKYCITY Entertainment Group Limited 2008 Full Year Result Presentation
 SKYCITY Entertainment Group Limited 2008 Full Year Result Presentation Agenda I. Highlights and Result Summary 3 II. Business Unit Results 10 III. Financial Results 23 IV. Strategy and Outlook 30 V Appendix
1Q FY2009/10 Financial Results Presentation 17 July 2009
 1Q FY2009/10 Financial Results Presentation 17 July 2009 Disclaimers This Presentation is focused on comparing results for the three months ended 30 June 2009 versus actual results year-on-year ( yoy ).
The Warehouse Group Limited Interim Financial Statements. For the 26 weeks ended 28 January 2018
 The Warehouse Group Limited Interim Financial Statements For the 26 weeks ended 28 January 2018 Consolidated Income Statement 26 Weeks 26 Weeks 52 Weeks Ended Ended Ended Note Continuing operations Retail
air new zealand group Statement of Financial Performance (Unaudited) FOR THE SIX MONTHS TO 31 DECEMBER 2010
 FOR THE SIX MONTHS TO 31 DECEMBER 2010") 2 011 i n t e r i m f i n a n c i a l r e s u lts 0 11 2 AIR NEW ZEALAND INTERIM FINANCIAL RESULTS 2011 Statement of Financial Performance (Unaudited) FOR THE SIX MONTHS TO 31 DECEMBER 2010 NOTES 31 dec
2 011 i n t e r i m f i n a n c i a l r e s u lts 0 11 2 AIR NEW ZEALAND INTERIM FINANCIAL RESULTS 2011 Statement of Financial Performance (Unaudited) FOR THE SIX MONTHS TO 31 DECEMBER 2010 NOTES 31 dec
SCALES CORPORATION LIMITED GROWING YOUR DIVERSIFIED AGRIBUSINESS
 SCALES CORPORATION LIMITED GROWING YOUR DIVERSIFIED AGRIBUSINESS 2018 Annual Shareholders Meeting 13 AGENDA Welcome Chairman s review Managing Director s review Ordinary business and resolutions 2 CHAIRMAN
OSK DMG ASEAN & Hong Kong Corporate Day June 2012
 OSK DMG ASEAN & Hong Kong Corporate Day 26-28 June 2012 2 Important Notice This material shall be read in conjunction with CIT s financial statements for the financial period ended 31 March 2012. The value
Not for distribution or release in the United States or to, or for the account or benefit of, US Persons
 3 December 2008 DEXUS Funds Management Limited ABN 24 060 920 783 AFSL: 238163 Level 9, 343 George Street Sydney NSW 2000 The Manager Australian Stock Exchange Limited 20 Bridge Street Sydney NSW 2000
INTERIM REPORT AS AT 31 DECEMBER 2016 BUILDING A HEALTHY FUTURE SOUTH EASTERN PRIVATE HOSPITAL, VIC
 INTERIM REPORT AS AT 31 DECEMBER 2016 BUILDING A HEALTHY FUTURE SOUTH EASTERN PRIVATE HOSPITAL, VIC Vital's continued strong financial and portfolio position sees it well positioned to build a healthy
VECTOR LIMITED Financial and Operational Results
 Financial and Operational Results HALF YEAR ENDED 31 DECEMBER 2015 Disclaimer This presentation contains forward-looking statements. Forward-looking statements often include words such as "anticipates",
INTERIM REPORT AS AT 31 DECEMBER 2017 INVESTING IN AUSTRALASIA'S HEALTHCARE INFRASTRUCTURE
 INTERIM REPORT AS AT 31 DECEMBER 2017 INVESTING IN AUSTRALASIA'S HEALTHCARE INFRASTRUCTURE Vital is commited to working with our operating partners and their patients to achieve positive healthcare outcomes.
Frasers Commercial Trust 3QFY13 Financial Results. 24 July 2013
 Frasers Commercial Trust 3QFY13 Financial Results 24 July 2013 Important notice Certain statements in this Presentation constitute forward-looking statements, including forward-looking financial information.
Half Year Report
 Half Year Report 2017 www.greencrosshealth.co.nz community health We are passionately committed to the health and wellness of New Zealand, and to providing the best support, care and advice to our communities.
AIMS AMP CAPITAL INDUSTRIAL REIT
 AIMS AMP CAPITAL INDUSTRIAL REIT 3 rd Quarter Ended 31 December 2011 Results Presentation 20 January 2012 Important Notice Disclaimer This Presentation is focused on comparing actual results for the financial
Retail Bond Offer Investor Presentation
 Retail Bond Offer Investor Presentation Dorian Devers, Chief Financial Officer Louise Tong, Head of Capital Markets & Tax Joint Lead Managers February 2019 Important Notice The offer of debt securities
Centuria Urban REIT 576 SWAN STREET, RICHMOND VIC
 Centuria Urban REIT 576 SWAN STREET, RICHMOND VIC PAGE 01 01. 02. 03. 04. 05. Results Overview Porfolio Overview Capital Mangement Strategy & Guidance Appendices Results Overview Section 1 Results Overview
11 February 2019 Charter Hall Long WALE REIT FY19 Half Year Results 6 months to 31 December 2018 Optima Centre, Perth, WA
 11 February 2019 Charter Hall Long WALE REIT FY19 Half Year Results 6 months to 31 December 2018 Optima Centre, Perth, WA 2019 half year results Agenda 1. FY19 half year highlights 3 2. Financial performance
FINANCIAL STATEMENTS GOODMAN PROPERTY TRUST PROFIT OR LOSS 22 BALANCE SHEET 23 CASH FLOWS 24 CHANGES IN EQUITY 25
 GOODMAN PROPERTY TRUST for the year ended 31 March 2017 CONTENTS PROFIT OR LOSS 22 BALANCE SHEET 23 CASH FLOWS 24 CHANGES IN EQUITY 25 The Board of Goodman (NZ) Limited, the Manager of Goodman Property
Contents. 2 Highlights. 4 The Investore Premise. 5 Strategy. 6 Chair's Report. 8 Capital Management & Portfolio Overview. 10 Manager's Report
 Interim Report For the six months ended 30 September 2018 Contents 2 Highlights 4 The Investore Premise 5 Strategy 6 Chair's Report 8 Capital Management & Portfolio Overview 10 Manager's Report 12 Featured
9 August 2018 MIRVAC GROUP FULL YEAR RESULTS 30 JUNE 2018
 9 August 2018 MIRVAC GROUP FULL YEAR RESULTS 30 JUNE 2018 Mirvac Group (Mirvac) [ASX: MGR] today announced its full-year results for the financial year ended 30 June 2018 (FY18), with the Group delivering
Infratil Market Update and Share Buyback 27 September Context
 Infratil Market Update and Share Buyback 27 September 2013 1. Context Infratil has generated total shareholder returns of 17.8% per annum since listing in 1994. This long-term performance has been sustained
ASX CEO CONNECT PRESENTATION. Viva Energy REIT ASX CEO Connect Presentation 29 March 2018
 ASX CEO CONNECT PRESENTATION Viva Energy REIT ASX CEO Connect Presentation 29 March 2018 AGENDA Highlights 4 Financial Results 7 Portfolio Update 11 Industry Update 18 Strategy & Outlook 20 Questions &
For personal use only
 Good morning, and welcome to the GPT Metro Office Fund Annual Results for 2015. In recognition of GPT s commitment to a Reconciliation Action Plan, I would like to acknowledge and pay respect to the traditional
DREAM GLOBAL ANNOUNCES SECOND QUARTER RESULTS AND HIGH QUALITY ACQUISITIONS
 DREAM GLOBAL ANNOUNCES SECOND QUARTER RESULTS AND HIGH QUALITY ACQUISITIONS TORONTO, AUGUST 7, 2018 DREAM GLOBAL REIT (TSX:DRG.UN, FRA:DRG) (or Dream Global, the Trust or we ) today reported its financial
Sirius Real Estate Limited
 Sirius Real Estate Limited ("Sirius", "the Group" or "the Company") Final Results for the year ended "This has been another excellent year for the business. The successful capital raise which facilitated
RESTAURANT BRANDS DELIVERS RECORD PROFIT
 RESTAURANT BRANDS NEW ZEALAND LIMITED 17 April 2018 NZX/ASX RESTAURANT BRANDS DELIVERS RECORD PROFIT $NZm 2018 2017 Change ($) Change (%) Total Group Sales 740.8 497.2 +243.6 +49.0 Group NPAT (reported)
C R E A T I N G C I T Y C E N T R E P R E C I N C T S
 C R E A T I N G C I T Y C E N T R E P R E C I N C T S INTERIM REPORT 2018 04 Chairman's and CEO's Report 12 30 The Numbers Directory Cover page image: Artists impression of Commercial Bay retail offering
Kathmandu Holdings Limited
 Kathmandu Holdings Limited New Zealand Stock Exchange Listing Rules Disclosure Half Year Report For the period ending Contents Appendix 1 Media Announcement Directors Report Interim Report Auditor s Independence
3Q2010 Financial Results. 20 October 2010
 3Q2010 Financial Results 20 October 2010 important notice The value of units in CIT ( Units ) and the income derived from them may fall as well as rise. Units are not investments, liabilities or obligations
building partnerships+
 Goodman Property Trust Interim Report 2014 GMT Bond Issuer Limited Interim Report 2014 building partnerships+ building partnerships+ Long-term relationships with key stakeholders have helped GMT achieve
Infratil 2018 Full Year Result. 17 May 2018
 Infratil 2018 Full Year Result 17 May 2018 Full Year Overview New platforms gathering momentum while core businesses deliver strong results Strong performances from Trustpower, Wellington Airport and Canberra
PLEASE READ Notice of Special Meeting Vector Limited
 PLEASE READ Notice of Special Meeting Vector Limited Notice is given that a special meeting of the shareholders of Vector Limited will be held in the Guineas Ballroom, Ellerslie Event Centre, Ellerslie
Centuria Zenith Fund Case Study. The trials and tribulations of our largest unlisted deal
 Centuria Zenith Fund Case Study The trials and tribulations of our largest unlisted deal Zenith is BIG! - $279 million, 2 towers, 44,000 sqm, 800 carparks Fund forecasts are not guaranteed. An investment
HY17 Results Presentation
 Artist s impression of Ashfield Central residential development, Sydney NSW It s all about the property HY17 Results Presentation HY17 financial summary 14 Martin Place, Sydney NSW Statutory profit Underlying
FINANCIAL & OPERATIONAL RESULTS
 FINANCIAL & OPERATIONAL RESULTS HALF YEAR ENDED 31 DECEMBER 2018 26 February 2019 DISCLAIMER This presentation contains forward-looking statements. Forward-looking statements often include words such as
Mapletree Commercial Trust
 Mapletree Commercial Trust 3Q FY17/18 Financial Results 24 January 2018 1 Important Notice This presentation is for information only and does not constitute an offer or solicitation of an offer to sell
ALE Property Group December 2014 Half Year Results 5 February 2015
 ALE Property Group December 2014 Half Year Results 5 February 2015 The Breakfast Creek Hotel, Brisbane, QLD New: Follow ALE Property on: 1 Contents Highlights December 2014 Half Year Results Properties
Vicinity announces FY19 interim results with strategy delivering benefits
 ASX Announcement 15 February 2019 Vicinity announces FY19 interim results with strategy delivering benefits KEY FINANCIAL AND OPERATING HIGHLIGHTS Statutory net profit after tax of $235.3 million for the