31 DECEMBER 2014 HALF YEAR RESULTS PRESENTATION. 19 February 2015
|
|
|
- Blaze Strickland
- 5 years ago
- Views:
Transcription

1 31 DECEMBER 2014 HALF YEAR RESULTS PRESENTATION 19 February 2015
2 Contents Results Highlights Financial Results Portfolio Performance Capital Management Industria REIT Overview Outlook & Guidance Appendices 2

3 RESULTS HIGHLIGHTS 3
 93 % OCCUPANCY (by area) 5.1yrs WALE (years, by area) 33.")
4 Industria REIT Results Highlights 17 ASSETS $ 2.01 NTA Per Security $ 398 million PORTFOLIO VALUE 8.19 % AVERAGE CAP RATE 161,272 NLA (sqm) 93 % OCCUPANCY (by area) 5.1yrs WALE (years, by area) 33.1 % GEARING 4
5 Half Year Highlights Distribution forecast delivered Distribution of 8.36 cents per Security to be paid February 2015 (IPO forecast 8.36 cents per Security) 1H2015 Distributable Earnings 8.12 cents per Security Statutory profit of $11.20 million Tax deferred component of 49% versus IPO forecast of 31% (first half distribution) Portfolio remains well positioned to deliver stable cash income returns and potential growth Occupancy of 93% (by area) WALE of 5.1 years by Net Lettable Area increased from June % of leases have contracted rental growth Well diversified tenant base Property portfolio increased in value by 7.8% on a like-for-like basis since IPO Property portfolio increased $2.8 million to $398.4 million in the period NTA increased from $2.00 at 30 June 2014 to $2.01 as at 31 December 2014 Weighted average cap rate of 8.19%, firming 10 bps from 8.29% as at 30 June
6 Half Year Highlights (continued) Conservative capital structure 33.1% gearing remains within 30% 40% target range Solid balance sheet maintained Significant headroom on all banking covenants Over 16,400 sqm of leasing transactions completed in period Extended RFS to ten year term at 32 Garden Street, Kilsyth Post reporting date Interactive Pty Limited have entered into a 13 year lease over 4,100 sqm at Brisbane Technology Park Attractive lease expiry profile Sale of 53 Brandl St above book value $10.25 million sale, $1.0 million or 11.4% above book value Prudent approach to acquisition opportunities focus remains on intensive asset management 6
7 FINANCIAL RESULTS 7
8 Income and distributions Statutory profit of $11.2 million The net rental income before straight lining adjustments was $0.5 million lower than the IPO forecast principally due to lower occupancy with longer than forecast void periods particularly in Brisbane as referenced at the AGM Underlying operating income for the six months to 31 December was $10.2 million, being $0.4 million lower than the IPO forecast Tax Deferred component higher than IPO forecast at 49% Distribution of 8.36 cents delivered Actual IPO Forecast $000s (unless otherwise stated) 1H15 1H15 Change Statutory net profit 11,201 11,628 Distributable Earnings 10,151 10,532 Distributions 10,450 10,450 - Securities on issue (millions) Statutory Earnings per Security (cents) Distributable Earnings per Security (cents) Distribution per Security (cents) Tax deferred component of Distribution 49% 31% 8
9 Balance sheet Net tangible assets ( NTA ) total $250.9 million, equating to $2.01 per security Investment property balance lower due to sale of 53 Brandl Street, BTP Conservative capital structure Significant headroom on all banking covenants Solid balance sheet maintained Well positioned to capitalise on asset recycling opportunities Actual Actual $000s (unless otherwise stated) 1H15 FY14 Change Investment properties 1 398, ,971 Total assets 404, ,219 Total liabilities 154, ,095 Net assets 250, ,124 Securities on issue (millions) Net Tangible Assets per Security $2.01 $2.00 Net Tangible Assets per Security (Excluding derivatives liability) $2.03 $2.01 Gearing % 33.4% 1. Post sale of 53 Brandl Street, BTP 2. Industria's debt less cash, divided by the value of the Portfolio 9
10 PORTFOLIO PERFORMANCE 10


11 Portfolio overview Modern industrial and business park assets located primarily in Australian capital city locations Sector diversification (by value) Industrial 24% BRISBANE 7 Clunies Ross Court and McKechnie Drive, BTP 8 Clunies Ross Court and 9 McKechnie Drive, BTP 7 Brandl Street, BTP 18 Brandl Street, BTP 37 Brandl Street, BTP 85 Brandl Street, BTP 88 Brandl Street, BTP BTP Central, BTP Brandl Street Land (Lot 3 & 6), BTP SYDNEY Building A, 1 Homebush Bay Drive, Rhodes Business Park Building C, 1 Homebush Bay Drive, Rhodes Business Park MELBOURNE 34 Australis Drive, Derrimut South Park Drive, Dandenong South 89 West Park Drive, Derrimut Garden Street, Kilsyth 140 Sharps Road, Tullamarine ADELAIDE 5 Butler Boulevard, Adelaide Airport Bus Park 76% Key portfolio metrics 31 Dec Jun 2014 Investment properties Portfolio value ($ million) Weighted average cap rate 8.19% 8.29% Occupancy 93% 93% WALE (years by area)
12 Property portfolio valuation summary Property State Sector Valuation Cap Rate 34 Australis Drive, Derrimut VIC Industrial $21.6m 7.75% South Park Drive, Dandenong South VIC Industrial $18.6m 8.25% 89 West Park Drive, Derrimut VIC Industrial $15.7m 7.75% Garden Street, Kilsyth VIC Industrial $14.8m 7.75% 5 Butler Boulevard, Adelaide Airport SA Industrial $12.8m 10.00% 140 Sharps Rd, Tullamarine VIC Industrial $13.1m 8.75% 7 Clunies Ross Court and McKechnie Drive, BTP QLD Bus Park $34.0m 9.00% BTP Central, BTP QLD Bus Park $42.1m 8.21% 8 Clunies Ross Court and 9 McKechnie Drive, BTP QLD Bus Park $24.6m 8.85% 7 Brandl Street, BTP QLD Bus Park $22.4m 8.50% 37 Brandl Street, BTP QLD Bus Park $13.5m 8.75% 18 Brandl Street, BTP QLD Bus Park $11.5m 9.15% 88 Brandl Street, BTP QLD Bus Park $14.0m 8.88% 85 Brandl Street, BTP QLD Bus Park $5.0m 9.25% Building A, 1 Homebush Bay Drive, RBP NSW Bus Park $81.0m 7.50% Building C, 1 Homebush Bay Drive, RBP NSW Bus Park $51.6m 7.75% Land (Lot 3 & 6 Brandl Street) QLD Bus Park $2.0m N/A Total or Weighted Average $398.4m 8.19% 12
13 Leasing summary Good progress being made, expiry profile remains attractive Over 16,400 sqm of new and renewal leasing transactions completed over the period Post balance sheet date Interactive Pty Limited have committed to the Brisbane Technology Park by expanding into an additional 2,000 square metres and will now occupy over 4,100 square metres Modest expiry profile Key Leasing Transactions Property Tenant NLA Term 32 Garden Street, Kilsyth RFS 10,647 sqm 10.0 years 60.0% 50.0% 40.0% 30.0% 20.0% 10.0% 0.0% Lease expiry (by area) Vacant FY15 FY16 FY17 FY18 FY19 FY20 FY21 FY22+ Tenant Diversification (by income) Govt 8% Private 25% 6 Electronics Street, BTP Nexon 385 sqm 6.0 years 7 Clunies Ross Crt, BTP BTP services 1,641 sqm 1.5 years Rhodes C ABC Consulting 420 sqm 5.0 years Multi National 42% ASX Listed 25% 13

 Geographic diversification (by value) 0% 2% 4% 6% 8% 10% 12% 14% 16% Link Market Services QLD Motorways")
14 Portfolio diversity summary Industria s portfolio is well diversified Well diversified income profile By sector By geography By tenant Well diversified tenant base Contracted growth: >99% of leases with fixed or CPIlinked increases Organic growth from BTP development pipeline > Fixed & CPI 10.2% CPI 23.5% Rental Review Profile Market 0.2% Fixed 66.1% Tenant diversification (top 10 tenants by income) Geographic diversification (by value) 0% 2% 4% 6% 8% 10% 12% 14% 16% Link Market Services QLD Motorways Australand Mitre 10 AAE Retail RFS NAB Dempsey Group Interactive Pty Ltd Johnson and Johnson NSW 34% SA 3% VIC 21% QLD 42% 14


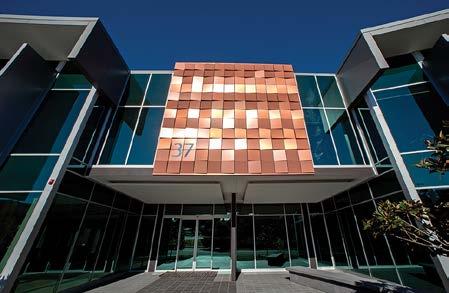
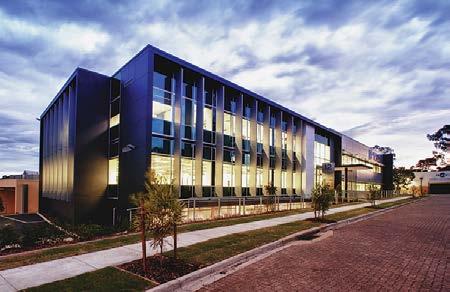
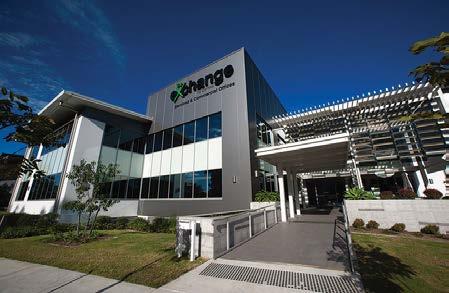
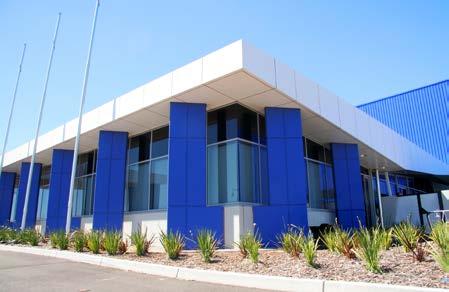
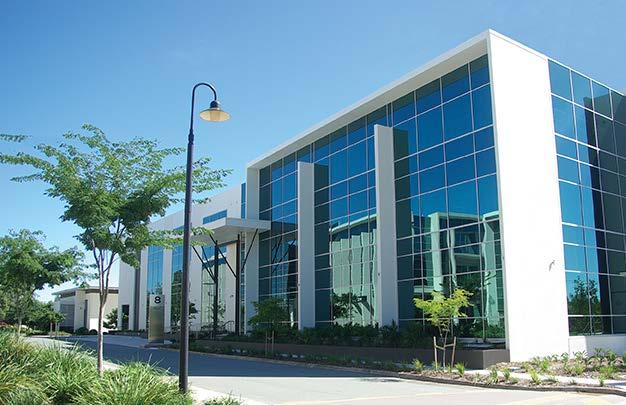
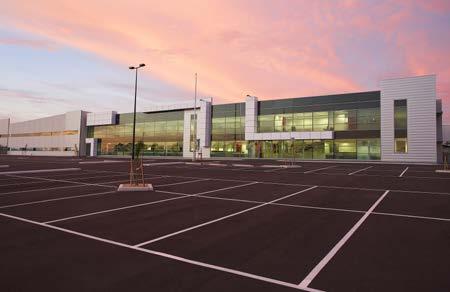
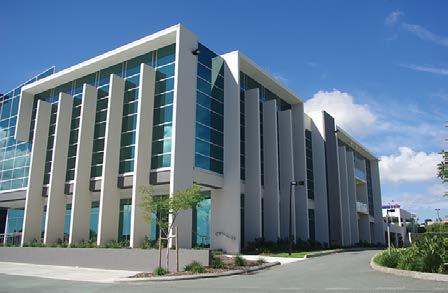
15 Industria REIT portfolio examples 15
16 CAPITAL MANAGEMENT 16
17 Capital Management Conservative capital structure Finance facilities (excluding interest rate hedges) extended and repriced post balance date resulting in reduced interest margins and line fee costs, effective February 2015 Gearing 1 of 33.1% Target gearing range of 30% to 40% $120m $100m Interest Rate Hedging Profile A$M hedged Average hedged rate (excluding margin and line fees) $100m $100m 7.00% 6.00% Multiple lenders and staggered debt expiry profile $90m Hedging profile consistent with stated policy Weighted average duration of debt 4.00 years $80m 5.00% Staggered debt maturity profile (equal 3 and 5 year original terms) $60m $65m 4.00% Debt terms 3.00% Banks Facility limit ANZ and NAB $155 million $40m $35m 2.00% Drawn $133.4 million Average interest rate 4.39% p.a. (inc. margin and hedging) $20m $10m 1.00% Hedging policy Range of 50% and 100% of drawn debt 1. Industria's debt less cash, divided by the value of the Portfolio $0m FY15 FY16 FY17 FY18 FY19 FY % 17
18 Debt covenants summary Significant headroom maintained on all covenants Covenant Limit Actual 31 December 2014 Headroom Loan to valuation ratio (Total debt / Portfolio value) 55.0% 33.5% 21.5% Gearing ratio (Total liabilities / Total tangible assets) 55.0% 37.3% 17.7% Interest cover ratio 2.0 times 4.5 times 2.5 times WALE (by income) 2.5 years 4.3 years 1.8 years 18
19 INDUSTRIA REIT OVERVIEW 19
20 Investment objectives Industria REIT Overview Overview Modern, well-located, high quality portfolio of Australian workspace assets industrial, technology park and business park properties providing a stable cash income return 17 assets valued at $398 million in Melbourne, Sydney, Brisbane and Adelaide Income focussed REIT with simple capital structure Earnings Attractive cash Distribution yield backed by a secure rental income stream and structured growth Contracted growth >99% of leases with fixed and / or CPI-linked increases Portfolio Weighted average lease expiry (by area) of 5.1 years and 93% occupancy Diversified tenant base Benign near term lease expiry profile Well diversified by sector and geography Capital Structure Conservative capital structure 33.1% gearing (30% - 40% target range) Multiple lenders and staggered debt expiries, weighted average debt expiry of 4.00 years 20


21 Asset Recycling Strategy 53 Brandl Street sold at $10.25 million sale, $1.0 million or 11.4% above book value Prudent approach to acquisition opportunities Focus remains on intensive asset management to reduce vacancy and improve portfolio WALE Exploring further asset recycling opportunities to improve sector diversification Key metrics IPO 31 Dec 2014 Portfolio value ($m) Portfolio capitalisation rate 8.44% 8.19% Weighted average lease expiry 5.8 years 5.1 years Occupancy 97% 93% Net lettable area 164,215sqm 161,272sqm NTA per Stapled Security ($) Gearing 33.8% 33.1% Weighted average debt expiry 4.0 years 4.0 years 21
22 Attractive Comparative Distribution Yield Attractive distribution yield supported by quality tenants Modest capital structure Well positioned for future growth Trading at modest premium to NTA Included in the S&P / ASX 300 A-REIT index AREIT FY2015 Forecast Distribution Yields AREIT Premium to NTA 9.0% 70% 8.0% 60% 7.0% 6.0% 50% 5.0% 40% 4.0% 30% 3.0% 2.0% 20% 1.0% 10% 0.0% GPT IOF DXS BWP NSR GOZ GMF CMA TIX AJD TOF ANI IDR 0% TOF IDR ANI AJD GMF CMA TIX GPT DXS IOF GOZ BWP NSR Source: APN, Bloomberg and company announcements/estimates based on unit prices as at market close on 13 February
23 OUTLOOK & GUIDANCE 23
24 Outlook & Guidance Industria remains focussed on its objective of delivering stable cash returns with the potential for income and capital growth A modern portfolio of workspace assets underpins Industria REIT Focus on industrial and business park assets that provide tenants with modern, cost effective and practical spaces to meet their business needs The portfolio is well positioned for growth underpinned by an attractive distribution yield Leases to a diversified tenant base providing a secure and growing income stream Rental income underpinned by high occupancy and long leases to reputable tenants Majority of income growth derived from fixed and / or CPI-linked rental increase Continue to focus on asset management initiatives and leasing objectives FY15 distribution guidance Weak operating conditions, particularly in Brisbane, as referenced at the Annual General Meeting in November 2014 have continued to slow leasing progress relative to IPO forecasts Subject to current market conditions and forecast assumptions, Distributions per Security are expected to be within a range of to cents for the full year FY15 equating to 97% - 100% of IPO forecasts 24
25 APPENDICES 25
26 APPENDIX A Detailed Property Portfolio 26
27 Portfolio details Property State Ownership Sector Valuation Cap Rate NLA (sqm) Occupancy (by area) WALE (by area) NOI $m 140 Sharps Road VIC 100% Industrial 13,100, % 10, % 7.75 yrs Australis Drive VIC 100% Industrial 21,650, % 25, % 7.92 yrs Garden Street VIC 100% Industrial 14,800, % 10, % 9.97 yrs West Park Drive VIC 100% Industrial 15,750, % 17, % 7.66 yrs South Park Drive VIC 100% Industrial 18,650, % 20, % 2.97 yrs Butler Boulevard SA 100% Industrial 12,800, % 12, % 2.05 yrs 0.68 Rhodes C, 1 Homebush Bay Drive NSW 100% Business Park 51,600, % 10,580 75% 2.36 yrs 1.34 Rhodes A, 1 Homebush Bay Drive NSW 100% Business Park 81,000, % 14, % 6.24 yrs Brandl Street QLD 100% Tech/Bus Park 11,500, % 4,174 52% 0.99 yrs Brandl Street QLD 100% Tech/Bus Park 13,500, % 3, % 2.76 yrs 0.64 BTP Central (Incl vacant land) QLD 100% Tech/Bus Park 42,100,000 7, Brandl Street QLD 100% Tech/Bus Park 22,400, % 5,264 88% 5.22 yrs Clunies Ross Court QLD 100% Tech/Bus Park 34,000, % 8,937 59% 1.35 yrs Clunies Ross Court QLD 100% Tech/Bus Park 24,600, % 5, % 1.67 yrs Brandl Street QLD 100% Tech/Bus Park 5,000, % 1,627 0% - (0.02) 88 Brandl Street QLD 100% Tech/Bus Park 14,000, % 3, % 2.94 yrs 0.53 Land (Lot 3 Brandl Street) QLD 100% Other 995, Land (Lot 6 Brandl Street) QLD 100% Other 990, Total 398,435, % 161,272 93% 5.1 yrs 53 Brandl Street (property sold in period) 0.21 Total investment property income

28 APPENDIX B Financial Information 28
29 Financial Position 31 December 2014 $ 000s Assets Cash and cash equivalents 1,545 Trade and other receivables 4,285 Other current assets 547 Total current assets 6,377 Investment properties 398,435 Other non-current assets 83 Total non-current assets 398,518 Total assets 404,895 Liabilities Trade payables and other provisions (16,254) Total current liabilities (16,254) Trade and other payables (2,435) Deferred tax liability (2,823) Long-term borrowings (132,508) Total non-current liabilities (137,766) Total liabilities (154,020) Net assets 250,875 Equity Contributed equity 224,619 Retained earnings 26,256 Total Equity 250,875 Number of Stapled Securities (millions) 125 NTA per Stapled Security ($)
30 Profit & Loss Actual IPO Variance 1H15 1H15 $ 000 $ 000 $ 000 Income Net rental income and share of equity accounted profit 1 14,921 16,043 (1,122) Expenses Fund management fee (1,163) (1,070) (93) Recurring fund costs (367) (289) (78) Net operating income (EBIT) 13,391 14,684 (1,293) Interest expense (net) (3,317) (2,980) (337) Net income before tax 10,074 11,704 (1,630) Income tax deferred (442) - (442) Net income after tax 9,632 11,704 (2,072) Other items: Net gain / (loss) in fair value adjustments on investment properties 2,803 (76) 2,879 Gain on sale of investment property Fair value loss on derivatives (1,799) - (1,799) Net profit attributable to security holders of Industria REIT 11,201 11,628 (427) Notes 1. Net rental income includes rental income and other income after straight lining adjustments, net of outgoing recoveries and costs 30
31 Distribution reconciliation Actual 1H15 IPO 1H15 $ 000 $ 000 Net profit attributable to security holders of Industria REIT 11,201 11,628 Reverse net gain / loss in fair value adjustments on investment properties (2,803) 76 Add back fair value loss on derivatives 1,799 - Reverse straight lining of rental income adjustments (660) (1,271) Add back amortised borrowing costs Add back deferred tax Distributable Earnings 10,151 10,532 Distribution 10,450 10,450 Securities on issue (millions) Distributable Earnings per Security (cents) Distribution per Security (cents) Payout ratio (Distribution / Distributable Earnings) 102.9% 99.2% Tax deferred component of Distribution 49% 31% Note: The distribution reconciliation above excludes the add back of amortised lease incentive costs as permitted under PCA Funds From Operations (FFO) guidelines. The impact to the 1H15 payout ratio if the PCA FFO definition is followed is shown below: Distributable Earnings 10,151 Add back amortised lease incentives 484 FFO Distributable Earnings 10,635 Payout ratio (Distribution / FFO Distributable Earnings) 98.3% 31
32 Disclaimer This presentation was prepared by APN Funds Management Limited (ABN ) (the "Responsible Entity") in respect of Industria REIT (ARSN ) ( IDR") and by Industria Company No 1 Limited (ACN ). Information contained in this presentation is current as at 19 February This presentation is provided for information purposes only and has been prepared without taking account of any particular reader s financial situation, objectives or needs. Nothing contained in this presentation constitutes investment, legal, tax or other advice. Accordingly, readers should, before acting on any information in this presentation, consider its appropriateness, having regard to their objectives, financial situation and needs, and seek the assistance of their financial or other licensed professional adviser before making any investment decision. This presentation does not constitute an offer, invitation, solicitation or recommendation with respect to the subscription for, purchase or sale of any security, nor does it form the basis of any contract or commitment. Except as required by law, no representation or warranty, express or implied, is made as to the fairness, accuracy or completeness of the information, opinions and conclusions, or as to the reasonableness of any assumption, contained in this presentation. By reading this presentation and to the extent permitted by law, the reader releases the Responsible Entity and its affiliates, and any of their respective directors, officers, employees, representatives or advisers from any liability (including, without limitation, in respect of direct, indirect or consequential loss or damage or loss or damage arising by negligence) arising in relation to any reader relying on anything contained in or omitted from this presentation. The forward looking statements included in this presentation involve subjective judgment and analysis and are subject to significant uncertainties, risks and contingencies, many of which are outside the control of, and are unknown to, the Responsible Entity. In particular, they speak only as of the date of these materials, they assume the success of IDR's business strategies, and they are subject to significant regulatory, business, competitive and economic uncertainties and risks. Actual future events may vary materially from forward looking statements and the assumptions on which those statements are based. Given these uncertainties, readers are cautioned not to place reliance on such forward looking statements. Past performance is not a reliable indicator of future performance. The Responsible Entity, or persons associated with it, may have an interest in the securities mentioned in this presentation, and may earn fees as a result of transactions described in this presentation or transactions in securities in IDR. 32
 8656 1000 lparisi@industriareit.com.")

33 Contact Laurence Parisi Fund Manager Ph: (03) Industria REIT Level 30,101 Collins Street, Melbourne, Vic 3000 industriareit.com.au 33
2016 FINANCIAL YEAR RESULTS PRESENTATION
 2016 FINANCIAL YEAR RESULTS PRESENTATION 22 August 2016 www.industriareit.com.au ASX CODE: IDR Agenda 01 Highlights and Investment Proposition 02 Financial results 03 Portfolio performance 04 Capital management
1H18 RESULTS PRESENTATION
 1H18 RESULTS PRESENTATION 19 February 2018 www.industriareit.com.au ASX: IDR Agenda 01 Highlights 02 Investment Proposition 03 Portfolio performance 04 Outlook Appendices 2 01 1H18 Highlights WesTrac Newcastle
For personal use only
 2015 AGM Chairman s script [Slide 1 - Cover] [Introduction] Good morning Ladies and Gentlemen and welcome to the second Annual Meeting for Industria REIT. As it is now 10:00 am and we have a quorum present,
FY17 RESULTS PRESENTATION
 FY17 RESULTS PRESENTATION 23 August 2017 www.industriareit.com.au ASX: IDR Agenda 01 Highlights and financial results 02 Investment Proposition 03 Portfolio performance 04 Outlook Appendices 2 01 FY17
APPENDIX 4D. Industria Trust No. 1 (ARSN ) Half-Year Report. Half-year ended 31 December 2014
 Half-Year Report. Half-year ended 31 December 2014") Page 1 Appendix 4D Half Year Report Half-year ended 31 December 2014 APPENDIX 4D Industria Trust No. 1 (ARSN 125 862 875) Half-Year Report Half-year ended 31 December 2014 Note on Stapling Arrangement
Page 1 Appendix 4D Half Year Report Half-year ended 31 December 2014 APPENDIX 4D Industria Trust No. 1 (ARSN 125 862 875) Half-Year Report Half-year ended 31 December 2014 Note on Stapling Arrangement
For personal use only
 Growthpoint Properties Australia (ASX Code: GOZ) Growthpoint Properties Australia Trust ARSN 120 121 002 Growthpoint Properties Australia Limited ABN 33 124 093 901 AFSL 316409 For personal use only www.growthpoint.com.au
GARDA DIVERSIFIED PROPERTY FUND HALF YEAR RESULTS PRESENTATION 26 FEBRUARY 2016
 GARDA DIVERSIFIED PROPERTY FUND HALF YEAR RESULTS PRESENTATION 26 FEBRUARY 2016 INSERT GDF OVERVIEW TITLE HERE PORTFOLIO CAPITAL $140.7M PORTFOLIO VALUE Valuations at 1 April 2015. 8.9% $0.09 per unit
Centuria Urban REIT 576 SWAN STREET, RICHMOND VIC
 Centuria Urban REIT 576 SWAN STREET, RICHMOND VIC PAGE 01 01. 02. 03. 04. 05. Results Overview Porfolio Overview Capital Mangement Strategy & Guidance Appendices Results Overview Section 1 Results Overview
PROPERTY FUND 2015 FULL YEAR RESULTS PRESENTATION 28 AUGUST GARDA DIVERSIFIED PROPERTY FUND 2015 FULL YEAR RESULTS PRESENTATION
 INSERT GARDA TITLE DIVERSIFIED HERE PROPERTY FUND 2015 FULL YEAR RESULTS PRESENTATION 28 AUGUST 2015 1 GARDA DIVERSIFIED PROPERTY FUND 2015 FULL YEAR RESULTS PRESENTATION CONTENTS GARDA DIVERSIFIED PROPERTY
Australian Unity Office Fund
 Australian Unity Office Fund (ASX: AOF) 2018 Full Year Results Presentation 24 August 2018 Webcast: https://fnn.webex.com/fnn/onstage/g.php?mtid=e0f48b0535622fe807610ffb3ef1ac4ab Teleconference details:
16.1c c c
 1 2016 Interim Result Highlights Successful delivery, ahead of PDS 2 Exceeded revised earnings guidance Six months to 31 Dec 15 Solid capital management 7.97c 7.65c $2.15 28.3% Earnings per unit Distribution
Not for distribution or release in the United States or to, or for the account or benefit of, US Persons
 3 December 2008 DEXUS Funds Management Limited ABN 24 060 920 783 AFSL: 238163 Level 9, 343 George Street Sydney NSW 2000 The Manager Australian Stock Exchange Limited 20 Bridge Street Sydney NSW 2000
For personal use only
 NATIONAL STORAGE REIT JP MORGAN AUSTRALIAN REIT FORUM ASIA MARCH 2017 IMPORTANT NOTE & DISCLAIMER This presentation has been prepared by National Storage REIT ( NSR ) comprising National and may involve
DEXUS Property Group. Institutional placement 3 December m securities at $0.73 to $0.84 raising $286m - $329m
 DEXUS Property Group Institutional placement 3 December 2008 391.7m securities at $0.73 to $0.84 raising $286m - $329m DEXUS Funds Management Limited ABN 24 060 920 783 Australian Financial Services Licence
For personal use only
 GENERATION HEALTHCARE REIT (ASX CODE: GHC) 2013 QUEENSLAND CONFERENCE 9 OCTOBER 2013 generationreit.com.au AGENDA Who/what is Generation Healthcare The Healthcare Sector A Snap shot Why Healthcare property
11 February 2019 Charter Hall Long WALE REIT FY19 Half Year Results 6 months to 31 December 2018 Optima Centre, Perth, WA
 11 February 2019 Charter Hall Long WALE REIT FY19 Half Year Results 6 months to 31 December 2018 Optima Centre, Perth, WA 2019 half year results Agenda 1. FY19 half year highlights 3 2. Financial performance
NATIONAL STORAGE REIT (NSR) 2018 ANNUAL GENERAL MEETING ADDRESSES
 2018 ANNUAL GENERAL MEETING ADDRESSES") P 1800 683 290 A Level 23, 71 Eagle Street, Brisbane QLD 4000 P GPO Box 3239 QLD 4001 E invest@nationalstorage.com.au nationalstorage.com.au 14 November 2018 ASX Market Announcements Office ASX Limited
P 1800 683 290 A Level 23, 71 Eagle Street, Brisbane QLD 4000 P GPO Box 3239 QLD 4001 E invest@nationalstorage.com.au nationalstorage.com.au 14 November 2018 ASX Market Announcements Office ASX Limited
For personal use only
 Growthpoint Properties Australia (ASX Code: GOZ) Half Year Results Presentation Six Months Ended 31 December 2011 20 February 2012 Growthpoint Properties Australia Trust ARSN 120 121 002 Growthpoint Properties
SCA Property Group. For personal use only. Investor update. Merimbula (Tura Beach), NSW
, NSW") SCA Property Group Investor update Merimbula (Tura Beach), NSW 28 February 2013 Delivering on objectives set out in PDS Successful formation of SCA Property Group: New units transferred to Woolworths shareholders
SCA Property Group Investor update Merimbula (Tura Beach), NSW 28 February 2013 Delivering on objectives set out in PDS Successful formation of SCA Property Group: New units transferred to Woolworths shareholders
Charter Hall Long WALE REIT
 Bunnings, South Mackay, Queensland Australian Tax Office, Adelaide, South Australia Coles Distribution Centre, Perth, Western Australia 18 August 2017 Charter Hall Long WALE REIT FY17 Results Agenda 1.
For personal use only
 FY2014 RESULTS PRESENTATION 27 AUGUST 2014 Contents FY2014 Highlights Financial Results Group Performance Funds Management Platform Outlook Appendices FY2014 HIGHLIGHTS FY2014 Highlights Financial Results
For personal use only
 Growthpoint Properties Australia (ASX Code: GOZ) Growthpoint Properties Australia Trust ARSN 120 121 002 Growthpoint Properties Australia Limited ABN 33 124 093 901 AFSL 316409 www.growthpoint.com.au Annual
Highlights. Commonwealth Property Office Fund (CPA) Quarterly update to 31 March April Solid result in a challenging environment
 Quarterly update to 31 March April Solid result in a challenging environment") Commonwealth Property Office Fund (CPA) Quarterly update to 31 March 2013 23 April 2013 Highlights Solid result in a challenging environment 96.2% occupancy 1 4,382 sqm of space leased or renewed WALE
Commonwealth Property Office Fund (CPA) Quarterly update to 31 March 2013 23 April 2013 Highlights Solid result in a challenging environment 96.2% occupancy 1 4,382 sqm of space leased or renewed WALE
ASX CEO CONNECT PRESENTATION. Viva Energy REIT ASX CEO Connect Presentation 29 March 2018
 ASX CEO CONNECT PRESENTATION Viva Energy REIT ASX CEO Connect Presentation 29 March 2018 AGENDA Highlights 4 Financial Results 7 Portfolio Update 11 Industry Update 18 Strategy & Outlook 20 Questions &
For personal use only
 GARDA DIVERSIFIED PROPERTY FUND (ASX CODE: GDF) HALF YEAR RESULTS PRESENTATION 21 FEBRUARY 2017 GDF AT A GLANCE $183 MILLION COMMERCIAL AND INDUSTRIAL PORTFOLIO ~$120 MILLION MARKET CAPITALISATION 3.8
Goldman Sachs Ninth Annual Mid-Cap Conference
 Presented by Simon Owen, CEO 17 APRIL 2018 INGENIA COMMUNITIES GROUP Goldman Sachs Ninth Annual Mid-Cap Conference Contents Business overview 3 1H18 results highlights 7 Capital management 8 Future growth
Viva Energy REIT Annual General Meeting 10.00am 15 May 2018
 V V R A N N U A L G E N E R A L M E E T I N G Viva Energy REIT Annual General Meeting 10.00am 15 May 2018 Disclaimer: This presentation has been prepared by Viva Energy REIT ( VVR or Viva Energy REIT )
Multiplex Prime Property Fund
 Multiplex Prime Property Fund 2009 Interim Results 23 February 2009 1 Important Notices Whilst every effort is made to provide accurate and complete information, this presentation has been prepared in
Cromwell Prospering in a low growth world
 Cromwell Prospering in a low growth world Hong Kong & Singapore May 2013 Cromwell Property Group 1 Important Information & Disclaimer Purpose This presentation is dated 9 May 2013 and is made on behalf
Centuria Industrial REIT
 Centuria Industrial REIT BAML Australian Real Estate Conference 25 October 2017 24-32 STANLEY DRIVE, SOMERTON, VIC 1 2 3 4 5 Introduction Portfolio Overview Market Overview Q1 Operating Update Strategy
ANNUAL RESULTS 30 JUNE 2015
 ANNUAL RESULTS 30 JUNE 2015 SECURING TODAY, WITH A FOCUS ON TOMORROW 12 August 2015 David Carr, Chief Executive Officer Stuart Harrison, Chief Financial Officer AGENDA Result summary Financial summary
HY17 Results Presentation
 Artist s impression of Ashfield Central residential development, Sydney NSW It s all about the property HY17 Results Presentation HY17 financial summary 14 Martin Place, Sydney NSW Statutory profit Underlying
For personal use only
 GROWTHPOINT PROPERTIES AUSTRALIA TRUST ARSN 120 121 002 GROWTHPOINT PROPERTIES AUSTRALIA LIMITED ABN 33 124 093 901 AFSL 316409 ASX ANNOUNCEMENT GROWTHPOINT PROPERTIES AUSTRALIA (ASX Code: GOZ) RESULTS
Ingenia Communities Group
 INGENIA COMMUNITIES GROUP Morgan s Investor Queensland Conference Conference Ingenia Communities Group 23 October 2015 October 2015 Lakeside Lara, Lara, VIC OUR BUSINESS Ingenia is a leading owner, operator
For personal use only
 Challenger Diversified Property Group Half-year update 31 December 2013 Challenger Diversified Property Group comprising: Challenger Diversified Property Trust 1 (ARSN 121 484 606) Challenger Diversified
Presented by Simon Owen 20 September Ingenia Lifestyle South West Rocks INGENIA COMMUNITIES GROUP ASX CEO SESSIONS
 Presented by Simon Owen 20 September 2016 Ingenia Lifestyle South West Rocks INGENIA COMMUNITIES GROUP ASX CEO SESSIONS Page 2 Business Overview Creating Australia s best lifestyle communities Over 5,000
ASX ANNOUNCEMENT GROWTHPOINT PROPERTIES AUSTRALIA (ASX Code: GOZ)
") ASX ANNOUNCEMENT GROWTHPOINT PROPERTIES AUSTRALIA (ASX Code: GOZ) Presentation to the combined Annual General Meeting and General Meeting Pursuant to ASX Listing Rule 3.13.3, the Chairman s and Managing
ASX ANNOUNCEMENT GROWTHPOINT PROPERTIES AUSTRALIA (ASX Code: GOZ) Presentation to the combined Annual General Meeting and General Meeting Pursuant to ASX Listing Rule 3.13.3, the Chairman s and Managing
ASIC REGULATORY GUIDE 46 DISCLOSURE
 ASIC REGULATORY GUIDE 46 DISCLOSURE UNLISTED PROPERTY SCHEMES IMPROVING DISCLOSURE FOR RETAIL INVESTORS SECTION 2: DISCLOSURE PRINCIPLES AS THEY APPLY TO FUNDS ARSN 601 833 363 APN Funds Management Limited
ALE Property Group December 2015 Half Year Results 16 February 2016
 ALE Property Group December 2015 Half Year Results 16 February 2016 Somerville Hotel, Somerville, Melbourne, VIC Follow ALE Property on: 1 Contents Results Highlights December 2015 Half Year Results Properties
HALF YEAR REVIEW 360 CAPITAL INDUSTRIAL FUND (ASX: TIX) OVERVIEW FUND FOR THE HALF-YEAR ENDED 31 DECEMBER 2013
 OVERVIEW FUND FOR THE HALF-YEAR ENDED 31 DECEMBER 2013") 360 CAPITAL INDUSTRIAL FUND (ASX: TIX) HALF YEAR REVIEW FOR THE HALF-YEAR ENDED 31 DECEMBER 2013 FUND OVERVIEW 360 Capital Industrial Fund (ASX code: TIX) is an ASX-listed real estate investment trust
360 CAPITAL INDUSTRIAL FUND (ASX: TIX) HALF YEAR REVIEW FOR THE HALF-YEAR ENDED 31 DECEMBER 2013 FUND OVERVIEW 360 Capital Industrial Fund (ASX code: TIX) is an ASX-listed real estate investment trust
For personal use only. AIMS Property Securities Fund Investor Update
 AIMS Property Securities Fund Investor Update Balance Sheet Audited Figures as at 31 December 2014 Unaudited Figures as at 28 April 2015 Current Assets Cash and cash equivalents 1,527 5,059 Trade and other
Half-year results to 31 December 2017
 Half-year results to 31 December 2017 February 2018 Important notice The information provided in this presentation should be considered together with the financial statements for the period and previous
Arena Office Fund FY14 annual results presentation. 3 September 2014
 Arena Office Fund FY14 annual results presentation 3 September 2014 www.arenainvest.com.au Presenters James Goodwin Andrew Nicol Rob de Vos Joint Managing Director Appointed to the Board in January 2012.
Multiplex Acumen Property Fund
 Multiplex Acumen Property Fund 2008 Consolidated Full Year Results 28 August 2008 1 Important Notices Whilst every effort is made to provide accurate and complete information, this presentation has been
Challenger Diversified Property Group
 Challenger Diversified Property Group Challenger Diversified Property Group Half-year ended 31 December 2012 update Challenger Diversified Property Group Comprising: Challenger Diversified Property Trust
For personal use only
 1H12 Results Briefing Agenda. 1H12 Result 3 Residential 17 Investment Property 6 Strategy & Outlook 26 Commercial & Industrial 11 Appendices 29 26 July 2012 2 1H12 Result First half operating highlights.
For personal use only
 ALE Property Group Annual General Meeting 25 October 2016 Crows Nest Hotel, Sydney, NSW 1 Contents Highlights ALE s 13 Years of Equity Performance FY16 Results Properties and Development Case Studies Capital
Annual Results FY A U G U S T V I T A L H E A L T H C A R E P R O P E R T Y T R U S T
 V I T A L H E A L T H C A R E P R O P E R T Y T R U S T Annual Results FY 2 0 1 8 0 9 A U G U S T 2 0 1 8 IN V E S T IN G IN A U S T R A L A S IA S H E A L T H C A R E IN F R A S T R U C T U R E H I G
Centuria Industrial REIT
 Centuria Industrial REIT 1H18 Interim Results 1 ASHBURN ROAD, BUNDAMEA, QLD Centuria Capital ASX listed specialist investment manager Centuria Capital Group $4.6b Funds Under Management Funds Management
by mirvac fy13 q operational update 25 october 2012 Artist s impression of old treasury building, perth, wa
 fy13 q operational update 25 october 2012 Artist s impression of old treasury building, perth, wa agenda FY13 Q1 Operational Update Introduction Q1 Operational Update Investment Division Update Development
HY18 Results Presentation Appendices
 187 Todd Road, Port Melbourne VIC HY18 Results Presentation Appendices Appendix A Segment balance sheet Abacus balance sheet Property Investment Property Development Unallocated HY18 FY17 ($m) ($m) ($m)
q operational update 22 october 2013 by mirvac
 q operational update 22 october 2013 Q1 snapshot Q1 OPERATIONAL UPDATE I 22 OCTOBER 2013 I PAGE 1 FY14 operating EPS guidance of 11.7 to 12.0cpss maintained S&P credit rating upgrade from BBB to BBB+ Completed
INTERIM RESULTS 31 DECEMBER 2016
 INTERIM RESULTS 31 DECEMBER 2016 BUILDING A HEALTHY FUTURE 23 February 2017 David Carr, Chief Executive Officer Stuart Harrison, Chief Financial Officer AGENDA Highlights Strategy Financials Portfolio
For personal use only
 17 August 2016 2016 Annual results Positioned for future growth DEXUS Property Group (DEXUS) today posted a strong 2016 financial result, with Funds from Operations and distribution per security growth
Property Acquisitions
 Property Acquisitions 7 november 2013 Overview Property Acquisitions I 7 November 2013 I page 1 Strategic acquisitions of quality assets in core locations with value add potential Mirvac has entered into
INTERIM RESULTS 31 DECEMBER 2014
 INTERIM RESULTS 31 DECEMBER 2014 DEVELOPING OUR PORTFOLIO DELIVERING ON STRATEGY 26 February 2015 David Carr, Chief Executive Officer Stuart Harrison, Chief Financial Officer AGENDA Result summary Financial
For personal use only
 Communities Group Investment in Manufactured Home Estates 15 February 2013 Executive summary > Communities announces its acquisition of The Grange Village, a seniors lifestyle community in Morisset, NSW.
ALE Property Group December 2014 Half Year Results 5 February 2015
 ALE Property Group December 2014 Half Year Results 5 February 2015 The Breakfast Creek Hotel, Brisbane, QLD New: Follow ALE Property on: 1 Contents Highlights December 2014 Half Year Results Properties
MIRVAC GROUP 3 MAY Management Update INCLUDING 3Q16 HIGHLIGHTS
 MIRVAC GROUP 3 MAY 2016 Management Update INCLUDING 3Q16 HIGHLIGHTS URBAN FOCUS > We are an urban company, we create places for people to live, work and shop > We understand the fabric of cities and the
GDI PROPERTY GROUP. FY14 Annual Results Presentation
 GDI PROPERTY GROUP FY14 Annual Results Presentation 25 August 2014 Disclaimer This presentation has been prepared and issued by GDI Property Group Limited (ACN 166 479 189) and GDI Funds Management Limited
601 Coronation Drive Fund
 60 Coronation Drive Fund Investor Update For the Quarter Ending 3 December 207 Fund Manager Capital Property Funds Pty Limited ACN 62 323 506 Responsible Entity One Managed Investment Funds Limited ACN
Australian Education Trust
 Australian Education Trust ASX ANNOUNCEMENT 18 February 2014 AET Results for the Half-Year Ended 31 December 2013 Folkestone Investment Management Limited (FIML) as the Responsible Entity of the Australian
Offshore Investor Presentation April
 Offshore Investor Presentation April 2008 www.stockland.com.au Stockland s Position in the A-REIT Sector Stockland was formed in 1952 and pioneered the stapled security structure Stockland s current position*
STOCKLAND DIRECT OFFICE TRUST NO.1
 5Stockland Direct Half year Investment Report 31 December 2005 STOCKLAND DIRECT OFFICE TRUST NO.1 Half year Investment Report 31 December 2005 WATERFRONT PLACE BRISBANE, QLD The Directors and Management
For personal use only
 INGENIA COMMUNITIES GROUP 2018 Annual General Meeting 13 NOVEMBER 2018 Meeting outline 2 Chairman s welcome NON-EXECUTIVE DIRECTORS CHAIRMAN Jim Hazel DEPUTY CHAIRMAN Rob Morrison DIRECTOR Amanda Heyworth
The Everton Park Hotel, Brisbane
 The Everton Park Hotel, Brisbane Annual Results Briefing 30 June 2017 Important Notice This presentation has been prepared by Hotel Property Investments Limited as Responsible Entity of the Hotel Property
Centuria Property Funds No. 2 Limited CENTURIA INDUSTRIAL REIT. Strategic Acquisitions and Capital Raising
 Australian Securities Exchange - Company Announcements Platform Centuria Property Funds No. 2 Limited CENTURIA INDUSTRIAL REIT Strategic Acquisitions and Capital Raising Sydney, 29 June 2017: Centuria
For personal use only
 AIMS Property Securities Fund (APW or the Fund) AIMS Fund Management Limited (AIMS or the Responsible Entity) Annual Results Presentation August 2015 Balance Sheet 2015 2014 Current Assets Cash and cash
INGENIA COMMUNITIES GROUP. Sales & Marketing Investor Tour
 INGENIA COMMUNITIES GROUP Sales & Marketing 2018 Investor Tour Table of Contents Delivering Consistent Sales Growth Year on Year 1 Key to FY18 success Market conditions Focus to deliver consistent results
601 Coronation Drive Fund
 60 Coronation Drive Fund Investor Update For the Quarter Ending 3 March 208 Fund Manager Capital Property Funds Pty Limited ACN 62 323 506 Responsible Entity One Managed Investment Funds Limited ACN 7
Australian Unity Property Income Fund. Disclosure Principles and Benchmarks 1-3. Portfolio diversification. 31 December 2014
 31 December 2014 Australian Unity Property Income Fund The Australian Securities & Investments Commission (ASIC) requires responsible entities of unlisted property schemes in which retail investors invest
Q3 operational update
 Q3 operational update 9 may 2013 Q3 key outcomes n FY13 operating guidance of 10.7 to 10.8cpss maintained n MPT continues to deliver strong metrics: 98.2% occupancy 1 5.3 year WALE 2 Strong MAT growth
For personal use only
 DEXUS Property Group (ASX: DXS) ASX release 18 December 2015 DEXUS and IOF enter into Implementation Agreement presentation DEXUS Funds Management Limited, the responsible entity of DEXUS Property Group
Centuria Diversified Property Fund
 Centuria Diversified Property Fund The Centuria Diversified Property Fund aims to provide monthly tax effective income and the potential for long-term capital growth by investing in a diversified portfolio
For personal use only
 FY2015 RESULTS PRESENTATION 24 AUGUST 2015 www.apngroup.com.au ASX Code: APD Contents FY2015 Highlights Financial Results Group Performance Update on Equity Raising Initiatives Outlook Appendices FY2015
For personal use only
 2016 Annual Results Presentation TOTAL RETURN FUND ASX: TOT 24 August 2016 360 Capital Investment Management Limited (ACN 133 363 185) as responsible entity for the 360 Capital Total Return Passive Fund
RUS trilogyfunds.com.au
 Tower Central Trust Benchmarks and Disclosure Principles Report for ASIC Regulatory Guide 46 as at 31 October RUS 2018 trilogyfunds.com.au Trilogy Funds Management Limited ABN 59 080 383 679, AFSL 261425
Centuria Capital Group. 1H18 Results ASX:CNI 15 February 2018
 Centuria Capital Group 1H18 Results ASX:CNI 15 February 2018 CENTURIA CAPITAL GROUP I 1 Overview & Highlights 1H18 RESULTS I 2 ASX:CNI 1H18 Financial Results 1H18 Results I 15 FEBRUARY 2018 3 Property
Interim Results For the six months ended 30 September 2017
 Interim Results For the six months ended 30 September 2017 Agenda & Contents Page Welcome Highlights 3 Financial Performance 6 Capital Management 10 Portfolio Overview 12 Development Project 16 Asset Management
Ingenia Communities Group ASX Investor Series
 Ingenia Communities Group ASX Investor Series 10 November 2014 White Albatross Holiday Park, Nambucca Heads NSW Group overview Pro forma asset value* 23% 38% Garden Villages 39% Lifestyle Parks Settlers
For personal use only
 Annual Results Financial year ending 30 June 2012 27 August 2012 For personal use only Contents Results summary Key achievements Funds under management Business structure Strategy P&L statement Balance
Offer for Colonial First State Property Trust Group
 Offer for Colonial First State Property Trust Group Mirvac Announces Offer to Acquire All Issued Units in Colonial First State Property Trust Group This Offer Delivers Positive Benefits to the Unitholders
HY14 highlights growth across the business
 Agenda HY14 key highlights and MD thoughts Financial highlights and capital position Operational updates Commercial portfolio Storage portfolio Property ventures Funds under management Outlook Appendices
HIGHLIGHTS PROPERTY FOR INDUSTRY 2017 INTERIM RESULTS BRIEFING
 HIGHLIGHTS Internalisation of management on 30 June 2017 Increased guidance: distributable profit of between 7.70 and 7.90 cents per share, cash dividend of 7.45 cents per share Transition of the Penrose
For personal use only
 GDI PROPERTY GROUP Half yearly results presentation 20 February 2017 Disclaimer This presentation has been prepared and issued by GDI Property Group Limited (ACN 166 479 189) and GDI Funds Management Limited
ProFile. Responsible Entity: Folkestone Investment Management Limited ABN AFsl Folkestone Education Trust Profile 1
 Folkestone Education Trust ProFile Responsible Entity: Folkestone Investment Management Limited ABN 46 111 338 937 AFsl 281544 Folkestone Education Trust Profile 1 Contents TRUST AT A GLANCE 3 FET KEY
KNOWING YOUR INVESTMENT (ARSN ) INDEX
 INDEX") This is not an asset of the Fund AUSTGROWTH PROPERTY SYNDICATE No. 23 (ARSN 108 542 043) This Enhanced Disclosure document provides Information Pursuant to ASIC s Regulatory Guide 46 Disclosure Principles
This is not an asset of the Fund AUSTGROWTH PROPERTY SYNDICATE No. 23 (ARSN 108 542 043) This Enhanced Disclosure document provides Information Pursuant to ASIC s Regulatory Guide 46 Disclosure Principles
For personal use only
 Good morning, and welcome to the GPT Metro Office Fund Annual Results for 2015. In recognition of GPT s commitment to a Reconciliation Action Plan, I would like to acknowledge and pay respect to the traditional
For personal use only
 29 August 203 The Manager Company Announcements Office ASX Limited Level 4, Exchange Centre 20 Bridge Street SYDNEY NSW 2000 Westfield Group Level 30 85 Castlereagh Street Sydney NSW 2000 GPO Box 4004
ASX/Media Announcement
 ASX/Media Announcement 13 February 2018 Propertylink delivers a strong HY18 result, well positioned to deliver FY18 guidance Propertylink Group (ASX:PLG) today announces strong financial and operational
Centuria Metropolitan REIT. Annual Report
 Centuria Metropolitan REIT Annual Report 2015 Contents About Us... 2 Letter from Chairman... 3 Fund update... 4 Strategy & Objectives... 8 FY15 Results... 9 Portfolio Summary... 10 Portfolio Overview...
FY18 Results Presentation Bravura Solutions Limited. 28 August 2018
 FY18 Results Presentation Bravura Solutions Limited 28 August 2018 Important notice and disclaimer The information contained in this document (including this notice) and discussed at this presentation
For personal use only
 FY15 Annual Results Presentation 26 August 2015 This presentation is a summary of the annual financial results and should be read in conjunction with the Trust s FY15 Annual Results Announcement dated
KNOWING YOUR INVESTMENT (ARSN ) INDEX
 INDEX") AUSTGROWTH PROPERTY SYNDICATE No. 23 (ARSN 108 542 043) This Enhanced Disclosure document provides Information Pursuant to ASIC s Regulatory Guide 46 Disclosure Principles Information contained herein
AUSTGROWTH PROPERTY SYNDICATE No. 23 (ARSN 108 542 043) This Enhanced Disclosure document provides Information Pursuant to ASIC s Regulatory Guide 46 Disclosure Principles Information contained herein
Interim Results. For the six months ended 30 September 2016
 Interim Results For the six months ended 30 September 2016 Agenda & Contents Highlights Financial Performance Capital Management Portfolio Overview Development Projects Acquisitions Strategy Overview Conclusion
9 August 2018 MIRVAC GROUP FULL YEAR RESULTS 30 JUNE 2018
 9 August 2018 MIRVAC GROUP FULL YEAR RESULTS 30 JUNE 2018 Mirvac Group (Mirvac) [ASX: MGR] today announced its full-year results for the financial year ended 30 June 2018 (FY18), with the Group delivering
AIMS AMP CAPITAL INDUSTRIAL REIT
 AIMS AMP CAPITAL INDUSTRIAL REIT FY2013: 2 nd Quarter Ended 30 September 2012 Results Presentation 24 October 2012 Important Notice Disclaimer This Presentation is focused on comparing actual results for
Centuria Capital Group
 Centuria Capital Group FY17 Annual Results 1 Overview 2 FY17 financial highlights 3 Property funds management 4 Unlisted property funds 5 Listed property funds 6 Investment bonds 7 Conclusion 8 Appendices
ASX ANNOUNCEMENT. Abacus Property Group Full Year Results. Results highlights
 ASX ANNOUNCEMENT Abacus Property Group - 2017 Full Year Results Results highlights The Group s 1 consolidated AIFRS statutory profit is $285.1 million up 53% from $185.9 million in FY16 Abacus underlying
For personal use only SCA PROPERTY GROUP. Acquisitions and Placement. 11 June 2015
 SCA PROPERTY GROUP Acquisitions and Placement 11 June 2015 MARKET UPDATE FY15 Earnings guidance upgraded FY15 Distributable Earnings guidance increased to 12.8 cpu (from 12.6 cpu) FY15 Distribution guidance