EBA REPORT RESULTS FROM THE 2016 HIGH DEFAULT PORTFOLIOS (HDP) EXERCISE. 03 March 2017
|
|
|
- Nelson Haynes
- 5 years ago
- Views:
Transcription
 EXERCISE 03 March")
1 EBA REPORT RESULTS FROM THE 2016 HIGH DEFAULT PORTFOLIOS (HDP) EXERCISE 03 March 2017
2 Contents List of figures 3 Abbreviations 6 1. Executive summary 7 2. Introduction and legal background Dataset and assessment methodology Portfolio composition and representativeness Top-down approach Cross-sectional (distribution analysis) and outturns (backtesting) approaches Impact analysis using the CET1 ratio Competent Authorities assessments 51 Annex 1: List of participating institutions in supervisory benchmarking exercises 58 Annex 2: Source of data 60 Annex 3: Data availability and data quality constraints 62 Annex 4: Outturns (backtesting) approach 64 Annex 5: Cross-sectional (distribution analysis) approach 65 Annex 6: Additional charts on RW and risk parameter deviations 67
3 List of figures Figure 1: Overview of the number of institutions and the use of regulatory approaches, by portfolio, for calculating own funds requirements as of 31 December Figure 2: HDP exposure compared with total IRB exposure, by bank...18 Figure 3: Portfolio composition of the HDPs...19 Figure 4: Credit risk composition (% of total EAD) and RWA for non-defaulted exposures, by portfolio (residential mortgage, SME retail, SME corporate and corporate-other portfolios)...19 Figure 5: EAD distribution of non-defaulted exposures, for residential mortgage, SME retail and SME corporate portfolios, for IRB approaches, by bank...20 Figure 6: RWA distribution of non-defaulted exposures, for residential mortgage, SME retail, SME corporate and corporate-other portfolios, for IRB approaches, by bank...20 Figure 7: RW variability, by status (defaulted exposures and non-defaulted exposures)...21 Figure 8: RW variability, by status (defaulted exposures and non-defaulted exposures), by portfolio (residential mortgage, SME retail, SME corporate and corporate-other portfolios)...22 Figure 9: RW variability, by portfolio (residential mortgage, SME retail, SME corporate and corporate-other portfolios)...22 Figure 10: Breakdown of the sample according to main characteristics...24 Figure 11: Summary of the number of banks reporting clusters with values of zero for specific clusters...25 Figure 12: GC and RW, for defaulted and non-defaulted exposures, per bank...25 Figure 13: Decomposition of the GC standard deviation index...26 Figure 14: Distributions of EAD, for defaulted exposures, by portfolio (residential mortgage, SME retail, SME corporate and corporate-other portfolios) and by bank...26 Figure 15: Contribution from defaulted exposures to GC variability, by bank...27 Figure 16: Outturns (backtesting) descriptives, per IRB portfolio...28 Figure 17: RW deviations (%) from the RW benchmark, for the SME retail portfolio, for nondefaulted exposures, for the AIRB regulatory approach, by bank... Figure 18: RW range, for the SME retail portfolio, for non-defaulted exposures, for the AIRB approach, by EU country of the bank... Figure 19: PDs (%) and the EU PD benchmark, for the SME retail portfolio, for non-defaulted exposures, for the AIRB approach, by bank...30 Figure 20: PD range, for the SME retail portfolio, for non-defaulted exposures, for the AIRB approach, by EU country of the bank...30 Figure 21: Comparison of the PD and the default rate (latest year and past 5 years), for the SME retail portfolio, for non-defaulted exposures, for the AIRB approach, by EU country of the bank...31 Figure 22: LGD (%) and the EU LGD benchmark, for the SME retail portfolio, for non-defaulted exposures, for the AIRB regulatory approach, by bank...32 Figure 23: LGD range, for the SME retail portfolio, for non-defaulted exposures, for the AIRB approach, by EU country of the bank...32 Figure 24: Comparison of the LGD and the loss rate (latest year and past 5 years), for the SME retail portfolio, for non-defaulted exposures, for the AIRB approach, by EU country of the bank...33 Figure 25: RWs (%) and the EU RW benchmarks, for the SME corporate portfolio, for IRB nondefaulted exposures, by bank
4 Figure 26: PDs (%) and the EU PD benchmark, for the SME corporate portfolio, for nondefaulted exposures, by regulatory approach (FIRB or AIRB), by bank...35 Figure 27: Comparison of the PD and the default rate (past 5 years), for the SME corporate portfolio, for IRB (FIRB and AIRB) non-defaulted exposures, by EU country of the bank...35 Figure 28: LGDs (%) and the EU LGD benchmark, for the SME corporate portfolio, for nondefaulted exposures, by regulatory approach (FIRB and AIRB), by bank...36 Figure : LGD range, for the SME corporate portfolio, for IRB (FIRB and AIRB) non-defaulted exposures, by EU country of the bank...37 Figure 30: RWs (%) and the EU RW benchmarks, for the corporate-other portfolio, for IRB non-defaulted exposures, by bank...38 Figure 31: PDs (%) and the EU PD benchmarks, for the corporate-other portfolio, for nondefaulted exposures, by regulatory approach (FIRB and AIRB), by bank...38 Figure 32: PD range, for the corporate-other portfolio, for IRB (FIRB and AIRB) non-defaulted exposures, by EU country of the bank...39 Figure 33: Comparison of the PD and the default rate (latest year), for the corporate-other portfolio, for IRB (FIRB and AIRB) non-defaulted exposures, by EU country of the bank...40 Figure 34: LGDs (%) and the EU LGD benchmarks, for the corporate-other portfolio, for nondefaulted exposures, by regulatory approach (FIRB and AIRB), by bank...41 Figure 35: LGD range, for the corporate-other portfolio, for IRB (FIRB and AIRB) nondefaulted exposures, by EU country of the bank...41 Figure 36: CCFs (%) and the EU CCF benchmark, for the corporate-other portfolio, for nondefaulted exposures, by regulatory approach (FIRB and AIRB), by bank...42 Figure 37: RW deviations (%) from the RW benchmark, for residential mortgages, for IRB nondefaulted exposures, by bank...43 Figure 38: RW range, for residential mortgages, for IRB non-defaulted exposures, by EU country of the bank...43 Figure 39: PDs (%) and the EU PD benchmark, for residential mortgages, for non-defaulted exposures, by regulatory approach (FIRB and AIRB), by bank...44 Figure 40: PD range, for residential mortgages, for IRB non-defaulted exposures, by EU country of the bank...44 Figure 41: Comparison of the PD and the default rate (latest year and past 5 years), for residential mortgages, for IRB non-defaulted exposures, by EU country of the bank...45 Figure 42: LGDs (%) and the EU LGD benchmark, for residential mortgages, for non-defaulted exposures, for the AIRB approach, by bank...46 Figure 43: LGD range, for residential mortgages, for IRB non-defaulted exposures, by EU country of the bank...46 Figure 44: Comparison of the LGD and the loss rate (latest year and past 5 years), for residential mortgages, for IRB non-defaulted exposures, by EU country of the bank...47 Figure 45: Impact on the CET1 ratio using both the RWA* and the RWA**, on the total level, for all portfolios, for defaulted and non-defaulted exposures, by bank...50 Figure 46: Impact on the CET1 ratio using both the RWA* and the RWA** for defaulted and non-defaulted exposures, by portfolio...50 Figure 47: Level of priority for the assessments...51 Figure 48: Number of responses in CAs own overall assessments of the level of own funds requirements, taking into account benchmark deviations, per portfolio, per type of answer...52 Figure 49: Number of responses to the question Have the banks internal validations identified possible underestimations of the internal models that are not justified?, per portfolio, per type of answer
5 Figure 50: Number of responses to the question Have the CA monitoring activities (ongoing or on-site) of the internal models identified the possible underestimations that are not justified?, per portfolio, per type of answer...53 Figure 51: RW range, for the SME corporate portfolio, for IRB (FIRB and AIRB) non-defaulted exposures, by EU country of the bank...67 Figure 52: PD range, for the SME corporate portfolio, for IRB (FIRB and AIRB) non-defaulted exposures, by EU country of the bank...67 Figure 53: Comparison of the LGD and the loss rate (latest year and past 5 years), for the SME corporate portfolio, for IRB (FIRB and AIRB) non-defaulted exposures, by EU country of the bank...68 Figure 54: RW range, for the corporate-other portfolio, for IRB (FIRB and AIRB) non-defaulted exposures, by EU country of the bank
6 Abbreviations AIRB CA CCF advanced internal ratings-based competent authority credit conversion factor CET1 Common Equity Tier 1 COREP CRD CRM CRR EAD EBA EL ELBE FIRB GC HDP IRB ITS LDP LGD LTV PD RTS RW RWA SA SMEs UL Common Reporting Capital Requirements Directive credit risk mitigation Capital Requirements Regulation exposure at default European Banking Authority expected losses expected loss best estimate foundation internal ratings-based global charge high default portfolio internal ratings-based implementing technical standards low default portfolio loss given default loan to value probability of default regulatory technical standards risk weight risk-weighted asset Standardised Approach small and medium-sized enterprises unexpected losses 6
7 1. Executive summary This report presents the results of the supervisory benchmarking exercise for residential mortgage, SME retail, SME corporate and corporate-other portfolios (collectively referred to as high default portfolios ). The analysis is based on data reported at the highest level of consolidation, ensuring that the same data is used only once in the calculation of the benchmarks. The reference date for the data of this report is 31 December 2015, and 114 institutions participated in this exercise across 17 EU countries (covering, for the first time, the entire population of banks authorised to use credit risk internal models for calculating own funds requirements), a significant increase in the number of banks 1 in comparison with the number in previous EBA reports. The aim of this study is to not only assess the overall level of variability in RWAs, but also examine and highlight the different drivers of the dispersion observed. Additional qualitative information on specific aspects was collected through interviews with a sample of 10 banks, allowing a better understanding of the approaches used by banks to calculate RWs and allowing key factors that can explain the observed differences. In this report, two main indicators are employed: the average RW, or RWA density, and the average GC. 2 To quantify the variability, the standard deviation of the indicators observed at bank level is computed. Complementary metrics of the variability employed in this study are the interquartile range and the maximum versus minimum distance. Two main approaches were developed to explain the drivers of RW variability, complemented by a more in-depth cross-sectional benchmarking exercise, a top-down approach and an outturns (backtesting) approach. Given the limitations and assumptions of the different approaches, their findings should be considered concurrently. In addition, some data quality issues, which are identified throughout the report, suggest that the results of the analysis should be interpreted with caution. Main findings from the top-down approach Beginning by considering the concept of GC variability, based on the standard deviation across banks, the EBA took a top-down approach to quantifying the proportion of this variability that can be explained, by controlling for some key drivers (default status, country of the counterparty and portfolio-mix, i.e. the proportions of different portfolios). The results of this exercise are broadly in line with those of previous exercises on HDPs. Overall, the GC increased if compared with previous exercises to, on average, 75% (67% in the 2013 HDP report, which involved a smaller sample of larger banks). The GC variability 3 is also greater 1 The previous reports on HDPs were published by the EBA in December 2013 and June In December 2013, 43 banks in 14 EU countries participated in the exercise, as in previous exercises, on a voluntary basis. 2 GC, for IRB exposures, is computed as (12.5 * EL + RWA) / EAD. 3 The GC provides the information for both EL and UL for IRB exposures. 7
8 than in previous exercises, ranging from 8% to 3% (14% to 174% in the 2013 HDP report). The RW average per institution varies from 7% to 1%, with a simple average of 33%. The percentage of GC variability that can be explained by the drivers of heterogeneity and that is possible to control for with the available data is 82%, slightly higher than that in the 2013 HDP report (78%). A key finding is that a large part of the observed GC variability can be explained by only a few factors, namely the proportion of defaulted exposures, the proportion of non-eu exposures and the portfolio-mix. This confirms previous findings that RWA variability can be explained, to a large extent, by looking at some measurable features of banks portfolios. However, in case banks have a value of zero for a specific cluster, this analysis assumes that those banks have the median of the GC for the bucket, and this may underestimate the possible variability. The remaining 18% of GC variability can be attributed to other reasons: first, the underlying credit risk (i.e. the risk profile in one portfolio) of each bank. Other possible reasons are the modelling assumptions and practices used by banks and supervisory practices. Main findings from the cross-sectional approach The cross-sectional (distribution analysis) approach was used to take an in-depth look at risk parameters and portfolios. For EU non-defaulted exposures, the RW interquartile ranges 4 show significant variability per portfolio, in particular for the two asset classes SME corporate and corporate-other. The country of the counterparty is an important driver of RW variability. Exposures located in EU countries that have experienced stressed macro-economic conditions tend to have higher average RWs. For different asset classes, the interquartile ranges broken down by country of the bank are in line with the EU benchmarking figures; however, they are higher in some EU countries. In general, the comparison between regulatory approaches (i.e. the FIRB and AIRB approaches) does not show significant differences for RWs. However, for risk parameters, there are differences between the FIRB and AIRB approaches (i.e. LGDs under the AIRB approach seem, in general, to be lower than under the FIRB approach, whereas the PDs for the FIRB approach are smaller than for the AIRB approach). Given the lower LGDs and CCFs for banks under the AIRB approach, possible compensations based on the estimation of PDs may be a reason for lower PDs under the FIRB approach. Main findings from the outturn ( backtesting ) approach The outturn ( backtesting ) approach compares observed values with estimated values for the individual banks. This approach shows that the estimated values for PDs and LGDs are, in general, higher than the observed default rates and loss rates, which suggests that banks are, on average, conservative. 5 However, some banks present observed values (latest year and the average of the past 5 years) of defaults and losses above the estimated values of PDs and LGDs and these banks need to be more closely analysed. The analysis confirms that the country of the reporting bank and of the counterparties is an important driver of RW variability and this may be due not only to the underlying risk but also to bank and supervisory practices. When interpreting the findings, it is 4 The difference between the 25th and 75th quantiles, i.e. the range in which ordered values will cover 25% to 75% of all cases. 5 It is not a real backtesting approach, as there is a mismatch between the reference dates for observed and estimated values, as well as a weighting issue (exposure versus case weighted). 8
9 important to understand the limitations of this approach, which are described in this report. Therefore, the outcome from this exercise should be used in conjunction with supervisor knowledge and bank- or country-specific circumstances. CAs assessments based on supervisory benchmarks CAs provided individual assessments on the quality of the benchmarked models for each bank. For the majority of the banks, the RW deviations from the EU benchmarks were deemed by the CAs to be justified and not significant. In the remaining cases, the assessment shows that residential mortgages are deemed to be one of the most important portfolios to monitor because of their importance for banks and their potential impact on RWAs. CAs also consider that both corporate-other and residential mortgage portfolios present the highest numbers of possible underestimations when using benchmarking values, for which there are no immediate justifications, and comprehensive analyses are necessary with possible supervisory actions. The report also highlights that banks internal validations had not identified most of the potential underestimations. 6 By contrast, most CAs noted that possible underestimations were identified in advance, in particular for both corporate-other and SME corporate portfolios, and that supervisory actions were being taken to address such issues. Possible impact on the CET1 ratio based on observed defaults instead of PD estimates The study concludes with an estimation of the possible impacts in terms of the CET1 ratio. 7 This analysis shows that, if the RWAs were replaced by higher RWAs driven by both PDs and observed default rates, rather than estimated PDs alone, the average CET1 ratio would decrease only slightly, by 17 bps. This impact should be interpreted with caution because of both the data quality issues and the fact that the higher RWAs were not designed to estimate possible impacts. 8 In addition, the additional possible impact of using the observed loss rates (instead of original LGDs) is not considered. The impact determined in this exercise does not suggest the existence of a shortfall of this particular magnitude. 6 As part of the ongoing validations and audits of internal models. 7 For this impact analysis, only potential negative variations (i.e. the reduction of the CET1 ratio) are considered; therefore, possible positive variations and the consequent compensation effects are not included. 8 The alternative higher RWAs are not designed as a measure of conservatism and the data quality issues identified on the templates submitted by participating institutions (see annex for more details) are connected in part to the use of new definitions introduced by the ITS and the parameters calculated by institutions for the purpose of the exercise only. 9
10 2. Introduction and legal background As part of the EBA s programme that investigates RWA variability across banks and the drivers of differences between banks, this report presents the results of the 2016 supervisory benchmarking exercise of internal approaches for calculating own funds requirements for HDPs. 9 The reference date for the data is 31 December Previous reports on the same topic (HDPs) were published by the EBA in December and June 2014, 11 and similar studies, although focused on LDPs, were published in February 2013, August 2013 and July The EBA s focus, in accordance with Article 78 of the CRD, 13 is twofold: (i) the calculation and delivery of benchmarks to support the work of the CAs related to the regular assessment of internal approaches applied by the institutions for calculating own funds requirements and (ii) the identification of situations with significant RWA variability for the same type of exposure and potential significant underestimations of capital requirements. This information serves as a useful input for CAs assessments and possible supervisory actions. The data collection is based on technical standards specifically designed for annual supervisory benchmarking exercises and covers different breakdowns of portfolios by, for instance, country, type of collateral, LTV ratio or sector to help understanding the impact of these factors on the different key risk drivers, such as PD, LGD, CCF and RW estimates. In addition, some qualitative information and more in-depth information on specific aspects such as banks modelling methodologies, data sources, lengths of time series, definitions of risk parameters, and number and scope of internal models have been collected through interviews with a sample of 10 banks in the exercise. In accordance with Article 78 of the CRD, CAs need to, at least annually, make an assessment of the quality of the institutions internal approaches. Each CA shared the outcome of its assessment with the EBA and the other relevant CAs (home and host CAs). The regular supervisory benchmarks on internal approaches developed by the EBA and shared with the CAs are considered a useful monitoring supervisory tool to support the CAs assessments of internal models. The exercise applies, for the first time, the new framework designed by the EBA via the ITS and RTS published in March HDPs include residential mortgage, SME retail, SME corporate and corporate-other portfolios. 10 EBA report Third interim report on the consistency of risk-weighted assets: SME and residential mortgages EBA report Fourth report on the consistency of risk-weighted assets: Residential mortgages drill-down analysis Review on the consistency of Risk Weighted Assets Capital Requirements Directive > TITLE VII > CHAPTER 2 > Section II > Sub - Section 2 > Article
11 From 2018 onwards, these studies will form part of yearly supervisory benchmarking exercises and requirements for institutions, CAs and the EBA concerning setting up a regular benchmarking process to assess the internal models used to compute own funds requirements (with the exception of operational risk). Technical standards produced by the EBA establish requirements for the CAs assessments of institutions internal approaches used for the calculation of own funds requirements. They also establish standards for the submission of relevant information by institutions and the procedures for sharing CAs assessments among CAs and the EBA. The main objective of this report is to provide an update on the monitoring of RWA variability in order to understand drivers of such variability and to define possible measures for addressing them. The EBA provides feedback to participating institutions on benchmark parameters in order to complement the information available to institutions for monitoring of their internal models. The EBA considers that feedback on benchmark parameters provides positive incentives for institutions to continuously improve the data quality of their regular data submissions in future supervisory benchmarking exercises. The report is organised as follows: Chapters 3 and 4 introduce the details regarding the dataset, assessment methodology, portfolio composition and characteristics of participating institutions; Chapter 5 provides a top-down analysis of the current RW variability and shows that a significant part of this variability can be explained, with the main drivers for such variability presented; Chapter 6 provides an analysis of IRB parameters using benchmark parameters and outturns (backtesting), with some additional details given regarding RW variability; Chapter 7 presents an impact analysis using the CET1 ratio, taking into account some assumptions; Chapter 8 summarises the CAs assessments based on the benchmarks; and Chapter 9 gives conclusions and discusses future work. 11
12 3. Dataset and assessment methodology Altogether, 114 institutions 14 from 17 EU countries participated in this study and submitted data as of 31 December For this report, the analysis is based on data reported at the highest level of consolidation only. 15 The data allowed two types of analyses to be performed: a top-down analysis of institutions actual portfolios and an analysis of IRB parameters based on different techniques, namely a cross-sectional (distribution analysis) approach and an outturn (backtesting analysis) approach. After some data cleansing, the number of institutions was reduced to Data The HDP-specific data used for top-down analysis provides information on each institution s actual exposure values and IRB parameters, broken down by their default status, by whether they are in EU or non-eu countries, by portfolio and by each EU country. In contrast to previous HDP reports, no information on exposures rated under the SA (either on a roll-out plan or under the permanent partial use allowance) and no information on portfolios other than the HDPs was collected. The report relies on data collected according to the ITS on supervisory benchmarking, 17 complemented by COREP 18 data when necessary. The reference date is 31 December In general, the HDPs have been defined as all of the remaining portfolios not considered as LDPs (governments, financial institutions and large corporate portfolios). Further breakdowns in the categories (e.g. SME retail) follow the regulatory definitions. For the 2016 HDP exercise, the data included residential mortgage, SME retail, SME corporate, and corporate-other portfolios (not including the remaining HDPs, for instance credit card portfolios or consumer credits). In addition, the number of institutions is not stable across portfolios and sub-portfolios; consequently, institutions that did not report exposures for certain portfolios (e.g. some 14 EBA list of institutions (published). See Annex 1 for details. 15 Banks also reported at a solo level basis. This data at a solo level basis is used by several CAs to produce additional analysis at the country level. The use of only consolidated level data ensures that the same data is used only once in the calculation of the benchmarks. 16 See Annex 3 for details. 17 Annex I of the ITS provides the definitions of the supervisory benchmarking portfolios that are required for the 2016 exercise. Annex III of the ITS provides the instructions and details on exposures, that is, the data collected. Both ITS annexes have the same name (i.e. template code) for the definitions and details on exposures, i.e. Template C In addition, Annex III also provides further details of internal models and the mapping of internal models (Templates and 105.2, respectively; see annexes) to portfolios (Annexes II and IV of the ITS, Template 103). 18 Common supervisory reporting requirements are specified by the EBA via the ITS, which was adopted by the EU Commission as Regulation 680/
13 institutions do not have certain types of exposures in their portfolio-mix) were excluded from the analyses. Data quality The data collection for this exercise was based on a larger sample than in previous exercises and on new technical standards and definitions, so there are data quality constraints and the findings should be interpreted with caution. The way in which different banks interpreted some of the data fields (e.g. loss rate) was noted during the interviews with banks, as this may also have an impact on data quality. While not strictly data errors, different interpretations would potentially explain some outlier values. Regarding the possible impact on CET1, the findings may require some data quality improvements. Use of the benchmarking exercise During the exercise, the EBA computed benchmarks on risk parameters and portfolios and provided detailed feedback and institution-specific reports to the CAs. The benchmarking exercise allowed CAs to assess the outcomes of institutions internal models compared with a wider scope of institutions. Using additional bank- and model-specific information from regular ongoing supervisory functions and previous CAs assessments of internal models also helped to identify potential non-risk-based variability across participating institutions. CAs are requested to share the evidence they have gathered among colleges of supervisors, as appropriate, and to take appropriate corrective actions to overcome drawbacks when deemed necessary. CAs assessments of individual institutions in their jurisdictions were shared with the EBA and key findings of these assessments were used to support some findings from specific analyses throughout the report. A summary of the findings from CAs assessments is presented in Chapter 8. Moreover, interviews were carried out with a sub-sample of 10 participating banks to gather qualitative information. The selection of participating banks for the interviews was based on the computed benchmarks on risk parameters and portfolios, with a special focus on conspicuous results. The aim of those interviews was to better understand the approaches used by individual institutions to calculate own funds requirements and to identify key factors and drivers that can explain observed differences. Assessment methodology The report starts with a top-down approach similar to that used and discussed in previous EBA supervisory benchmarking reports. This methodology tries to disentangle the impact of some key determinants of the GC 19 on variability. In contrast to previous reports and due to different bases 19 GC, for IRB exposures, is computed as (12.5 * EL + RWA) / EAD. 13
14 for data collection, it was not possible to determine the proportion of partial use of the SA 20 (permanent and roll-out) and the difference in the GC for exposures under the SA in the current study. Hence, direct comparisons with previous reports may not always be possible. For risk parameters such as PDs and LGDs, the results of the exercise are based on the parameters used for the calculation of the banks own funds requirements, i.e. the comparison of institutions does not take into account whether or not supervisory corrective actions aimed at increasing RWs to correct any model deficiencies (e.g. add-ons) were imposed by some CAs on institutions models. The top-down analysis is followed by: i) The cross-sectional approach a distribution analysis which covers partly Article 3(2a) and (2b) and Article 9 of the RTS. The distribution analysis allows the institutions estimates to be examined. Moreover, it identifies extreme values and values below the first quartile or above the third quartile for important parameters of the sample. ii) The outturns approach a comparison using the (backtesting) outturns approach (i.e. a comparison of observed values with estimated values for important parameters). The cross-sectional approach has advantages and shortcomings and its results should be taken in conjunction with the findings of the other approaches. The main advantage is that it allows outliers to be easily identified, after controlling for some portfolio characteristics. In addition, this type of analysis can be performed at different levels of aggregation and for different risk parameters. For instance, the comparison between regulatory approaches (e.g. FIRB and AIRB) at the EU level or at EU-country level for a particular portfolio (e.g. SME retail for non-defaulted exposures, in the construction sector) may allow possible drivers to be highlighted if there are significant differences between the approaches. On the other hand, and in contrast to the exercise for LDPs, for HDPs it is not possible to compare the same counterparties across institutions, but it is only possible to control for some of the key features of exposures. At the same time, retail exposures are more country driven, so the comparisons across countries are more difficult to develop. The distribution analysis at the cluster level allows a set of counterparties that are as similar as possible, but not counterparties and exposures that are exactly the same, to be compared (as in the case of the use of real and hypothetical portfolios). This is an important limitation and the reason why the outturn (backtesting) approach is a good and valuable process for comparison among banks, despite this approach also having some shortcomings. In addition, being in the first quartile for the different parameters may simply be a reflection of the level of risk. 20 Difference in the proportion of exposure classes treated under the SA and the IRB approach. 14
15 Moreover, regulatory floors need to be taken into account (e.g. from Article 164(4) of the CRR: LGD floors for residential property are 10% and LGD floors for commercial property are 15%) and possible differences per jurisdiction (national discretions from Article 164(5): CAs may increase the regulatory floors). The outturns approach allows observed and estimated values to be compared and provides information about banks realised credit performance history (default rates, loss rates and actual defaulted exposures, as well as averages of the past 5 years for default and loss rates) and the corresponding IRB parameters (PD, LGD and RWA), as well as PD backtesting results (RWA* and RWA**). 21 These comparisons allow an analysis to be conducted on possible misalignments between IRB estimated and observed parameters for the same bank. The misalignment between estimates and observed parameters could suggest that differences in RWAs across banks might be driven by differences in estimation practices (e.g. different levels of conservatism, adjustments to reflect long-run averages, different lengths of time series of the data available and included in the calibration of the cycle, assumptions underlying recovery estimates, etc.) and not only by differences in portfolio risk. Using the information provided by banks according to the ITS, 22 it is possible to compare, for the same bank and across banks, the estimated parameters with the observed parameters, namely the following indicators: - estimated parameters (IRB parameters): PD, LGD and RWA; - observed parameters: the default rate of the latest year, the default rate (average) of the past 5 years, the loss rate of the latest year and the loss rate of the past 5 years; and - backtesting results: RWA* and RWA**. The main indicator is the ratio between the observed value and the estimated value for comparable parameters. A result above 1 indicates a bank with an observed value higher than the bank s estimate for the same (comparable) parameter. This ratio is calculated at the portfolio level 23 per bank. Backtesting at the bank level is already informative for supervisors, but additional information can be derived from the comparison of results across banks (e.g. looking at key descriptive statistics). Observed estimated value ratios can thus be compared for the same portfolio per country of the bank (see Annex 4 for details). 21 The risk-weighted exposure amounts, after applying the SME supporting factor, that would result from the application of PD* (derived from the case-weighted default rate of the latest year for the rating grade) and PD** (derived from the case-weighted default rate of the past 5 years for the rating grade and the PD) instead of the original PD on the rating grade level shall be reported. See Commission Implementing Regulation (EU) 2016/2070, OJ L 328, (Annex IV, Part II: Template Related Instructions, C 103 Details on exposures in High Default Portfolio (Column 230 and 240)) for details. 22 Annex IV, Template C , of the ITS. 23 Using portfolio ID (Annex I, Template C , of the ITS). 15
16 The computed ratios between comparable observed values and the estimated values are the following: Outturn approach Default rate (latest year) ( ) / PD Default rate (past 5 years) / PD ( ) Loss rate (latest year) ( ) / LGD Loss rate (past 5 ( ) RWA* / RWA ( ) RWA** / RWA years) / LGD 190/060 ( ) 200/060 ( ) 210/130 ( ) 220/130 ( ) 230/170 ( ) 240/170 ( ) ( ) The persistence of banks as outliers for both periods, i.e. 1-year rate and the average of 5 years, and across comparable parameters can be examined by the CAs. PD estimates are required by Article 180 of the CRR to be representative of the long term. As such, a direct comparison between PD estimates and the default rates observed in the past 5 years to identify a potential underestimation needs to take that into consideration (i.e. the past 5 years might not be representative of the long term). In addition, the LGD estimates should be appropriate for downturn conditions and include considerations of collection-related costs, appropriate discounting, etc. As a result, a direct comparison between LGD estimates and recent loss rates to identify potential risk underestimation should also take such differences into account. In addition, the observed parameters reported by banks are also influenced by the country characteristics. In particular, for retail exposures, given the domestic focus of most participating banks, the counterparties creditworthiness is influenced by several country-specific factors, such as the macro-economic cycle, accounting framework and judicial system. Jurisdictions under a downturn macro-economic cycle tend to show a growth in observed default rates and loss rates, and the comparison with risk parameters will reflect the credit quality deterioration. Furthermore, the realised losses on defaulted exposures are influenced by the wide variation in loss recognition practices across jurisdictions, which influence the timing and the amounts of recorded losses, as well as by the limitations in the data used for estimations (i.e. limited to provisions raised and write-offs in the year of the default event). Therefore, the breakdown by jurisdiction (country of counterparty) is useful to control for such aspects. Moreover, the data allowed only the comparison of PDs at the reference date (31 December 2015) with the default rate observed during 2015 (and also an average of the past 5 years), whereas it would be best to compare this default rate with the PD at the beginning of the observation period (31 December 2014). The use of the EAD-weighting of loss and default rates in the backtesting is another issue, as the EAD weights are often not relevant for the calibration of models in banks. Further issues include the different time periods for capturing observed and realised values and the complexity of the model landscape in large banks. 16
17 4. Portfolio composition and representativeness In this chapter, the characteristics of the samples and the participating institutions are described, presenting the level of representativeness for possible extrapolations, the type of regulatory approaches used by participating banks and the portfolio composition. The 2016 supervisory benchmarking exercise includes, for the first time, all banks that use internal approaches for calculating own funds requirements for HDPs. This significantly increases the representativeness of the exercise. The information in this chapter should be interpreted in conjunction with the remaining chapters, as portfolio composition and other characteristics might help to explain RW variability. Use of regulatory approaches Institutions participated in the 2016 HDP supervisory benchmarking exercise if they used the IRB approach for at least one of the HDPs, or sub-portfolios, for calculating own funds requirements as of 31 December Few institutions use different approaches (i.e. a mixed approach) within a given type of portfolio, for instance in the case of consolidation of entities and portfolios from different countries (in the interviews with banks, it was also possible to discuss the situation in which some jurisdictions allow the use of FIRB and AIRB approaches in one asset class based on banks internal definition of sub-portfolios). For HDPs, most of the institutions reported the use of the AIRB approach. Figure 1: Overview of the number of institutions and the use of regulatory approaches, by portfolio, for calculating own funds requirements as of 31 December Portfolios AIRB FIRB Total Residential Mortgage SME Retail SME Corporate Corporate-Other The proportion of institutions using the AIRB approach for HDPs is almost identical to that in previous HDP reports. Regarding the use of the SA, detailed information was not requested via 24 Commission Implementing Regulation (EU) 2016/2070, OJ L 328, (Annex IV, Part II: Template Related Instructions, C 103 Details on exposures in High Default Portfolio): the regulatory approach used for calculating own funds requirements shall be reported under the FIRB approach only if exposures under this approach represent 50% or more of the IRB exposures to the counterparty. For residential mortgages, one bank applied the FIRB approach for corporate exposures, and part of the retail exposure secured by real estate was reported as the FIRB approach, because the exposures were actually assigned to a corporate customer due to a pooling approach. However, for calculation of own funds requirements, the exposures are correctly included in the AIRB portfolio in Figure 1. For SME retail, one bank incorrectly reported as being under the FIRB approach; however, for the overview of the number of banks, it is correctly considered as under the AIRB approach. 17

18 HDP data collections, and COREP figures were not available at the EBA for all participating institutions. Portfolio composition and representativeness The relative EAD-weighted proportions of the different portfolio types for the banks in the sample, comparing data submitted for the HDP exercise with COREP data 25 as of 31 December 2015, provides information on the portfolio composition by bank. 26 Figure 2: HDP exposure compared with total IRB exposure, by bank 27 At bank level, there are significant differences in the use of internal approaches and the portfolio composition among the participating institutions. In terms of EAD, the proportion of the overall IRB HDP compared with institutions total IRB credit risk portfolio differs considerably between institutions (from less than 1% to 100%). The use of internal models for both HDPs and LDPs is significant, with very few participating institutions using internal approaches only for HDPs. For almost 50% of the participating institutions in the exercise, the HDPs represent only 50% of the total EAD under the IRB approach of those participating institutions. For more than 20 participating institutions, the HDPs represent less than 40% of the total EAD under the IRB approach. This highlights the scope of this exercise and the importance of LDPs and other HDPs not covered (e.g. credit card portfolios) in terms of total EADs under internal approaches and when drawing conclusions about the internal models in general. For the banks in the sample, residential mortgage represents 62% of the HDP EAD, SME retail represents 9%, SME corporate represents 14% and corporate-other represents 15%. The findings of this report are valid for HDPs only and cannot be generalised to other portfolios. 25 Total EAD under the IRB approach in COREP = total EAD for HDPs and LDPs. 26 Institutions that did not provide COREP data or institutions that did not pass quality checks were excluded from the comparisons with COREP. Exposures not submitted for this HDP exercise include large corporate portfolios, institutions, sovereigns and retail exposures, such as credit card exposures. 27 EAD (of HDPs Def and Ndef under the IRB approach) for exposure class (residential mortgages, SME retail, SME corporate and corporate-other) and total IRB portfolio by COREP C 08.1a.001 and C 08.1a.002 for the December 2015 data. Participating banks that did not submit Template C 08.1a.001 and/or Template C 08.1a.002 or that submitted an EAD greater than the one in those templates were excluded from this figure and the EU portion. 18


19 In contrast to the above, interpreting the RWA figures for defaulted exposures from a combination of approaches is inherently different and should be taken into account. For defaulted exposures under the AIRB approach, the RWs can be significantly different from zero, and are not directly comparable to defaulted exposures under the FIRB approach. 28 Figure 3: Portfolio composition of the HDPs The analysis of non-defaulted exposures shows, as expected, that the RWAs from the four types of HDPs are not directly proportional to the EAD. Residential mortgage represents 62% of the total EAD but only 34% of the total RWA. On the other hand, both SME corporate and SME retail portfolios show a higher proportion of RWA in comparison with the EAD (e.g. SME corporate represents 14% of the total EAD and 26% of the total RWA). This reflects the importance of the portfolio-mix as a driver for RW levels and possible RW variability. Figure 4: Credit risk composition (% of total EAD) and RWA for non-defaulted exposures, by portfolio (residential mortgage, SME retail, SME corporate and corporate-other portfolios) The EAD distribution across the four HDPs shows that some institutions are exposed to only one portfolio, namely residential mortgage (12 institutions) or corporate-other (eight institutions). 28 AIRB {RW = max [0; 12.5 * (LGD ELBE)]} and FIRB (RW = 0). 19
 of participating institutions report a HDP mix of three or four main HDPs.")

20 Other institutions show only two types of portfolios, i.e. corporate-other and SME corporate (nine institutions) or residential mortgage and SME retail (three institutions). The remaining (namely the majority) of participating institutions report a HDP mix of three or four main HDPs. These differences reflect the importance of the portfolio-mix as a driver of RW variability. Figure 5: EAD distribution of non-defaulted exposures, for residential mortgage, SME retail and SME corporate portfolios, for IRB approaches, by bank Figure 6: RWA distribution of non-defaulted exposures, for residential mortgage, SME retail, SME corporate and corporate-other portfolios, for IRB approaches, by bank 20
21 5. Top-down approach This chapter aims to determine and analyse the main drivers behind RW variability across the participating institutions. In the top-down approach, two indicators are used to summarise the results of the variability: the GC, taking into account both EL and UL, and the RW (for the UL). Risk weights The average RW per institution varies from 7% to 1%, with a simple average RW of 33% (and a weighted average of 25%) across the sample. This compares to a simple average of 35% reported in the 2013 HDP report. The RW variability is much higher for defaulted exposures (the difference between the 5th and 95th percentiles above 200%) than for non-defaulted exposures (lower than 90%). The regulatory approach may explain, in part, this higher degree of variation given that, for the FIRB approach, the RWs for defaulted exposures are 0%; however, the RW variability is also higher for defaulted exposures than for non-defaulted exposures for the AIRB approach. Figure 7: RW variability, by status (defaulted exposures and non-defaulted exposures) 30 The various asset classes also show significant differences in RW variability. Considering both defaulted and non-defaulted exposures, the quantile differences between the 5th and 95th percentiles for the RWs is higher for both corporate-other and SME corporate portfolios than the other portfolios. The same applies if only non-defaulted exposures per type of portfolio are considered. For defaulted exposures per type of portfolio, the analysis shows higher variability for both residential mortgage and SME retail portfolios than the other portfolios. GC, for IRB exposures, is computed as (12.5 * EL + RWA) / EAD. 30 RW dispersion (Delta P95 P05) on all versus defaulted and non-defaulted all. 21


22 Figure 8: RW variability, by status (defaulted exposures and non-defaulted exposures), by portfolio (residential mortgage, SME retail, SME corporate and corporate-other portfolios) The type of collateral per portfolio, for non-defaulted exposures, for both SME corporate and corporate-other portfolios show a higher degree of RW variability for more collateralised portfolios (namely non-real-estate-funded collateral 31 and other eligible collateral real estate, 32 as well as non-real-estate-funded collateral 33 and other eligible 34 ), which can be partly explained by different collateralisation levels. The data should, however, be interpreted with caution, given that there are some data quality constraints and different interpretations were made of the collateral split during the data collection, as highlighted during the interviews with banks. Ultimately, this hampered the ability to draw definite conclusions about the amount of RWA variability explained by this dimension. Figure 9: RW variability, by portfolio (residential mortgage, SME retail, SME corporate and corporate-other portfolios) CORP CORP SMEC SMEC CORP003, corporate-other non-defaulted secured, non-real-estate-funded collateral ; CORP008, corporate-other non-defaulted secured, other eligible collateral: real estate ; CORP009, corporate-other non-defaulted unsecured ; MORT0007, real estate collateral, other funded CRM and/or personal guarantees ; MORT0008, real estate collateral and other unfunded CRM. 22
23 Methodology and assumptions The methodology for presenting the percentage of total GC variability that can be explained once its main drivers are controlled for (for each, some interdependency is possible) is based on the standard deviation (% total GC standard deviation). As a starting point, the total GC for each participating bank is computed as: % total GC bank i = (12.5 * EL bank i + RWA bank i ) / EAD bank i The standard deviation 36 of the total GC is: SSSSSSSSSSSSSSSS dddddddddddddddddd oooo % SSddSSSStt GGGG = % tttttttttt GGGG bbbbbbbb ii % tttttttttt GGGG aaaaaaaaaaaaaa 2 NN Where total GC bank i represents each bank s GC (as a percentage), total GC average is the mean of the GC in the sample and N is the number of participating banks in the sample. The standard deviation of the total GC is then broken down successively to control for the characteristics of the exposures. First, the GC standard deviation is computed for defaulted exposures and non-defaulted exposures separately. In this exercise, and in previous exercises, the RW variability is much higher for defaulted exposures than for non-defaulted exposures, thus justifying the first breakdown. For defaulted exposures, a % GC at the bank level is calculated (% GC i, DEF ). The GC of each bank is then weighted by the proportion of EADs that was reported as defaulted exposures in the sample (6%): % GC bank i, DEF = [(12.5 * EL bank i, DEF + RWA bank i, DEF ) / EAD bank i, DEF ] * % EAD DEF For non-defaulted exposures, a similar calculation at the bank level is carried out: % GC bank i, NONDEF = [(12.5 * EL bank i, NONDEF + RWA bank i, NONDEF ) / EAD bank i, NONDEF ] * % EAD NONDEF A weighted average (but based on the average proportion of EAD DEF and EAD NONDEF for the sample) is then calculated, assuming that the percentage of defaulted and non-defaulted assets is the same across banks and equal to the sample averages: % GC bank i, DEF, NONDEF = % GC bank i, DEF + % GC bank i, NONDEF This allows for effects derived from specific EADs for each bank to be controlled and for parameters of the GC, i.e. EL and RWs, to be focused on. In other words, this approach allows a GC to be computed for each bank, based on its own estimates of the risk parameters, but
, after controlling for defaulted and non-defaulted exposures, is the following: SSSSSSSSSSSSSSSS ddddddddssssddddss oooo % GGGG")
24 assuming that the percentage of defaulted and non-defaulted assets is the same across banks and equal to the sample averages. The new GC standard deviation (% GC standard deviation DEF, NONDEF ), after controlling for defaulted and non-defaulted exposures, is the following: SSSSSSSSSSSSSSSS ddddddddssssddddss oooo % GGGG (DDDDDD, NNNNNNDDDDDD) = % GGGG bbaaaaaa ii,dddddd,nnnnnndddddd % GGGG aaaaaaaaaaaaaa 2 The difference between the standard deviation of the % total GC and the standard deviation of the % GC standard deviation (DEF, NONDEF) gives the impact of the contribution of defaulted and nondefaulted exposures to the total GC variability. As a second step, exposures are further broken down based on the region of the counterparty into two groups: EU countries and non-eu countries. The same methodology is repeated for controlling for additional dimensions seen as drivers of GC variability, namely all portfolios (asset classes) and all countries of the counterparty for EU exposures, as shown in Figure 10. The methodology does not intend to estimate the specific variability for each cluster or dimension at the individual level (e.g. it does not intend to make comparisons at the portfolio level), but instead intends only to provide the general contribution of the main drivers as a whole, i.e. the total GC variability. Figure 10: Breakdown of the sample according to main characteristics NN The total EAD and the number of banks are maintained across the breakdowns (EAD 100% in Figure 10). This allows the same basis of the initial total GC standard deviation to be maintained and then a subsequent and more direct split of such variation in different clusters of each breakdown (e.g. defaulted exposures and non-defaulted exposures, etc.). However, to maintain the same sample of the initial total GC standard deviation in the case of participating banks that have a value of zero for a specific cluster, those banks are assumed to have the median of the GC for the bucket. This assumption may underestimate the possible variability. On the other hand, this assumption is mainly used at lower levels of the breakdown, namely by country of the counterparty (i.e. not all banks, especially smaller ones, have exposures across all EU countries). A summary of the number of banks reporting clusters with values of zero 24
25 for specific clusters (and for the % total EAD for the cluster) is provided. The highest number of missing buckets is found for the lower percentages of EADs (weighted average) and, therefore, this does not significantly influence the main buckets (level 2 non-defaults, level 3 EU nondefaults and level 4 non-defaults for different portfolios). 37 Figure 11: Summary of the number of banks reporting clusters with values of zero for specific clusters %EAD: % of EAD (weighted average) N Bank with missing bucket LEV 2 Default 5.7% 8 Non Default 94.3% 0 LEV 3 Default NEU 0.3% 42 Non in Default NEU 10.3% 34 Default EU 5.4% 8 Non in Default EU 84.0% 3 LEV 4 Default NEU 0.3% 42 Default CORP EU 0.9% Default SMEC EU 2.1% 32 Default SMER EU 1.0% 44 Default MORT EU 1.5% 23 Non in Default NEU 10.3% 34 Non in Default CORP EU 10.0% 21 Non in Default SMEC EU 10.7% Non in Default SMER EU 7.1% 40 Non in Default MORT EU 56.2% 23 Global charge The initial total GC standard deviation is 82%. The difference between the GC standard deviation in this report and that in previous reports can be explained by changes in the type of exposures (e.g. the previous standard deviation included total exposures under the IRB approach and the SA, whereas the current one includes only IRB exposures along with not only residential mortgage, SME retail and SME corporate portfolios but also the corporate-other portfolio), a broader and more diversified sample of participating institutions (for the top-down approach, from 43 institutions across 14 EU jurisdictions, in December 2012, to 99 institutions across 17 EU jurisdictions, in December 2015) and adjustments in the methodology to calculate the changes in the standard deviation index. Figure 12: GC and RW, for defaulted and non-defaulted exposures, per bank 37 Other assumptions were also tested, namely using a GC value of zero instead of the median of the bucket and assuming 50% of the maximum variation (i.e. GC variability for bank i = 50% * (GC average 0) = 50% * GC average). To maintain a stable EAD and the same number of banks for comparison purposes, such banks were not excluded. No significant differences were found in the final figures of the GC standard deviation when using different assumptions for banks with values of zero for a specific cluster. 25


26 To summarise the findings, the GC standard deviation was normalised at 100 to present a deviation index. The same deviation index was used in previous supervisory benchmarking reports. Figure 13: Decomposition of the GC standard deviation index Drivers of differences in GC and RW The result of this report is in line with that of previous reports. A key finding is that 82% of the GC variability across participating institutions portfolios can be explained by only a few factors: the proportion of defaulted assets, the proportion of non-eu exposures and the effect of the portfolio-mix. The decomposition of the GC standard deviation index allows an understanding to be gained of the overall impact of differences in GC, but not the impact of each driver, as the analysis is order dependent. The portfolio-mix is based on the main portfolios of the exercise and, as presented before, the significant differences and variability of RWs among such portfolios (e.g. higher RWs for corporate-other than for residential mortgage portfolios) and the weight for each bank (portfolio-mix) are main drivers for differences in GC. The proportion of defaulted exposures is one of the main drivers of GC and RW variability within each bank s portfolio. The interviews with banks highlighted that the treatment of defaulted assets is heterogeneous among banks. Across all participating institutions, on average, 6% of the total EAD for the HDPs is in default. Within the HDP sample, most defaulted exposures (37% of total defaulted exposures) stem, as expected, from the SME corporate portfolio. Figure 14: Distributions of EAD, for defaulted exposures, by portfolio (residential mortgage, SME retail, SME corporate and corporate-other portfolios) and by bank 26
27 Regarding the SME corporate portfolio, the GC differences among banks are very high, with a wide range in the proportion of defaulted exposures, indicating that there are potential differences in banks macro-economic conditions, as well as in credit policies, risk profiles, investment strategies and workout processes. For the total HDP sample, and for many participating banks, the contribution from defaulted exposures to GC variability is significant and, in several cases, represents a high proportion of the entire bank contribution. Figure 15: Contribution from defaulted exposures to GC variability, by bank The RW variability and the contribution from defaulted exposures is also significant (the minimum being 0% and the maximum being 263.8%) for a RW average of 58.8%. Regarding the proportion of non-defaulted exposures, the differences in GC and RW can be caused by idiosyncratic variations in the level of risk within an exposure class for non-defaulted IRB assets, EU jurisdiction (e.g. legal framework, macro-economic environment, supervisory practices), credit risk mitigation (e.g. dependent on the business and risk strategy of each institution) and IRB risk parameter estimations (i.e. institution practices). The analysis of nondefaulted exposures includes the following: different proportions of the four main portfolios (residential mortgage, SME retail, SME corporate and corporate-other portfolios), differences in the country of the counterparty and differences in the type of exposure (e.g. collateralised and non-collateralised exposures). The remaining GC variability may be due to differences in bank-specific factors, such as IRB parameters (e.g. different risk profiles in the remaining clusters) and risk management practices, among other factors. For HDPs, the differences in bank-specific factors can be better controlled by using the outturn (backtesting) approach, using the distribution analysis only as complementary benchmarks. 27
28 6. Cross-sectional (distribution analysis) and outturns (backtesting) approaches The main focus of this analysis is on EU non-defaulted exposures, with their importance given in terms of EAD and RWA. A distribution analysis was developed by studying the evolution below the first quartile or above the third quartile and identifying outliers for each portfolio. In addition, and more useful for comparison purposes in the context of HDPs, an outturns (backtesting) approach is also used. This chapter gives an overview of and analyses the main HDPs, namely SME retail, SME corporate, corporate-other and residential mortgage portfolios. For country-level analysis, the benchmarks are based on the median 38 at the EU level, whereas the interquartile ranges, as well as the minimums and maximums, are calculated at the country level. A summary of the outturn (backtesting) approach with the main descriptives is also presented. Figure 16: Outturns (backtesting) descriptives, per IRB portfolio Observed/Expected ratios SME Retail SME Corporate Corporate Other Residential mortgage Default rate latest year / PD Q1 = 1st quartile Median Q3 = 3rd quartile Default rate latest 5 years / PD Q1 = 1st quartile Median Q3 = 3rd quartile Loss rate latest year / LGD Q1 = 1st quartile Median Q3 = 3rd quartile Loss rate latest 5 years / LGD Q1 = 1st quartile Median Q3 = 3rd quartile The EU RW benchmark is the median of all single reported portfolios, in the clean dataset, across all countries and banks. 28
29 6.1 SME retail IRB risk weights The interquartile range of the RWs, for the total portfolio, is 16%. The RW deviations (as a percentage) from the EU RW benchmark vary significantly at the bank level, ranging from around 30% to +30%. The negative RW deviations, i.e. RWs lower than the RW benchmark, are observed more frequently and are more significant than the positive deviations, producing an average deviation of 3.2%. Figure 17: RW deviations (%) from the RW benchmark, for the SME retail portfolio, for nondefaulted exposures, for the AIRB regulatory approach, by bank The interquartile range of the RWs is 16% at the EU level. The interquartile range broken down by country of the bank is in line with the EU figures; however, it is higher than 25% in some EU countries. Figure 18: RW range, for the SME retail portfolio, for non-defaulted exposures, for the AIRB approach, by EU country of the bank Very few EU countries reported just one participating institution (i.e. the minimum being equal to the maximum), and these are retained for comparison purposes with the remaining EU countries (although not for analysis of the interquartile ranges within countries).
30 6.1.2 PD and default rate The PD deviations from the EU PD benchmark vary at the bank level, ranging from almost 0% to 28%. A few banks show extreme positive PD deviations, i.e. PDs much higher than the PD benchmark. This could also be due to data quality issues. Figure 19: PDs (%) and the EU PD benchmark, for the SME retail portfolio, for non-defaulted exposures, for the AIRB approach, by bank The low interquartile range of the PDs is also visible at the level of the country of the bank, with most of the participating institutions showing PDs around the EU PD benchmark and without significant differences between and within EU countries. Figure 20: PD range, for the SME retail portfolio, for non-defaulted exposures, for the AIRB approach, by EU country of the bank The outturns (backtesting) approach shows that the majority of the medians of the ratios between the default rate and the PD, for both the latest year and the 5-year average, are below 1. That is, in general, the estimated values (PDs) are higher than the observed values (default rates). However, there are countries in which banks do have a ratio above 1 (i.e. they are potentially underestimating their PD). The results from the benchmarking analysis indicate that the appropriateness 40 of the PD parameter needs to be investigated further by the CA, i.e. to assess if the PDs are consistently below the observed default rates (observed values compared with both 40 It is not a real backtesting approach, as there is a mismatch between the reference dates for the observed and estimated values. 30
31 the 1-year PD and the 5-year average PD) or there are specific justifications, including the impact of severe recessions over recent years. From the interviews with some institutions, it emerged that there might also be different interpretations of the PD and default rate definitions (numberweighted versus exposure-weighted values), something that should be clarified in the future releases of the ITS. It should also be noted that the PDs reported by the institutions and used in the analysis might not necessarily capture the subsequent impact of mitigation actions imposed by the CA to address deficiencies identified in the models in scope. The PD interquartile range of the ratio between the default rate and the PD is higher for the 5- year average than for the latest year. The larger time span for the ratio seems to increase the difference between the estimations and observed values. As the past 5 years include economic downturns in many EU countries, the differences between PD estimations (at the end of 2015) and default rates may also reflect macro-economic developments affecting credit quality and the value of the collateral. At the same time, many banks were not able to provide a 5-year history because data was not available in the required breakdown, a point that was discussed during the interviews with banks. The latest year seems to show more comparability between estimations and observed values (i.e. there are lower and more stable interquartile ranges for the latest year than for the 5-year average). Figure 21: Comparison of the PD and the default rate (latest year and past 5 years), for the SME retail portfolio, for non-defaulted exposures, for the AIRB approach, by EU country of the bank 31
 and the EU LGD benchmark, for the SME retail portfolio, for non-defaulted exposures, for the AIRB regulatory approach, by bank The high interquartile range of the LGDs is also")
32 6.1.3 LGD and loss rate The LGDs range from 10% to 62%. Several banks show extreme values of LGDs, i.e. LGDs well below or above the interquartile extremes. Figure 22: LGD (%) and the EU LGD benchmark, for the SME retail portfolio, for non-defaulted exposures, for the AIRB regulatory approach, by bank The high interquartile range of the LGDs is also visible at the country level, with a higher degree of LGD variability and greater differences not only per country but also within some EU countries than for PDs. Nevertheless, similarly to PDs, despite higher LGD interquartile ranges across EU countries, the participating banks show LGDs in line with the EU LGD benchmark for most of the EU countries. Figure 23: LGD range, for the SME retail portfolio, for non-defaulted exposures, for the AIRB approach, by EU country of the bank The backtesting approach shows that the medians of the ratios between the loss rate and the LGD, for both the latest year and the 5-year average, are below 1. That is to say that, in general, the outturn analysis does not raise concerns regarding the calibration of LGDs (based on the loss rates reported for the past 5 years) and the analysis is potentially conservative. 32
33 However, for situations where the ratio is above 1, it is also possible to identify some EU countries presenting systematically (for both the latest year and the 5-year average) minimum ratios above 1 (i.e. for those countries, for the institution with the minimum ratio, the ratio is always above 1 or even above 1.5). This indicated that, within those EU countries, all of the reporting institutions have experienced loss rates higher than the LGD estimates produced by their internal models (LGDs lower than the 1-year loss rate and the 5-year average), indicating the need for further investigation by the CA. It should be noted, however, that the LGDs reported by the institutions do not necessarily capture mitigation action imposed by the CA to address deficiencies previously identified in the models in scope. The comparison between LGDs and loss rates needs to consider the CRR requirement for LGDs to be reflective of downturn conditions. Contrary to the evolution of the ratio between the default rates and the PDs, in which the variability decreased in the latest year, the LGD interquartile ranges for both the latest year and the average of the past 5 years show a similar degree of variability. This could be the result of a lag in the adjustment of the provisioning approach and assumptions as the economic conditions have improved, indicating the need for further investigation by the CA. Figure 24: Comparison of the LGD and the loss rate (latest year and past 5 years), for the SME retail portfolio, for non-defaulted exposures, for the AIRB approach, by EU country of the bank 33
, that is, there are banks with different approaches in both extremes of the distribution; however, the AIRB RWs")
34 6.2 SME corporate IRB risk weights The RW deviations from the EU RW benchmark vary significantly at the bank level. There are no significant differences between the regulatory approaches (FIRB and AIRB), that is, there are banks with different approaches in both extremes of the distribution; however, the AIRB RWs are in general lower than the FIRB RWs. Figure 25: RWs (%) and the EU RW benchmarks, for the SME corporate portfolio, for IRB nondefaulted exposures, by bank PD and default rate The PD deviations (%) from the EU PD benchmark do not vary significantly at the bank level, with most of the PDs for the SME corporate portfolio around the EU PD benchmark. There are no significant differences between the regulatory approaches (FIRB and AIRB); however, contrary to the situation of the RWs and the different regulatory approaches, the median PD for the FIRB approach is slightly lower than the median PD for the AIRB approach. The size of the exposure, the turnover of the firm and, consequently, the size of the SME are normally considered drivers of the level of the PD (see, for instance, the 2013 HDP report showing such a relationship), i.e. in general, for smaller firms (and exposures), PDs are higher. The analysis of the data provided by the EU institutions for the benchmarking exercise indicates that the individual exposures under the FIRB approach are significantly smaller than the individual exposures under the AIRB approach (i.e. there is a lower median individual exposure size for FIRB portfolios than for AIRB portfolios when comparing the total exposure of the asset class and the number of obligors). As a result, in general, a higher PD would be expected in the FIRB sample than in the AIRB sample; however, this is not the case. Given that the RWs do not follow a similar pattern to the PDs (i.e. there is a higher median RW for the FIRB approach than for the AIRB approach), the analysis of the LGDs and CCFs may also provide additional information. If opposing results are found regarding LGDs and CCFs (i.e. they are lower for the AIRB approach than for the FIRB approach), this may be a signal of potential compensation effects from banks under the FIRB approach. 34

35 Figure 26: PDs (%) and the EU PD benchmark, for the SME corporate portfolio, for non-defaulted exposures, by regulatory approach (FIRB or AIRB), by bank Moreover, it seems that some banks used group-wide models to estimate PDs and LGDs for exposures in jurisdictions in which they have smaller number of obligors, instead of developing country models (which was discussed during the interviews with banks). For retail exposures, the country location is an important driver, so the use of global IRB models may increase the possibility of misrepresentation of the risk estimations and increase RW variability. However, the country of the counterparty might be a driver within a model and, therefore, be taken into account. Moreover, if a bank has only few exposures to another country, it might not be possible to easily develop an own-country-specific model. The segmentation of the banks risk parameter estimations at the country level showed misalignments when compared with the benchmarks of the country, with some exposures presenting a potential for systematic underestimations, i.e. both estimations being below the country benchmarks and also below observed values for the same bank. A possible persistent misalignment, despite being for a small number of obligors and with possible lower materiality, may be a signal of the inadequacy of a group-wide model when used for some jurisdictions. For instance, the same may applies when some models show persistent signals that are not adequate for being used for some sectors of activity, despite a good performance in general. Regarding the different regulatory approaches, the comparison of the ratio between the default rate and the PD, for the average of the past 5 years, shows some differences. The participating banks under the AIRB approach, for the SME corporate portfolio, show less conservative figures, i.e. with a ratio above 1 and with much higher variability. Figure 27: Comparison of the PD and the default rate (past 5 years), for the SME corporate portfolio, for IRB (FIRB and AIRB) non-defaulted exposures, by EU country of the bank 35
, with a clear separation between the two approaches (the median LGD for the FIRB approach is 40% and the median LGD")
36 6.2.3 LGD and loss rate The LGD deviations (%) from the LGD benchmark vary at the bank level, ranging from 5% to 80%. Several banks show LGDs well below and above the interquartile extremes. There is a significant difference between the regulatory approaches (FIRB and AIRB), with a clear separation between the two approaches (the median LGD for the FIRB approach is 40% and the median LGD for the AIRB approach is 27%). The majority of AIRB banks have LGDs below the EU LGD benchmark (only six banks have LGDs higher than the lowest FIRB LGD). At the same time, the comparison of LGDs should take into account different levels of collateralisation. Figure 28: LGDs (%) and the EU LGD benchmark, for the SME corporate portfolio, for nondefaulted exposures, by regulatory approach (FIRB and AIRB), by bank The LGD variability is much higher for AIRB banks than for FIRB banks. Despite such variability, the LGD interquartile range is around the EU LGD AIRB benchmark for most of the EU countries, with the minimums and maximums close to the 25th and 75th percentiles, respectively, i.e. the 25th and 75th percentiles of each EU country are close to the EU interquartile range. 36
37 Figure : LGD range, for the SME corporate portfolio, for IRB (FIRB and AIRB) non-defaulted exposures, by EU country of the bank In addition, the participating banks under the AIRB approach, for the SME corporate portfolio, for the ratio between the loss rate and the LGD for the average of the past 5 years, show conservative figures, i.e. with a ratio below 1 41, with some exceptions. 41 See Annex 6 for additional charts. 37

, with the median RW for the AIRB approach significantly below the median RW for the FIRB approach.")
38 6.3 Corporate-other IRB risk weights The RW deviations (%) from the EU RW benchmark vary significantly at the bank level. The corporate-other portfolio is the least homogeneous portfolio among the four exposure classes. On average, the number of obligors per bank in this portfolio is also smaller than in the other portfolios and, therefore, this may contribute to the variability. There is a significant difference between the regulatory approaches (FIRB and AIRB), with the median RW for the AIRB approach significantly below the median RW for the FIRB approach. The analysis of the risk parameters PD, LGD and CCF per regulatory approach allows an understanding to be gained of the possible reasons for such differences. Figure 30: RWs (%) and the EU RW benchmarks, for the corporate-other portfolio, for IRB nondefaulted exposures, by bank PD and default rate The PD deviations (%) from the PD benchmark do not vary significantly at the bank level. There is a significant difference between the regulatory approaches (FIRB and AIRB), with the median PD for the AIRB approach above the median PD for the FIRB approach. That is, similarly to the SMEcorporate portfolio, the PDs for the FIRB approach are lower than the PDs for the AIRB approach, although the difference is even higher than for the SME-corporate portfolio. Figure 31: PDs (%) and the EU PD benchmarks, for the corporate-other portfolio, for nondefaulted exposures, by regulatory approach (FIRB and AIRB), by bank 38
39 Again, the size of the exposure, the turnover of the firm and, consequently, the size of the firm are normally considered drivers of the level of the PD (see, for instance, the 2013 HDP report showing that, for smaller firms, and exposures, PDs are higher). Once more, it is expected that there will be a higher PD for a lower exposure size (based on the total exposure of the asset class and the number of obligors, and with a direct link to the size of the SME); however, this is not the case. Given that the RWs follow a different pattern from the PDs, the evolution of the LGDs and CCFs may also provide additional information of a possible compensation effect. The interquartile ranges at the country level show that most of the EU countries lie within the 25th and 75th percentiles of the EU PD benchmark. The comparison of the regulatory approaches shows a higher variability for FIRB exposures than for AIRB exposures. In addition, for some countries, there are significant differences between the FIRB and AIRB exposures. Therefore, regarding PDs for the corporate-other portfolio, the possible compensation effects may be more significant for some EU countries. Moreover, it seems that some banks have not developed country-specific models, using instead group-wide models to estimate PDs and LGDs for exposures in jurisdictions in which they have smaller number of obligors (information provided during the interviews with banks). The country location is an important driver, so the use of group-wide IRB models may increase the possibility of misrepresentation of the risk estimations and increase RW variability. The segmentation of the banks estimations at the country level showed misalignments when compared with the benchmarks of the country, with some of them presenting systematic underestimations, i.e. both estimations being below the country benchmarks and also below observed values for the same bank. From a validation perspective, the estimations should maintain their uniformity and coherence, despite possible splits per country, sector, type of obligors, year of origination of the exposure, etc. The comparison with the benchmarks for the same country allows the coherence of such estimations to be assessed. A possible persistent misalignment, despite being for a small number of obligors, may be a signal of the inadequacy of a group-wide model for some jurisdictions. The same may happen within a country and a group sector-wide model that tries to cover very different types of sectors (agriculture, industry, tourism, etc.). Figure 32: PD range, for the corporate-other portfolio, for IRB (FIRB and AIRB) non-defaulted exposures, by EU country of the bank 39
40 Figure 33: Comparison of the PD and the default rate (latest year), for the corporate-other portfolio, for IRB (FIRB and AIRB) non-defaulted exposures, by EU country of the bank The extreme outlier for C 06 is due to data quality issues when reporting the figures. 40

41 6.3.3 LGD and loss rate The LGD deviations (%) from the LGD benchmark vary at the bank level, ranging from 9% to 70%. Several banks show LGDs well below and above the 25th and 75th percentiles, respectively. LGDs are not concentrated around the median, but a high number of extreme values can be observed. A comparison of the regulatory approaches shows that there is a significant difference between the FIRB and AIRB approaches, with a clear separation between the two approaches. The majority of AIRB banks have LGDs below the EU FIRB LGD benchmark (e.g. the 75th percentile of the AIRB LGD is lower than the EU FIRB LGD benchmark). Figure 34: LGDs (%) and the EU LGD benchmarks, for the corporate-other portfolio, for nondefaulted exposures, by regulatory approach (FIRB and AIRB), by bank As expected, LGD variability is much higher for banks under the AIRB approach than those under the FIRB approach. Despite such variability, the LGD interquartile range is around the EU LGD AIRB benchmark for most of the EU countries, with the minimums and maximums close to the 25th and 75th percentiles, respectively, i.e. the 25th and 75th percentiles of each EU country are close to the EU interquartile range. Figure 35: LGD range, for the corporate-other portfolio, for IRB (FIRB and AIRB) non-defaulted exposures, by EU country of the bank 41
42 Regarding RWs, the differences between the regulatory approaches (FIRB and AIRB) seem substantial and are influenced by risk parameters. As expected, the median LGD is higher for the FIRB approach than for the AIRB approach, and is around the regulatory LGD of 45%. By contrast, the median PD is significantly lower for the FIRB approach than for the AIRB approach. Regarding the corporate-other portfolio, given the higher LGDs and CCFs for banks under the FIRB approach than for those under the AIRB approach, possible compensations on the estimation of PDs may be a reason for the significantly lower PDs for the FIRB approach than for the AIRB approach. The possible compensation seems unbalanced between the FIRB and AIRB approaches owing to the lower RWs for the AIRB approach than for the FIRB approach (although this was not the case for the SME corporate portfolio). That is, it seems that the lower PDs for the FIRB approach than for the AIRB approach do not compensate for the very low levels of LGDs for the AIRB approach. In addition, the CCFs also seem to play a role in such differences (in general, CCFs are higher for banks under the FIRB approach than for those under the AIRB approach) 43. Figure 36: CCFs (%) and the EU CCF benchmark, for the corporate-other portfolio, for nondefaulted exposures, by regulatory approach (FIRB and AIRB), by bank 43 See Annex 6 for additional charts. 42
43 6.4 Residential mortgage IRB risk weights The RW deviations (%) from the EU RW benchmark vary significantly at the bank level, ranging from 10% to +50% (absolute values in comparison with the EU RW benchmark). Figure 37: RW deviations (%) from the RW benchmark, for residential mortgages, for IRB nondefaulted exposures, by bank The RW interquartile range of the majority of the EU countries is around the EU RW benchmark. The RW variability is low, not only across the EU countries but also within each EU country. The RW interquartile range is also significantly smaller than in other portfolios. The low variability may be driven by the fact that these type of portfolios are less geographically diverse than for the other portfolios. Figure 38: RW range, for residential mortgages, for IRB non-defaulted exposures, by EU country of the bank 43
44 6.4.2 PD and default rate The PD deviations (%) from the PD benchmark do not vary substantially at the bank level (the PD of the majority of banks is around the EU PD benchmark, with PDs ranging from slightly higher than 0.3% to 65%). There are few banks with extreme values or with values well above the EU PD benchmark, reflecting the high level of non-performing loans for this type of portfolio. Figure 39: PDs (%) and the EU PD benchmark, for residential mortgages, for non-defaulted exposures, by regulatory approach (FIRB and AIRB), by bank There are no significant differences across EU countries (in particular, in comparison with other portfolios). Very few countries have high interquartile ranges, owing to macro-economic downturns, and the remaining countries have interquartile ranges smaller than 3%. Figure 40: PD range, for residential mortgages, for IRB non-defaulted exposures, by EU country of the bank The outturns approach, i.e. the comparison of observed and estimated values (backtesting), shows that the medians of the ratios between the default rate and the PD (i.e. the ratio between observed and estimated values), for both the latest year and the 5-year average, are below 1 (i.e. 44

45 the numerator is lower than the denominator). That is, in general, the estimated values (PDs) are higher than the default rates observed over the past 5 years, in particular for the latest year (e.g. the 75th percentile also shows a ratio below 1). The PD interquartile range of the ratio between the default rate and the PD is higher for the 5- year average than for the latest year. The consideration of a larger time span for the ratio seems to increase the difference between estimations and observed values. The past 5 years include economic downturns in many EU countries; therefore, the differences between PD estimations and default rates may have increased given the uncertainty and volatility of some exposures. The latest year seems to show more alignment between estimated and observed values (i.e. lower differences for the latest year than for the 5-year average). It should also be noted that the PDs reported by the institutions and used in the analysis do not necessarily capture the impact of mitigation actions imposed by the CA to address deficiencies identified in the models in scope. Figure 41: Comparison of the PD and the default rate (latest year and past 5 years), for residential mortgages, for IRB non-defaulted exposures, by EU country of the bank 45
.")
46 6.4.3 LGD and loss rate The LGD deviations (%) from the LGD benchmark vary at the bank level. Few banks show LGDs below the 25th percentile, whereas many banks show LGDs well above the 75th percentile. However, the 75th percentile is also very low (19%). Figure 42: LGDs (%) and the EU LGD benchmark, for residential mortgages, for non-defaulted exposures, for the AIRB approach, by bank The low interquartile range of the LGDs is visible at the EU country level, with lower LGD variability and fewer differences not only per country but also within some EU countries (in comparison with other portfolios). Similarly to PDs, the participating banks have LGDs around the EU LGD benchmark for most of the EU countries (i.e. with the 25th and 75th percentiles, respectively, below and above the EU LGD benchmark). Figure 43: LGD range, for residential mortgages, for IRB non-defaulted exposures, by EU country of the bank The outturns approach, i.e. the comparison of observed and estimated values (backtesting), shows that the medians of the ratios between the loss rate and the LGD (i.e. 46
47 observed/estimated), for both the latest year and the 5-year average, are very similar and well below 1 (i.e. the numerator is lower than the denominator). In general, the estimated values (LGDs) are higher than the loss rates reported in recent years. This is consistent with the fact that the CRR requires LGDs to be reflective of downturn conditions. Contrary to the evolution of the ratio between default rates and PDs, in which the variability decreased in the latest year, the LGD interquartile range for both the latest year and the average of the past 5 years shows similar variability. Figure 44: Comparison of the LGD and the loss rate (latest year and past 5 years), for residential mortgages, for IRB non-defaulted exposures, by EU country of the bank 47
48 7. Impact analysis using the CET1 ratio This chapter describes the outcome of a specific impact analysis on the CET1 ratio that is based on alternative higher RWA quantities (RWA* and RWA**) reported by the institutions, in particular by using the outturns for PDs. This impact analysis is based on a specific definition of alternative risk parameters and, thus, only negative variations (i.e. reduction of the CET1 ratios) are considered; therefore, possible positive variations and consequent compensation effects are not included (e.g. for a specific portfolio and specific rating grades, a possible underestimation of the PD and use of a higher PD to recalculate the RW, with a resulting decrease in the CET1 ratio, is not offset by a possible overestimation of the PD in another portfolio). This impact analysis does not try to reflect regulatory measures or corrective actions in place that are having an impact on institutions capital requirements, nor does it consider institutions different risk management practices or different levels of collateralisation. Instead, it aims to provide an estimate of the potential magnitude of RWA changes under a specific scenario influenced by observed parameters. Providing such a reference point should help the reader to understand the potential scale of RW differences. Extrapolations to the total IRB credit risk portfolio cannot be made, because of the specific nature of HDP exposures. The data should, however, be interpreted with caution, given the one-sided conservative view of the analysis and some data quality constraints. The data collection was based on new definitions and parameters to be systematically calculated by all institutions and may require some improvements. Ultimately, this hampered the ability to draw definite conclusions about the impact explained by this dimension (see also Annex 3 for more information regarding possible limitations in relation to data availability and data quality constraints). Methodology The methodology applied compares the actual CET1 ratios with those re-computed using the RWA* and RWA** reported by the participating bank. The differences between the RWA and both the RWA* and the RWA** provide the impact of the observed default rate of, respectively, the latest year and the average of the past 5 years (based on a binomial test assumption for the internal credit risk models) for the UL. If the PD used to estimate the RWA shows an extreme negative deviation from the observed default rate, higher PDs are used (PD* and PD**) to recalculate the RWA (i.e. RWA* and RWA**), where, however, PD* and PD** are still well below the observed default rate (at the lower boundary of the 97.5% confidence interval) and are thus not designed as a measure of conservatism. Therefore, the re-calculation of the CET1 ratio, per bank and main portfolio (residential mortgage, SME retail, SME corporate or corporate-other), based on both the RWA* and the RWA**, can provide an example of the possible impact on capital requirements influenced by estimated PDs and observed default rates PD* and PD**, calculated by the participating banks, are the smallest PD estimates for which the one-sided binomial test (based on a normal approximation of the binomial distribution with a confidence level of 97.5%) would be passed (see, for details, Commission Implementing Regulation (EU) 2016/2070, OJ L 328, (Annex IV, Results 48
49 The example below provides practical information regarding the calculations of the impact on CET1 for a specific bank with a current CET1 ratio of 8%, for a specific portfolio, namely residential mortgages, taking into account the RWA* provided by the bank. Example for Bank Y COREP data: CET1 = 8 (monetary unit, i.e. m.u.) Total RWA = 100 m.u. CET1 ratio = 8 / 100 = 8% Residential mortgage (ITS supervisory benchmarking data): RWA residential mortgage = 25 m.u. RWA* residential mortgage = 40 m.u. Impact on CET1 ratio derived from residential mortgage: CET1 ratio* = 8 / ( ) = 6.96% Impact (bps) = 6.96% 8% = 1.04% = 104 bps The necessary increase of CET1 capital to maintain the same CET1 ratios as before the estimated impact would be 1.04% * ( ) = 1.2 m.u. The simple aggregation of participating banks allows the aggregate impact on the CET1 ratio derived from residential mortgage or, more generally, from the main portfolios to be presented. Results The exposure-weighted average CET1 capital ratio in the sample as of December 2015 is 13.23%. 45 The impact of the use of the RWA* and RWA** on the CET1 capital ratio is, respectively, 9 bps and 17 bps, bringing the CET1 ratio across the sample from 13.23% to, respectively, 13.15% and 13.06%. In addition, the negative variations are not concentrated in banks with lower CET1 ratios, but dispersed throughout banks with different levels of CET1 ratios (namely the difference between the original CET1 ratio and both the CET1* and the CET1** ratios). Supervisory Benchmarking Portfolios, Part II: Template Related Instructions C 103 Details on exposures in High Default Portfolio). 45 Pooling all of the banks figures together as if they were one large bank and using COREP figures from C and C to compute the ratio. 49
50 Figure 45: Impact on the CET1 ratio using both the RWA* and the RWA**, on the total level, for all portfolios, for defaulted and non-defaulted exposures, by bank The impacts on the CET1 ratio from institutions real RWAs and the associated change to both the RWA* and the RWA**, for each main portfolio, show that, on average, the variations are not significant. The SME retail portfolio presents the smallest impact on the CET1 ratio using both the RWA* and the RWA**, without any significant change at the bank level for most of the banks (with a concentration of the CET1** delta around the 75th percentile, which is around 0.34 bps, and an interquartile range of only 8 bps). Figure 46: Impact on the CET1 ratio using both the RWA* and the RWA** for defaulted and nondefaulted exposures, by portfolio CET1** (CORP - Delta bps) CET1** (SMER - Delta bps) CET1** (SMEC - Delta bps) CET1** (MORT - Delta bps) P Q Q Q3 - Q The highest impacts on CET1 are shown in the residential mortgage portfolio, with the median around 6 bps and the 25th percentile around 30 bps. For all the portfolios, the dispersion and interquartile ranges are higher for the RWA based on the average of the past 5 years (RWA**) than that based on the latest year (RWA*). The regulatory approach may be also relevant; however, the CET1 ratio impacts were not calculated. 46 From the interviews with some banks, it was observed that, in the case of model reviews as a result of deficiencies and the consequent need for conservative bank and regulatory actions to improve the outputs, a margin of conservatism (e.g. add-ons) is often applied by banks to their RWA until the issues have been addressed. The impact on those margins of conservatism, or other regulatory imposed add-ons, have not been captured in the analysis. In future exercises, the collection of additional data regarding the use of margins of conservatism, possible links to compensation effects and the different add-ons impacts on the RWA estimates would need to be considered. 46 Even if using only the effect from the observed defaults and PDs for the RWA* and RWA**, there may be differences to take into account between the FIRB PD and AIRB PD, and the same is true for LGDs (i.e. the FIRB LGD* and the AIRB LGD*, as well as the FIRB LGD** and the AIRB LGD**, and the influence on the RWA* and the RWA**). 50
 of Directive 2013/36/EU, and Articles 8 and 9 of the draft RTS on supervisory benchmarking.")
51 8. Competent Authorities assessments As part of the HDP 2016 exercise, the CAs provided individual assessments for each participating institution about any potential underestimation of the capital requirement as required by Article 78(4) of Directive 2013/36/EU, and Articles 8 and 9 of the draft RTS on supervisory benchmarking. This chapter highlights some of the key information derived from these assessments. Regarding the level of priority for the assessments, most of the CAs considered the residential mortgage portfolio to be the most important portfolio. Among other reasons, CAs referred the to the materiality of the exposures in terms of EAD, the possible underestimation of own funds requirements for the defaulted assets (e.g. doubts regarding the calculation of the LGD for defaulted exposures the so called LGD in-default and the best estimate of EL (ELBE) models) and the number of situations (risk parameters and other indicators) in which a bank is an outlier when compared with peers. Figure 47: Level of priority for the assessments The CAs own overall assessments of the level of own funds requirements, taking into account benchmark deviations, show that the corporate-other and residential mortgage portfolios present the highest numbers of potential underestimations that are not justified, with additional information required to determine the possible reasons for this. In addition, the corporate-other portfolio shows a higher number of banks with potential underestimations that are justified, according to the CAs. As an example, a CA notes that, since the exercise was conducted, the models related to possible underestimations that are not justified were redeveloped/recalibrated in 2016 and thus it is expected that the gap will be closed once these improved and more cautious models are validated in
52 Figure 48: Number of responses in CAs own overall assessments of the level of own funds requirements, taking into account benchmark deviations, per portfolio, per type of answer The banks internal validation processes are also an important element to consider. According to the CAs, for most of the situations, banks internal validations have not identified possible unjustified underestimations of the internal models. This is particularly evident for the residential mortgage portfolio, and more details need to be collected in future assessments. Figure 49: Number of responses to the question Have the banks internal validations identified possible underestimations of the internal models that are not justified?, per portfolio, per type of answer Regarding the CAs monitoring activities, most of the CAs noted that the ongoing or on-site monitoring of the internal models identified possible underestimations that are not justified, in particular for both the corporate-other and SME corporate portfolios. For instance, one CA noted that weaknesses in the rating process and in the related credit processes had been identified in past on-site inspections. Supervisors will need to conduct further investigations to understand the details. 52

53 Figure 50: Number of responses to the question Have the CA monitoring activities (ongoing or on-site) of the internal models identified the possible underestimations that are not justified?, per portfolio, per type of answer 53
54 Conclusion This report presents the results of the supervisory benchmarking exercise for residential mortgage, SME retail, SME corporate and corporate-other portfolios (collectively referred to as HDPs), conducted pursuant to Article 78 of the CRD and the related technical standards on the internal approaches for credit risk. 47 The 2016 HDP benchmarking exercise involved, for the first time, the entire population of banks that are authorised to use internal models for the calculation of regulatory capital in the context of HDPs. However, the analysis is carried out on only the highest level of consolidation. This study includes 114 institutions, 48 which participated in the exercise across 17 EU countries. The reference date for the data of this report is 31 December 2015 The benchmarking results should, however, be interpreted with caution given some data quality constraints, which hamper the ability to draw definite conclusions. The data collection was based on new technical standards with new definitions and parameters; therefore, the findings should be interpreted with caution, given some data quality constraints. Additional qualitative information on specific aspects such as banks modelling methodologies and assumptions, data sources, lengths of time series, default definitions, number and scope of models as well as on the downturn approach for LGDs has been collected through interviews with a sample of 10 banks. Main findings Most of the results from the 2016 HDP exercise are broadly in line with those of previous studies on HDPs. The GC 49 varies at the total portfolio level, and for a larger sample than in the 2013 HDP report, from 8% to 3%, with a simple average of 75%. In the 2013 HDP report, the range was between 14% and 174%,with a simple average of 67%. 50 Similarly, the average RW per institution varies from 7% to 1%, with a simple average of 37%. This compares to a range between 11% and 71% and a simple average of 32% reported in the 2013 HDP report. A key finding is that 82% of the observed GC variability across participating institutions portfolios can be explained by only a few factors, namely the proportion of defaulted assets, the proportion 47 This is the first exercise that is based on the new technical standards on supervisory benchmarking pursuant to Article 78 of the CRD. The technical standards are applied for the calculation of RWAs on the internal approaches across the EU. They were published by the EBA in January 2015 and adopted by the EU Commission in September EBA list of institutions for the purpose of supervisory benchmarking (June 2016), i.e. HDPs and LDPs. hmarking+%28june+2016%.pdf/2b0b55f7-f745-49e2-ace5-f db8d (see, for details, Chapter 3 on the dataset and assessment methodology). 49 GC, for IRB exposures, is computed as (12.5 * EL + RWA) / EAD. The RW, computed at different levels of aggregation, enables the effect of all the IRB parameters (namely PD, LGD, CCF and maturity, but also the asset correlation) to be synthesised in one indicator. The pitfall with the RW is that it refers only to the UL. Indeed, under the IRB approach, a bank is asked to cover with provisions or capital the estimated total losses, i.e. EL and UL. 50 EBA report Third interim report on the consistency of risk-weighted assets: SME and residential mortgages. 54
55 of non-eu exposures and the portfolio-mix. The level of GC variability that can be explained increased slightly in comparison with the 2013 HDP report (from 78%), and the main determinants are almost the same, after the number of participating banks increased significantly. The cross-sectional (distribution analysis) approach and the outturn ( backtesting ) approach focused on EU countries (country of the participating institution), for non-defaulted exposures, for each of the main portfolios (residential mortgage, SME retail, SME corporate and corporateother portfolios). The distribution analysis represents a peer comparison of the estimates of the risk parameters at the portfolio level, whereas the outturn ( backtesting ) analysis produces a peer comparison between observed values and estimated values for the same comparable risk parameters. Considering the cross-sectional approach, for EU non-defaulted exposures, the RW interquartile ranges present significant variation, in particular for both the SME corporate and corporate-other portfolios. Regarding the outturn ( backtesting ) approach and the comparisons between observed values and estimated values, in general, the estimated values for PDs and LGDs are above the observed values for default rates and loss rates. It is important to note, however, that the comparisons and possible differences between estimated and observed values should consider that the CRR requires the PD to reflect the long run experience and to include some conservatism for data and model errors, whereas the LGD needs to reflect downturn conditions. However, the comparison of the ratio between the default rate and the PD, for the average of the past 5 years, shows some differences per regulatory approach. The participating banks under the AIRB approach, for the SME corporate portfolio, show less conservative figures, i.e. with a ratio above 1 and with much higher variability. This again might be compensated for by more conservative PD estimates. As in previous reports, this approach also shows that there may be differences across jurisdictions in the level of conservatism. Some EU countries show systematically (i.e. for the latest year and the average of the past 5 years) ratios above 1 (i.e. observed values above the estimate values) for different risk parameters. CAs provided individual assessments for each participating bank, as required by Article 78(4) of the CRD. 51 For the majority of the banks assessments, the RW deviations (both negative and positive) from EU benchmarks were assessed by the CAs as justified and not significant. Regarding the level of priority for the assessments, most of the CAs considered residential mortgages to be one of the most important portfolios to follow, given the details provided by the supervisory benchmarking exercise. The supervisory benchmarking exercise highlighted several areas in which supervisors should develop further investigations, such as the practices regarding defaulted exposures, the definition of default, the use of group-wide models and the interaction with country specificities for exposures with counterparties from different jurisdictions, unjustified differences between regulatory approaches and possible compensation effects between risk parameters, and systematic differences between observed and estimated values for some banks, among other 51 CAs should, at least annually, make an assessment of the quality of the IRB approaches and, in accordance with Article 78(4) of the CRD, pay particular attention to significant differences in own funds requirements for the same type of exposures, and also to significant and systematic underestimation of own funds requirements. 55
56 issues. For those reasons, supervisory actions are expected to address the issues that have the potential to provoke underestimations in the calculation of the regulatory capital. Future work The results of the supervisory exercises are taken into account for the work the EBA is conducting in parallel on the validation of internal models, which is contributing to harmonising supervisory and banks practices and to enhancing consistency. This work includes using existing EBA Guidelines, where appropriate, to enhance convergence in the computation of RWAs, and to improve Pillar 3 disclosures, as well as the validation and ongoing monitoring of internal models. In 2016, the EBA set out a roadmap specifying the general principles and timelines for the implementation of the regulatory review of the internal models for credit risk. Among several measures, it introduced changes aimed at harmonising definitions and supervisory practices in the definition of default, the estimation of risk parameters and treatment of defaulted assets, credit risk mitigation techniques and disclosure in four phases. 52 These changes should be supplemented by amendments to the underlying framework beyond what is currently allowed in European legislation to reduce undue variability in the implementation of the IRB models. The use of a new complementary methodology, namely the outturn (backtesting) approach, allowed the results from previous analyses to be confirmed based on other approaches and more details to be determined regarding risk parameters, in particular the variability and possible systematic differences across the EU and within each EU country. The report tracks the progress in the repair of internal models and contributes to the identification of areas in which supervisory action is still necessary. In general, the CAs will need to continue to ensure that their decisions on the appropriateness of corrective actions comply with the principle that such actions must maintain the objectives of an internal approach and, therefore, do not lead to standardisation or preferred methods, create wrong incentives or cause herd behaviour. The policy implications of the analyses carried out so far, as well as possible regulatory measures for improving the functioning of internal models, were summarised in the Discussion Paper on the future of the IRB Approach, published by the EBA in March Regarding future work, this study provides an initial starting point for the analysis of HDPs, allowing future evolution to be monitored and highlighting potential areas for further investigation, such as the comparisons between regulatory approaches, in particular between FIRB, AIRB and standardised approaches; the possible influence of the collateral status and assumptions on the internal LGD estimates; the importance of data sources, the length of the time series of the data and data quality issues (aspects mentioned during the interviews with banks); the influence of cross-border exposures in the quality of the internal models; and the evolution of risk parameters and interquartile figures at the country level in comparison with the EU benchmarks. Data quality constraints from some participating institutions also deserve attention from CAs, given the possible data limitations and the need for improvements in their internal general data 52 EBA model validation Discussion Paper on the future of the IRB Approach. 56
57 collection systems, IT infrastructures and database level. Moreover, the ITS on supervisory benchmarking needs further developments to allow a common understanding to be gained of the reporting requirements. In addition, more guidance might be provided to the CAs on the EBA benchmark and the assessment of the benchmarking results. 57
58 Annex 1: List of participating institutions in supervisory benchmarking exercises The EBA collected information related to the institutions that met the criteria of this exercise. 54 The EBA has requested that the CAs transmit institutions data for supervisory benchmarking purposes, leveraging on the usual data collection procedures and formats of regular supervisory reporting, by the 30 June The list of institutions is available on the EBA website at the following link: /eba-publishes-decision-on-data-for-supervisory-benchmarking 58
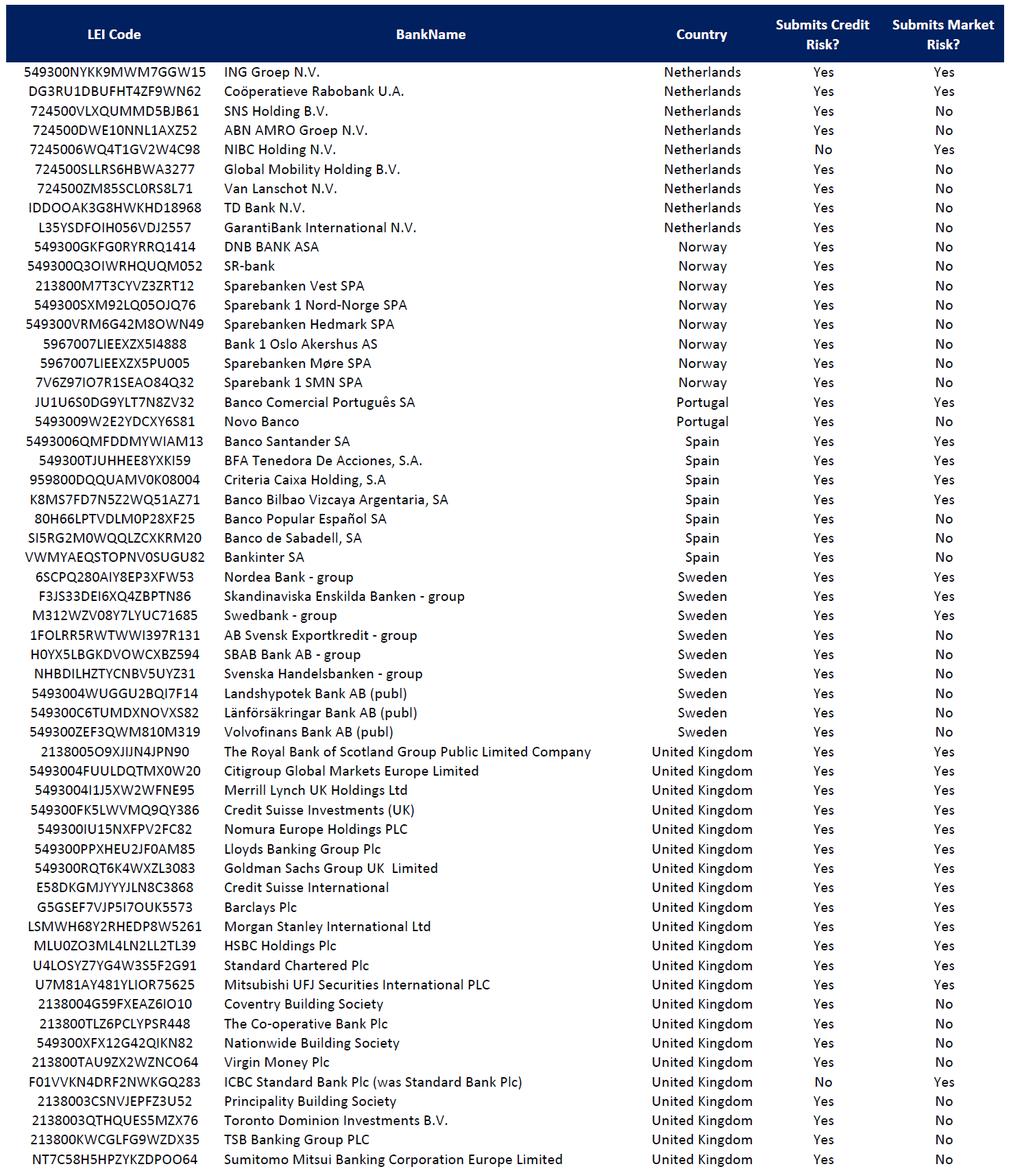
59 59
60 Annex 2: Source of data Annex II of the ITS, Template C This template gives the definitions of the different HDPs and segments as follows: Portfolio ID (identified by the EBA with a unique ID). It represents the most granular portfolios (portfolio ID per country of the counterparty for the EU). Portfolio name (four types of exposure classes have been broken down in different portfolio names : nine portfolio names for corporate-other (CORP), nine portfolio names for corporate SME (SMEC), nine portfolio names for retail SME (SMER) and 10 portfolio names for residential mortgage (MORT)). o o o For firms (corporate and SME), there are three exposure classes, based on the size of the counterparty: corporate-other (size of the counterparty: >EUR 50 million, EUR 200 million); corporate SME (size of the counterparty: >EUR 1 million, EUR 50 million); retail SME: For retail SME, in the template, there are three exposure classes: retail (secured by real estate) SME, retail (other) SME and retail (secured by real estate SME/other) SME. However, these three exposures classes can be classified from a practical and methodological point of view as just one group, namely retail SME; For mortgages, there is only one exposure class ( retail-secured by real estate non-sme ); 55 For the four exposure classes, it is possible to distinguish between defaulted (only one portfolio name for each exposure class, that is, without further breakdown) 56 and non-defaulted (eight portfolio names for each corporate, corporate SME and retail SME, and nine portfolio names for mortgages). 55 In Article 4(75) of the CRR there is a definition of residential property but no definition of commercial property. For the purposes of the CRR, commercial immovable property encompasses any immovable property (including offices and other commercial premises) that is not a residential property within the meaning of Article 4(1) and (75) of the CRR. 56 Article 178 of the CRR. The obligor is past due more than 90 days on any material credit obligation to the institution, the parent undertaking or any of its subsidiaries. Competent authorities may replace the 90 days with 180 days for exposures secured by residential or SME commercial real estate in the retail exposure class, as well as exposures to public sector entities). The 180 days shall not apply for the purposes of Article 127 of the CRR. 60
61 Firms (corporate and SME) portfolios for the three exposure classes (CORP, SMEC or SMER) Portfolio name 020 CORP Non-defaulted Secured Construction CORP Non-defaulted Secured Other CORP Non-defaulted Secured CORP Defaulted CORP Non-defaulted Unsecured Construction CORP Non-defaulted Unsecured Other CORP Non-Defaulted CORP Non-defaulted Secured CORP Non-defaulted Unsecured Portfolio name 020 SMEC Non-defaulted Secured Construction SMEC Non-defaulted Secured Other SMEC Non-defaulted Secured SMEC Defaulted SMEC Non-defaulted Unsecured Construction SMEC Non-defaulted Unsecured Other SMEC Non-defaulted Unsecured SMEC Non-Defaulted SMEC Non-defaulted Secured Portfolio name 020 SMER Non-defaulted Secured Construction SMER Non-defaulted Secured Other SMER Non-defaulted Secured SMER Defaulted SMER Non-defaulted Unsecured Construction SMER Non-defaulted Unsecured Other SMER Non-defaulted Unsecured SMER Non-Defaulted SMER Non-defaulted Secured o o For firms (corporate and SME) non-defaulted, it is possible to distinguish the construction sector from the remaining sectors ( construction or other sectors ) and between two forms of collateral status (with credit protection (secured) or without credit protection (unsecured)). 57 For mortgages (one exposure class: retail-secured by real estate non-sme ), it is possible to make distinctions according to both the six indexed loan to value (current loan amount to the current value of the property) portfolio names and the two forms of collateral status (funded CRM or unfunded CRM). Mortgage portfolios for the exposure class Portfolio name Portfolio name Mortgages Defaulted Mortgages Non-defaulted funded CRM Mortgages Non-defaulted ILTV <=25% Mortgages Non-defaulted ILTV >100%,<=125% Mortgages Non-defaulted ILTV >125% Mortgages Non-defaulted ILTV >25%,<=50% Mortgages Non-defaulted ILTV >50%,<=75% Mortgages Non-defaulted ILTV >75%,<=100% Mortgages Non-defaulted Mortgages Non-defaulted Unfunded CRM For all the portfolio names mentioned above, it is possible to also have a breakdown by the country of the bank for the EU (i.e. there are portfolio IDs for each of the portfolios mentioned above). Several potential breakdowns are not available, namely breakdowns by: geographical area (country of the counterparty for non-eu counterparties); rating (internal rating assigned from the lowest risk to the highest risk, with a maximum of 30 grades); type of facility; NACE code (apart from construction ). 57 Article 4 of the CRR. Definitions: Article 4(58), Funded credit protection means CRM where the reduction of the credit risk on the exposure ( ) derives from the right ( ) in the event of the default of the counterparty ( ) to liquidate, or to obtain transfer o appropriation of, or to retain certain assets or amounts ( ). Article 4(59), Unfunded credit protection means CRM where the reduction of the credit risk on the exposure derives from the obligation of a third party to pay an amount in the event of a default ( ). 61
62 Annex 3: Data availability and data quality constraints The source of the data is mainly Template C (HDP), with the reference date 31 December The initial dataset is formed from the most recent data submissions from the institutions that arrived at the EBA up the 14 November Another source has been COREP data (Templates C 01 (020), C02 (010) and C03 (010)), with the reference date 31 December 2015 (no data cleaning on these figures has been conducted). 58 Data cleaning The initial dataset, before the data cleaning, was contributed to by 114 institutions (if the bank submitted at least one record with an EAD>0). From July to mid-september 2016, the EBA liaised with the national CAs to improve the data quality of the submissions, exchanging with them files containing feedback on the validation rules and additional quality checks. After the first step, other requests of data resubmissions were considered. In mid-september 2016, a cleaned dataset had been selected following these rules (at record level): i. Portfolio IDs in the list of Annex I, C (i.e. with figures at the total level and not only sub-portfolios levels); ii. EAD: not missing and >0 (i.e. with EAD figures in order to compute the weighted figures based on EADs); iii. PD: missing or between (excluded) 0 and ( )100%; iv. LGD: missing or 0; v. Number of obligors: missing or >0; vi. Default rate for 1Y (latest year): missing or 0; vii. Default rate for 5Y (average of past 5 years): missing or 0; viii. Loss rate for 1Y: missing or 0; ix. Loss rate for 5Y: missing or 0; x. Where C c070 (i.e. default status) presented different values from the ones expected and laid down in Annex I: a. The information reported by institutions was replaced (C c170, Annex III) by the equivalent (and accurate) information presented in Annex I for that particular portfolio; b. The records with Not applicable (default status) were excluded. xi. Regulatory Approach C c030 Annex III: a. only not null and values (representing AIRB and FIRB and excluding slotting criteria) were considered; b. The records with Not applicable (approach) were excluded; xii. For the institutions that submitted portfolios related to countries outside the scope of this exercise, the observations were excluded; xiii. Some analyses have been performed at only the total level; xiv. For the analysis in this report, no filters on the low number of obligors or low amounts of EAD have been considered. 58 In this exercise, there are potential data points for each bank and data points were submitted in total. 62
63 After the implementation of the data cleaning rules (in particular rules (i) and (ii)), 99 banks remained in the clean dataset. This clean dataset was used to compute some statistics 59 and the EU benchmarks. These statistics, computed at the portfolio and regulatory approach levels, were provided in mid-september, in an Excel file to the national CAs through the TFSB (Task Force on Supervisory Benchmarking) for their assessments of the internal models. Examples of data quality constraints: - different interpretations of the data requirements by banks (i.e. of the description in the ITS, e.g. loss rates, secured/unsecured portfolios, provisions of non-performing exposures); - some instances of low number of obligors, which might bias the values reported by banks and the benchmark (in particular for the country-specific portfolios); - partly low number of banks contributing to the benchmark of certain portfolios, which might bias the benchmark; - time constraints in implementing the reporting of the supervisory benchmark (associated with the ITS, potential aggregation problems, technical problems, etc.). 59 Q1, Q3, P50, AVG (weighted average of the EAD), mean (simple average), minimum, maximum, n (count of the observations) and STD (standard deviation). 63
.")
64 Annex 4: Outturns (backtesting) approach The majority of portfolio IDs present the data at the level of the country (of the counterparty) per bank, i.e. for each bank with a specific portfolio ID, there are (potentially) EU countries (i.e. sub-portfolio names can split the portfolio names by potential countries). As an example, a specific bank ( A ) provides the ratio between the default rate for latest year and the PD for the country BE in the SME corporate portfolio in the category non-defaulted, secured construction. Therefore, it is possible to have information on variables at the country level (e.g. for each EU country of the bank, an average of the ratio between the default rate for the latest year and the PD from several banks). These portfolio IDs and the descriptive for each ratio between the observed value and the estimated value (for comparable parameters) could be presented for each EU country of the bank as follows: Outturn approach Outturn approach 050- Default status 050- Default status EAD Default rate (latest year) / PD Default rate (past 5 ( ) years) / PD 020-Portfolio name 150-Indexed 090-NACE code Loan to value range 120-Collateral type Macro Exposure 080- (non present in 040-Exposure class Collateralisatio the annex) n status Nondefaulted Defaulted / / / / / / / / /060 ( ) Banks N Simple Average St Dev Min 25th Percentile Median 75th Percentile Max Banks N ( ) Corporates Corporates - Other Corporates - SME Non Real estate funded CORP Non-defaulted collateral Secured Other eligible collateral: Real estate Exposures with CORP Non-defaulted credit protection 060 F Construction Secured Construction YY Y Other non CORP Non-defaulted financial no Secured Other construction CORP Non-defaulted Unsecured CORP Non-defaulted Exposures without Unsecured 060 F Construction credit protection Construction YY Y Other non CORP Non-defaulted financial no Unsecured Other construction CORP Defaulted CORP Non-Defaulted Non Real estate funded SMEC Non-defaulted collateral Secured Other eligible collateral: Real estate Exposures with SMEC Non-defaulted credit protection 060 F Construction Secured Construction YY Y Other non SMEC Non-defaulted financial no Secured Other construction SMEC Non-defaulted Unsecured SMEC Non-defaulted Exposures without Unsecured 060 F Construction credit protection Construction YY Y Other non SMEC Non-defaulted financial no Unsecured Other construction SMEC Defaulted SMEC Non-Defaulted Real estate collateral, Mortgages Nondefaulted funded other funded CRM and/or personal CRM guarantees Mortgages Nondefaulted Unfunded and other unfunded Real estate collateral CRM CRM Mortgages Nondefaulted ILTV <=25% <=25% Mortgages Nondefaulted ILTV >100% <= 125% >100%,<=125% Retail - Secured by real Mortgages Nondefaulted ILTV >125% Retail - Mortages >125% estate non-sme Mortgages Nondefaulted ILTV >25% <=50% >25%,<=50% Mortgages Nondefaulted ILTV >50% <=75% >50%,<=75% Mortgages Nondefaulted ILTV >75% <=100% >75%,<=100% Mortgages Defaulted Mortgages Nondefaulted Retail - Secured by real Exposures with SMER Non-defaulted Other eligible estate SME credit protection Secured collateral: Real estate Exposures with SMER Non-defaulted Non Real estate funded credit protection Secured collateral SMER Non-defaulted Unsecured SMER Non-defaulted Retail - Other SME Exposures without Unsecured 060 F Construction credit protection Construction YY Y Other non Retail - SME SMER Non-defaulted financial no Unsecured Other construction SMER Non-defaulted 060 F Construction Secured Construction Exposures with YY Y Other non Retail - Secured by real credit protection SMER Non-defaulted financial no estate SME ; Retail - Secured Other construction Other SME SMER Defaulted SMER Non-Defaulted 64
65 Annex 5: Cross-sectional (distribution analysis) approach For the extreme values (Article 3(a)) of the technical standards, the analysis should at least focus on: - Very low RWs for the defaulted assets o e.g. Portfolio name CORP defaulted and total exposure versus RWA for each bank. For the descriptive analyses, and for each regulatory approach (i.e. IRB, FIRB and AIRB), the following statistics should be calculated: - Mean, median, quartile 1 and quartile 3 for each exposure class and portfolio ID: PD, LGD, CCF and maturity (in days). - Standard deviation for each exposure class and portfolio ID: PD and RW, LGD and CCF. This aims to understand the difference between PD and RW compared with peers, or the difference between LGD and CCF. The majority of portfolio IDs present the data at the level of the country (of the counterparty) per bank. The following portfolio IDs and the descriptive for each variable (in addition to the variables already available from the templates, the ratio between RWA and EAD is also computed and presented) could be presented for each EU country of the bank as follows: Cross-sectional approach Distribution Analysis 050- Default status 050- Default status PD LGD ( ) RWA /EAD 020-Portfolio name 150-Indexed 090-NACE code Loan to value range 120-Collateral type Defaulted Macro Exposure 080- (non present in 040-Exposure class Collateralisatio the annex) n status Nondefaulted ( ) 170 /110 EAD Banks Simple St Weighted N Average Dev Average 25th 75th Min Percen Median Percen Max Banks ( ) N tile tile ( ) CORP Non-defaulted Non Real estate funded collateral Exposures with credit protection Secured Other eligible collateral: Real estate CORP Non-defaulted 060 F Construction Secured Construction YY Y Other non CORP Non-defaulted financial no Secured Other construction Corporates - Other CORP Non-defaulted Unsecured CORP Non-defaulted Exposures without Unsecured 060 F Construction credit protection Construction YY Y Other non CORP Non-defaulted financial no Unsecured Other construction CORP Defaulted Corporates CORP Non-Defaulted Non Real estate funded SMEC Non-defaulted collateral Exposures with credit protection Secured Other eligible collateral: Real estate SMEC Non-defaulted 060 F Construction Secured Construction YY Y Other non SMEC Non-defaulted financial no Secured Other construction Corporates - SME SMEC Non-defaulted Unsecured SMEC Non-defaulted Exposures without Unsecured 060 F Construction credit protection Construction YY Y Other non SMEC Non-defaulted financial no Unsecured Other construction SMEC Defaulted SMEC Non-Defaulted Retail - Mortages Retail - Secured by real estate non-sme Mortgages Nondefaulted funded CRM Mortgages Nondefaulted Unfunded CRM Mortgages Nondefaulted ILTV <=25% Mortgages Nondefaulted ILTV >100%,<=125% Mortgages Nondefaulted ILTV >125% Mortgages Nondefaulted ILTV >25%,<=50% Mortgages Nondefaulted ILTV >50%,<=75% Mortgages Nondefaulted ILTV >75%,<=100% Real estate collateral, other funded CRM and/or personal guarantees Real estate collateral and other unfunded CRM <=25% >100% <= 125% >125% >25% <=50% >50% <=75% >75% <=100% Retail - SME Retail - Secured by real Exposures with estate SME credit protection Exposures with credit protection Retail - Other SME Exposures without credit protection Exposures with Retail - Secured by real credit protection estate SME ; Retail - Other SME Mortgages Defaulted Mortgages Nondefaulted SMER Non-defaulted Other eligible Secured collateral: Real estate SMER Non-defaulted Non Real estate funded Secured collateral SMER Non-defaulted Unsecured SMER Non-defaulted Unsecured 060 F Construction Construction YY Y Other non SMER Non-defaulted financial no Unsecured Other construction SMER Non-defaulted 060 F Construction Secured Construction YY Y Other non SMER Non-defaulted financial no Secured Other construction SMER Defaulted SMER Non-Defaulted 65


66 The same analysis can be developed for each regulatory approach (FIRB, AIRB and IRB). For the FIRB approach, the variables to consider are the following: PD, default rate for the latest year and default rate for the past 5 years. It is also possible to develop descriptives of the model ID; however, clear mapping with portfolio IDs and variables (e.g. EAD per model for portfolio IDs) is necessary to provide suitable analysis (Annex IV, Template C ). 66
67 Annex 6: Additional charts on RW and risk parameter deviations Figure 51: RW range, for the SME corporate portfolio, for IRB (FIRB and AIRB) non-defaulted exposures, by EU country of the bank Figure 52: PD range, for the SME corporate portfolio, for IRB (FIRB and AIRB) non-defaulted exposures, by EU country of the bank 67
68 Figure 53: Comparison of the LGD and the loss rate (latest year and past 5 years), for the SME corporate portfolio, for IRB (FIRB and AIRB) non-defaulted exposures, by EU country of the bank 60 Figure 54: RW range, for the corporate-other portfolio, for IRB (FIRB and AIRB) non-defaulted exposures, by EU country of the bank 60 The extreme outlier for C 06 is due to data quality issues when reporting the figures. 68
207 382 1776 Fax: +44 (0)207 382 1771 E-mail: info@eba.europa.eu http://www.")
69 EUROPEAN BANKING AUTHORITY Floor 46 One Canada Square, London E14 5AA Tel. +44 (0) Fax: +44 (0)
EBA REPORT RESULTS FROM THE 2017 LOW DEFAULT PORTFOLIOS (LDP) EXERCISE. 14 November 2017
 EXERCISE. 14 November 2017") EBA REPORT RESULTS FROM THE 2017 LOW DEFAULT PORTFOLIOS (LDP) EXERCISE 14 November 2017 Contents EBA report 1 List of figures 3 Abbreviations 5 1. Executive summary 7 2. Introduction and legal background
EBA REPORT RESULTS FROM THE 2017 LOW DEFAULT PORTFOLIOS (LDP) EXERCISE 14 November 2017 Contents EBA report 1 List of figures 3 Abbreviations 5 1. Executive summary 7 2. Introduction and legal background
Interim results update of the EBA review of the consistency of risk-weighted assets
 EBA Report 05 August 2013 Interim results update of the EBA review of the consistency of risk-weighted assets - Low default portfolio analysis External report Interim results update (LDP) Table of contents
Interim results of the EBA review of the consistency of risk-weighted assets. Top-down assessment of the banking book.
 Interim results of the EBA review of the consistency of risk-weighted assets. Top-down assessment of the banking book 26 February 2013 Interim results of the EBA review of the consistency of risk-weighted
Santander UK plc Additional Capital and Risk Management Disclosures
 Santander UK plc Additional Capital and Risk Management Disclosures 1 Introduction Santander UK plc s Additional Capital and Risk Management Disclosures for the year ended should be read in conjunction
Guidelines on PD estimation, LGD estimation and the treatment of defaulted exposures
 EBA/GL/2017/16 23/04/2018 Guidelines on PD estimation, LGD estimation and the treatment of defaulted exposures 1 Compliance and reporting obligations Status of these guidelines 1. This document contains
Instructions for the EBA qualitative survey on IRB models
 16 December 2016 Instructions for the EBA qualitative survey on IRB models 1 Table of contents Contents 1. Introduction 3 2. General information 4 2.1 Scope 4 2.2 How to choose the models for which to
Comparative analysis of the Regulatory Capital calculation across major European jurisdictions. April 2013
 Comparative analysis of the Regulatory Capital calculation across major European jurisdictions April 2013 CONFIDENTIALITY Our clients industries are extremely competitive, and the maintenance of confidentiality
EBA Report on IRB modelling practices
 20 November 2017 EBA Report on IRB modelling practices Impact assessment for the GLs on PD, LGD and the treatment of defaulted exposures based on the IRB survey results 1 Contents List of figures 4 List
ANNEX II SUPERVISORY BENCHMARKING PORTFOLIOS
 EN ANNEX II SUPERVISORY BENCHMARKING PORTFOLIOS DEFINITION OF THE SUPERVISORY BENCHMARKING PORTFOLIOS... 2 C 101 DEFINITION OF LOW DEFAULT PORTFOLIO COUNTERPARTIES... 2 C 102 DEFINITION OF LOW DEFAULT
Guidelines. on PD estimation, LGD estimation and the treatment of defaulted exposures EBA/GL/2017/16 20/11/2017
 EBA/GL/2017/16 20/11/2017 Guidelines on PD estimation, LGD estimation and the treatment of defaulted exposures 1 Contents 1. Executive summary 3 2. Background and rationale 5 3. Guidelines on PD estimation,
BCBS Developments in Credit Risk Regulation
 BCBS Developments in Credit Risk Regulation Hanne Meihuizen Quantitative Risk Management Expert Supervision Policy Department De Nederlandsche Bank (DNB) June 2015 The views expressed in the following
Benchmarking exercises. Webinar 12 May 2016
 Benchmarking exercises Webinar 12 May 2016 Benchmarking exercises - process ITS on benchmarking portfolios and reporting 1. EBA defines benchmarking portfolios and reporting obligation 2. Banks calculate
Guidelines on PD estimation, LGD estimation and the treatment of defaulted exposures
 Guidelines on PD estimation, LGD estimation and the treatment of defaulted exposures European Banking Authority (EBA) www.managementsolutions.com Research and Development December Página 2017 1 List of
Disclosure Report as at 30 June. in accordance with the Capital Requirements Regulation (CRR)
") Disclosure Report as at 30 June 2018 in accordance with the Capital Requirements Regulation (CRR) Contents 3 Introduction 4 Equity capital, capital requirement and RWA 4 Capital structure 8 Connection
Disclosure Report as at 30 June 2018 in accordance with the Capital Requirements Regulation (CRR) Contents 3 Introduction 4 Equity capital, capital requirement and RWA 4 Capital structure 8 Connection
Basel Committee on Banking Supervision
 Basel Committee on Banking Supervision Basel III Monitoring Report December 2017 Results of the cumulative quantitative impact study Queries regarding this document should be addressed to the Secretariat
Consultation Paper. On Guidelines for the estimation of LGD appropriate for an economic downturn ( Downturn LGD estimation ) EBA/CP/2018/08
 EBA/CP/2018/08") EBA/CP/2018/08 22 May 2018 Consultation Paper On Guidelines for the estimation of LGD appropriate for an economic downturn ( Downturn LGD estimation ) Contents 1. Responding to this consultation 3 2. Executive
EBA/CP/2018/08 22 May 2018 Consultation Paper On Guidelines for the estimation of LGD appropriate for an economic downturn ( Downturn LGD estimation ) Contents 1. Responding to this consultation 3 2. Executive
24 June Dear Sir/Madam
 24 June 2016 Secretariat of the Basel Committee on Banking Supervision Bank for International Settlements CH-4002 Basel, Switzerland baselcommittee@bis.org Doc Ref: #183060v2 Your ref: Direct : +27 11
TSB Banking Group plc. Significant Subsidiary Disclosures 31 December TSB Banking Group plc
 Significant Subsidiary Disclosures 31 December 2017 Contents INDEX OF TABLES... 3 1. INTRODUCTION... 4 2. EXECUTIVE SUMMARY... 4 3. OWN FUNDS... 6 3.1 CAPITAL RISK... 6 3.2 TSB GROUP S OWN FUNDS... 7 3.3
Basel Committee on Banking Supervision. High-level summary of Basel III reforms
 Basel Committee on Banking Supervision High-level summary of Basel III reforms December 2017 This publication is available on the BIS website (www.bis.org). Bank for International Settlements 2017. All
ANNEX II REPORTING ON LEVERAGE RATIO
 ANNEX II REPORTING ON LEVERAGE RATIO 1. This Annex contains additional instructions for the tables (hereinafter LR ) included in Annex I of this Regulation. 2. Table of Contents PART I: GENERAL INSTRUCTIONS...
Basel III Information
 Capital Ratio Information (Consolidated) Sumitomo Mitsui Financial Group, Inc. and Subsidiaries The consolidated capital ratio is calculated using the method stipulated in Standards for Bank Holding Company
EBA REPORT ON RESULTS FROM THE SECOND EBA IMPACT ASSESSMENT OF IFRS July 2017
 EBA REPORT ON RESULTS FROM THE SECOND EBA IMPACT ASSESSMENT OF IFRS 9 13 July 2017 Contents Executive summary 3 Content of the report 3 1. Main observations of the impact assessment exercise 4 1.1 Qualitative
EBA/CP/2018/ May Consultation Paper
 EBA/CP/2018/07 22 May 2018 Consultation Paper Draft Regulatory Technical Standards on the specification of the nature, severity and duration of an economic downturn in accordance with Articles 181(3)(a)
Consultative Document on reducing variation in credit risk-weighted assets constraints on the use of internal model approaches
 Management Solutions 2016. All Rights Reserved Consultative Document on reducing variation in credit risk-weighted assets constraints on the use of internal model approaches Basel Committee on Banking
Finalising Basel II: The Way from the Third Consultative Document to Basel II Implementation
 Finalising Basel II: The Way from the Third Consultative Document to Basel II Implementation Katja Pluto, Deutsche Bundesbank Mannheim, 11 July 2003 Content Overview Quantitative Impact Studies The Procyclicality
EBF comments 1 on the supervisory benchmarking concept established in article 78 of the Capital Requirements Directive (CRD IV)
") EBF ref. 006433/006409 Brussels, 30 January 2014 Launched in 1960, the European Banking Federation is the voice of the European banking sector from the European Union and European Free Trade Association
EBF ref. 006433/006409 Brussels, 30 January 2014 Launched in 1960, the European Banking Federation is the voice of the European banking sector from the European Union and European Free Trade Association
Comments on the Basel Committee on Banking Supervision s Consultative Document Revisions to the Standardised Approach for credit risk
 March 27, 2015 Comments on the Basel Committee on Banking Supervision s Consultative Document Revisions to the Standardised Approach for credit risk Japanese Bankers Association We, the Japanese Bankers
Goldman Sachs Group UK Limited. Pillar 3 Disclosures
 Goldman Sachs Group UK Limited Pillar 3 Disclosures For the year ended December 31, 2016 TABLE OF CONTENTS Page No. Introduction... 3 Capital Framework... 6 Regulatory Capital... 7 Risk Management... 8
Attachment no. 1. Disclosure requirements according to Part Eight of Regulation (EU) No 575/2013 (the CRR) - Quantitative disclosures
 No 575/2013 (the CRR) - Quantitative disclosures") Attachment no. 1 Disclosure requirements according to Part Eight of Regulation (EU) No 575/2013 (the CRR) - Quantitative disclosures Template 01: EU LI1 - Differences between accounting and regulatory
Attachment no. 1 Disclosure requirements according to Part Eight of Regulation (EU) No 575/2013 (the CRR) - Quantitative disclosures Template 01: EU LI1 - Differences between accounting and regulatory
26 June 2014 EBA/CP/2014/10. Consultation Paper
 26 June 2014 EBA/CP/2014/10 Consultation Paper Draft regulatory technical standards on the sequential implementation of the IRB Approach and permanent partial use under the Standardised Approach under
ANNEX TO THE EBA OPINION EBA-OP
 ANNEX TO THE EBA OPINION EBA-OP-2017-17 REPORT ON THE USE OF THE 180 DAYS PAST DUE CRITERION 22 DECEMBER 2017 Contents List of figures 3 1. Executive summary 6 2. Introduction 8 3. Summary of practices
Superseded document. Basel Committee on Banking Supervision. Consultative Document. The New Basel Capital Accord. Issued for comment by 31 July 2003
 Basel Committee on Banking Supervision Consultative Document The New Basel Capital Accord Issued for comment by 31 July 2003 April 2003 Table of Contents Part 1: Scope of Application... 1 A. Introduction...
Consultation Paper CP12/14. CRD IV: updates for credit risk mitigation, credit risk, governance and market risk
 Consultation Paper CP12/14 CRD IV: updates for credit risk mitigation, credit risk, governance and market risk June 2014 Prudential Regulation Authority 20 Moorgate London EC2R 6DA Prudential Regulation
Isabelle Vaillant Director of Regulation. European Institute of Financial Regulation (EIFR) 23 Septembre 2016
 23 Septembre 2016") Isabelle Vaillant Director of Regulation European Institute of Financial Regulation (EIFR) 23 Septembre 2016 Overview of the presentation 1 EBA mission and scope of action 2 EBA Single Rulebook 3 Regulatory
Isabelle Vaillant Director of Regulation European Institute of Financial Regulation (EIFR) 23 Septembre 2016 Overview of the presentation 1 EBA mission and scope of action 2 EBA Single Rulebook 3 Regulatory
Methodological note EU wide Stress Test 2014
 29 April 2014 Methodological note EU wide Stress Test 2014 Version 2.0 Contents List of Boxes 4 List of Figures 4 List of Tables 4 Abbreviations 5 1. Introduction 7 1.1 Background 7 1.2 Objectives of this
BCBS Discussion Paper: Regulatory treatment of accounting provisions
 12 January 2017 EBF_024875 BCBS Discussion Paper: Regulatory treatment of accounting provisions Key points: The regulatory framework must ensure that the same potential losses are not covered both by capital
CP ON DRAFT RTS ON ASSSESSMENT METHODOLOGY FOR IRB APPROACH EBA/CP/2014/ November Consultation Paper
 EBA/CP/2014/36 12 November 2014 Consultation Paper Draft Regulatory Technical Standards On the specification of the assessment methodology for competent authorities regarding compliance of an institution
BERMUDA MONETARY AUTHORITY GUIDELINES ON STRESS TESTING FOR THE BERMUDA BANKING SECTOR
 GUIDELINES ON STRESS TESTING FOR THE BERMUDA BANKING SECTOR TABLE OF CONTENTS 1. EXECUTIVE SUMMARY...2 2. GUIDANCE ON STRESS TESTING AND SCENARIO ANALYSIS...3 3. RISK APPETITE...6 4. MANAGEMENT ACTION...6
EBA REPORT FIRST OBSERVATIONS ON THE IMPACT AND IMPLEMENTATION OF IFRS 9 BY EU INSTITUTIONS. 20 December 2018
 EBA REPORT FIRST OBSERVATIONS ON THE IMPACT AND IMPLEMENTATION OF IFRS 9 BY EU INSTITUTIONS 20 December 2018 Contents List of figures and tables 2 Executive summary 4 Content of the report 4 Main observations
Goldman Sachs Group UK Limited. Pillar 3 Disclosures
 Goldman Sachs Group UK Limited Pillar 3 Disclosures For the year ended December 31, 2014 TABLE OF CONTENTS Page No. Introduction... 2 Regulatory Capital... 6 Risk-Weighted Assets... 8 Credit Risk... 8
GUIDELINES ON SIGNIFICANT RISK TRANSFER FOR SECURITISATION EBA/GL/2014/05. 7 July Guidelines
 EBA/GL/2014/05 7 July 2014 Guidelines on Significant Credit Risk Transfer relating to Articles 243 and Article 244 of Regulation 575/2013 Contents 1. Executive Summary 3 Scope and content of the Guidelines
Pillar 3 and regulatory disclosures Credit Suisse Group AG 2Q17
 Pillar 3 and regulatory disclosures Credit Suisse Group AG 2Q17 For purposes of this report, unless the context otherwise requires, the terms Credit Suisse, the Group, we, us and our mean Credit Suisse
Capital and Risk Management Report Second quarter 2018
 Capital and Risk Management Report Second quarter 2018 Provided by Nordea Bank AB on the basis of its consolidated situation Table name EU OV1: Overview of 1 EU CR1-A: Credit quality of s by class and
EBA /RTS/2018/04 16 November Final Draft Regulatory Technical Standards
 EBA /RTS/2018/04 16 November 2018 Final Draft Regulatory Technical Standards on the specification of the nature, severity and duration of an economic downturn in accordance with Articles 181(3)(a) and
Capital and Risk Management Report 2017
 Capital and Risk Management Report 2017 Appendix E Nordea Finans Norge AS Capital and Risk Management Report 2017 Appendix E - Nordea Finans Norge AS 1 Contents Table/Figure Table name Page E1 Mapping
Contents. Supplementary Notes on the Financial Statements (unaudited)
") The Hongkong and Shanghai Banking Corporation Limited Supplementary Notes on the Financial Statements 2015 Contents Supplementary Notes on the Financial Statements (unaudited) Page Introduction... 2 1
The Hongkong and Shanghai Banking Corporation Limited Supplementary Notes on the Financial Statements 2015 Contents Supplementary Notes on the Financial Statements (unaudited) Page Introduction... 2 1
IRB framework, Regulatory requirements and expectations
 IRB framework, Regulatory requirements and expectations CAFRAL - July 2013 Anirban Basu Reserve Bank of India Disclaimer: Opinions expressed here are of my own and does not necessarily reflect the opinion
EBA Draft Implementing Technical Standards
 EBA/CP/2014/07 28 May 2014 Consultation Paper EBA Draft Regulatory Technical Standards on benchmarking portfolio assessment standards and assessment sharing procedures under Article 78 of Directive 2013/36/EU
CONSULTATION PAPER ON ITS AMENDING THE BENCHMARKING REGULATION EBA/CP/2017/ December Consultation Paper
 EBA/CP/2017/23 18 December 2017 Consultation Paper Draft Implementing Technical Standards amending Commission Implementing Regulation (EU) 2016/2070 with regard to benchmarking of internal models Contents
Capital and Risk Management Report 2017
 Capital and Risk Management Report 2017 Appendix B Nordea Kredit Realkreditaktieselskab Capital and Risk Management Report 2017 Appendix B - Nordea Kredit Realkreditaktieselskab 1 Contents Table/Figure
African Bank Holdings Limited and African Bank Limited. Annual Public Pillar III Disclosures
 African Bank Holdings Limited and African Bank Limited Annual Public Pillar III Disclosures in terms of the Banks Act, Regulation 43 as at 30 September 2016 1 African Bank Holdings Limited and African
UNITED STATES SECURITIES AND EXCHANGE COMMISSION Washington, D.C FORM 6-K REPORT OF FOREIGN PRIVATE ISSUER
 UNITED STATES SECURITIES AND EXCHANGE COMMISSION Washington, D.C. 20549 FORM 6-K REPORT OF FOREIGN PRIVATE ISSUER PURSUANT TO RULE 13a-16 OR 15d-16 UNDER THE SECURITIES EXCHANGE ACT OF 1934 Date: August
Supplementary Notes on the Financial Statements (continued)
") The Hongkong and Shanghai Banking Corporation Limited Supplementary Notes on the Financial Statements 2014 Contents Supplementary Notes on the Financial Statements (unaudited) Page Introduction... 2 1
The Hongkong and Shanghai Banking Corporation Limited Supplementary Notes on the Financial Statements 2014 Contents Supplementary Notes on the Financial Statements (unaudited) Page Introduction... 2 1
Regulatory Disclosures 30 June 2017
 Regulatory Disclosures 30 June 2017 CONTENTS PAGE Key ratio - Capital ratio 1 - Leverage ratio 1 Overview of RWA 2 Credit risk for non-securitization exposures 3 Counterparty credit risk 12 Securitization
Call for advice to the EBA for the purposes of revising the own fund requirements for credit, operational, market and credit valuation adjustment risk
 Ref. Ares(2018)2374104-04/05/2018 EUROPEAN COMMISSION Directorate-General for Financial Stability, Financial Services and Capital Markets Union Call for advice to the EBA for the purposes of revising the
Consultation Paper. Draft Guidelines On Significant Credit Risk Transfer relating to Article 243 and Article 244 of Regulation 575/2013
 EBA/CP/2013/45 17.12.2013 Consultation Paper Draft Guidelines On Significant Credit Risk Transfer relating to Article 243 and Article 244 of Regulation 575/2013 Consultation Paper on Draft Guidelines on
Standard Chartered Bank Malaysia Berhad and its subsidiaries Pillar 3 Disclosures 31 December 2017
 31 December 2017 Incorporated in Malaysia with registered Company No. 115793P Level 16, Menara Standard Chartered No. 30, Jalan Sultan Ismail 50250 Kuala Lumpur 1. Overview This document describe the Standard
EBA REPORT RESULTS FROM THE 2016 MARKET RISK BENCHMARKING EXERCISE. 03 March 2017
 EBA REPORT RESULTS FROM THE 2016 MARKET RISK BENCHMARKING EXERCISE 03 March 2017 1 Contents List of figures and tables Abbreviations 1. Executive summary 6 2. Introduction and legal background 11 3. Main
Capital and Risk Management Report 2017
 Capital and Risk Management Report 2017 Appendix C Nordea Mortgage Bank Plc Capital and Risk Management Report Appendix C - Nordea Mortgage Bank Plc 1 Contents Table/Figure Table name Page C1 Mapping of
Basel II: Application requirements for New Zealand banks seeking accreditation to implement the Basel II internal models approaches from January 2008
 Basel II: Application requirements for New Zealand banks seeking accreditation to implement the Basel II internal models approaches from January 2008 Reserve Bank of New Zealand March 2006 2 OVERVIEW A
TSB Banking Group plc. Significant Subsidiary Disclosures. 31 December 2015
 Significant Subsidiary Disclosures 31 December Pillar 3 Disclosures Contents CONTENTS... 2 INDEX OF TABLES... 3 1. INTRODUCTION... 4 2. EXECUTIVE SUMMARY... 4 3. OWN FUNDS... 5 3.1. CAPITAL RISK... 5 3.2.
TSB Banking Group plc. Significant Subsidiary Disclosures 31 December 2016
 Significant Subsidiary Disclosures 31 December Contents CONTENTS... 2 INDEX OF TABLES... 3 1. INTRODUCTION... 4 2. EXECUTIVE SUMMARY... 4 3. OWN FUNDS... 6 3.1. CAPITAL RISK... 6 3.2. TSB GROUP S OWN FUNDS...
Regulatory treatment of accounting provisions
 BBA response to the Basel Committee s proposal for the Regulatory treatment of accounting provisions January 2017 Introduction The British Banker s Association (BBA) is pleased to respond to the Basel
EBA consultation paper on draft ITS on supervisory reporting requirements for institutions
 1 (18) To the European Banking Authority Reference: ITS (CP50) EBA consultation paper on draft ITS on supervisory reporting requirements for institutions The EBA has published a consultation paper on draft
Capital and Risk Management Report 2017
 Capital and Risk Management Report 2017 Appendix A Nordea Hypotek AB Capital and Risk Management Report 2017 Appendix A - Nordea Hypotek AB 1 Contents Table/Figure Table name Page A1 Mapping of own funds
Goldman Sachs Group UK (GSGUK) Pillar 3 Disclosures
 Pillar 3 Disclosures") Goldman Sachs Group UK (GSGUK) Pillar 3 Disclosures For the year ended December 31, 2013 TABLE OF CONTENTS Page No. Introduction... 3 Regulatory Capital... 6 Risk-Weighted Assets... 7 Credit Risk... 7
Goldman Sachs Group UK (GSGUK) Pillar 3 Disclosures For the year ended December 31, 2013 TABLE OF CONTENTS Page No. Introduction... 3 Regulatory Capital... 6 Risk-Weighted Assets... 7 Credit Risk... 7
Banco Comercial Português, SA Capital Update - EU Wide Stress Test Results.
 Banco Comercial Português, SA Capital Update - EU Wide Stress Test Results. Banco Comercial Português was subject to the 2011 EU-wide stress test conducted by the European Banking Authority (EBA), in cooperation
BASEL II PILLAR 3 DISCLOSURE
 2012 BASEL II PILLAR 3 DISCLOSURE HALF YEAR ENDED 31 MARCH 2012 APS 330: CAPITAL ADEQUACY & RISK MANAGEMENT IN ANZ Important notice This document has been prepared by Australia and New Zealand Banking
UNAUDITED SUPPLEMENTARY FINANCIAL INFORMATION
 1. Capital charge for credit, market and operational risks The bases of regulatory capital calculation for credit risk, market risk and operational risk are described in Note 4.5 to the Financial Statements
CONSULTATION DOCUMENT EXPLORATORY CONSULTATION ON THE FINALISATION OF BASEL III
 EUROPEAN COMMISSION Directorate-General for Financial Stability, Financial Services and Capital Markets Union REGULATION AND PRUDENTIAL SUPERVISION OF FINANCIAL INSTITUTIONS Bank regulation and supervision
Opinion of the European Banking Authority on measures in accordance
 EBA/Op/2017/10 01 August 2017 Opinion of the European Banking Authority on measures in accordance with Article 458 Regulation (EU) No 575/2013 Introduction and legal basis 1. On 27 June 2017, the EBA received
4.1. DEFINITIONS AND POLICIES FOR ASSESSMENT OF LOSSES AND PROVISIONING
 4. CREDIT RISK 4.1. DEFINITIONS AND POLICIES FOR ASSESSMENT OF LOSSES AND PROVISIONING Credit risk is associated with the potential losses and with the uncertainty concerning the expected returns due to
Public Finance Limited
 Public Finance Limited Pillar 3 Regulatory Disclosures For the period ended (Solo Basis and Unaudited) Table of contents Template OV1: Overview of RWA... 1 Template CR1: Credit quality of exposures...
Basel II Pillar 3 Disclosures Year ended 31 December 2009
 DBS Group Holdings Ltd and its subsidiaries (the Group) have adopted Basel II as set out in the revised Monetary Authority of Singapore Notice to Banks No. 637 (Notice on Risk Based Capital Adequacy Requirements
Disclosure Report. Investec Limited Basel Pillar III semi-annual disclosure report
 Disclosure Report 2017 Investec Basel Pillar III semi-annual disclosure report Cross reference tools 1 2 Page references Refers readers to information elsewhere in this report Website Indicates that additional
Consultation Paper CP/EBA/2017/ March 2017
 CP/EBA/2017/02 01 March 2017 Consultation Paper Draft Regulatory Technical Standards on the specification of the nature, severity and duration of an economic downturn in accordance with Articles 181(3)(a)
Basel III - Pillar 3. Semiannual Disclosures
 138943.4 Basel III - Pillar 3 Semiannual Disclosures As at 30th June 2017 Table of Contents Item Part 2 Overview of risk management and RWA Tables and templates* Template ref. # Page No. OV1 Overview of
BASEL III MONITORING EXERCISE RESULTS BASED ON DATA AS OF 30 June 2018
 BASEL III MONITORING EXERCISE RESULTS BASED ON DATA AS OF 30 June 2018 March 2019 1 Contents Contents 2 List of figures 3 List of tables 4 Abbreviations 5 Executive summary 6 1. Introduction 9 1.1 Data
Internal Rating Based (IRB) Approach Regulatory Expectations and Challenges. B. Mahapatra Reserve Bank of India July 11, 2013
 Approach Regulatory Expectations and Challenges. B. Mahapatra Reserve Bank of India July 11, 2013") Internal Rating Based (IRB) Approach Regulatory Expectations and Challenges B. Mahapatra Reserve Bank of India July 11, 2013 Contents Introduction Concepts Variation in Credit RWAs Recent Study Regulatory
Internal Rating Based (IRB) Approach Regulatory Expectations and Challenges B. Mahapatra Reserve Bank of India July 11, 2013 Contents Introduction Concepts Variation in Credit RWAs Recent Study Regulatory
Regulatory Disclosures 30 June 2017
 Regulatory Disclosures 30 June 2017 CONTENTS PAGE 1. Key ratio 1 2. Overview of 2 3. Credit risk for non-securitization exposures 3 4. Counterparty credit risk 15 5. Securitization exposures 20 6. Market
Direction. On a solo basis: Abbey National plc (the "principal firm(s)") Abbey National Treasury Services plc ("ANTS")
) Abbey National Treasury Services plc (ANTS)") Direction To: On a solo basis: Abbey National plc (the "principal firm(s)") Abbey National Treasury Services plc ("ANTS") On a consolidated basis: Abbey National plc Cater Allen Ltd Abbey Stockbrokers
Direction To: On a solo basis: Abbey National plc (the "principal firm(s)") Abbey National Treasury Services plc ("ANTS") On a consolidated basis: Abbey National plc Cater Allen Ltd Abbey Stockbrokers
EBA REPORT ON THE CREDIT RISK MITIGATION (CRM) FRAMEWORK
 FRAMEWORK") EBA REPORT ON THE CREDIT RISK MITIGATION (CRM) FRAMEWORK 19 March 2018 1 Contents Contents 2 Abbreviations 3 Executive summary 5 1. Introduction 7 2. Overview of the CRM framework 9 3. Usage of the CRM
EBA REPORT ON THE CREDIT RISK MITIGATION (CRM) FRAMEWORK 19 March 2018 1 Contents Contents 2 Abbreviations 3 Executive summary 5 1. Introduction 7 2. Overview of the CRM framework 9 3. Usage of the CRM
Standard Chartered Bank (Hong Kong) Limited. Unaudited Supplementary Financial Information
 Limited. Unaudited Supplementary Financial Information") Standard Chartered Bank (Hong Kong) Limited Unaudited Supplementary Financial Information For the year ended 31 December 2016 Standard Chartered Bank (Hong Kong) Limited Contents Page 1 Basis of preparation...............................................................
Standard Chartered Bank (Hong Kong) Limited Unaudited Supplementary Financial Information For the year ended 31 December 2016 Standard Chartered Bank (Hong Kong) Limited Contents Page 1 Basis of preparation...............................................................
EBA FINAL draft Regulatory Technical Standards
 FINAL DRAFT RTS ON DISCLOSURE OF INFORMATION RELATED TO THE COUNTERCYCLICAL BUFFER EBA/RTS/2014/17 23 December 2014 EBA FINAL draft Regulatory Technical Standards on disclosure of information in relation
Basel Committee on Banking Supervision. Frequently asked questions on Basel III monitoring ad hoc exercise
 Basel Committee on Banking Supervision Frequently asked questions on Basel III monitoring ad hoc exercise 6 July 2016 This publication is available on the BIS website (www.bis.org/bcbs/qis/). Grey underlined
3. CAPITAL ADEQUACY 3.1. REGULATORY FRAMEWORK 3.2. OWN FUNDS AND CAPITAL ADEQUACY ON 31 DECEMBER 2017 AND 2016
 3. CAPITAL ADEQUACY 3.1. REGULATORY FRAMEWORK On 26 June 2013, the European Parliament and the Council approved the Directive 2013/36/EU and the Regulation (EU) no. 575/2013 (Capital Requirements Directive
Summary of RBNZ response to submissions on the draft capital adequacy framework (internal models based approach)(bs2b)
(bs2b)") Summary of RBNZ response to submissions on the draft capital adequacy framework (internal models based approach)(bs2b) In September 2007 the Reserve Bank of New Zealand released the draft document: Capital
Summary of RBNZ response to submissions on the draft capital adequacy framework (internal models based approach)(bs2b) In September 2007 the Reserve Bank of New Zealand released the draft document: Capital
Agenda on-site pre-application meeting INSTITUTION NAME Address (including city) DATE, start time / finish time
 DATE, start time / finish time") Agenda on-site pre-application meeting INSTITUTION NAME Address (including city) DATE, start time / finish time The ECB would like to discuss with INSTITUTION NAME the pre-application process and the main
Agenda on-site pre-application meeting INSTITUTION NAME Address (including city) DATE, start time / finish time The ECB would like to discuss with INSTITUTION NAME the pre-application process and the main
Attachment no. 1. Disclosure requirements according to Part Eight of Regulation (EU) No 575/2013 (the CRR) - Quantitative disclosures
 No 575/2013 (the CRR) - Quantitative disclosures") Attachment no. 1 Disclosure requirements according to Part Eight of Regulation (EU) No 575/213 (the CRR) - Quantitative disclosures Template 4: EU OV1 Overview of RWAs Purpose: Provide an overview of total
Attachment no. 1 Disclosure requirements according to Part Eight of Regulation (EU) No 575/213 (the CRR) - Quantitative disclosures Template 4: EU OV1 Overview of RWAs Purpose: Provide an overview of total
Supplementary Notes on the Financial Statements (continued)
") The Hongkong and Shanghai Banking Corporation Limited Supplementary Notes on the Financial Statements 2013 Contents Supplementary Notes on the Financial Statements (unaudited) Page Introduction... 2 1
The Hongkong and Shanghai Banking Corporation Limited Supplementary Notes on the Financial Statements 2013 Contents Supplementary Notes on the Financial Statements (unaudited) Page Introduction... 2 1
EBA REPORT RESULTS FROM THE 2017 MARKET RISK BENCHMARKING EXERCISE. 14 November 2017
 EBA REPORT RESULTS FROM THE 2017 MARKET RISK BENCHMARKING EXERCISE 14 November 2017 Contents List of figures and tables Abbreviations 1. Executive summary 6 2. Introduction and legal background 11 3. Main
Results of the 2011 EBA EU-wide stress test: Summary (1-3)
") Results of the 2011 EBA EU-wide stress test: Summary (1-3) Name of the bank: Deutsche Bank AG Actual results at 31 December 2010 million EUR, % Operating profit before impairments 6.620 Impairment losses
Results of the 2011 EBA EU-wide stress test: Summary (1-3) Name of the bank: Deutsche Bank AG Actual results at 31 December 2010 million EUR, % Operating profit before impairments 6.620 Impairment losses
Basel II Pillar 3 disclosures
 Basel II Pillar 3 disclosures 6M10 For purposes of this report, unless the context otherwise requires, the terms Credit Suisse, the Group, we, us and our mean Credit Suisse Group AG and its consolidated
Basel 4: The way ahead
 Basel 4: The way ahead Credit Risk - IRB approach Closing in on consistency? April 2018 kpmg.com/basel4 The way ahead 2 Contents 01 Introduction 1 / Introduction 2 2 / Impact on banks capital ratios 3
CAPITAL ADEQUACY AND RISK MANAGEMENT Pillar 3 of the Basel regulations
 CAPITAL ADEQUACY AND RISK MANAGEMENT 2017 Pillar 3 of the Basel regulations Contents List of tables 1 List of figures 2 Glossary 3 1. Introduction 5 2. The Board s statement on risk management and risk
Results of the 2011 EBA EU-wide stress test: Summary (1-3)
") Results of the 2011 EBA EU-wide stress test: Summary (1-3) Name of the bank: DekaBank Deutsche Girozentrale Actual results at 31 December 2010 million EUR, % Operating profit before impairments 858 Impairment
Results of the 2011 EBA EU-wide stress test: Summary (1-3) Name of the bank: DekaBank Deutsche Girozentrale Actual results at 31 December 2010 million EUR, % Operating profit before impairments 858 Impairment
African Bank Holdings Limited and African Bank Limited
 African Bank Holdings Limited and African Bank Limited Public Pillar III Disclosures in terms of the Banks Act, Regulation 43 CONTENTS 1. Executive summary... 3 2. Basis of compilation... 7 3. Supplementary
Fubon Bank (Hong Kong) Limited. Pillar 3 Regulatory Disclosures
 Limited. Pillar 3 Regulatory Disclosures") Fubon Bank (Hong Kong) Limited Pillar 3 Regulatory Disclosures Table of Contents Table OVA: Overview of risk management...- 2 - Template LI1: Differences between accounting and regulatory scopes of consolidation
Fubon Bank (Hong Kong) Limited Pillar 3 Regulatory Disclosures Table of Contents Table OVA: Overview of risk management...- 2 - Template LI1: Differences between accounting and regulatory scopes of consolidation
EUROBANK ERGASIAS S.A.
 FOR THE SIX MONTHS ENDED 8 Othonos Street, Athens 105 57, Greece www.eurobank.gr, Tel.: (+30) 210 333 7000 Company Registration No: 6068/06/B/86/07 1. Introduction General Information... 6 1.1 Regulatory
Basel Committee on Banking Supervision. Frequently asked questions on Basel III monitoring ad hoc exercise
 Basel Committee on Banking Supervision Frequently asked questions on Basel III monitoring ad hoc exercise 31 May 2016 This publication is available on the BIS website (www.bis.org/bcbs/qis/). Grey underlined