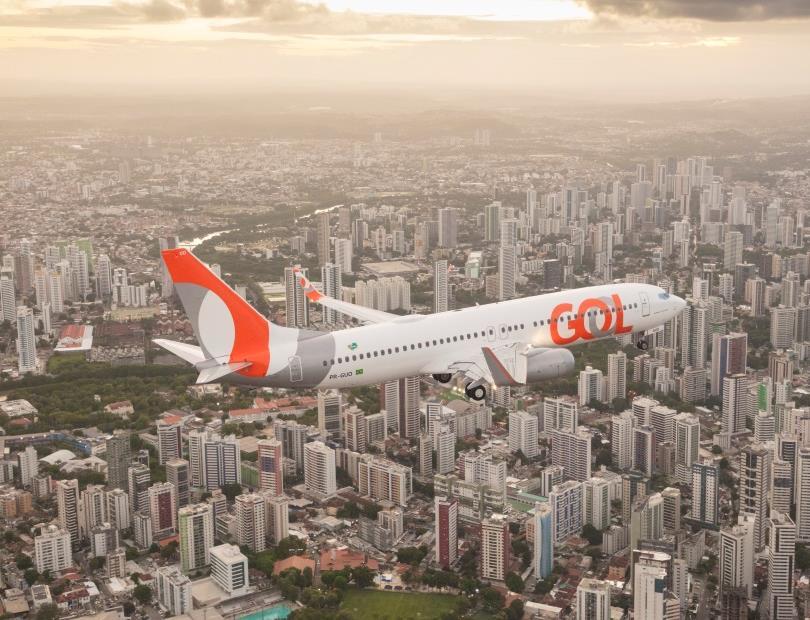
Presentation 4Q17. March 7, 2018
|
|
|
- Edith Doyle
- 5 years ago
- Views:
Transcription

1 Presentation 4Q17 March 7, 2018
2 4Q17 Highlights Indicators 4Q17 Var. x 4Q16 Operating Income (R$ MM) % Operating Margin 13.0% +5.6 p.p. ASK (BN) % Traffic (000) 8, % RPK (BN) % Load Factor 81.0% +3.4 p.p. Yield (R$ cents) % Pax Revenue (R$ MM) 2, % RASK (R$ cents) % CASK (R$ cents) % Net operating revenues: R$3.0 billion (+11.8% vs. 4Q16) Net Income: R$6 million EPS: R$0.02/share US$0.01/ADS Aircraft utilization: 12.4 block hours/day (+5.4% vs. 4Q16) Net Debt 1 /LTM EBITDA: 3.0x 1. Excludes perpetual bonds, 2
3 Capacity and Network Number of Operating Aircraft (average) % RPK (BN) +2.7% % Flights/Day +1.8% Q16 3Q17 4Q17-1.7% 11.8 ASK (BN) +1.7% % +3.5% 4Q16 3Q17 4Q17 4Q16 3Q17 4Q17 4Q16 3Q17 4Q17 3


4 Best in Class Operations & Customer Experience Most on time Departures 94.6% on-time departures % flight completion + Easy and Fast Flight Changes + GOL Online Flexible ticketing adapts flights schedule Flexible fares change flights, no additional cost Selfie Check-in Save time and check-in from wherever you are World s first app to use facial recognition Only Brazilian airline with this technology Best in Class Product Eco-leather seats (more comfort) New products / onboard service + Smiles Loyalty Program + Best Customer Experience On-board Wi-Fi & domestic premium lounges GOL+ Conforto Priority boarding/check- in Best network Leading program: +13mm members Key differentiator for customer loyalty 4
5 Outlook 2018 and Preliminary 2019 Financial Out look Guidance Act ual Guidance Preliminary (Consolidat ed, IFRS) E 2019E 1 Total fleet (average) to 124 ASKs, System (% change) +0.5% +0.8% 1% to 3% 5% to 10% - Domestic +0.5% +0.9% 0% to 3% 1% to 3% - International +0.2% +0.2% 7% to 10% 30% to 40% Seats, System (% change) -3% -3,90% 1% to 3% 3% to 5% Departures, System (% change) -5% -4,20% 1% to 3% 2% to 5% Average load factor (%) ~ 79% 79,70% 79% to 80% 79% to 81% Cargo and other revenues (R$ billion) ~ 1.4 1,4 ~ 1.6 ~ 2 Total net revenues (R$ billion) ~ ~ $11 ~ 12 Non-fuel CASK (R$ cents) ~ ~ 15 ~ 15 Fuel liters consumed (mm) ~ 1,370 1,379 ~ 1,400 ~ 1,440 Fuel price (R$ / liter) ~ ~ 2.2 ~ 2.6 Aircraft rent (R$mm) ~ ~ 950 ~ 1,000 EBITDA margin (%) ~ 14% 14.1% ~ 16% ~ 18% Operating (EBIT) margin (%) ~ 9% 9.4% ~ 11% ~ 13% Effective income tax rate (%) - N.M. ~ 0% ~ 0% Capital expenditures (R$mm) ~ ~ 600 ~ 600 Net Debt 2 / EBITDA (x) ~ 3.4x 3.0x ~ 3.0x ~ 2.5x Fully-diluted shares outstanding (million) Earnings per share fully diluted 3 (R$) 0.80 to to to 2.30 Fully-diluted ADS outstanding (million) Earnings per ADS fully diluted 3 (US$) 0.50 to to to 1.50 (1) 2019 figures do not consider IFRS 16. (2) Excluding perpetual bonds. (3) After participation of minority interest in Smiles S.A. Excluding nonrecurring expenses from financial results. Downside risks: external shocks, intensity of competitive fares and/or capacity growth 5

6 Financial Review 4Q17
7 Solid December Quarter 17.8% EBITDA margin and 13.0% operating margin, up 5.8 p.p. and 5.6 p.p., respectively, above 4Q16 margins. Sixth consecutive quarter reporting positive operating profit Increased Total Liquidity of R$1.1 billion (R$3.2 billion total in 4Q17) vs. 3Q17 December Quarter 2017 Recurring operating (EBIT) margin 13.0% (up 0.2 p.p.) Ancillary revenue (cargo and other) and change q-o-4q % of Total Rev. (up 0.3 p.p.) Passenger unit revenue (PRASK) change q-o-4q16 Up 7.6% Fuel price (change q-o-q ) Average exchange rate to US$ R$2.26 (up 16.4%) R$3.25 CASK ex-fuel (excluding non-recurring expenses) change q-o-4q16 Up 3.6% GOL System capacity (ASK) change q-o-4q16 Up 3.5% GOL System capacity (Seats) change q-o-4q16 Up 1.6% 7
8 Load Factor and Forward Bookings Var. (pp) Jan 82% 83% +1 Feb 76% 78% +2 Mar 73% 76% +3 Apr 76% 79% +3 May* 75% 77% +2 Jun 75% 78% +3 Jul 83% 82% -1 Aug 78% 78% 0 Sep 78% 80% +2 Oct 76% 81% +5 Nov 78% 81% +3 Dec 79% 81% +2 (*) New network rolled out in May Var. (pp) Jan 83% 84% +1 Feb 78% 78% 0 Mar 76% 79% +3 Apr 79% -1 May 77% 0 Jun 78% 0 8
 CASK (R$ cents) +17.")


9 Profitability (EBITDA) 4Q16 vs 4Q17 RASK (R$ cents) CASK (R$ cents) +17.1% EBITDA (R$ million) % % Q16 4Q17 Fuel CASK % CASK Ex-fuel -4.6% 12.0% 4Q16 EBITDA Margin 4Q17 4Q16 4Q17 4Q16 4Q17 9
10 Net Financial Results Financial Income (R$ MM) Net Financial Results: 4Q16 4Q17 4Q17: expense of R$423 MM 4Q16: expense of R$164 MM Financial Expense (R$ MM) Reduced cost of debt and increased average maturity of indebtedness Exchange and monetary variations 4Q16 4Q17 10
 (107) Aircraft rent Maintenance materials and repairs Net financial results (ex-fx) +59 (55) F/X Gains Minority Other interest +145 operating")
11 Net Income Composition (R$ MM) (103) 4Q16 Net Result Net margin: -3.9% Net revenues +314 Fuel costs (144) (107) Aircraft rent Maintenance materials and repairs Net financial results (ex-fx) +59 (55) F/X Gains Minority Other interest +145 operating expenses (204) (15) +116 Deferred income tax +6 4Q17 Net Result Net margin: 0.2% 4Q17 EPS: R$0.02/share US$0.01/ADS 11
12 Operating Cash Flow Generation 22% 17% 16.3% Full year Quarter 15.3% 21.1% Operating Cash Flow Margin 12% 7% 2% -3% 1.3% Q16 4Q17 in R$ million Q16 4Q17 Operating cash flow , Investing cash flow 95.6 (817.5) (234.6) (362.8) Financing cash flow 2 (1,062.8) (79.7) Net increase (decrease) in cash and cash equivalents (839.6) 1, ,068.9 Total liquidity 1 1, , , ,187.0 (1) Consolidated cash. cash equivalents and account receivables. (2) Includes foreign exchange variation on foreign subsidiaries. 12


 Debt Restructuring Decreased the blended cost of our debt to 7.9% from 8.")

 vs. 4.2x (4Q16) Total liquidity was R$3.2 billion, 66% higher than Dec.")

13 2017 Milestones Capital Structure Credit Ratings Upgrade Moody s upgraded rating by 4 notches to B2 Fitch upgraded rating by 2 notches to B S&P upgraded rating by 1 notch to B- New Capital Completed $500 million offering of senior notes due 2025 with a coupon of 7.0% (December 2017) Raised an additional $150 million on the 2025 notes (January 2018) Debt Restructuring Decreased the blended cost of our debt to 7.9% from 8.3% Eliminated near term maturities Increased average maturity of our debt from 3.9 years to 6.3 years Increased Liquidity Net debt ratio (ex-perpetual bonds) to LTM EBITDA was 3.0x (4Q17) vs. 4.2x (4Q16) Total liquidity was R$3.2 billion, 66% higher than Dec. 31, 2016 The combination of GOL s cash flow generation, credit rating upgrades, successful notes offering, tender offers/redemptions and improved cash liquidity substantially increased the Company s financial flexibility and the average maturity of its indebtedness, while decreasing its blended cost of debt. 13
14 Liquidity and Leverage Liquidity 1 (R$ MM) Total Liquidity + Deposits2 Liquidity 2 / LTM Net Revenues Interest Coverage (R$ MM) EBITDAR LTM EBITDAR LTM / Interest+Rent EBITDA LTM / Interest 27,2% 26,9% 1,922 2,759 3,482 36,3% 2,1x 1,7x 1,5x 1,2x 1,3x 1,5x Q16 3Q17 4Q17 Short Term Debt (R$ MM) Short Term Debt Liquidity / Short Term Debt 2.7x 2.3x 3.6x Q16 3Q17 4Q17 Balance Sheet Net Debt (ex-perp) Net Debt (Ex-Perp) / LTM EBITDA 4.2x 3.4x 3.0x 4,789 4,345 4,417 4Q16 3Q17 4Q17 4Q16 3Q17 4Q17 (1) Cash, equivalents short term investments, restricted cash and receivables (2) Includes maintenance /and lease deposits. 14


15 GOL s Fleet Plan (year end position) Aircraft Type Configuration Capacity: 138 pax Range: 5,570 km Type: Capacity: 177/186 pax Range: 5,440 km Type: Capacity: 186 pax Range: 6,510 km Type: MAX TOTAL
16 Public Comparables (Local Prices, in US$) Share Price Market Enterprise Adj. Enterprise TEV / EBITDA Adj. TEV / EBITDAR Price / Earnings (US$ MM, except per share data) EBITDAR Margin Expansion Company 2/27/18 Value Value Value E 2019E 2018E 2019E 2018E 2019E 2018E 2019E GOL - Factset Estimates $6.03 $2,126 $3,747 $5, x 6.3x 7.1x 6.4x NM 22.4x (0.3%) 1.0% GOL - Management Guidance $6.03 $2,126 $3,747 $5, x 5.6x 6.4x 5.9x 15.1x 9.8x 2.5% 0.9% Latin American Peers Latam $16.53 $10,056 $17,409 $21, x 7.7x 8.3x 8.0x 25.4x 18.7x 0.9% (0.3%) Copa ,843 6,074 7, % 0.1% Azul ,208 3,665 6, (1.0%) (0.8%) Avianca ,157 4,318 6, % 1.1% Volaris , NM 12.5 (0.4%) 2.3% Mean (Latam, Copa and Azul) 7.8x 6.7x 8.1x 7.4x 19.0x 14.7x 0.0% (0.3%) Mean (All Latin American Peers) % 0.5% Median % 0.1% Low (1.0%) (0.8%) High % 2.3% Memo: GOL Factset Estimates ($US) $527 $594 $808 $905 $0.10 $0.27 Source: Factset as of 2/27/2018 (1) Includes capitalized rent. Rent expense capitalized at 7.0x for consistency across companies 1
17 Peer Comparisons If GOL were to trade at industry multiples, there would be a valuation uplift of $935 - $1,527 million in market value, based on 2018 EBITDAR guidance. (US$ MM) Implied Uplift: $1,527 Implied Uplift: $935 $3,061 $3,653 $2,126 Current Market Value Implied Market Value at Mean of Latin American Peers (1) Implied Market Value at Mean of Key Latin American Peers Current Adj. TEV / 2018 EBITDAR: 6.4x Mean Adj. TEV / 2018 EBITDAR: 7.5x Source: Factset as of 2/27/2018 / (1) Mean includes Latam, Copa, Azul and Avianca. Mean Adj. TEV / 2018 EBITDAR (Only Latam, Copa and Azul): 8.1x 2

18 Q&A 4Q17
19 Disclaimer This presentation may contain certain statements that express GOL Linhas Aéreas Inteligentes S.A. ( GOL ) management s expectations. beliefs and assumptions about future events or results. Such statements are not historical fact. being based on currently available competitive. financial and economic data. and on current projections about the industries in which GOL operates. The verbs anticipate. believe. estimate. expect. forecast. plan. predict. project. target and other similar verbs are intended to identify these forward-looking statements. which involve risks and uncertainties that could cause actual results to differ materially from those projected in this presentation and do not guarantee any future GOL performance. The factors that might affect performance include. but are not limited to: (I) market acceptance of GOL services; (ii) volatility related to the Brazilian economy and financial and securities markets. and the highly competitive industries GOL operates in; (iii) changes in domestic and foreign legislation and taxation. and government policies related to the transportation markets; (iv) increasing competition from new entrants to the Brazilian markets; (v) ability to keep up with rapid changes in technological environment; (vi) ability to maintain an ongoing process for introducing competitive new products and services. while maintaining the competitiveness of existing ones; (vii) ability to attract customers in domestic and foreign jurisdictions. Other factors that could materially affect results can be found in GOL s annual report on Form 20-F as filed with the U.S. Securities and Exchange Commission. particularly under Risk Factors session. All forward-looking statements in this presentation are based on information and data available as of the date they were made. and GOL undertakes no obligation to update them in light of new information or future development. 19


20 Investor Relations
Results 1Q18. May 9, 2018
 Results 1Q18 May 9, 2018 1Q18 Highlights Indicators 1Q18 Var. x1q17 Operating Income (R$ MM) 504.3 +97.4% Operating Margin 17.0% +7.1 p.p. Net operating revenues: R$3.0 billion (+14.4% vs. 1Q17) ASK (BN)
Results 2Q18. August 2, 2018
 Results August 2, 2018 Highlights Indicators Var. x 2Q17 Operating Income (R$ MM) 42.8 +92.7% Operating Margin 1.8% +0.8 p.p. Net operating revenues: R$2.4 billion (+9.0% vs. 2Q17) ASK (BN) 10.7 +2.2%
Results 3Q17. November 8, 2017 #NOVAGOL
 Results 3Q17 November 8, 2017 #NOVAGOL 3Q17 Highlights Indicators 3Q17 Var. x 3Q16 ASK (BN) 12.0 4.5% Traffic (000) 8,303 2.2% RPK (BN) 9.6 5.1% Load Factor 80.2% +0.4 p.p. Yield (R$ cents) 24.85 +8.6%
Results 4Q18. Feb. 28, GRU (SP) SDU (RJ) Fare: US$62
 SDU (RJ) Fare: US$62") Results 4Q18 Feb. 28, 2019 GRU (SP) SDU (RJ) Fare: US$62 4Q18 Highlights Indicators 4Q18 Var. x 4Q17 ASK (BN) 12.5 +2.4% Traffic (000) 8,944 +3.4% Net operating revenues: R$3.2 billion (+10.1% vs. 4Q17)
Results 4Q18 Feb. 28, 2019 GRU (SP) SDU (RJ) Fare: US$62 4Q18 Highlights Indicators 4Q18 Var. x 4Q17 ASK (BN) 12.5 +2.4% Traffic (000) 8,944 +3.4% Net operating revenues: R$3.2 billion (+10.1% vs. 4Q17)
Results 3Q18. November 1, 2018
 Results 3Q18 November 1, 2018 3Q18 Highlights Indicators 3Q18 Var. x 3Q17 ASK (BN) 12.5 +3.7% Traffic (000) 8.677 +4.5% Net operating revenues: R$2.9 billion (+8.3% vs. 3Q17) RPK (BN) 9.9 +2.2% Load Factor
In 4Q17, Brazil s #1 airline achieved a 13% EBIT margin the highest in 6 years while growing net revenues by 12%
 In 4Q17, Brazil s #1 airline achieved a 13% EBIT margin the highest in 6 years while growing net revenues by 12% Operating income for the quarter doubled, reaching R$388 million São Paulo, March 7, 2018
2Q15 Earnings Release
 São Paulo, August 13, 2015 - (BM&FBOVESPA: GOLL4 and NYSE: GOL), (S&P: B, Fitch: B-, Moody s: B3), the largest low-cost and best-fare airline in Latin America, announces today its consolidated results
GOL records operating income of R$153.8 million and EBIT margin of 6.1% in 1Q15
 GOL records operating income of R$153.8 million and EBIT margin of 6.1% in 1Q15 São Paulo, May 12, 2015 -. (BM&FBOVESPA: GOLL4 e NYSE: GOL), (S&P: B, Fitch: B-, Moody s: B3), the largest low-cost and best-fare
Earnings Report. Third Quarter 2018
 Conference call connection details 3Q18 Earnings Calls Thursday, November 1, 2018 Live Webcast (www.voegol.com.br/ri) In English 11:00 a.m. (US EDT) 12:00 p.m. (Brasília) Phone: +1 (412) 317-5453 Code:
SECURITIES AND EXCHANGE COMMISSION Washington, D.C FORM 6 K
 6 K 1 gol20170130_6k.htm FORM 6 K SECURITIES AND EXCHANGE COMMISSION Washington, D.C. 20549 FORM 6 K REPORT OF FOREIGN ISSUER PURSUANT TO RULE 13a 16 OR 15d 16 OF THE SECURITIES EXCHANGE ACT OF 1934 For
SECURITIES AND EXCHANGE COMMISSION Washington, D.C FORM 6-K
 6-K 1 goldf4q17-6k.htm INDIVIDUAL AND CONSOLIDATED FINANCIAL STATEMENTS SECURITIES AND EXCHANGE COMMISSION Washington, D.C. 20549 FORM 6-K REPORT OF FOREIGN ISSUER PURSUANT TO RULE 13a-16 OR 15d-16 OF
First Quarter 2017 Results
 First Quarter 2017 Results 1 Disclaimer The information contained in this presentation is only a summary and does not purport to be complete. This presentation has been prepared solely for informational
3Q18 Results November 8th, 2018
 Results November 8th, 2018 1 Disclaimer The information contained in this presentation is only a summary and does not purport to be complete. This presentation has been prepared solely for informational
Individual and consolidated Interim Financial Information for the quarter ended March 31, 2018
 (Free translation into English from original previously issued in Portuguese) Individual and consolidated Interim Financial Information for the quarter ended GOL Linhas Aéreas Inteligentes S.A. with review
3Q15 Earnings Release
 São Paulo, November 11, 2015 - (BM&FBOVESPA: GOLL4 and NYSE: GOL), (S&P: B-, Fitch: B-, Moody s: B3), the largest low-cost and best-fare airline in Latin America, announces today its consolidated results
Azul Reports Third Quarter Net Income of R$204 million
 Azul Reports Third Quarter Net Income of R$204 million Operating income increased 50% year over year, yielding a margin of 12.5% Total debt decreased R$737 million in the quarter to R$2.9 billion while
SCRIPT KAKINOFF RESULTS 3Q18
 SCRIPT KAKINOFF RESULTS 3Q18 Kakinoff: Good morning, ladies and gentlemen, and welcome to GOL Airline s third quarter 2018 results presentation. I am Paulo Kakinoff, CEO and I am joined by Richard Lark,
Interim Condensed Consolidated Financial Statements. Azul S.A. For the three months ended March 31, 2017
 Interim Condensed Consolidated Financial Statements Azul S.A. For the three months ended Unaudited Interim condensed consolidated financial statements Contents Earnings release... 2 Interim consolidated
Individual and Consolidated Financial Statements. GOL Linhas Aéreas Inteligentes S.A. December 31, 2016 with Independent Auditors Report
 Individual and Consolidated Financial Statements GOL Linhas Aéreas Inteligentes S.A. December 31, 2016 with Independent Auditors Report Gol Linhas Aéreas Inteligentes S.A. Individual and consolidated financial
6-K 1 golitr2q18_6k.htm INDIVIDUAL AND CONSOLIDATED INTERIM FINANCIAL INFORMATION FOR THE QUARTER ENDED JUNE 30, 2018
 6-K 1 golitr2q18_6k.htm INDIVIDUAL AND CONSOLIDATED INTERIM FINANCIAL INFORMATION FOR THE QUARTER ENDED JUNE 30, 2018 SECURITIES AND EXCHANGE COMMISSION Washington, D.C. 20549 FORM 6-K REPORT OF FOREIGN
Individual and consolidated Interim Financial Information for the quarter ended June 30, 2018
 (Free translation into English from original previously issued in Portuguese) Individual and consolidated Interim Financial Information for the quarter ended GOL Linhas Aéreas Inteligentes S.A. with report
SAS delivers on its promise...
 SAS Group Q4 /13 1 SAS delivers on its promise... Q4 EBT MSEK 442 EBIT-margin 6.4% Full-year EBT MSEK 433 EBIT-margin 3.3% Restructuring drives improvement (FY12/13) Operating expenses down 7.1% while
GOL records operating income of R$505 million and EBIT margin of 5% in 2014, 89.8% up on the previous year
 GOL records operating income of R$505 million and EBIT margin of 5% in 2014, 89.8% up on the previous year São Paulo, March 30, 2015 -. (BM&FBOVESPA: GOLL4 e NYSE: GOL), (S&P: B, Fitch: B-, Moody s: B3),
Air Berlin PLC Berlin, 15 August 2012 Analysts and Investors conference call
 Air Berlin PLC Berlin, 15 August 2012 Analysts and Investors conference call 2012 is the transition year business transformation Transition cost incur in 2012 due to the initiatives taken 2011 Measures
Individual and consolidated Financial Statements. GOL Linhas Aéreas S.A. December 31, 2017
 Individual and consolidated Financial Statements GOL Linhas Aéreas S.A. December 31, 2017 GOL Linhas Aéreas S.A. Individual and consolidated financial statements December 31, 2017 Contents Management report...
Cebu Air, Inc. 2 nd Quarter and 1 st Half 2017 Results of Operations. cebupacificair.com
 Cebu Air, Inc. 2 nd Quarter and 1 st Half 2017 Results of Operations cebupacificair.com Disclaimer This information provided in this presentation is provided only for your reference. Such information has
Interim Condensed Consolidated Financial Statements Azul S.A. As of and for the three-months and nine-months ended September 30, 2017
 Interim Condensed Consolidated Financial Statements Azul S.A. As of and for the three-months and nine-months ended September 30, Unaudited Interim condensed consolidated financial statements Contents Earnings
Air Berlin PLC 13 th August Analyst Call 2nd Quarter 2015
 Air Berlin PLC 13 th August 2015 Analyst Call 2nd Quarter 2015 DISCLAIMER This presentation has been prepared by Air Berlin PLC. No representation, warranty or undertaking, express or implied, is made
Individual and consolidated Quarterly Information Form (ITR) for the quarter ended June 30, 2017
 for the quarter ended June 30, 2017") Individual and consolidated Quarterly Information Form (ITR) for the quarter ended GOL Linhas Aéreas Inteligentes S.A. with Report on review of the quarterly information Gol Linhas Aéreas Inteligentes
Individual and consolidated Quarterly Information Form (ITR) for the quarter ended GOL Linhas Aéreas Inteligentes S.A. with Report on review of the quarterly information Gol Linhas Aéreas Inteligentes
09/08/2017 golitr2q17_6k.htm - Generated by SEC Publisher for SEC Filing
 6-K 1 golitr2q17_6k.htm ITR 2Q17 SECURITIES AND EXCHANGE COMMISSION Washington, D.C. 20549 FORM 6-K REPORT OF FOREIGN ISSUER PURSUANT TO RULE 13a-16 OR 15d-16 OF THE SECURITIES EXCHANGE ACT OF 1934 For
Avianca Holdings S.A. 3Q 2018 Earnings Presentation 2018
 Avianca Holdings S.A. 3Q 2018 Earnings Presentation 2018 Disclaimer The present document consolidates information from Avianca Holdings S.A. and its subsidiaries, including unaudited financial figures,
Air Berlin PLC 11 th November 2015 Analyst Conference 3rd Quarter 2015
 Air Berlin PLC 11 th November 2015 Analyst Conference 3rd Quarter 2015 DISCLAIMER This presentation has been prepared by Air Berlin PLC. No representation, warranty or undertaking, express or implied,
SECURITIES AND EXCHANGE COMMISSION Washington, D.C FORM 6 K
 6 K 1 goldf1q15_6k.htm DF 1Q15 SECURITIES AND EXCHANGE COMMISSION Washington, D.C. 20549 FORM 6 K REPORT OF FOREIGN ISSUER PURSUANT TO RULE 13a 16 OR 15d 16 OF THE SECURITIES EXCHANGE ACT OF 1934 For the
FY18 $109.6m up $113.3m on FY17 GROUP UNDERLYING Delivered despite $45.0m fuel (net of FX) headwind
 headwind") FY18 GROUP OUTCOMES FY18 $109.6m up $113.3m on FY17 GROUP UNDERLYING PROFIT BEFORE TAX (PBT) 1 Highest underlying result since FY08 Delivered despite $45.0m fuel (net of FX) headwind X VA DOMESTIC RECORD
FY18 GROUP OUTCOMES FY18 $109.6m up $113.3m on FY17 GROUP UNDERLYING PROFIT BEFORE TAX (PBT) 1 Highest underlying result since FY08 Delivered despite $45.0m fuel (net of FX) headwind X VA DOMESTIC RECORD
Here Everyone Can Fly. Conference Call 2009 Results March 2010
 Here Everyone Can Fly Conference Call 2009 Results March 2010 Agenda 1 2009 Highlights 2 2010 Strategic Rationale 3 2009 Results 4 Subsequent Events 5 Q&A 1 2009 Highlights Constantino Júnior, Founder
Half Year 2016 Results Presentation. February 11, 2016
 Half Year 2016 Results Presentation February 11, 2016 Key highlights HY 16 HY 15 Change Underlying Profit Before Tax 1 $81.5m $10.2m $71.3m Statutory Profit /(Loss) After Tax 2 $62.5m ($47.8m) $110.3m
SAS Group Q1 2012/13 March 8, 2013
 SAS Group Q1 2012/13 March 8, 2013 1 Q1 Highlights Seasonally weak Q1: EBT of MSEK -823 Positive revenue development Launch of new competitive restructuring program that secured future financing New collective
Good afternoon everyone and thank you for waiting. Welcome to Gol Linhas Aéreas Inteligentes 4 th Quarter of 2012 results conference call.
 4Q12 Results March 26, 2013 Operator: Good afternoon everyone and thank you for waiting. Welcome to Gol Linhas Aéreas Inteligentes 4 th Quarter of 2012 results conference call. With us here today we have
GOOD RESULTS IN 2016 STRONG BALANCE SHEET
 GOOD RESULTS IN 2016 STRONG BALANCE SHEET Net profit in 2016 USD 89.1 million, as compared to USD 111.2 million in 2015 Q4 EBITDA USD 2.5 million, as compared to USD 22.9 million in Q4 2015 A fall in average
For personal use only
 SUMMARY OF 1H19 GROUP OUTCOMES Strong first half performance UNDERLYING PROFIT BEFORE TAX (UPBT) 1H19 $112.3m up $30.4m on 1H18 Highest 1H underlying result in 11 years Delivered despite $88.2m fuel and
Finnair Q3 result info
 Finnair Q3 result info 31 October 2014 CEO Pekka Vauramo CFO Erno Hildén 1 Difficult market environment especially in Finland prevailed The weakness of the Finnish economy was reflected in home market
Financial Year 2015 Results Presentation. August 7, 2015
 Financial Year 2015 Results Presentation August 7, 2015 Key highlights FY15 vs. FY14 1 Underlying Loss Before Tax 2 ($49m) $163m Statutory Loss After Tax ($94m) $260m Return on Invested Capital 2 6.1%
AVIANCA HOLDINGS Consumer Services Airlines
 AVIANCA HOLDINGS Consumer Services Airlines COVERAGE (NYSE:AVH) BUY / US$20.3 per ADR - (BVC:PFAVH) BUY / COP 4,850 per share Jul 7, 2014 An Ambitious Company Set to Skyrocket We are initiating Avianca
Air Berlin PLC Berlin, 15 November 2012 Analysts and Investors conference call
 Air Berlin PLC Berlin, 15 November 2012 Analysts and Investors conference call Management summary Key highlights of the third quarter 2012 Positive development of key performance indicators and Shape &
J.P. Morgan Aviation, Transportation & Industrials Conference. March 4, 2015
 J.P. Morgan Aviation, Transportation & Industrials Conference March 4, 2015 Forward-Looking Statements / Property of Aircastle Certain items in this presentation and other information we provide from time
Cebu Air, Inc. 3 rd Quarter and 9 months 2017 Results of Operations. cebupacificair.com
 Cebu Air, Inc. 3 rd Quarter and 9 months 2017 Results of Operations cebupacificair.com Disclaimer This information provided in this presentation is provided only for your reference. Such information has
HIGHLIGHTS. Normalised earnings* $96m, up $70m. Net cash position of $1.1bn. Gearing stable at 46.0% ATW Airline of the Year
 1 HIGHLIGHTS Normalised earnings* $96m, up $70m Net cash position of $1.1bn Gearing stable at 46.0% ATW Airline of the Year Unveiling of new long haul product Airpoints developments 2 * Normalised earnings
Financial & Business Highlights For the Year Ended June 30, 2017
 Financial & Business Highlights For the Year Ended June, 17 17 16 15 14 13 12 Profit and Loss Account Operating Revenue 858 590 648 415 172 174 Investment gains net 5 162 909 825 322 516 Other 262 146
DESPITE A SIGNIFICANT CAPACITY INCREASE IN THE TRANSATLANTIC MARKET: 2014 SECOND BEST SUMMER EVER TRANSAT INVESTORS PRESENTATION DECEMBER 2014
 DESPITE A SIGNIFICANT CAPACITY INCREASE IN THE TRANSATLANTIC MARKET: 2014 SECOND BEST SUMMER EVER TRANSAT INVESTORS PRESENTATION DECEMBER 2014 FORWARD-LOOKING STATEMENTS THIS PRESENTATION CONTAINS CERTAIN
Consolidated Financial Statements. Azul S.A. December 31, 2017 and 2016 with Independent Auditors Report
 Consolidated Financial Statements Azul S.A. with Independent Auditors Report Consolidated financial statements Contents Management report... 2 Declaration of the officers on the financial statements...
For personal use only
 2016 Financial Year Results Presentation August 5, 2016 Key highlights FY16 FY15 Change Underlying Profit / (Loss) Before Tax 1,2 $41.0m ($49.1m) $90.1m Statutory (loss) after tax 2 ($224.7m) ($93.8m)
Highlights Q EBITDA forecast for 2015 raised to USD million. Higher passenger revenue and lower fuel price resulting in higher EBITDA
 ICELANDAIR GROUP PRESENTATION OF Q2 2015 RESULTS 28 JULY 2015 Highlights Q2 2015 1 2 3 EBITDA USD 50.3 million improving by USD 5.0 million from 2014 Higher passenger revenue and lower fuel price resulting
A YEAR OF CHANGES. 30 April 2018 Icelandair Group Interim Report. % Change 12M USD thousands Q Q Change
 A YEAR OF CHANGES Total revenue up by 21% between years, to USD 267.6 million Income from charter operations increased by 62% between years EBITDA negative by USD 18.2 million, down by USD 8.2 million
3Q 2014 Earnings Presentation
 3Q 2014 Earnings Presentation 1 2 The present document consolidates information from Avianca Holdings SA and its subsidiaries including unaudited financial figures, operational managerial indicators, financial
ICELANDAIR GROUP HF PRESENTATION OF Q RESULTS 31 JULY 2014
 ICELANDAIR GROUP HF PRESENTATION OF Q2 2014 RESULTS 31 JULY 2014 FINANCIAL RESULTS BOGI NILS BOGASON ǀ CFO INCOME STATEMENT Q2 USD thousand Q2 2014 Q2 2013 % Chg. Operating Income 297.8 265.6 12% Salaries
Highlights Q EBITDA guidance for 2015 raised to USD million. Higher passenger revenue and lower fuel price reasons for the good results
 ICELANDAIR GROUP PRESENTATION OF Q3 2015 RESULTS 30 OCTOBER 2015 Highlights Q3 2015 1 2 3 Record EBITDA USD 150.9 million improving by USD 27.0 million from 2014 Higher passenger revenue and lower fuel
2018 Q1 results. Millicom International Cellular S.A. Kicking off 2018 with accelerating momentum
 2018 Q1 results Kicking off 2018 with accelerating momentum Mauricio Ramos, CEO Tim Pennington, CFO April 25 th, 2018 Millicom International Cellular S.A. Disclaimer This presentation may contain certain
SECURITIES AND EXCHANGE COMMISSION Washington, D.C FORM 6-K
 SECURITIES AND EXCHANGE COMMISSION Washington, D.C. 20549 FORM 6-K REPORT OF FOREIGN ISSUER PURSUANT TO RULE 13a-16 OR 15d-16 OF THE SECURITIES EXCHANGE ACT OF 1934 For the month of March, 2019 (Commission
DIFFICULT OPERATING YEAR
 DIFFICULT OPERATING YEAR Total income USD 1,511 million, up by 7% year on year in 2018 Year s EBITDA USD 76.5 million, as compared to USD 170.1 million in 2017 Year's loss after taxes USD 55.6 million,
XML Publisher Balance Sheet Vision Operations (USA) Feb-02
 Feb-02") Page:1 Apr-01 May-01 Jun-01 Jul-01 ASSETS Current Assets Cash and Short Term Investments 15,862,304 51,998,607 9,198,226 Accounts Receivable - Net of Allowance 2,560,786
Page:1 Apr-01 May-01 Jun-01 Jul-01 ASSETS Current Assets Cash and Short Term Investments 15,862,304 51,998,607 9,198,226 Accounts Receivable - Net of Allowance 2,560,786
Looking to the medium term
 Looking to the medium term Issued: 4 September 2013 Legal notice This presentation has been prepared to inform investors and prospective investors in the secondary markets about the Group and does not
Fourth Quarter 2014 Earnings Call February 19, 2015
 Fourth Quarter 2014 Earnings Call February 19, 2015 Forward-Looking Statements / Property of Aircastle Certain items in this presentation and other information we provide from time to time, may constitute
Analysts and Investors conference call Q results. 15 May 2012
 Analysts and Investors conference call Q 202 results 5 May 202 Management summary Successful start into the year 202 Shape & Size has accounted to the operational improvement with more than EUR 50 m Positive
Spheria Australian Smaller Companies Fund
 29-Jun-18 $ 2.7686 $ 2.7603 $ 2.7520 28-Jun-18 $ 2.7764 $ 2.7681 $ 2.7598 27-Jun-18 $ 2.7804 $ 2.7721 $ 2.7638 26-Jun-18 $ 2.7857 $ 2.7774 $ 2.7690 25-Jun-18 $ 2.7931 $ 2.7848 $ 2.7764 22-Jun-18 $ 2.7771
Kenya Airways Investor Briefing HY2017 Results Presentation
 Kenya Airways Investor Briefing HY2017 Results Presentation 17th November 2017 DISCLAIMER The material in this presentation has been prepared by Kenya Airways PLC ( Kenya Airways ) and is only directed
INTERIM RESULTS 2009
 AGENDA Overview & Operating Environment Performance Long Haul Airline Short Haul Airline Domestic Tasman & Pacific Islands Other businesses Strategy Financial Management Outlook 2 OVERVIEW Normalised earnings*
Q Earnings Summary August 5, 2015
 Q2 2015 Earnings Summary August 5, 2015 Trademark of Trinseo S.A. or its affiliates Introductions & Disclosure Rules Introductions Chris Pappas, President & CEO John Feenan, Executive Vice President &
FINANCIAL RESULTS AND COMPANY OVERVIEW Second-Quarter Performance
 FINANCIAL RESULTS AND COMPANY OVERVIEW 08 Second-Quarter Performance September 5 th, 08 Disclaimer Forward-Looking Statements and Preliminary Results This presentation includes forward-looking statements
For personal use only
 2018 Annual General Meeting of Helloworld Travel Limited 15 November 2018 1 Disclaimer The information contained in these materials or discussed at the presentation is not intended to be an offer for subscription,
PASSENGER REJECTION REDUCTION INITIATIVE KIRK PEREIRA. 24 th April 2018
 PASSENGER REJECTION REDUCTION INITIATIVE KIRK PEREIRA 24 th April 2018 WHAT IS THIS PROJECT ABOUT? Well we are not going into that again this year! Nearly everyone in this room knows about the project
Q Sales January 22 nd 2019
 Q4 20 Sales January 22 nd 2019 Highlights Solid sales growth in Q4 and FY 20: +1.9% LFL in Q4 and +1.4% in FY Group sales up +1.9% LFL vs +1.1% over first 9 months Food e-commerce sales up by more than
As filed with the Securities and Exchange Commission on April 30, UNITED STATES SECURITIES AND EXCHANGE COMMISSION Washington, D.C.
 20-F 1 golform_20f.htm FORM 20-F As filed with the Securities and Exchange Commission on April 30, 2018 UNITED STATES SECURITIES AND EXCHANGE COMMISSION Washington, D.C. 20549 FORM 20-F REGISTRATION STATEMENT
3Q18 Earnings November 8, 2018
 Earnings November 8, 2018 1 Disclaimer This presentation may contain statements that express BRF S.A. ( BRF ) management s expectations, beliefs and assumptions about future events or results. Such statements
Financial Position (Consolidated)
") 1 Disclaimer This presentation is for informational purposes only, contains preliminary financial and other information about Korean Air Lines Co., Ltd. and is subject to updating, revision, amendment
1 Disclaimer This presentation is for informational purposes only, contains preliminary financial and other information about Korean Air Lines Co., Ltd. and is subject to updating, revision, amendment
Setting A New Standard. Stifel Transportation & Logistics Conference February 10, 2015
 Setting A New Standard Stifel Transportation & Logistics Conference February 10, 2015 Safe Harbor This presentation contains various projections and other forward-looking statements which represent Delta
2Q15 Earnings Release
 2Q15 Earnings Release Barueri, August 4, 2015 - Smiles S.A. (BM&FBOVESPA: SMLE3), one of the largest loyalty programs in Brazil with over 10 million members, announces today its results for 2Q15. The financial
Back in Black. Erno Hildén CFO
 Back in Black Erno Hildén CFO 1 Improved business performance in Jan Sep 2012... M 250.0 Operational EBIT build-up Jan Sep 2012 200.0 150.0 20,6 11,5 11,1 11,0-1,7-18,1-19,3-21,1 22,7 100.0-96,3 50.0 147,7
Looking back on a good year
 Looking back on a good year Profit at USD 111.2 million, up by USD 44.7 million, or 67% EBITDA in 2015 at USD 219.0 million, as compared to USD 154.3 million in 2014 Operating revenue increased by 2% between
SpiceJet. Healthy operating performance in Q2. Source: Company Data; PL Research
 Healthy operating performance in Q2 November 28, 2016 Rohan Korde rohankorde@plindia.com +91 22 66322235 Rating BUY Price Rs65 Target Price Rs115 Implied Upside 76.9% Sensex 26,316 Nifty 8,114 (Prices
Foxtons Interim results presentation For the period ended 30 June 2018
 Foxtons Interim results presentation For the period ended 30 June 2018 Important information This presentation includes statements that are, or may be deemed to be, forward-looking statements. These forward-looking
Preliminary Full Year Results 2011 MTU Aero Engines Conference Call with Investors and Analysts February 23, 2012
 Preliminary Full Year Results 2011 MTU Aero Engines Conference Call with Investors and Analysts February 23, 2012 Agenda Business Highlights Financial Highlights Segment Reporting Group Key Figures Guidance
Q Results presentation
 Q1 2016 Results presentation 12 May 2016 1 Disclaimer This presentation (the "Presentation") has been prepared and is issued by, and is the sole responsibility of Telepizza Group, S.A. ( Telepizza" or
Availability, Reliability, Ease. 11 September 2018
 Availability, Reliability, Ease 11 September 2018 LEGAL NOTICE This presentation has been prepared to inform investors and prospective investors in the secondary markets about the Group and does not constitute
Delta: Setting a New Standard. UBS Industrials & Transportation Conference Paul Jacobson, EVP & CFO November 19, 2015
 Delta: Setting a New Standard UBS Industrials & Transportation Conference Paul Jacobson, EVP & CFO November 19, 2015 Safe Harbor Statements in this presentation that are not historical facts, including
Allianz Group Fiscal Year 2012
 Allianz Group Fiscal Year 2012 Michael Diekmann CEO Allianz SE Financial press conference February 21, 2013 Based on preliminary figures Overview 2012 EUR 106.4bn Total revenues EUR 9.5bn Operating profit
H Interim Results. 18 May 2017
 H1 2017 Interim Results 18 May 2017 Agenda Highlights - Peter Fankhauser CEO Financial results Strategic progress Current trading and outlook Page 2 Strategic actions leading to improved performance Growing
2Q 2014 Earnings Presentation
 2Q 2014 Earnings Presentation 1 2 The present document consolidates information from Avianca Holdings SA and its subsidiaries including unaudited financial figures, operational managerial indicators, financial
Foxtons Preliminary results presentation For the year ended December 2018
 Foxtons Preliminary results presentation For the year ended December 2018 Important information This presentation includes statements that are, or may be deemed to be, forward-looking statements. These
Second Quarter 2013 Earnings Presentation. August 2, 2013
 Second Quarter 2013 Earnings Presentation August 2, 2013 Agenda Strategic Review Financial Review Questions and Answers Edward Tilly Chief Executive Officer Alan Dean Executive Vice President, CFO and
Earnings Presentation FIRST QUARTER 2016
 Earnings Presentation FIRST QUARTER 2016 Agenda 1 Highlights of the period 2 Consolidated overview 3 Overview by Business Units 4 Overview by Country 5 Balance Sheet Financials 6 Q&A First Quarter Highlights
KOREAN AIR 1Q17 FINANCIAL RESULTS
 KOREAN AIR 1Q17 FINANCIAL RESULTS Disclaimer This presentation is for informational purposes only, contains preliminary financial and other information about Korean Air Lines Co., Ltd. and is subject to
2015 Fourth-Quarter and Fiscal Year Performance
 205 Fourth-Quarter and Fiscal Year Performance Financial Results and Company Highlights March 5, 206 Disclaimers Forward-Looking Statements This presentation includes forward-looking statements within
Preliminary Results. 22nd February 2018
 Preliminary Results 22nd February 2018 Mark Lewis Chief Executive Officer Matthew Price Chief Financial Officer Full year themes Diversified business delivering stable returns Doing a great job for our
Analyst and Investor Conference Call Q2 2018
 Analyst and Investor Conference Call Q2 2018 Ulrik Svensson CFO and Member of the Executive Board Frankfurt, 31 July 2018 Disclaimer The information herein is based on publicly available information. It
RESEARCH. Overcome your fear of flying. Turkey - Sector - Airlines. June 18, 2015
 Turkey - Sector - Overcome your fear of flying June 18, 2015 Passenger trends: Turkish passenger numbers grew by 8% YoY in 5M15 with the growth of 11% in domestic passenger numbers vs. 4% in international
Sixth Investor Conference
 Sixth Investor Conference ASCENDING & DESCENDING Santiago Fernández Valbuena London, October 11 th 2007 2 Disclaimer This presentation contains statements that constitute forward looking statements in
As filed with the Securities and Exchange Commission on April 28, UNITED STATES SECURITIES AND EXCHANGE COMMISSION Washington, D.C.
 As filed with the Securities and Exchange Commission on April 28, 206 UNITED STATES SECURITIES AND EXCHANGE COMMISSION Washington, D.C. 20549 FORM 20 F REGISTRATION STATEMENT PURSUANT TO SECTION 2(b) OR
H Results. July 26th 2018
 H1 2018 Results July 26th 2018 FIRST SIGNIFICANT ADVANCES IN THE CARREFOUR 2022 TRANSFORMATION PLAN H1 2018: Strong momentum for Carrefour 2022 OMNICHANNEL RAPIDLY RAMPING-UP Rapid implementation of food
2016 Fourth-Quarter and Fiscal Year Performance
 206 Fourth-Quarter and Fiscal Year Performance Financial Results and Company Highlights March 4, 207 Disclaimers Forward-Looking Statements and Preliminary Results This presentation includes forward-looking
Fourth Quarter 2016 Performance Summary
 Fourth Quarter 2016 Performance Summary Operational and Financial Highlights - 2016 Net profit rises by +2.5% to Euros 545.5 million Recurring sales (excluding Raw Materials and Others) rise by +4.5% (+4.6%