TARGET/COSTCO FINANCIAL ANALYSIS
|
|
|
- Eustace Hall
- 5 years ago
- Views:
Transcription
1 TARGET/COSTCO FINANCIAL ANALYSIS Bob Moug, Reba Burton, Jacob Torres ACCOUNTING 202 Financial ratios
2 1 TABLE OF CONTENTS Co. and wholesale Co Overview ( versus financial summary) Financial Graphics Financial Statements Financial ratios Ratio detailed Analysis Liquidity and Efficiency Solvency Profitability Market Prospects Conclusion Bibliography Financial Analysis TARGET CO. AND COSTCO WHOLESALE CO 1.1 OVERVIEW (TARGET VERSUS COSTCO FINANCIAL SUMMARY) Our financial analysis will cover two Fortune 500 companies Corporation and. We will start out this analysis by giving a brief history of both companies and comparing both companies against each other using five ratios; current, quick, debt-to-equity and dividend yield. A visual graphic representation of these five ratios will be at the end of the comparison narrative. Then we will have an overview of 12 additional ratios relevant to the
3 2 liquidity, solvency, profitability and market prospects of each company and how they compare against each other and the industry. Finally we will conclude this analysis with our opinion of which company is more favorable to invest in. Corporation was incorporated in Minnesota in (TGT Annual Report pg. 2) likes to refer to their customers as guests and take pride in offering their guests a wide range of options for buying their products. Their general merchandise stores offer an edited food assortment, including perishables, dry grocery, dairy and frozen items while their Super Stores offer a full line of food items comparable to traditional supermarkets. Their new urban format stores, City and Express, offer edited general merchandise and food assortments. Their digital channels include a wide assortment of general merchandise, including many items you can find in their stores, along with a complimentary assortment such as additional sizes and colors only sold online (TGT Annual Report pg. 2). In 2013 the Corporation suffered a massive data breach. Up to 40 million shoppers had their credit card data stolen during the breach, while up to 70 million had personal information such as addresses and phone numbers stolen. (Washington Post) However, in s 2014 Annual report they state that, Until the Data Breach in the fourth quarter of 2013, all incidents we experienced were insignificant. The Data Breach we experienced was significant and went undetected for several weeks. Both we and our vendors have experienced data security incidents other than the Data Breach; however, to date these other incidents have not been material to our consolidated financial statements. (TGT Annual Report pg. 7) In spite of the aforementioned data breach the Corporation has continued to grow and improve in their market and giving their guests the safe experience they deserve
4 3 both in their stores and online by creating a new position in their company, a Chief Information Security Officer. Prior to January 2015 exited their Canadian Segment. s annual report also boats that Virtually all of their revenues from continuing operations are generated within the United States and the vast majority of their long lived assets re located within the United States. (TGT Annual Report pg. 4) owns and operates a total of 1,790 U.S stores as of their January 31, 2015 Annual report. Of those stores 1,536 of those are owned by, 99 are leased and 155 are owned buildings on leased land. Wholesale Corporation and its subsidiaries began operations in 1983 in Seattle Washington. In October 1993, merged with the Price Company, which had pioneered the membership warehouse concept, to form Price/, Inc. a Delaware Corporation. In January 1997, after the spin-off of most of its non-warehouse assets to Price Enterprises, Inc., the Company changed its name to Companies, Inc. On August 30, 1999, the Company reincorporated from Delaware to Washington and changed its name to Wholesale Corporation. As of December 2014, the Company operated a chain of 671 warehouses in 43 states, Washington, D.C., and Puerto Rico (474) locations, nine Canadian Provinces (88) locations. Mexico (34 locations), the United Kingdom (26) locations, Japan (20 locations), Korea (11 locations), Taiwan (10 locations through a 55%-owned subsidiary), Australia (seven locations) and Spain (one location). The Company s online business operates websites in the U.S., Canada, U.K. and Mexico. (COST Annual Report under the Company)
5 4 Now that we have commenced with a brief overview of each company how do they compare to each other. We will begin this company comparison with five ratios; current, quick, debt-to-equity and their dividend yield. There will be a visual representation of these figures after the narrative. After calculating and reviewing the current ratio analysis of both and we see that s ratio is 1.2 to 1 while has a ratio of.99 to 1. Even though s ratio is smaller it appears that both companies have enough working capital to meet their current obligations. The current ratio however, is not the only way to determine whether or can payback their current obligations. When you look at the quick ratio, also known as the acid test ratio, which measures immediate liquidity of both companies; s ratio is 0.19 while has a ratio of.48. Meaning that for instance has $0.48 of liquid assets to cover each $1 of current liabilities and has $0.19 of liquid assets to cover each $1 of current liabilities. By looking at just these two ratios seems more able to meet their short term obligations. Both of these ratios attest to the liquidity of each company. Now liquidity is not the only important factor when analyzing a company we must also look at the solvency of each company. We must measure their ability to generate future revenues and meet long-term obligations. Here, we turn to the debt-to-equity ratio this ratio measures the financial leverage of and by indicating what portion of debt and equity they are using to finance their assets. s debt-to-equity ratio is 1.96 while s is s lower number suggests that there is a low risked for creditors and strong, long-term, financial security for the company. However, s 2.22 debt-to-equity ratio while hire than shows a solid performance in this area for the company as well. So far both companies seem to be comparing evenly with each other. Another factor that should be considered in a
6 5 comparative financial analysis of companies is their profitability. How can you compare and s ability to provide financial rewards sufficient to attract and retain financing? We can look at their return on total assets ratio (ROTA). We have conducted the ROTA to find that s ratio is 2.8% and s ROTA is 3.34%. These percentages tell us that was able manage their assets more efficiently and produce a profit over the analyzed period. A higher ratio is more favorable to investors because it shows that the company is more effectively managing its assets to produce greater amounts of net income. A positive ROTA ratio usually indicates an upward profit trend as well. (Myaccountingcourse.com ROTA) Our final analysis for the beginning comparisons for this report will cover each company s market prospects by measuring the amount of cash dividends distributed to common shareholders relative to the market value per share using the dividend yield ratio for and. A company with a high dividend yield pays its investors a large dividend compared to the fair market value of the stock. This means the investors are getting highly compensated for their investments compared with lower dividend yielding stocks. A high or low dividend yield is relative to the industry of the company; so even a small dividend might produce a high dividend yield ratio. (Myaccountingcourse.com DYR). s dividend yield is 0.65% while s dividend yield is 0.22%. According to s 2014 Annual report they have paid dividends every quarter since their 1967 initial public offering, and it is their intent to continue to do so in the future. In this analyzed period paid dividends totaling $1,205 million and declared dividends totaling $1,271 million for (TGT Annual Report pg. 22)

7 6 When we take a look at s annual report they state that their Board of Directors increased their quarterly cash dividend from $0.31 to $0.335 per share. Their cash dividends paid out in 2014 totaled $584 million. They also presently expect to pay dividends on a quarterly basis. (COST Annual Report pgs. 2, 22 and 32) Below you will find the visual graphics of the ratios previously discussed.


8 1.2 FINANCIAL GRAPHICS Graphics 7


9 Graphic 8

10 9 1.3 FINANCIAL STATEMENTS financial statements

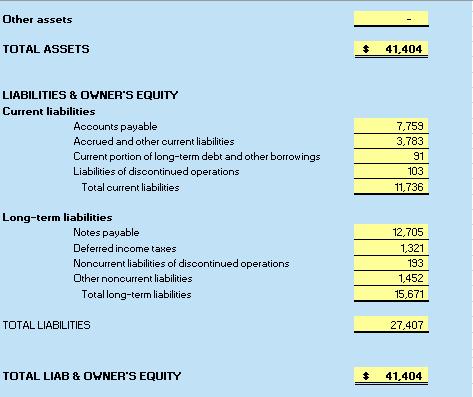
11 10


12 11


13 Wholesale financial statements 12

14 13


15 14

16 15
17 FINANCIAL RATIOS Wholesale Liquidity Ratios Current ratio Quick ratio Accounts receivable turnover Inventory turnover Days Sales in Inventory Total asset turnover Solvency Debt ratio Equity ratio Debt to equity ratio Times Interest Earned Profitability Profit Margin after tax 1.66% 2.09% Gross margin 29% 13% Return on total assets 2.80% 3.34% Return on common stockholders equity 8% 10% Book Value per common share Market Prospects Price-earnings ratio Dividend yield 0.65% 0.22%
18 RATIO DETAILED ANALYSIS Liquidity and Efficiency Detailed Ratio Analysis Activity Ratios Activity ratios delivers a useful gauge of a company s operations by determining the average number of days it takes to collect on customers accounts and the average number of days to pay vendors. Accounts receivable turnover Credit sales for the year/ the average accounts receivable during the year This ratio measures the number of times receivables turn over in a year and reveals how successful a company is in collecting its outstanding receivables. A higher number is good for the company because it indicates a shorter time between sales and cash collection. The accounts receivable turnover for 38.83, which compared to of Suggest that takes times collecting cash from sales through the year and take 33.6 times it takes to collect cash from sale. Both companies have an efficiency in collecting its receivables Inventory Turnover Cost of goods sold for the year/ the average inventory during the year This ratio measure the cost in inventory to the cost of goods sold and compare the quantity of each item in inventory with the recent sales of each item. The higher the inventory turnover ratio, the better, because it means that a company is able to fill customers orders on time.
19 RATIO SCORE 18 The inventory turnover for is 6.01 times, which compared to of 5.56 times. Suggests that is able to turnover inventory with a small investments than. Also, the average Discount Variety Industry inventory turnover is 3.3. Therefore both companies could either have strong sales or ineffective buying Days Sales in Inventory 365 days/ the inventory ratio This ratio measures the average number of days that it took to sell the average amount of inventory held during the specified one-year period. In other words, how many days it takes to sell the merchandise held in inventory. The days sales in inventory ratio for is 60 and 3/4 days, which compared to of 65 and 1/3 days. This indicates that have less time to turn inventory into sales than. The Discount Variety store average is 75 days, this indicates that both companies are doing fairly well among competitors Days' Sales in Inventory Total Asset Turnover Total revenues for the year / the average total assets during the year This ratio measures the relationship of net sales for a specific year to the average amount of total assets during the current 12 months. Meaning, how efficient is the company using its asset to generate sales or income to the company. The higher the ratio is ideal since it means the company is generating more revenues per dollar of assets.
20 RATIO SCORE RATIO SCORE 19 The total asset turnover for is 1.69, which compared to Indicates that is operating efficiently than. The average Discount Variety Industry ratio is 1.3.This indicates that both companies is favorable among other competitors of operating efficiently. Total asset turnover Solvency Solvency ratios Solvency ratios measure a company s ability to cover long-term obligations and the company long-run financial viability. In other words, can both companies be able to continue in business in the long run to meet its long-term obligations? Debt Ratio Total liabilities/ total assets This ratio measures the company s ability to pay of its liabilities with its total assets. In other words, how many assets the company must sell in order to pay off all of its liabilities. Any ratio under 1 is consider to be often low risk for lenders. A favorable debt ratio will be 0.5 since it means the company has twice as many assets as liabilities. The debt ratio for is 0.66 which compared to of Suggests that both companies are consider to be less risky for lenders and to continue to meet liabilities as low ratio 0.66 is more favorable than ratio of Debt Ratio Equity Ratio Total Owners equity/ Total assets This ratio measures the amount of assets that are supported by owners investments, comparing the total equity in the company to the total assets. The equity ratio shows if the company can have remaining assets after liabilities is paid off and how leveraged the company
21 RATIO SCORE RATIO SCORE 20 is with debt. A high equity ratio is great for the company since its shows potential growth for shareholders that the company is worth investing and tell creditors that the company is more sustainable and less risky for future loans The Equity ratio for is 34 percent, which compared to of 31 percent. This ratio indicates that the both companies is funding less assets and more debt. is the more favorable company since 34 percent of assets are earned by shareholders and only 31 percent of assets are owned by shareholders Equity Ratio Times Interest Earned Earnings before Interest and Taxes/Interest Expense This ratio measures the company s ability to meet interest payments. A higher number is preferred suggesting a company can easily meet interest obligations and can take on additional debt. A ratio less than 1 means the company is likely to have problems paying interest on its borrowings. The times interest earned ratio for is 4.14 times, which compared to of 31.11times. Indicates that the both companies is sufficient on paying interest on its borrowings. has a high ratio which may result of the fact the company lack of debt is paying too much of its earnings on debt that could have been spend on other projects. Times Interest Earned Profitability Profitability ratios Profitability ratios measure a company s ability to use its assets efficiently to produce profits. In other words, can both companies and Wholesale be able to generate an acceptable return on invested capital?

22 RATIO SCORE RATIO SCORE 21 Profit Margin Net income / net sales This ratio is a percentage that measures how much out of every dollar of sales a company actually keeps in its earnings. A high profit margin indicates the company is more profitable and has better control over its costs compared to its competitors. The profit margin of is 3.37%, which compared to of 2.09%. Suggest that is more profitable and compared the Industry average of 2.7%. ha better control over its costs compared to other competitors 5.00% 0.00% Profit Margin 2.09% 3.37% Gross Margin Gross profit/net sales This ratio measures the percent of sales revenues that the company retains incuring the cost of goods and services sold by a company. A high percentage is ideal for a company, since it will increase the dollar of sales to service its other costs and obligations.also a high ratio indicates the company has more money to pay operating expenses like wages, utlities and rent The gross margin of is 29%, which compared to of 13%. Indicates that has a stronger ratio than the average discount variety Industry of 24.8%. is more effiecient in selling its inventory and is unfavorable compared to its competitors. 50% 0% Gross Margin 13% 29% Return on common stockholders equity Net income after taxes for the year / the average stockholders equity during the year This ratio measures the success of a company in generating income for the common stockholders equity.a high ratio indicates high proitability and strong financial postion of the company and can convert potential investors into acutal common stockholders
23 RATIO SCORE RATIO SCORE 22 The return on equity of is 8%, which compared to of 10%. Indicates that both companies is a not really using investor money effectively comared to avergae industry ratio return on equity of 24%. is look more favorable than target but an average of 5 to 10 years gives a better prospective of the growth of the company. Return on stockholders' equity 10% 0% 10% 8% Book value per common share Amount of stockholders equity / the number of shares of common stock outstanding This ratio measures investors evel of safety associated with each individual share after all debts are paid accordingly or in other words liquidating assets. book value per common share is 21.86, which compared to Indicates that s is overvalued from the market share of 88 to is consider overvalued of to Investors is expected to received the book value when the companies liquidate their assets. Book value per common share Market Prospects Market Prospects Market measure are useful for analyzing corporations with publicly traded stock.in other words, can both companies and Wholesale be able to continue to provide positive return to stockholders? Price-earnings ratio Market price per common share / earnings per share This ratio is a valuation of a company s current share price compared to its share earnings. A high ratio around 20 indicates the company is making money for investors. A low ratio of 15 or less is the company is losing money. (MyaccountingCourse)
24 RATIO SCORE 23 valuation is , which compared to of This ratio indicates both companies are valuate as profitable making money for investors. is the most favorable of its valuation as a higher growth in the future is expected. Price-earning ratio CONCLUSION Summary of Financial Performance for versus Both and have financial statistics that show why they are still large competitors in the retail store industry. Although their retail stores differ in some ways, keeps a larger variety of inventory in store immediately available for purchase, is more of a warehouse type retailer with a lot of product available online and select inventory at the retail locations. The financial statements for 2014 show very similar patterns in many areas. After reviewing both companies financial statements and comparing performance, the following will summarize the key points.
25 24 Liquidity Current ratio and acid test ratio Average current ratio for was 1.2 and acid test ratio was These averages are larger in the current ratio aspect but not as large in the acid test ratio in comparison with current ratio of 0.99 and acid ratio test was 0.48, which reflects s ability to pay short term debt a little better than but in the immediate short term debt paying ability, had a larger average. A current ratio score of less than one is not a preferred current ratio score; however, had a gross income increase of 8% between 2013 and 2014 which should not raise concern about the lower ratio for. Collection has a better ability to collect customer payments with a ratio of 47.78% in comparison to who holds a 33.6% ratio for accounts receivable turnover. This higher percentage for reduces the liability for risky accounts receivable. With the faster turnover, this allows to pay for its inventory outright and keep their short term debt amounts minimal in comparison to who takes longer to collect on their accounts and in turn holds short term debt longer costing them additional interest fees and decreasing their working capital. Days to sell Inventory s inventory holding period was 5 days longer than which is not substantial, but if that inventory is financed there can be fees that come with the retention. Moving inventory
26 25 efficiently and effectively reduces the possibility of increased capital financing, again allowing to have more working capital. Solvency Debt to Equity Ratio held a higher ratio of debt to equity at 2.22% in comparison to who has an average ratio of 1.96%. This shows that both companies have equal debt financing. Having debt from creditors can be harmful to a company in many ways, liability of debt being the largest factor, interest accrual being another, with an average ratio that these two companies have, there may be reason to hold a certain amount of debt to creditors, but if equity financing is involved in lieu of creditor financing, there would become more shareholders thereby decreasing earnings per share of the shareholders currently in the system. Profitability Profit margin ratio holds a smaller profit margin after tax ratio of 1.66 than that of which is at The larger profit margin ratio by shows how the company gets the most profit possible from its total revenue. One of the most important ratio aspects is return on assets. This reflects a better ability of a company to efficiently use its assets and create higher earnings from products sold per company asset. The return on total assets for is 2.8% which is smaller than which has a return ratio of 3.34%, reflecting more efficiency in utilizing their assets and creating higher earnings.
27 26 Return on equity and assets Return on equity is an important ratio for potential investors as this reflects the return investors will receive on their investment. currently has an 8% return on equity and although this is a good return, currently has a 10% return rate which will be more attractive to investors due to the larger return. The larger return on equity is a reflection of a more efficient operation by management and the employees which creates increases in revenue. Market Measures Price to earnings ratio and dividend yield The price to earnings ratio for is which shows that the investors are less interest in of their stock, compared to earnings ratio of which reflects investors having higher expectations of the company performance levels and are willing to pay higher prices for their stocks for an expected increase in their return on equity. Dividend yield ratios are different between the two companies with a larger yield for who currently has a 0.65% yield and holds a 0.22%. This ratio represents the amount of earnings generated for every dollar invested. Summary of Financial Performance
28 27 After reviewing both companies financial statements and discussing their performance with my team members, there are some areas where shows better ratios than in financial management, but in further review the decision to recommend for investment purposes is a better choice due to higher return on Equity rates to stockholders and less overall liability. Review of both company s assets has revealed has several discontinued stores in their inventory, which is not a sign of strength in sales. on the other hand has shown nothing but growth and stability during the same timeline, which would be an indicator the market, was there for customers. continues to show marked improvement in sales with an uprising trend continuously over the past five years. My recommendation to would be to operate more efficiently and effectively, paying close attention to product inventory and demand markets to provide the best possible service to consumers available. Increasing their security system to keep customers personal information protected should be a huge concern for them considering they have had a few breaches in their system which reflects on their financial reports as consumers lost confidence and trust in their security, gaining the customers trust may help sales for.
29 28 BIBLIOGRAPHY AccountingCoach, LLC. (2015, May 28). Dictionary of Accounting Terms. Retrieved from AccountingCoach: AccountingTools. (2015, June 1). Financial Ratios. Retrieved from Accounting Tools: Halzack, S. (2015, March 19). Retrieved from data breach victims could get up to $10,000 each from court settlement: Investopedia, LLC. (2015, June 2). Dictionary. Retrieved from Investopedia: Morningstar, inc, Capital IQ, StarMine Corp. (2015, June 2). Indusry Center. Retrieved from Yahoo Finance: MyAccountingCourse.com. (2015, June 1). Financial Ratio Analysis. Retrieved from My Accounting Course: Nasdaq.com. (2015, June 4). U.S. Stock Quotes, Charts, and Research. Retrieved from Nasdaq: The Ratail Owners Institute and Outcalt and Johnson. (2015, June 2). General Merchandise Store Sector. Retrieved from The Retail Owners Institute: Merchandise-Stores
30 29 U.S. Securities and Exchange Commission. (2015, June 2). Wholesale Corp (filer). Retrieved from View Filing Dataq: U.S. Securities and Exchange Commission. (2015, June 2). Corp (filer). Retrieved from View Filing Data:
Comparable sales for the twelve-week and twenty-four-week periods were as follows:
 Costco Wholesale Corporation Reports Second Quarter and Year-to-Date Operating Results for Fiscal Year, Sales Results, and Plans for Membership Fee Increase ISSAQUAH, Wash., March 02, (GLOBE NEWSWIRE)
Learning Objective. LO1 Analyze an income statement using vertical analysis Cengage Learning. All Rights Reserved.
 Learning Objective LO1 Analyze an income statement using vertical analysis. Lesson 17-1 Vertical Analysis Ratios LO1 Vertical analysis ratios measure the relationship between one financial statement item
LESSON Trend Analysis and Component Percentages. CENTURY 21 ACCOUNTING 2009 South-Western, Cengage Learning
 Trend Analysis and Component Percentages Trend Analysis and Component Percentage 2 Financial statements report the financial condition and progress of a business for a fiscal period. Accounting concepts
FINANCIAL RATIOS. LIQUIDITY RATIOS (and Working Capital) You want current and quick ratios to be > 1. Current Liabilities SAMPLE BALANCE SHEET ASSETS
 You want current and quick ratios to be > 1. Current Liabilities SAMPLE BALANCE SHEET ASSETS") FINANCIAL RATIOS ROUND ALL ANSWERS TO TWO DECIMALS UNLESS REQUESTED OTHERWISE IN THE PROBLEM LIQUIDITY RATIOS (and Working Capital) You want current and quick ratios to be > 1 Current Ratio Quick Ratio
FINANCIAL RATIOS ROUND ALL ANSWERS TO TWO DECIMALS UNLESS REQUESTED OTHERWISE IN THE PROBLEM LIQUIDITY RATIOS (and Working Capital) You want current and quick ratios to be > 1 Current Ratio Quick Ratio
Financial Ratios 17 March 2007
 This paper provides a financial evaluation and comparison of two theoretical companies - Blake International and Scott Corporation - in terms of their financial performance over the 5 years of data provided.
YOUR SMALL BUSINESS SCORECARD. Your Small Business Scorecard. David Oetken, MBA CPM
 Your Small Business Scorecard David Oetken, MBA CPM 1 Being a successful entrepreneur takes a unique mix of skills and practices. You need to generate exciting ideas, deliver desirable products or services,
FAQ: Financial Ratio Analysis
 Question 1: What is horizontal analysis of financial statement data? Answer 1: Horizontal analysis is a method of financial ratio analysis. Horizontal analysis is comparing each item on the financial statements
UNITED STATES SECURITIES AND EXCHANGE COMMISSION WASHINGTON, D.C FORM 10-Q. For the quarterly period ended November 3, OR -
 UNITED STATES SECURITIES AND EXCHANGE COMMISSION WASHINGTON, D.C. 20549 FORM 10-Q (Mark One) x QUARTERLY REPORT PURSUANT TO SECTION 13 OR 15(d) OF THE SECURITIES EXCHANGE ACT OF 1934 For the quarterly
Professional Designation Ratios: Formulas & Definitions Used in Credit Risk Assessment
 Professional Designation Ratios: Formulas & Definitions Used in Credit Risk Assessment Profitability Ratios Measure management's ability to control expenses and to earn a return on the resources committed
All amounts in 000's of Canadian dollars, except common shares issued (a) (1) (a) (2)
 (1) (a) (2)") Shoppers Suggested Solution (a) (1) and (2) Shoppers Drug Mart All amounts in 000's of Canadian dollars, except common shares issued (a) (1) (a) (2) Horizontal Analysis Vertical Analysis Comparison 2007-2008
Shoppers Suggested Solution (a) (1) and (2) Shoppers Drug Mart All amounts in 000's of Canadian dollars, except common shares issued (a) (1) (a) (2) Horizontal Analysis Vertical Analysis Comparison 2007-2008
STUDY UNIT TWO FINANCIAL PERFORMANCE METRICS FINANCIAL RATIOS
 STUDY UNIT TWO FINANCIAL PERFORMANCE METRICS FINANCIAL RATIOS 1 2.1 Liquidity Ratios.......................................................... 2 2.2 Leverage and Solvency Ratios..............................................
REPORT ON THE FINANCIAL EVALUATION:
 REPORT ON THE FINANCIAL EVALUATION: McDONALD'S CORPORATION AND YUM! BRANDS TAMARA AYRAPETOVA The aim of this paper is to perform financial analysis by using financial ratios and to comment, evaluate, and
Learning Goal 1: Review the contents of the stockholders' report and the procedures for consolidating international financial statements.
 Principles of Managerial Finance, 12e (Gitman) Chapter 2 Financial Statements and Analysis Learning Goal 1: Review the contents of the stockholders' report and the procedures for consolidating international
Appendix: Financial Definitions. Basic Accounting Reports
 Appendix: Financial Definitions Several standardized methods have been created to analyze business financial data. These numbers are easily computed from the standard reported accounting data. The various
WEEK 10 Analysis of Financial Statements
 WEEK 10 Analysis of Financial Statements Learning Objectives 1. Organize a systematic financial statements analysis using common-size financial statements and ratio analysis. 2. Recognize the potential
FORM 10-Q. COSTCO WHOLESALE CORP /NEW - cost. Filed: December 20, 2000 (period: October 26, 2000)
") FORM 10-Q COSTCO WHOLESALE CORP /NEW - cost Filed: December 20, 2000 (period: October 26, 2000) Quarterly report which provides a continuing view of a company's financial position 10-Q - FORM 10-Q Table
FORM 10-Q COSTCO WHOLESALE CORP /NEW - cost Filed: December 20, 2000 (period: October 26, 2000) Quarterly report which provides a continuing view of a company's financial position 10-Q - FORM 10-Q Table
Nike, Inc. Financial Statement Analysis CHAPTER 17
 CHAPTER 17 AP Photo/Matt York Financial Statement Analysis Nike, Inc. J ust do it. These three words identify one of the most recognizable brands in the world, Nike. While this phrase inspires athletes
Question: Was the Rock of Ages Company better off in 2003 than in 2002? Why? Rock of Ages Financial Ratio Analysis
 Financial Ratios 28 October 2006 Question: Was the Rock of Ages Company better off in 2003 than in 2002? Why? Rock of Ages Financial Ratio Analysis While the Balance Sheet and the Statement of Income are
 Safe harbor and non-gaap measures This presentation contains statements as to Walmart management's guidance regarding earnings per share and adjusted earnings per share for the fiscal year ending January
Chapter 17 Notes - Part 1
 Basics of Financial Statement Analysis Chapter 17 Notes - Part 1 Involves evaluating a company and its liquidity, solvency, and profitability All extremely important for investors and creditors Comparative
GAP INC. REPORTS THIRD QUARTER RESULTS. Third Quarter Diluted Earnings Per Share Up 11 Percent to $0.80, Including $0.
 GAP INC. REPORTS THIRD QUARTER RESULTS Third Quarter Diluted Earnings Per Share Up 11 Percent to $0.80, Including $0.06 Tax Benefit Net Sales were $3.97 Billion in the Third Quarter; Up 1 Percent on a
AccountingCoach.com Financial Ratios
 AccountingCoach.com Financial Ratios All underlined words are defined in the attached Glossary (Pages 13 20). Introduction to Financial Ratios When analyzing computing financial ratios and when doing other
Best Buy Reports Third Quarter Results
 Best Buy Reports Third Quarter Results Enterprise Comparable Sales Increased 4.4% Diluted EPS of $0.78 Increased 30% Raising FY18 Financial Outlook MINNEAPOLIS, November 16, -- Best Buy Co., Inc. (NYSE:
This is How Do Managers Use Financial and Nonfinancial Performance Measures?, chapter 13 from the book Accounting for Managers (index.html) (v. 1.0).
 (v. 1.0).") This is How Do Managers Use Financial and Nonfinancial Performance Measures?, chapter 13 from the book Accounting for Managers (index.html) (v. 1.0). This book is licensed under a Creative Commons by-nc-sa
This is How Do Managers Use Financial and Nonfinancial Performance Measures?, chapter 13 from the book Accounting for Managers (index.html) (v. 1.0). This book is licensed under a Creative Commons by-nc-sa
Accounting Functions. The various financial statements are- Income Statement Balance Sheet
 Accounting Functions The accounting system provides a structure of maintaining details of business transactions that represent the finances of the organization. The various financial statements are- Income
901 S. Central Expressway, Richardson, TX 75080
 901 S. Central Expressway, Richardson, TX 75080 FOSSIL GROUP REPORTS THIRD QUARTER RESULTS Net Sales Increase 18% to $810 Million Diluted EPS Increases 25% to $1.58 Maintains Full Year EPS Guidance and
 Safe harbor and non-gaap measures This presentation contains statements as to Walmart management's guidance regarding earnings per share, consolidated net sales growth, Walmart U.S. ecommerce sales growth,
Earnings Conference Call Third Quarter November 20, 2007
 Earnings Conference Call Third Quarter 2007 November 20, 2007 Safe Harbor Statement The Private Securities Litigation Reform Act of 1995 (the Act ) provides protection from liability in private lawsuits
PLANNING FOR YOUR AGRIPRENEURSHIP BUSINESS
 PLANNING FOR YOUR AGRIPRENEURSHIP BUSINESS 1 Creating a basic business plan: Understanding your financials Introduction: Welcome to How to Write Your Business Plan 101! As agricultural entrepreneurs, or
Chapter 2: Analyzing a Company s Financial Statements & Operations
 Chapter 2: Analyzing a Company s Financial Statements & Operations To analyze a company s operations a close look must be taken at the day to day operations as well as examining a company s financial history.
Disciplined thinking focuses inspiration rather than constricts it. ~ Anonymous
 Ratio Analysis Disciplined thinking focuses inspiration rather than constricts it. ~ Anonymous Ratio Analysis compares significant numbers from your financial statements. Rather than focusing on specific
Mattel, Inc. Earnings Conference Call Fourth Quarter 2017 (Unaudited Results)
") Mattel, Inc. Earnings Conference Call Fourth Quarter 2017 (Unaudited Results) FEBRUARY 1, 2018 MARGARET GEORGIADIS CHIEF EXECUTIVE OFFICER JOE EUTENEUER CHIEF FINANCIAL OFFICER FORWARD-LOOKING STATEMENTS:
Mattel, Inc. Earnings Conference Call Fourth Quarter 2017 (Unaudited Results) FEBRUARY 1, 2018 MARGARET GEORGIADIS CHIEF EXECUTIVE OFFICER JOE EUTENEUER CHIEF FINANCIAL OFFICER FORWARD-LOOKING STATEMENTS:
Applying fundamental & technical analysis in stock investing
 Applying fundamental & technical analysis in stock investing Today s Agenda Fundamental Analysis Topics include a basic overview, a discussion on ways to use it, and hands on tool demonstrations Trading
CIF Stock Recommendation Report (Fall 2012)
") Date: 2/27/13 Analyst Name: Eric Klaasen CIF Stock Recommendation Report (Fall 2012) Company Name and Ticker: Costco Wholesale Corporation (COST) Section (A) Summary Recommendation Buy: No Target Price:
Date: 2/27/13 Analyst Name: Eric Klaasen CIF Stock Recommendation Report (Fall 2012) Company Name and Ticker: Costco Wholesale Corporation (COST) Section (A) Summary Recommendation Buy: No Target Price:
 ACC 501 Solved MCQ'S For MID & Final Exam 1. Which of the following is an example of positive covenant? Maintaining firm s working capital at or above some specified minimum level Furnishing audited financial
FORM 10-Q STARBUCKS CORP - SBUX. Filed: May 13, 2003 (period: March 30, 2003)
") FORM 10-Q STARBUCKS CORP - SBUX Filed: May 13, 2003 (period: March 30, 2003) Quarterly report which provides a continuing view of a company's financial position 10-Q - FORM 10-Q FOR THE QUARTER ENDED MARCH
FORM 10-Q STARBUCKS CORP - SBUX Filed: May 13, 2003 (period: March 30, 2003) Quarterly report which provides a continuing view of a company's financial position 10-Q - FORM 10-Q FOR THE QUARTER ENDED MARCH
Chapter # 6. Analysis of Financial Statement. Sameer Hussain.
 Analysis of Financial Statement SYLLABUS ACCORDING TO UNIVERSITY OF KARACHI: Financial Statement analysis. Tools of analysis. Dollar/Rupees and percentage change. Trend percentage. Component percentage.
GAP INC. REPORTS FIRST QUARTER RESULTS. Company outlines measures to drive long-term success
 GAP INC. REPORTS FIRST QUARTER RESULTS Company outlines measures to drive long-term success SAN FRANCISCO May 19, 2016 Gap Inc. (NYSE: GPS) today reported first quarter fiscal year 2016 results and provided
2/2/2009. Financial statement EARNING POWER AND IRREGULAR ITEMS. EARNING POWER AND IRREGULAR ITEMS continued. Chapter 14
 Chapter 14 Financial statement analysis PowerPoint presentation by Anne Abraham University of Wollongong 2009 John Wiley & Sons Australia, Ltd EARNING POWER AND IRREGULAR ITEMS Earning power refers to
GENESCO INC. CHIEF FINANCIAL OFFICER S COMMENTARY FISCAL YEAR 2019 FOURTH QUARTER ENDED FEBRUARY 2, 2019
 GENESCO INC. CHIEF FINANCIAL OFFICER S COMMENTARY FISCAL YEAR 2019 FOURTH QUARTER ENDED FEBRUARY 2, 2019 Discontinued Operations On December 14, 2018, the Company entered into a definitive agreement for
THE HOME DEPOT, INC. (Exact Name of Registrant as Specified in Charter)
") UNITED STATES SECURITIES AND EXCHANGE COMMISSION WASHINGTON, D.C. 20549 FORM 8-K CURRENT REPORT Pursuant to Section 13 or 15(d) of the Securities Exchange Act of 1934 Date of Report (Date of Earliest Event
UNITED STATES SECURITIES AND EXCHANGE COMMISSION WASHINGTON, D.C. 20549 FORM 8-K CURRENT REPORT Pursuant to Section 13 or 15(d) of the Securities Exchange Act of 1934 Date of Report (Date of Earliest Event
Key Business Ratio comparison, animalbased industry Vs. plant-based industry. May 12th, 2017
 Key Business Ratio comparison, animalbased industry Vs. plant-based industry May 12th, 2017 Author's information: Jorge Sigler (siglerj@gmail.com), Catherine Perry, Amanda Gray, James Videle. For inquiries
Starbucks Reports Record Q1 Fiscal 2018 Results
 Starbucks Reports Record Q1 Fiscal 2018 Results Net Revenues Up 6% to a Record $6 Billion; Global and U.S. Comp Store Sales Up 2% China Net Revenues Up 30%; China Comps Up 6% Q1 GAAP EPS of $1.57; Non-GAAP
Best Buy Reports Holiday Revenue Results
 Best Buy Reports Holiday Revenue Results Domestic Revenue Decreased 0.8% Repurchased $203 million in Stock for a Year-to-Date Total of $588 million Improving the Fourth Quarter Operating Margin Outlook
CIF Stock Recommendation Report (Fall 2012) MS Consider Buying: 49. If Less Than 8 WK, next Earnings Ann. Date: Short Interest Ratio: 1.
 MS Consider Buying: 49. If Less Than 8 WK, next Earnings Ann. Date: Short Interest Ratio: 1.") Date: October 14 2012 Analyst Name: Justin L. Jaena CIF Stock Recommendation Report (Fall 2012) Company Name and Ticker:_BBBY Section (A) Summary Recommendation Buy: Yes Target Price: 70 Stop-Loss Price:
Date: October 14 2012 Analyst Name: Justin L. Jaena CIF Stock Recommendation Report (Fall 2012) Company Name and Ticker:_BBBY Section (A) Summary Recommendation Buy: Yes Target Price: 70 Stop-Loss Price:
CA. Sonali Jagath Prasad ACA, ACMA, CGMA, B. Com.
 MANAGEMENT OF FINANCIAL RESOURCES AND PERFORMANCE SESSIONS 5 & 6 FINANCIAL DATA, PERFORMANCE ANALYSIS & MANAGEMENT AND DECISION MAKING June 10 to 24, 2013 CA. Sonali Jagath Prasad ACA, ACMA, CGMA, B. Com.
 Safe harbor and non-gaap measures This presentation and management s accompanying remarks, including management s remarks regarding the impact of Walmart s proposed investment in Flipkart on its earnings
As of September 2014, fiscal year-end
 As of September 2014, fiscal year-end Company Highlights Sally Beauty Holdings is a leading international specialty retailer and distributor of professional beauty products Annual consolidated sales of
Sample Performance Review
 Sample Performance Review For the period ended 12/31/2011 Provided by: This report is designed to assist you in your business' development. Below you will find your overall ranking, business snapshot and
ANALYSIS OF FINANCIAL STATEMENTS
 2059T_c05_150-188.QXD 06/29/2006 06:16 PM Page 150 5 ANALYSIS OF FINANCIAL STATEMENTS Reviewing and Assessing Financial Information Starting Point Go to www.wiley.com/college/melicher to assess your knowledge
Industry Comparative Report
 Industry Comparative Report Real Distributor Company Provided By Narrative Report Industry: Revenue: Periods: 423840 - Industrial Supplies Merchant Wholesalers $10M - $50M 12 months against the same 12
Store #1 Rogers, Arkansas Then and Now Annual Report
 Store #1 Rogers, Arkansas Then and Now 2003 Annual Report 11-Year Financial Summary (Dollar amounts in millions except per share data) 2003 2002 2001 Net sales $ 244,524 $ 217,799 $ 191,329 Net sales increase
Fiscal Year 2019 Guidance Update
 Safe harbor and non-gaap measures This presentation contains statements as to Walmart management's guidance regarding earnings per share, adjusted earnings per share, effective tax rate or adjusted effective
Applying fundamental & technical analysis in stock investing
 Applying fundamental & technical analysis in stock investing 2017 Live demonstration of research and trading tools Develop an Ongoing Strategy with Fidelity Software and mobile apps to enhance your trading
The Home Depot Announces Third Quarter Results; Updates Fiscal Year 2017 Guidance
 The Home Depot Announces Third Quarter Results; Updates Fiscal Year Guidance ATLANTA, November 14, -- The Home Depot, the world's largest home improvement retailer, today reported sales of $25.0 billion
Chapter 15 Accounting & Financial Analysis
 Chapter 15 Accounting & Financial Analysis Professor Muriel Anderson, CPA MGG 150: Introduction to Business November 12, 2013 Chapter Outline How Firms Use Accounting Responsible Financial Reporting Interpreting
Key Business Ratios v 2.0 Course Transcript Presented by: TeachUcomp, Inc.
 Key Business Ratios v 2.0 Course Transcript Presented by: TeachUcomp, Inc. Course Introduction Welcome to Key Business Ratios, a presentation of TeachUcomp, Inc. This course examines key ratios used to
How Well Am I Doing? Financial Statement Analysis
 How Well Am I Doing? Financial Statement Analysis Chapter 16 McGraw-Hill/Irwin Copyright 2010 by The McGraw-Hill Companies, Inc. All rights reserved. Limitations of Financial Statement Analysis Differences
Q4 & Full Year Transformation Update & Financial Results February 2015
 Q4 & Full Year 2014 Transformation Update & Financial Results February 2015 a Agenda Introduction Opening Remarks Financial Results Rob Schriesheim Chief Financial Officer Eddie Lampert Chairman & Chief
Top 8. Capstone Financial Ratios
 Financial Ratio Review Top 8 Plus Capstone Financial Ratios Kenneth EA Wendeln 2012 KEAW v5 Top 8 Key Financial Ratios Profitability Liquidity Return on Owners Equity % Current Ratio # n.nn EPS Earnings
Quant Ratings Revealed
 Quant Ratings Revealed Show me the money! is not just the mantra for fictional football players. It also works for stock selection. When all subjective factors are set aside and only measurable, objective
GAP INC. REPORTS THIRD QUARTER EARNINGS
 GAP INC. REPORTS THIRD QUARTER EARNINGS Company Re-affirms Full Year EPS Guidance Range of $1.40 to $1.50 SAN FRANCISCO November 17, 2011 Gap Inc. (NYSE:GPS) today reported that net sales for the third
CHAPTER 5 BRIEF EXERCISE
 CHAPTER 5 USING FINANCIAL STATEMENT INFORMATION BE5 1 BRIEF EXERCISE Coke Pepsi (a) ROE = Net Income/Average Stockholders Equity 27.7% 28.5% ROA = (Net Income +[Interest Expense (1- Tax Rate)])/ Average
2. Seller of a business may train a new owner- experienced employees may be available to help the new owner learn about the company.
 CHAPTER 4, SELECT A TYPE OF OWNERSHIP Run and Existing Business- Most people consider going into business for themselves, they think about starting a new business. Two other ways of becoming an entrepreneur:
Study the Future Value of the Australian Coal Industry by the Cross Analysis of Centennial Coal s Financial Performance in between 2002 and 2003
 Study the Future Value of the Australian Coal Industry by the Cross Analysis of Centennial Coal s Financial Performance in between 2002 and 2003 Wooseok Howard Lee Chief Researcher, Standard Institute
The Home Depot Announces Third Quarter Results; Updates Fiscal Year 2018 Guidance
 The Home Depot Announces Third Quarter Results; Updates Fiscal Year Guidance ATLANTA, November 13, -- The Home Depot, the world's largest home improvement retailer, today reported sales of $26.3 billion
Financial Statement Analysis for the Boardroom. An Attorney s Guide September 13, 2017
 Financial Statement Analysis for the Boardroom An Attorney s Guide September 13, 2017 Contact information For more information, please contact one of the following members of the engagement team: Marc
GENESCO INC. CHIEF FINANCIAL OFFICER S COMMENTARY FISCAL YEAR 2019 FIRST QUARTER ENDED MAY 5, 2018
 GENESCO INC. CHIEF FINANCIAL OFFICER S COMMENTARY FISCAL YEAR 2019 FIRST QUARTER ENDED MAY 5, 2018 Consolidated Results First Quarter Sales First quarter net sales were up a little to $645 million in Fiscal
ACC 121 PRINCIPLES OF MANAGERIAL ACCOUNTING
 PRINCIPLES OF MANAGERIAL ACCOUNTING COURSE DESCRIPTION: Prerequisites: ACC 120 Corequisites: None This course includes a greater emphasis on managerial and cost accounting skills. Emphasis is on managerial
Rent-A-Center today is
 INVESTOR PRESENTATION FIRST QUARTER 2014 Safe Harbor This presentation contains forward-looking statements that involve risks and uncertainties. Such forward-looking statements generally can be identified
The Home Depot Announces Record Fourth Quarter And Fiscal 2015 Results; Increases Quarterly Dividend By 17 Percent And Provides Fiscal 2016 Guidance
 The Home Depot Announces Record Fourth Quarter And Fiscal Results; Increases Quarterly Dividend By 17 Percent And Provides Fiscal Guidance ATLANTA, February 23, -- The Home Depot, the world's largest home
Cautionary Statement Regarding Forward-Looking Statements
 January 2018 Cautionary Statement Regarding Forward-Looking Statements Forward Looking Statements: Certain statements are forward-looking statements made pursuant to the safe harbor provisions of the Private
UNITED STATES SECURITIES AND EXCHANGE COMMISSION Washington, D.C FORM 10-Q
 UNITED STATES SECURITIES AND EXCHANGE COMMISSION Washington, D.C. 20549 FORM 10-Q (Mark One) QUARTERLY REPORT PURSUANT TO SECTION 13 OR 15(d) OF THE SECURITIES EXCHANGE ACT OF 1934 For the quarterly period
GENUINE PARTS COMPANY
 Table of Contents UNITED STATES SECURITIES AND EXCHANGE COMMISSION WASHINGTON, D.C. 20549 FORM 10-Q QUARTERLY REPORT PURSUANT TO SECTION 13 OR 15(d) OF THE SECURITIES EXCHANGE ACT OF 1934 For the quarterly
USANA Health Sciences Reports Results for Third Quarter 2018; Updates 2018 Outlook; Board Increases Share Repurchase Authorization
 October 23, 2018 USANA Health Sciences Reports Results for Third Quarter 2018; Updates 2018 Outlook; Board Increases Share Repurchase Authorization Third quarter net sales of $296.8 million, an increase
BURLINGTON STORES, INC.
 BURLINGTON STORES, INC. FORM 10-Q (Quarterly Report) Filed 12/09/14 for the Period Ending 11/01/14 Address 2006 ROUTE 130 NORTH FLORENCE, NJ 08518 Telephone (609) 387-7800 CIK 0001579298 Symbol BURL SIC
McCormick & Company, Inc. 4th Quarter 2016 Financial Results and Outlook January 25, 2017
 McCormick & Company, Inc. 4th Quarter 2016 Financial Results and Outlook January 25, 2017 The following slides accompany a January 25, 2017 presentation to investment analysts. This information should
MATTEL REPORTS THIRD QUARTER 2017 FINANCIAL RESULTS
 MATTEL REPORTS THIRD QUARTER 2017 FINANCIAL RESULTS Third Quarter Highlights 1 Worldwide net sales down 13% as reported, and down 14% in constant currency; worldwide gross sales down 13% as reported, and
PAPA JOHN S ANNOUNCES FIRST QUARTER 2017 RESULTS
 PAPA JOHN S ANNOUNCES FIRST QUARTER 2017 RESULTS Louisville, Kentucky (May 2, 2017) Papa John s International, Inc. (NASDAQ: PZZA) today announced financial results for the first quarter ended March 26,
CFIN4 Chapter 2 Analysis of Financial Statements
 1. The income statement measures the flow of funds into (i.e. revenue) and out of (i.e. expenses) the firm over a certain time period. It is always based on accounting data. Income statement 2. The balance
Accounting)Exam)Notes!
Exam)Notes!") Accounting)Exam)Notes! Week 1 The role of accounting in business Adjusting processes can be created Accounting period - a measurement period. 12 months. Listed companies can be 6 months - even quarterly.
Accounting)Exam)Notes! Week 1 The role of accounting in business Adjusting processes can be created Accounting period - a measurement period. 12 months. Listed companies can be 6 months - even quarterly.
Ford Motor Credit Company
 Ford Motor Credit Company QUARTERLY REPORT ON FORM 10-Q for the quarter ended September 30, 2004 Filed pursuant to Section 13 of the Securities Exchange Act of 1934 (Mark One) [X] UNITED STATES SECURITIES
Fourth Quarter & Fiscal 2015 Business Update. February 25, 2016
 Fourth Quarter & Fiscal 2015 Business Update February 25, 2016 Fourth Quarter 2015 Highlights Net Sales Comparable to LY $ in millions, except EPS Adjusted Operating Income* (Adjusted Operating Margin)
Survey responses were received from over 130 companies that had adopted FAS 87 for their foreign plans and the following 20 countries were covered:
 FAS 87 Assumptions INTRODUCTION This article presents a brief summary of Watson Wyatt's Survey of FAS 87 Assumptions for non-us defined benefit plans as of December 31, 1996 and also includes some historical
Nordstrom Second Quarter 2017 Earnings Achieved Expectations Results Reflected Positive Anniversary Sale, Inventory and Expense Execution
 EX-99.1 2 jwnq22017ex991.htm EX-99.1 Exhibit 99.1 FOR RELEASE: August 10, 2017 at 1:05 PM PDT INVESTOR CONTACT: MEDIA CONTACT: Trina Schurman Nordstrom, Inc. (206) 303-6503 Gigi Ganatra Duff Nordstrom,
Strategic Management. Concepts and Cases. Strategic Management. Fred R. David Forest R. David
 Strategic Management Concepts and Cases For these Global Editions, the editorial team at Pearson has collaborated with educators across the world to address a wide range of subjects and requirements, equipping
AMERICAN APPAREL, INC
 AMERICAN APPAREL, INC FORM NT 10-Q (Notification that Quarterly Report will be submitted late) Filed 08/12/08 for the Period Ending 06/30/08 Address 747 WAREHOUSE STREET LOS ANGELES, CA 90021 Telephone
Week 4 and Week 5 Handout Financial Statement Analysis
 Week 4 and Week 5 Handout Financial Statement Analysis Introduction After understanding the basic financial statements, one may be interested in analysing the financial statements to understand the performance
sur 11 16/08/ :58 Nordstrom Reports Second Quarter 2013 Earnings Print Page Close Window
 Print Page Close Window Nordstrom Reports Second Quarter 2013 Earnings SEATTLE--(BUSINESS WIRE)--Aug. 15, 2013-- Nordstrom, Inc. (NYSE:JWN) today reported earnings per diluted share of $0.93 for the second
07/10/2013. Chapter 18. Financial statement analysis part a, Session 11
 Chapter 18 Financial statement analysis part a, Session 11 PowerPoint to accompany: Learning objectives Perform a horizontal analysis of financial statements Perform a vertical analysis of financial statements
Fin-621 Final term Solved Papers by Fahad Yusha Cell: and
 FINALTERM EXAMINATION Spring 2010 FIN621- Financial Statement Analysis (Session - 1) : 90 min Marks: 69 Question No: 1 ( Marks: 1 ) - Please choose one Which one of the following is NOT a type of adjusting
Which of the following e-commerce/online orders, if any, do you accept? O Online order for in-store pickup O Other (please explain): O None
: O None") Please use the results from your 2016 Year-End Financial Statements. If you have any questions regarding this survey please contact Eric Wronsky at FMS at ericw@fmssolutions.com In which states do you
Please use the results from your 2016 Year-End Financial Statements. If you have any questions regarding this survey please contact Eric Wronsky at FMS at ericw@fmssolutions.com In which states do you
condition & operating results in a condensed form. Financial statements are used as a
 2.1 FINANCIAL ANALYSIS Financial statements are formal records of the financial activities of a business, person or other entity and provide an overview of a business or person s financial condition in
FINANCIAL PERFORMANCE ANALYSIS OF BEXIMCO PHARMACEUTICALS LTD. AND SQUARE PHARMACEUTICALS LTD. Submitted to. M. Nurul Amin.
 FINANCIAL PERFORMANCE ANALYSIS OF BEXIMCO PHARMACEUTICALS LTD. AND SQUARE PHARMACEUTICALS LTD. Submitted to M. Nurul Amin Submitted by Date-31 st July, 2010 North South University Financial Performance
Nordstrom Reports Second Quarter 2018 Earnings, Raises Full Year Outlook
 Nordstrom Reports Second Quarter 2018 Earnings, Raises Full Year Outlook August 16, 2018 Strong Top-line Growth; Digital Sales Up 23 Percent SEATTLE--(BUSINESS WIRE)--Aug. 16, 2018-- Nordstrom, Inc. (NYSE:
CHAPTER 2 ANALYSIS OF FINANCIAL STATEMENTS
 TRUE/FALSE CHAPTER 2 ANALYSIS OF FINANCIAL STATEMENTS 1. The income statement measures the flow of funds into (i.e. revenue) and out of (i.e. expenses) the firm over a certain time period. It is always
American Eagle Outfitters Reports Record Second Quarter Sales and Strong EPS Growth
 NEWS RELEASE American Eagle Outfitters Reports Record Second Quarter Sales and Strong EPS Growth 8/19/2015 Comparable Sales Increase 11% and EPS Rises to $0.17 from $0.03 Last Year PITTSBURGH--(BUSINESS
THE PROCTER & GAMBLE COMPANY (Exact name of registrant as specified in its charter)
") PG 10-Q 12/31/2014 Section 1: 10-Q (10-Q) UNITED STATES SECURITIES AND EXCHANGE COMMISSION WASHINGTON, D.C. 20549 FORM 10-Q (Mark one) QUARTERLY REPORT PURSUANT TO SECTION 13 OR 15(d) OF THE SECURITIES
PG 10-Q 12/31/2014 Section 1: 10-Q (10-Q) UNITED STATES SECURITIES AND EXCHANGE COMMISSION WASHINGTON, D.C. 20549 FORM 10-Q (Mark one) QUARTERLY REPORT PURSUANT TO SECTION 13 OR 15(d) OF THE SECURITIES
The Hershey Company Stock Analysis Report Finance 305W
 The Hershey Company Stock Analysis Report Finance 305W Penn State University Meredith Cinciripino June 21, 2013 Executive Summary A stock analysis of The Hershey Company, strongly suggests that stockholders
TransUnion (Exact name of registrant as specified in its charter)
") UNITED STATES SECURITIES AND EXCHANGE COMMISSION WASHINGTON, D.C. 20549 FORM 10-Q (Mark One) x QUARTERLY REPORT PURSUANT TO SECTION 13 OR 15(d) OF THE SECURITIES EXCHANGE ACT OF 1934 For the quarterly
UNITED STATES SECURITIES AND EXCHANGE COMMISSION WASHINGTON, D.C. 20549 FORM 10-Q (Mark One) x QUARTERLY REPORT PURSUANT TO SECTION 13 OR 15(d) OF THE SECURITIES EXCHANGE ACT OF 1934 For the quarterly