SE-Michigan Model Club Reports Spreadsheet Help
|
|
|
- Ethelbert Gibson
- 5 years ago
- Views:
Transcription
1 4/18/2013 8:49 PM SE-Michigan Model Club Reports Spreadsheet Help Valuation (NAV) for 04/18/2013 Shares Held Cost Basis per Share Total Cost Basis Price per Share Market Value Unrealized Gain/(Loss) Percent of Total AFLAC Inc (AFL) , , % Apple Inc (AAPL) , , % BUFFALO WILD WINGS INC (BWLD) , , , % CHIPOTLE MEXICAN GRILL INC (CMG) , , % Cognizant Technology Solutions Corp. Cl (CTSH) , , % Danaher Corp (DHR) , , , % EMC Corp (EMC) , , (283.70) 2.3% FactSet Research Systems Inc (FDS) , , , % IPC The Hospitalist Co Inc (IPCM) , , % LKQ CP (LKQ) , , , % MASTERCARD INCORPORATED (MA) , , , % Parker-Hannifin Corp (PH) , , , % Qualcomm Inc (QCOM) , , % Stryker Corp (SYK) , , % Teva Pharm Ind Inc ADR (TEVA) , , % 79, , , % Cash Account Total Cost Basis Market Value Unrealized Gain/(Loss) Percent of Total Folio Investing 1, , % Suspense % TD Ameritrade % 1, , % Total Securities and Cash Accounts 80, , , % Total Number of Valuation Units to Date 6, Value of One Unit $ Return to the report list bivio.com
2 4/18/2013 8:50 PM SE-Michigan Model Club Reports Spreadsheet Help Transaction History to Cash Accounts - Income and Expenses Date 04/15/2013 Description Expense, Folio Investing Check 1008 to L Douglass, for Certified Mail for Income Tax Filing 2011 & 2012 and Postage Stamps Misc. Expense (32.37) (32.37) Investment Purchases, Sales, and Transfers Date Description Cost Basis 03/04/2013 Purchased shares AFLAC Inc (AFL) at per share /04/2013 Purchased 0.25 shares Parker-Hannifin Corp (PH) at per share /04/2013 Purchased shares AFLAC Inc (AFL) at 50 per share /20/2013 Purchased shares FactSet Research Systems Inc (FDS) at per share /28/2013 Purchased shares Qualcomm Inc (QCOM) at per share Investment Distributions - Cash and Reinvested Date Description Dividend 03/01/2013 Dividend, AFLAC Inc (AFL) /04/2013 Dividend, AFLAC Inc (AFL) QUALIFIED DIVIDEND /04/2013 Dividend, Parker-Hannifin Corp (PH) QUALIFIED DIVIDEND /19/2013 Dividend, FactSet Research Systems Inc (FDS) /27/2013 Dividend, Qualcomm Inc (QCOM) Investment Splits, Spin-offs and Mergers Date Description New Shares Member Contributions and Withdrawals Date Description Cash Units 03/25/ member payments /25/2013 Fee, Teresa Barr Deposit Ck 1005 Folio Fee for returned check Return to the report list bivio.com
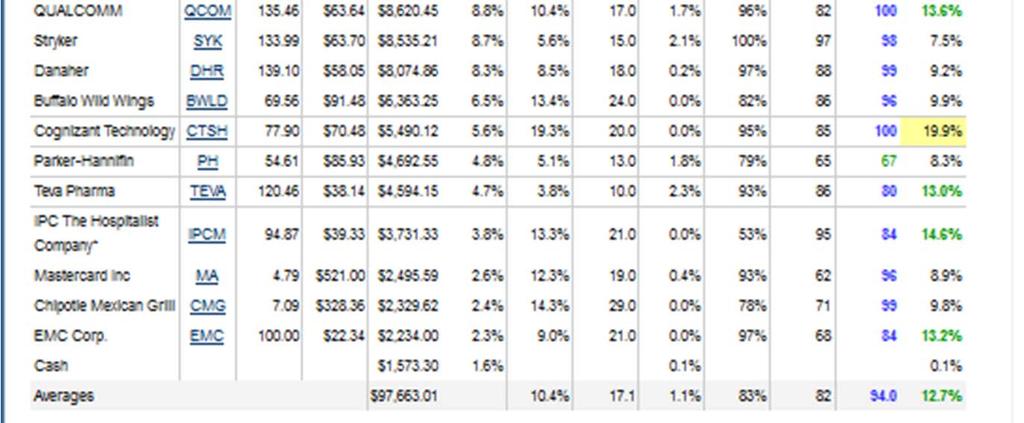
3 SEMI MODEL CLUB DIVERSIFICATION TABLE 4/18/2013 Sales< 0.5 Billion Sales 0.5 to 5 Billion Sales > 5 Billion $ per sector % of Portfolio % of Portfolio 31.9% 66.49% 1.6% 100.0% SECTOR: Industries SYM $ Amount SYM $ Amount SYM $ Amount Cyclical Super Sector 23.2% Basic Materials: Companies that manufacture chemicals, building materials and paper products. This sector also includes companies engaged in commodities exploration and processing. Consumer Cyclical: This sector includes retail BWLD $6, stores, auto and auto parts manufacturers, companies CMG $2, $8, % engaged in residential construction, lodging facilities, restaurants and entertainment companies. Financial Services: Companies that provide AFL $11, financial services which includes banks, savings and MA $2, $13, % loans, asset management companies, credit services, investment brokerage firms, and insurance companies. Real Estate: This sector includes mortgage companies, property management companies and REITs Defensive Super Sector 17.3% Consumer Defensive: Companies engaged in the manufacturing of food, beverages, household & personal products, packaging, or tobacco. Also companies that provide services such as education & training services Healthcare: This sector includes biotechnology, IPCM $3, SYK $8, pharmaceuticals, research services, home TEVA $4, $16, % healthcare, hospitals, long-term care facilities, and medical equipment and supplies. Utilities: Electric, gas, and water utilities Communication Services: Companies that provide communication services using fixed-line networks or those that provide wireless access & services. This sector also includes companies that provide internet services such as access, navigation & internet related software and services Energy: Companies that produce or refine oil and gas, oil field services and equipment companies, and pipeline operators. This sector also includes companies Sensitive Super Sector 58.0% Industrials: Companies that manufacture machinery, FDS $9, DHR $8, hand-held tools and industrial products. This sector also LKQ $9, PH $4, $31, % includes aerospace & defense firms as well as companys Co's engaged in transportation & logistic services. Technology: Companies engaged in the design, AAPL $8, development, & support of computer operating systems & CTSH $5, $25, % applications. This sector also includes companies that EMC $2, provide computer technology consulting services. Also QCOM $8, includes companies engaged in the manufacturing of computer equipment, data storage products, networking products, semiconductors, and components CASH IN PORTFOLIO $1, % COLUMN TOTALS $31, $64, $97, % $97,696.75


4


5
Total Cost Basis. Price per Share , , , % , , ,
 SE-Michigan Model Club Reports Spreadsheet Help Valuation (NAV) for 03/16/2012 *(using prices from market close for 03/15/2012) Shares Held Cost Basis per Share Total Cost Basis Price per Share Market
SE-Michigan Model Club Reports Spreadsheet Help
 5/19/2011 9:05 PM SE-Michigan Model Club Reports Spreadsheet Help Valuation (NAV) for 05/19/2011 Shares Held Cost Basis per Share Total Cost Basis Price per Share Market Value Unrealized Gain/(Loss) Percent
Focus Morningstar Basic Materials Index ETF. Focus Morningstar Consumer Defensive Index ETF. Focus Morningstar Consumer Cyclical Index ETF
 Date: March 30, 2011 BZX Information Circular 11-036 BYX Information Circular 11-036 Re: s Pursuant to Rule 14.1(c)(2) of the Rules of BATS Exchange, Inc. and BATS Y-Exchange, Inc. (each referred to hereafter
Constructing a more dynamic portfolio with equity sector allocation
 Constructing a more dynamic portfolio with equity sector allocation This is not your father s stock market, where traditional methods were used to allocate the stock portion of a portfolio. Enter the more
GICS system sectors and industries
 GICS system sectors and industries In studying the share markets any where around the world, it can be useful to compare companies that are somewhat similar in what they do. That is, for example, to compare
By Sub-Sector Mergers & Acquisitions Market Analysis
 By Sub-Sector Mergers & Acquisitions Market Analysis This report is more in depth analysis of the submarkets for Mergers and Acquisitions that are of interest to potential clients of the Emerging Growth
Stock Market Briefing: S&P 500 Sectors & Industries Forward Earnings (Indexed)
") Stock Market Briefing: S&P 5 Sectors & Industries Forward Earnings (Indexed) July 11, 218 Dr. Edward Yardeni 516-972-7683 eyardeni@ Joe Abbott 732-497-536 jabbott@ Please visit our sites at www. blog.
Stock Market Briefing: S&P 5 Sectors & Industries Forward Earnings (Indexed) July 11, 218 Dr. Edward Yardeni 516-972-7683 eyardeni@ Joe Abbott 732-497-536 jabbott@ Please visit our sites at www. blog.
Quarterly Report February 28, MFS Growth Fund
 Quarterly Report February 28, 2018 MFS Growth Fund PORTFOLIO OF INVESTMENTS 2/28/18 (unaudited) The Portfolio of Investments is a complete list of all securities owned by your fund. It is categorized by
Performance Derby: S&P 500 Sectors & Industries Change in P/E
 Performance Derby: S&P 500 Sectors & Industries Change in P/E August 15, 2018 Dr. Ed Yardeni 516-972-7683 eyardeni@yardeni.com Joe Abbott 732-497-5306 jabbott@yardeni.com Please visit our sites at blog.yardeni.com
Performance Derby: S&P 500 Sectors & Industries Current P/E and Year-Ago P/E
 Performance Derby: S&P 500 Sectors & Industries Current P/E and Year-Ago P/E September 12, 2018 Dr. Ed Yardeni 516-972-7683 eyardeni@yardeni.com Joe Abbott 732-497-5306 jabbott@yardeni.com Please visit
# of Equities in Industry
 # of Equities in Industry Name ERLANGER SECTOR _ INDUSTRY WEEKLY OVERVIEW As Of 03/11/2010 Sectors - Industries Sorted By Power ing Within Sector Weekly 3/11/10 3/4/10 2/25/10 2/18/10 2/11/10 2/4/10 1/28/10
Invesco Charter Fund Quarterly Schedule of Portfolio Holdings July 31, 2018
 Quarterly Schedule of Portfolio Holdings July 31, 2018 invesco.com/us CHT-QTR-1 09/18 Invesco Advisers, Inc. Schedule of Investments (a) July 31, 2018 (Unaudited) Common Stocks & Other Equity Interests
Performance 2018 S&P 500 Sectors & Industries
 Performance 218 S&P Sectors & Industries October 3, 218 Dr. Edward Yardeni 16-972-7683 eyardeni@ Joe Abbott 732-49736 jabbott@ Mali Quintana 48-664-1333 aquintana@ Please visit our sites at www. blog.
Performance 2012 S&P 500 Sectors & Industries
 Performance 212 S&P Sectors & Industries January 3, 213 Dr. Edward Yardeni 16-972-7683 eyardeni@ Mali Quintana 48-664-1333 aquintana@ Please visit our sites at www. blog. thinking outside the box Table
MFS LOW VOLATILITY EQUITY FUND
 QUARTERLY REPORT November 30, 2017 MFS LOW VOLATILITY EQUITY FUND PORTFOLIO OF INVESTMENTS 11/30/17 (unaudited) The Portfolio of Investments is a complete list of all securities owned by your fund. It
Performance 2013 S&P 500 Sectors & Industries
 Performance 213 S&P Sectors & Industries November, 213 Dr. Edward Yardeni 16-972-7683 eyardeni@ Mali Quintana 48-664-1333 aquintana@ Please visit our sites at www. blog. thinking outside the box Table
Earnings Call Transcripts Analysis, Q1 '18. June 2018
 Earnings Call Transcripts Analysis, Q1 '18 June 2018 Executive Summary Hamilton Place Strategies (HPS) analyzed quarterly earnings call transcripts of U.S. public companies to identify key issues influencing
Quarterly Report August 31, Massachusetts Investors Growth Stock Fund
 Quarterly Report August 31, 2018 Massachusetts Investors Growth Stock Fund PORTFOLIO OF INVESTMENTS 8/31/18 (unaudited) The Portfolio of Investments is a complete list of all securities owned by your fund.
Dividend Focused Equity Portfolio
 March 2014 Dividend Focused Equity Portfolio Christopher Eckert Portfolio Management Director Senior Vice President/Financial Advisor 320 Post Road West Westport, CT 06880 PHONE: 203-222-4057 TOLL-FREE:
First Trust Enhanced Equity Income Fund (FFA) Portfolio of Investments September 30, 2018 (Unaudited)
 Portfolio of Investments September 30, 2018 (Unaudited)") Portfolio of Investments Shares Description Value COMMON STOCKS 93.0% Aerospace & Defense 1.8% 29,000 Raytheon Co. (a)... $ 5,993,140 Air Freight & Logistics 1.6% 22,000 FedEx Corp. (a)... 5,297,380 Automobiles
Portfolio of Investments Shares Description Value COMMON STOCKS 93.0% Aerospace & Defense 1.8% 29,000 Raytheon Co. (a)... $ 5,993,140 Air Freight & Logistics 1.6% 22,000 FedEx Corp. (a)... 5,297,380 Automobiles
Performance 2018 S&P 500 Sectors & Industries
 Performance 218 S&P Sectors & Industries May 2, 218 Dr. Edward Yardeni 16-972-7683 eyardeni@ Joe Abbott 732-49736 jabbott@ Mali Quintana 48-664-1333 aquintana@ Please visit our sites at www. blog. thinking
Schedule of Investments (a) November 30, 2017 (Unaudited)
 November 30, 2017 (Unaudited)") Schedule of Investments (a) November 30, 2017 (Unaudited) Common Stocks & Other Equity Interests 99.74% Aerospace & Defense 2.58% Boeing Co. (The) 428,307 $ 118,555,377 Raytheon Co. 778,305 148,773,001
Schedule of Investments (a) November 30, 2017 (Unaudited) Common Stocks & Other Equity Interests 99.74% Aerospace & Defense 2.58% Boeing Co. (The) 428,307 $ 118,555,377 Raytheon Co. 778,305 148,773,001
PORTFOLIO OF INVESTMENTS 3 RD QUARTER USAA GROWTH FUND APRIL 30, 2018
 PORTFOLIO OF INVESTMENTS 3 RD QUARTER USAA GROWTH FUND APRIL 30, 2018 (Form N-Q) 48488-0618 2018, USAA. All rights reserved. PORTFOLIO OF INVESTMENTS USAA Growth Fund April 30, 2018 (unaudited) Number
Performance 2017 S&P 500 Sectors & Industries
 Performance 217 S&P Sectors & Industries September 2, 217 Dr. Edward Yardeni 16-972-7683 eyardeni@ Joe Abbott 732-497-36 jabbott@ Mali Quintana 48-664-1333 aquintana@ Please visit our sites at www. blog.
PERFORMANCE UDPATE. Fig.1.1. Equity Sector Index Families. US Sector S&P 500 [Select Sector SPDR S&P [Sector Indices] Europe Sector
![PERFORMANCE UDPATE. Fig.1.1. Equity Sector Index Families. US Sector S&P 500 [Select Sector SPDR S&P [Sector Indices] Europe Sector](/thumbs/95/126257868.jpg "PERFORMANCE UDPATE. Fig.1.1. Equity Sector Index Families. US Sector S&P 500 [Select Sector SPDR S&P [Sector Indices] Europe Sector") CONTACT PERFORMANCE UDPATE For more information, contact Henry Cobbe, CFA Head of Research henry@elstonconsulting.co.uk Emma Cole Associate emma@elstonconsulting.co.uk Scope focuses on ETFs listed on the
CONTACT PERFORMANCE UDPATE For more information, contact Henry Cobbe, CFA Head of Research henry@elstonconsulting.co.uk Emma Cole Associate emma@elstonconsulting.co.uk Scope focuses on ETFs listed on the
U.S. Balancing Act July 2018
 Leila Heckman, Ph.D. lheckman@dcmadvisors.com 917-386-6261 John Mullin, Ph.D. jmullin@dcmadvisors.com 917-386-6262 Allison Hay ahay@dcmadvisors.com 917-386-6264 U.S. Balancing Act July 2018 A Disciplined
Invesco V.I. American Franchise Fund
 Quarterly Schedule of Portfolio Holdings March 31, 2018 invesco.com/us VK-VIAMFR-QTR-1 05/18 Invesco Advisers, Inc. Schedule of Investments (a) March 31, 2018 (Unaudited) Shares Value Common Stocks & Other
Stock Market Briefing: S&P 500 Sectors & Industries Forward Profit Margins
 Stock Market Briefing: S&P Sectors & Industries Forward Profit Margins February 1, 1 Dr. Edward Yardeni 1-97-73 eyardeni@ Joe Abbott 73-97-3 jabbott@ Mali Quintana --1333 aquintana@" Please visit our sites
Schedule of Investments (a) September 30, 2017 (Unaudited)
 September 30, 2017 (Unaudited)") Schedule of Investments (a) September 30, 2017 (Unaudited) Shares Value Common Stocks & Other Equity Interests 99.51% Aerospace & Defense 2.65% Raytheon Co. 17,301 $ 3,228,021 Application Software 2.21%
Schedule of Investments (a) September 30, 2017 (Unaudited) Shares Value Common Stocks & Other Equity Interests 99.51% Aerospace & Defense 2.65% Raytheon Co. 17,301 $ 3,228,021 Application Software 2.21%
Industry Classification Benchmark (ICB)
") Methodology overview Effective January 1, 2019 Industry Classification Benchmark (ICB) ICB is a single standard that defines the market With approximately 100,000 securities classified worldwide, we provide
Methodology overview Effective January 1, 2019 Industry Classification Benchmark (ICB) ICB is a single standard that defines the market With approximately 100,000 securities classified worldwide, we provide
JUST US Large Cap Diversified Index (JULCD) Calculation Methodology
 Calculation Methodology") JUST US Large Cap Diversified Index (JULCD) Calculation Methodology June 2018 Table of Contents 1 About JUST Capital... 3 2 Important References... 4 3 JUST US Large Cap Diversified Index (JULCD) Summary...
JUST US Large Cap Diversified Index (JULCD) Calculation Methodology June 2018 Table of Contents 1 About JUST Capital... 3 2 Important References... 4 3 JUST US Large Cap Diversified Index (JULCD) Summary...
The Chesapeake Core Growth Fund
 Semi-Annual Report April 30, 2009 (Unaudited) Investment Advisor Administrator Gardner Lewis Asset Management, L.P. Ultimus Fund Solutions, LLC 285 Wilmington-West Chester Pike P.O. Box 46707 Chadds Ford,
Statement of Investments April 30, 2014 (Unaudited)
") Statement of Investments Nationwide HighMark Fund Common Stocks 98.2% Aerospace & Defense 3.9% Airbus Group NV 45,950 $ 3,158,610 Raytheon Co. 34,520 3,295,970 Rockwell Collins, Inc. 42,910 3,331,961 United
Statement of Investments Nationwide HighMark Fund Common Stocks 98.2% Aerospace & Defense 3.9% Airbus Group NV 45,950 $ 3,158,610 Raytheon Co. 34,520 3,295,970 Rockwell Collins, Inc. 42,910 3,331,961 United
indices takes which enables Code, into different stocks, alll the Third, for each industry capitalization 10% and
 Methodology of Industry Group Indices and e Industry Indicess To measure the performancee of sectors of e index and to provide analysis tools for investors, developed the industry group indices and industry
Shares Description Value
 Portfolio of Investments Shares Description Value COMMON STOCKS - 93.0% Aerospace & Defense - 1.9% 33,000 Raytheon Co. (a)... $ 6,157,140 Air Freight & Logistics - 1.7% 24,500 FedEx Corp. (a)... 5,526,710
The Prudential Series Fund
 The Prudential Series Fund SEMIANNUAL REPORT June 30, 2017 Jennison Portfolio Class II Shares Based on the variable contract you own or the portfolios you invested in, you may receive additional reports
Pre-poll Methodology for Asiamoney Brokers Poll 2016
 Pre-poll Methodology for Asiamoney Brokers Poll 2016 Asiamoney s 27 th annual Brokers Poll is scheduled for launch on 4 th July, we invite senior institutional investors at fund management companies, hedge
Quarterly Report May 31, 2018 MFS. Low Volatility Equity Fund
 Quarterly Report May 31, 2018 MFS Low Volatility Equity Fund PORTFOLIO OF INVESTMENTS 5/31/18 (unaudited) The Portfolio of Investments is a complete list of all securities owned by your fund. It is categorized
Stock Market Briefing: S&P 500 Sectors & Industries Forward P/Es 2009-now
 Stock Market Briefing: S&P 00 Sectors & Industries Forward P/Es 09-now October, Dr. Edward Yardeni -972-763 eyardeni@ Joe Abbott 732-497-6 jabbott@ Mali Quintana 40-664-1333 aquintana@ Please visit our
Guggenheim Variable Insurance Funds Summary Prospectus
 5.1.2017 Guggenheim Variable Insurance Funds Summary Prospectus Rydex Domestic Equity Broad Market Fund Inverse Dow 2x Strategy Fund The Fund is very different from most mutual funds in that it seeks to
For the Year Ended October 31, Investor Relations Department. For further information contact: Kelly Milroy or David Lambie
 SUPPLEMENTAL FINANCIAL INFORMATION (Released on January 26, 2012 for the adoption of International Financial Reporting Standards and changes in Segment Reporting) For the Year Ended October 31, 2011 Investor
Tracking. All Portfolio Tracking
 Tracking All Portfolio Tracking 5/15/17 4/30/17 Change $ Change % Portfolio One $42,377.71 $41,514.50 $863.21 2.08% Portfolio Two $33,665.44 $33,334.33 $331.11 0.99% Portfolio Three $17,972.62 $17,761.07
4 Income Summary (Cash Basis) Period ended 04/30/2012 Dividends Interest Total Income. 5 Net Realized Gain (Loss) Summary Period ended
 Period ended 04/30/2012 Dividends Interest Total Income. 5 Net Realized Gain (Loss) Summary Period ended") 2 Account Summary Principal Assets Fixed Income Mutual Funds Income Assets Market value 76,540.43 204,713.50 863,591.14 50,027.35 1,194,872.42 3,913.68 1,198,786.10 Change in Market value Year to Date
2 Account Summary Principal Assets Fixed Income Mutual Funds Income Assets Market value 76,540.43 204,713.50 863,591.14 50,027.35 1,194,872.42 3,913.68 1,198,786.10 Change in Market value Year to Date
THE PRUDENTIAL SERIES FUND
 THE PRUDENTIAL SERIES FUND SEMIANNUAL REPORT JUNE 30, 2012 Jennison Portfolio Class II Shares This report is one of several that provides financial information about certain investment choices available
Duke CE 2017 Global Productivity Awards. Financial Cycle Time: A Metric to Measure Productivity. April 20, 2017
 Duke CE 2017 Global Productivity Awards Financial Cycle Time: A Metric to Measure Productivity April 20, 2017 Agenda Define Financial Cycle Time and its importance Explain the methodology behind rankings
MSCI US REIT INDEX METHODOLOGY
 INDEX METHODOLOGY MSCI US REIT INDEX METHODOLOGY Index Construction and Maintenance Methodology for the MSCI US REIT Index February 2017 FEBRUARY 2017 CONTENTS Introduction... 3 1 Defining REITs and the
Reality Shares DIVCON Leaders Dividend ETF LEAD (Cboe BZX Exchange)
") Reality Shares DIVCON Leaders Dividend ETF LEAD (Cboe BZX Exchange) SUMMARY PROSPECTUS February 28, 2018 Before you invest in the Fund, as defined below, you may want to review the Fund s prospectus and
Reality Shares DIVCON Leaders Dividend ETF LEAD (Cboe BZX Exchange) SUMMARY PROSPECTUS February 28, 2018 Before you invest in the Fund, as defined below, you may want to review the Fund s prospectus and
HSAX PARTNERS, L.P. FINANCIAL STATEMENTS December 31, 2011
 FINANCIAL STATEMENTS December 31, 2011 CONTENTS REPORT OF INDEPENDENT ACCOUNTANTS 1 STATEMENTS OF FINANCIAL CONDITION 2 SCHEDULES OF INVESTMENTS 3/9 STATEMENTS OF INCOME 10 STATEMENT OF CHANGES IN PARTNERS'
BSAN Elite Dividend Annual Report Financial Professional Use Only
 BSAN Elite Report Financial Professional Use Only January 2016 Stocks generally declined moderately in December, with the benchmark S&P 500 Index declining 1.58%. The BSAN Elite Portfolio declined 1.19%
Valuation: S&P 500 Sectors & Industries Forward P/Es
 Valuation: S&P Sectors & Industries Forward P/Es July 27, 16 Dr. Edward Yardeni 16-972-7683 eyardeni@ Joe Abbott 732-497-6 jabbott@ Mali Quintana 48-664-1333 aquintana@ Please visit our sites at www. blog.
PORTFOLIO OF INVESTMENTS 1 ST QUARTER USAA AGGRESSIVE GROWTH FUND OCTOBER 31, 2018
 PORTFOLIO OF INVESTMENTS 1 ST QUARTER USAA AGGRESSIVE GROWTH FUND OCTOBER 31, 2018 (Form N-Q) 48454-1218 2018, USAA. All rights reserved. PORTFOLIO OF INVESTMENTS USAA Aggressive Growth Fund October 31,
Securities (the Fund )
") BZX Information Circular 16-158 Date: December 29, 2016 Re: Elkhorn ETF Trust Pursuant to the Rules of Bats BZX Exchange, Inc. ( BZX ), (referred to hereafter as Bats or the Exchange ), this Information
BZX Information Circular 16-158 Date: December 29, 2016 Re: Elkhorn ETF Trust Pursuant to the Rules of Bats BZX Exchange, Inc. ( BZX ), (referred to hereafter as Bats or the Exchange ), this Information
Franklin ETF. Semi-Annual Management Report of Fund Performance. March 31, 2018
 Franklin ETF Semi-Annual Management Report of Fund Performance March 31, 2018 This semi-annual management report of fund performance contains financial highlights but does not contain the complete financial
SELECT YOUR SECTORS. Respond to Market Cycles with Agility and Precision
 SELECT YOUR SECTORS Respond to Market Cycles with Agility and Precision ECONOMIC CYCLES & SECTORS The economy moves in cycles. Specific sectors may outperform or underperform during different phases, driven
Stock Market Briefing: S&P 500 Sectors & Industries Forward P/Es
 Stock Market Briefing: S&P Sectors & Industries Forward P/Es January 17, 18 Dr. Edward Yardeni 16-972-7683 eyardeni@ Joe Abbott 732-497-6 jabbott@ Mali Quintana 48-664-1333 aquintana@ Please visit our
Schedule of Investments (a) January 31, 2018 (Unaudited)
 January 31, 2018 (Unaudited)") Schedule of Investments (a) January 31, 2018 (Unaudited) Common Stocks & Other Equity Interests 99.29% (b) Apparel Retail 2.17% Pou Sheng International (Holdings) Ltd. (Hong Kong) 9,261,000 $ 2,320,400
Schedule of Investments (a) January 31, 2018 (Unaudited) Common Stocks & Other Equity Interests 99.29% (b) Apparel Retail 2.17% Pou Sheng International (Holdings) Ltd. (Hong Kong) 9,261,000 $ 2,320,400
Axioma Risk Monitor US4 Edition 26 April 2018
 Axioma Risk Monitor US4 Edition 26 April 2018 1. Global volatility hotspots 2. Global correlation hotspots www.axioma.com Greater than 1% rise over last week Greater than 1% fall over last week Greater
Axioma Risk Monitor US4 Edition 3 July 2018
 Axioma Risk Monitor US4 Edition 3 July 2018 1. Global volatility hotspots 2. Global correlation hotspots www.axioma.com Greater than 1% rise over last week Greater than 1% fall over last week Greater than
Axioma Risk Monitor UK Edition 30 January 2019
 Axioma Risk Monitor UK Edition 30 January 2019 1. Global volatility hotspots 2. Global correlation hotspots www.axioma.com Greater than 1% rise over last week Greater than 1% fall over last week Greater
S&P 500 GICS Sector Scorecard (1/26/18) 12-Mo. See the last page for Index % of 500 Price Changes (%)
 12-Mo. See the last page for Index % of 500 Price Changes (%)") S&P 500 GICS Sector Scorecard (1/26/18) 12-Mo. See the last page for Index % of 500 Price Changes (%) 5-Year % Chg. disclosure information. Value or Sector 1 Wk. 13 Wks. YTD 2017 5-Yr CAGR Beta Std. Dev.
S&P 500 GICS Sector Scorecard (1/26/18) 12-Mo. See the last page for Index % of 500 Price Changes (%) 5-Year % Chg. disclosure information. Value or Sector 1 Wk. 13 Wks. YTD 2017 5-Yr CAGR Beta Std. Dev.
ARK Industrial Innovation ETF
 November 30, 2017 ARK Industrial Innovation ETF NYSE Arca, Inc: ARKQ Summary Prospectus Before you invest, you may want to review the Fund s prospectus, which contains more information about the Fund and
Quarterly Report July 31, 2018 MFS. Global Growth Fund
 Quarterly Report July 31, 2018 MFS Global Growth Fund PORTFOLIO OF INVESTMENTS 7/31/18 (unaudited) The Portfolio of Investments is a complete list of all securities owned by your fund. It is categorized
Your clients. account statement. Help your clients understand their TD Ameritrade Institutional monthly. Monthly account statement STOCK01 STOCK02
 Reporting P Guidebook Monthly account statement STOCK0 Your clients account statement GOLDEN FIELDS INVESTMENT SERVICES () 56-7890 STOCK07 STOCK06 EXCHANGE TRADED FUND0 STOCK05 GOLDEN FIELDS INVESTMENT
Global Growth Portfolio
 Quarterly Report September 30, 2018 MFS Global Growth Portfolio MFS Variable Insurance Trust II PORTFOLIO OF INVESTMENTS 9/30/18 (unaudited) The Portfolio of Investments is a complete list of all securities
Franklin ETF. Semi-Annual Management Report of Fund Performance. March 31, 2018
 Franklin ETF Semi-Annual Management Report of Fund Performance March 31, 2018 This semi-annual management report of fund performance contains financial highlights but does not contain the complete financial
John Hancock Retirement Income 2040 Fund
 621Q3 John Hancock Retirement Income 2040 Fund Quarterly portfolio holdings 9/30/17 Fund s investments As of 9-30-17 (unaudited) Rate (%) Maturity date Par value^ Value U.S. Government and Agency obligations
Quarterly Report January 31, 2018 MFS. Global Growth Fund
 Quarterly Report January 31, 2018 MFS Global Growth Fund PORTFOLIO OF INVESTMENTS 1/31/18 (unaudited) The Portfolio of Investments is a complete list of all securities owned by your fund. It is categorized
Semi-Annual Management Report of Fund Performance
 June 30, 2018 Semi-Annual Management Report of Fund Performance This semi-annual management report of fund performance contains financial highlights but does not contain the complete financial statements
AUGUST 31, ANNUAL REPORT
 AUGUST 31, 2017 2017 ANNUAL REPORT ishares Trust ishares Edge MSCI Multifactor Consumer Discretionary ETF CNDF BATS ishares Edge MSCI Multifactor Consumer Staples ETF CNSF BATS ishares Edge MSCI Multifactor
Professional finance calls for a calculation of the weighted average cost of capital, known affectionately as the WACC.
 Whacked on WACC After we have completed the first step in arriving at an EPV (earnings power value) which is to calculate distributable earnings (Think of after-tax owner earnings using true maintenance
JPMorgan Intrepid Growth Fund Schedule of Portfolio Investments as of March 31, 2018 (Unaudited)
") Schedule of Portfolio Investments as of March 31, 2018 (Unaudited) THE UNAUDITED CERTIFIED MUTUAL FUNDS HOLDINGS LIST ( the List ) IS TO BE USED FOR REPORTING PURPOSES ONLY. IT IS NOT TO BE REPRODUCED
Schedule of Portfolio Investments as of March 31, 2018 (Unaudited) THE UNAUDITED CERTIFIED MUTUAL FUNDS HOLDINGS LIST ( the List ) IS TO BE USED FOR REPORTING PURPOSES ONLY. IT IS NOT TO BE REPRODUCED
ICON CONSUMER DISCRETIONARY FUND ICCAX N/A ICCCX ICON CONSUMER STAPLES FUND ICRAX N/A ICLEX ICON ENERGY FUND ICEAX ICEEX ICENX
 PROSPECTUS ICON SECTOR FUNDS JANUARY 23, 2018 CLASS A CLASS C CLASS S ICON CONSUMER DISCRETIONARY FUND ICCAX N/A ICCCX ICON CONSUMER STAPLES FUND ICRAX N/A ICLEX ICON ENERGY FUND ICEAX ICEEX ICENX ICON
Credit Suisse Volaris US Strategies Fund Schedule of Investments April 30, 2016 (unaudited)
") Schedule of Investments Shares COMMON STOCKS (87.9%) SWITZERLAND (1.0%) Garmin Ltd. 4,000 $ 170,520 170,520 UNITED STATES (86.9%) Aerospace & Defense (2.0%) BE Aerospace, Inc. 1,600 77,824 General Dynamics
Schedule of Investments Shares COMMON STOCKS (87.9%) SWITZERLAND (1.0%) Garmin Ltd. 4,000 $ 170,520 170,520 UNITED STATES (86.9%) Aerospace & Defense (2.0%) BE Aerospace, Inc. 1,600 77,824 General Dynamics
Statement of Investments July 31, 2015 (Unaudited)
") Statement of Investments Nationwide HighMark Balanced Fund Common Stocks 64.9% Shares Aerospace & Defense 1.0% Honeywell International, Inc. 1,407 $ 147,805 Air Freight & Logistics 0.4% United Parcel Service,
Statement of Investments Nationwide HighMark Balanced Fund Common Stocks 64.9% Shares Aerospace & Defense 1.0% Honeywell International, Inc. 1,407 $ 147,805 Air Freight & Logistics 0.4% United Parcel Service,
Guggenheim Variable Insurance Funds Summary Prospectus
 5.1.2017 Guggenheim Variable Insurance Funds Summary Prospectus Rydex Domestic Equity Broad Market Fund Inverse S&P 500 Strategy Fund The Fund is very different from most mutual funds in that it seeks
POLICE & FIREFIGHTERS RETIREMENT SYSTEM
 POLICE & FIREFIGHTERS RETIREMENT SYSTEM CUSTODIAL REPORT FOR THE MONTH ENDING SEPTEMBER 30, 2014 PRESENTED BY: Felecia Ryans DISCLAIMER: This communication is for general informational purposes only and
Credit Suisse Volaris US Strategies Fund Schedule of Investments May 31, 2016 (unaudited)
") Schedule of Investments Shares Value COMMON STOCKS (87.4%) SWITZERLAND (1.0%) Garmin Ltd. 4,000 $ 170,080 170,080 UNITED STATES (86.4%) Aerospace & Defense (2.0%) BE Aerospace, Inc. 1,600 76,224 General
Schedule of Investments Shares Value COMMON STOCKS (87.4%) SWITZERLAND (1.0%) Garmin Ltd. 4,000 $ 170,080 170,080 UNITED STATES (86.4%) Aerospace & Defense (2.0%) BE Aerospace, Inc. 1,600 76,224 General
Shares Description Value
 Portfolio of Investments Shares Description Value COMMON STOCKS - 95.0% Aerospace & Defense - 1.4% 30,000 Raytheon Co. (a)... $ 4,083,900 Air Freight & Logistics - 1.9% 32,000 FedEx Corp. (a)... 5,589,760
Fed Funds Rate & S&P 500
 Fed Funds Rate & S&P 500 Figure 1. 20 20 There have been nine major troughs in the federal funds rate since 1960. The tenth is likely to happen this year. The average number of months between troughs is
4Q 2015 REPORT. Exhibit Investing in America s Growth SHAREHOLDER COMMUNICATION ONLY - NOT FOR USE AS SALES MATERIAL
 4Q 2015 REPORT Exhibit 99.2 Investing in America s Growth Fact Sheet Investment Objective Generate current income and, to a lesser extent, long-term capital appreciation through debt and equity investments.
1Q 2016 REPORT Investing in America s Growth
 1Q 2016 REPORT Investing in America s Growth Fact Sheet Investment Objective Generate current income and, to a lesser extent, long-term capital appreciation through debt and equity investments. Performance
Third Quarter 2018 Earnings Presentation
 Third Quarter 2018 Earnings Presentation Forward Looking / Non-GAAP Information This presentation includes forward-looking statements. The matters discussed in this presentation, as well as in future oral
Stock Market Briefing: S&P 500 Sectors & Industries Profit Margins
 Stock Market Briefing: S&P Sectors & Industries Profit Margins August, 1 Dr. Edward Yardeni 1--3 eyardeni@ Joe Abbott 3--3 jabbott@ Please visit our sites at www. blog. thinking outside the box Table Of
QUARTERLY REPORT November 30, 2017 MFS TECHNOLOGY FUND
 QUARTERLY REPORT November 30, 2017 MFS TECHNOLOGY FUND PORTFOLIO OF INVESTMENTS 11/30/17 (unaudited) The Portfolio of Investments is a complete list of all securities owned by your fund. It is categorized
John Hancock ESG Large Cap Core Fund
 467Q3 John Hancock ESG Large Cap Core Fund Quarterly portfolio holdings 7/31/18 Fund s investments As of 7-31-18 (unaudited) Common stocks 99.1% $44,410,414 (Cost $37,537,484) Consumer discretionary 13.3%
IFRS adoption in Kingdom of Saudi Arabia. December 2017
 IFRS adoption in Kingdom of Saudi Arabia December 217 Contents Introduction 3 Executive summary 5 Effects of IFRS adoption: Effects on retained earnings Effects on assets Effects on liabilities 7 Key IFRS
Challenging Markets How to prepare your portfolio?
 21 st National Pension and Institutional Investor Summit Tuesday, November 17, 2015 Challenging Markets How to prepare your portfolio? Topics address current issues such as currency, rates, and alternatives
Category Definitions
 Category Definitions India Morningstar Methodology Paper October 2014 Equity Large-Cap Large-Cap funds primarily consist of stocks from the top 70% market capitalization of the equity market. These funds
JPMorgan Equity Income Fund Schedule of Portfolio Investments as of September 30, 2016 (Unaudited)
") JPMorgan Equity Income Fund Schedule of Portfolio Investments as of September 30, 2016 (Unaudited) THE UNAUDITED CERTIFIED MUTUAL FUNDS HOLDINGS LIST ( the List ) IS TO BE USED FOR REPORTING PURPOSES ONLY.
JPMorgan Equity Income Fund Schedule of Portfolio Investments as of September 30, 2016 (Unaudited) THE UNAUDITED CERTIFIED MUTUAL FUNDS HOLDINGS LIST ( the List ) IS TO BE USED FOR REPORTING PURPOSES ONLY.
Category Definitions India
 ? Category Definitions India Morningstar Research April 2017 Equity Large-Cap Large-Cap funds primarily consist of stocks from the top 70% market capitalization of the equity market. These funds invest
Stock Market Briefing: S&P 500 Sectors & Industries Profit Margins
 Stock Market Briefing: S&P Sectors & Industries Profit Margins December 1, 1 Dr. Edward Yardeni 1--3 eyardeni@ Joe Abbott 3--3 jabbott@ Please visit our sites at www. blog. thinking outside the box Table
FRIEDBERG MULTI-SECTOR FUNDS
 FRIEDBERG MULTI-SECTOR FUNDS Friedberg Currency Fund Ltd. Friedberg Currency Fund II Ltd. Friedberg Equity Hedge Fund Ltd. Friedberg Global Opportunities Fund Ltd. Friedberg Total Return Fixed Income Fund
Performance History. Monthly. Quarterly. Annual. Monthly Total. Quarterly Total
 Performance History End Value Total Return Asset Class Returns EQUITIES Additional Indexes S&P 500 Composite 2,684,123.25 2,679,186.50 2,948,394.50 2,929,794.27 2,867,769.92 2,739,436.06 2,490,773.68 2,434,901.94
Georgia Tech Financial Analysis Lab 800 West Peachtree Street NW Atlanta, GA
 800 West Peachtree Street NW Atlanta, GA 30332-0520 404-894-4395 http:// Dr. Charles W. Mulford, Director INVESCO Chair and Professor of Accounting charles.mulford@mgt.gatech.edu Brandon Miller Graduate
John Hancock ESG Core Bond Fund
 468Q3 John Hancock ESG Core Bond Fund Quarterly portfolio holdings 2/28/18 Fund s investments As of 2-28-18 (unaudited) U.S. Government and Agency obligations 24.7% $12,981,660 (Cost $13,383,628) U.S.
SPDR Series Trust Equity Funds Annual Report June 30, 2014
 SPDR Series Trust Equity Funds Annual Report June 30, 2014 TABLE OF CONTENTS President s Letter to Shareholders... 1 Management s Discussion of Fund Performance & Portfolio Summary (unaudited) SPDR Russell
Second Quarter Fiscal Year 2019 Earnings Three Months Ended September 30, 2018
 APOLLO INVESTMENT CORPORATION Second Quarter Fiscal Year 2019 Earnings Three Months Ended September 30, 2018 October 30, 2018 Disclaimers, Definitions, and Important Notes Forward-Looking Statements We
Lori Calvasina Chief US Equity Strategist / Managing Director
 US Equity Strategy Equity Research Americas/United States Introducing Our New Industry Scorecard Digging Down To GICS Level 3 March 16, 2017 RESEARCH ANALYSTS Lori Calvasina Chief US Equity Strategist
Morningstar Global Fixed Income Classification
 ? Morningstar Global Fixed Income Classification Morningstar Research Effective Oct. 31, 2016 Contents 1 Introduction 2 Super Sectors 10 Sectors Introduction Fixed-Income Sectors The fixed-income securities
financial DiScloSure report
 Filing ID #10010557 financial DiScloSure report Clerk of the House of Representatives Legislative Resource Center 135 Cannon Building Washington, DC 20515 filer information name: Status: State/District: