Give Credit Where Credit is Due: Tracing Value Chains in Global Production Networks
|
|
|
- Sabrina Bruce
- 5 years ago
- Views:
Transcription
1 Give Credit Where Credit is Due: Tracing Value Chains in Global Production Networks Robert Koopman, William Powers and Zhi Wang United States International Trade Commission Shang-Jin Wei Columbia University, CEPR, and NBER The views expressed in this presentation are solely those of the presenter. It is not meant to represent in anyway the official views of the USITC, or of any other organization that the authors are or have been affiliated with. 1
2 Motivation Conceptual Framework Presentation Outline Transparent: block matrix formulation, only three matrixes Complete: decompose gross exports and imports into value-added components, full consistent with official trade statistics Comprehensive: integration of all existing measures in the literature Empirical Results Highlight regional differences in supply chain participation Demonstrate different patterns of integration in three world major trading blocs Show differences in trade costs from multistage production Database improvement and Limitations Why end-use classification is better than proportion assumption What end-use classification can help, what it can t 2
3 Objective of This Paper Help national and international government agencies to find a feasible and cost effective way to remedy the problems in current official trade statistics; Bridge current custom trade statistical system and national account, to make measure of trade consistent with SNA standard. Develop a unified conceptual framework that incorporates all measures of value-added trade in the literature; Completely decompose each country's gross exports to and imports from the world into its value-added components, thus establishing a formal relationship between value-added measures of trade and officially reported trade statistics; Apply the new measure to evaluate the differences in economies participation in global production chain, regional economic integration and trade cost of multi-stage production. 3
4 Exports/GDP % Gross Exports to GDP ratio is a misleading indicator of export dependence Gross export/gdp for large economies in the world, China Brazil India Japan USA EU15 Mexico
5 Messages from National and International Policy Makers Traditional measurement of foreign trade alone no longer suffices to explain how the country fits into the world economy. The time has come to explore new channels so that accounting and statistical systems can take account of the new geography of international trade in an economy which has flattened under the influence of globalization and internationalization of production relations. The challenge is to find the right statistical bridges between the different national accounting systems in order to ensure that international interactions resulting from globalization are properly reflected and to facilitate cross border dialogue between national decision makers The challenge is not only for statisticians, but also for the decision makers responsible for ensuring the proper conduct of domestic and international policy. By Pascal Lamy, Oct. 15,
6 Value Chain in Production Network from a product view to a global view What is a global value chain? A system of value-added sources and destinations within a globally integrated production network Literature Single product: Dedrick, Kraemer, and Linden (2008), ADB(2011) Single country: Hummels, Ishii, Yi (2001), Koopman et al (2008) Asian regional production network: Asian IO table (IDE-JETRO, 2000), Pula and Peltonen (2009); Wang, Powers, and Wei (2009) Global snapshot: Daudin, Rifflart, and Schweisguth (2009); Johnson and Noguera (2009) Global time series: WIOD (2010); Wang et al. (2010) 6
7 Value-added Contents of Trade: Existing measures Hummels, Ishii, and Yi (2001) measures of vertical trade VS: imported contents embodied in a country s exports VS1: Intermediate exports sent indirectly through other countries to final destination Newer measures VAX: Ratio of domestic value-added in gross exports (Johnson and Noguera, 2009) VS1*: domestic value-added in intermediates first exported then returns home (Daudin et al., 2009) reflected exports Not unified in a fully specified transparent framework 7
8 Production and trade in a two-country world All output is used as an intermediate or final good at home or abroad X r A rr with N goods X r A rs X X r : (N 1) Gross output of country r s A rs : (N N) IO Coefficient matrix giving use in country s for intermediate inputs from country r Y rs : (N 1) Final demand: Country s s use of final goods and services from country r Y rr Y rs 8
9 Production and trade in a 2-country world In block matrix notations X X 1 2 A A A A X X 1 2 Y Y Y Y Rearranging, X X 1 2 I A A A I A Y Y Y Y B B B B Y Y 1 2 where B sr : (N N) block Leontief inverse matrix, denoting the amount of total output in s required for a one-unit increase in final demand in country r Y r : (N 1) vector of global use of r s final goods 9
10 Value added Share Matrix in a 2-country world Direct domestic value added in production: V1 u[i A11 A21] and V2 u[i A12 A22] where V r : (1 n) domestic value-added coefficient vector; element v ri = 1 intermediate input share from all countries u: (1 n) vector of ones Value-added shares matrix (2 2N) decomposes value added in production of each sector in all countries VAS VB V1B V 2B V B V 1 2 B V V V 2 10
11 Value-added in gross exports Exports (2N 2) include both intermediate and final goods E E E 2 Value-added exports matrix (2 2) VAS_E V1 B VBE V2B E E (See paper for value-added exports at the product level) 1 1 V B 1 V B E E 2 2 Fully generalizable to a many-country world X ( I A) 1 Y VAS VB VAS _ E VBE BY (G G) 11
12 Unified all existing value-added measures Vertical specialization: both direct (VS) and indirect (VS1) Domestic value added in exports (VAX) Domestic value added in exports that returns home (VS1*) Domestic value added in exports (VAX ratio plus VS1*) VAS_E VBE Diagonal elements: domestic VA in exports Off-diagonal elements: foreign value added in exports Each column sum to unity V1B V2B V3B Direct (VS): Foreign value added from 2 and 3 embodied in country 1 s exports E E E V B V V B B E E E V B V V B B E E E Indirect (VS1): Country 1 s value added embodied in 2 s and 3 s exports 12
13 Gross exports decomposition in a 3-country world Exports (N 1 matrix) include both intermediate and final goods Er Ers s(arsxs Yrs) s r Some intermediates are consumed in s; some are sent elsewhere by s --sent elsewhere-- E rs Y rs Finalgoods ArsX ss Finished in s ArsX sr Processedin s; Consumedin s send back tor A t r, s rsx st Processedin s; send to third countries (1) 13
14 Further decomposition of Value-added Exports DV measures the total domestic value-added embodied in country r's exports: DV r V Further decomposition of value-added exports: combine (1) and (2) r B rr E r (2) DV rs V r B rr V r E B r V rr sr r B A rr sr rs X sr Y rs V V r B r B rr sr rr sr ts, r A rs A X rs ss X st 14
15 Complete Decomposition of Gross Exports Gross exports Domestic value added in exports (VAX) Domestic value added that returns from abroad (VS1*) Foreign value added in exports (VS) Exports consumed by direct importer Indirect exports sent to third countries Final goods Intermediate inputs Final goods Intermediate inputs Final goods Intermediate inputs Indirect valueadded exports (VS1) Further downstream Further upstream in GVCs 15
16 Gross imports at any geographical location should be able to decomposed to the sum of value-added from all sources Complete Decomposition of Gross Imports Value-added in final goods direct from source Value added from source country Gross imports Domestic value added that returns to home (VS1*) Value-added in intermediate goods direct from source Value added from other countries Final goods Intermediate inputs Consumed by the importing country Produce final goods consumed at home Produce final goods reexport to third countries Produce intermediates re-export to third countries Re-export to third countries 16
17 Value-added Exports: Key differences by region Australia, New Zealand Japan EU 15 United States EFTA Canada India South Asia Rest of East Asia Indonesia China Vietnam Thailand Malaysia Philippines Hong Kong Korea Taiwan Russian Federation Brazil Rest of Americas Rest of the world South Africa EU accession countries Mexico World average Advanced economies South Asia Emerging East Asia E. Asia NICs Other emerging Share of Gross Exports Japan sends much of its VA exports to final suppliers indirectly through third countries (see table 3) US uses lots of imported inputs in its exports; imported VA supplied by Canada, Mexico, and US itself E. Asia has the longest chains little of its VA exports is absorbed by direct importer (see table 3) East Asia has the most foreign content in its own exports Integration in NAFTA makes Mexico an outlier among non-asian economies Domestic VA Foreign VA Domestic VA returned 17

18 Further Decomposition of Value-added Exports, 2004 Advanced economies South Asia Emerging East Asia Asia NICs East Asia has less VA in intermediates sent directly to consumer, involve longer production chains than other countries Other emerging
19 Manufacturing Export Destination of the 3 Trading Blocks - Intermediates, final goods and value-added exports, 2004, % East Asia value-added exports depend more on external market than gross trade data show Share of world total East Asia is the world largest destination of intermediate exports Easia-int Easiafinal East Asia = ASEAN Taiwan + Hong Kong Easia-va NAFTAint NAFTAfinal NAFTAva EU-int EU-final EU-va World- Intsh EAsia NAFTA EU Data Source: Value-added trade ROWestimate by the author based on version 7 GTAP database Worldfinalsh Worldvash
20 Manufacturing Import Sources of the 3 Trading Blocks - Intermediates, final goods and value-added imports, 2004, % Both EU and NAFTA are less depend on East Asia as supply source in valueadded term than gross trade data show Share of World East Asia is the world largest import source of final goods Easia-int Easiafinal East Asia = ASEAN Taiwan + Hong Kong Easia-va NAFTAint NAFTAfinal NAFTAva EAsia NAFTA EU ROW EU-int EU-final EU-va World- Intsh Worldfinalsh Worldvash Data Source: Value-added trade estimate by the author based on version 7 GTAP database
21 The integration pattern of East Asia is different from NAFTA & EU Three Major Trading Blocks In the World (1) - Manufacturing exports dependence, 2004, % Final Goods Intermediates Philippines Taiwan Singapore Thailand Hong Kong Indonesia Japan Malaysia Korea China Viet Nam Rest of EAsia Aus & NZL EU 12 EU 15 EFTA Russia Mexico Canada USA Rest of America South Africa Brazil India South Asia Rest of World Intra-East Asia Intra-EU Intra-NAFTA Taiwan Philippines Indonesia Viet Nam Korea Hong Kong Malaysia Thailand Japan Singapore Rest of EAsia China Aus & NZL EU 12 EU 15 EFTA Russia Mexico Canada USA Rest of America South Africa India Brazil South Asia Rest of World Intra-East Asia Intra-EU Intra-NAFTA EAsia EU NAFTA ROW
22 Three Major Trading Blocks In the World (2) - Manufacturing imports dependence, 2004, % Final Goods Intermediates Rest of EAsia Philippines Hong Kong Indonesia Malaysia China Korea Thailand Taiwan Singapore Japan Viet Nam Aus & NZL EU 12 EU 15 EFTA Russia Intra-East Asia Intra-EU Viet Nam Philippines Rest of EAsia China Malaysia Hong Kong Thailand Taiwan Indonesia Singapore Korea Japan Aus & NZL EU 12 EU 15 EFTA Russia Intra-East Asia Intra-EU Canada Mexico USA Rest of America Intra-NAFTA Mexico Canada USA Rest of America Intra-NAFTA South Asia Brazil South Africa Rest of World India India South Asia South Africa Brazil Rest of World EAsia EU NAFTA ROW
23 Three Major Trading Blocks In the World (3) - Manufacturing value-added trade dependence, 2004, % Exports by destination Imports by source Indonesia Hong Kong Philippines Taiwan Malaysia Viet Nam Thailand Korea Rest of EAsia Singapore Japan China Aus & NZL EU 12 EU 15 EFTA Russia Intra-East Asia Intra-EU Rest of EAsia Hong Kong Philippines Viet Nam Malaysia Taiwan Thailand Indonesia China Korea Singapore Japan Aus & NZL EU 12 EU 15 EFTA Russia Intra-East Asia Intra-EU Mexico Canada USA Rest of America Intra-NAFTA Canada Mexico USA Rest of America Intra-NAFTA South Africa Brazil India South Asia Rest of World India South Asia Brazil South Africa Rest of World EAsia EU NAFTA ROW
24 What is Special for East Asia as a Trading Bloc Very high intra-regional dependence on intermediate trade in manufacturing sectors About 70% final manufacturing exports depend on external demand Two major hubs in the production network: Japan and China, one upstream and one downstream, at very different stage of economic development Deeply integrated with vertical specialized or segmented global production chain 24
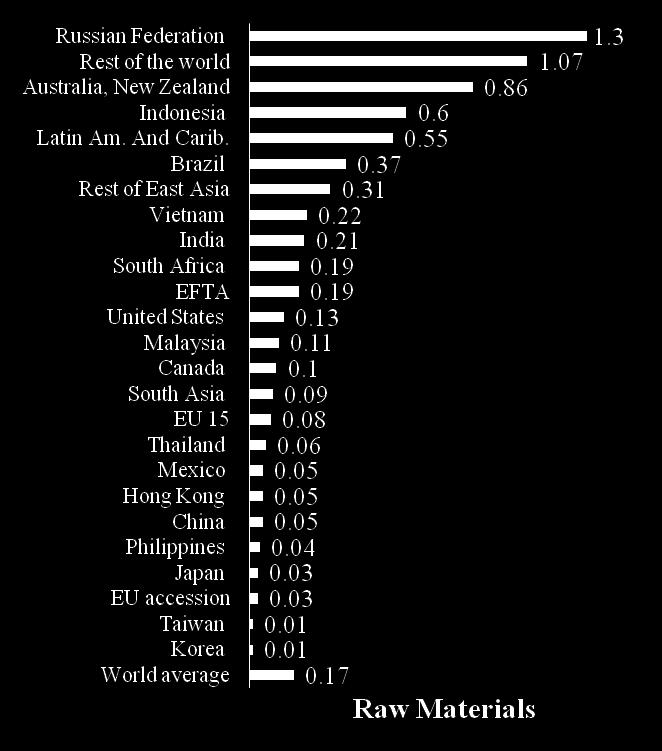
25 Trade costs of multistage production Trade costs (tariff + transport), as a share of export value Canada EFTA EU Japan United States Hong Kong Korea Taiwan China normal China processing Malaysia Thailand Vietnam India Brazil EU accession Mexico normal Mexico processing Russian federation Trade costs on exports Trade costs on imported inputs East Asia pays a price for its long chains and relatively high tariffs Advanced economies have low foreign content and, hence, low costs 25


26 Broad Sector Structure of Value-added Exports VS1/VS Ratios 26
27 Data Base Improvement: MRIO to IRIO Start with 2004 GTAP global trade and production database Add additional detail on source and use of intermediate inputs and final goods, Use end-use categories of detailed trade data (HS6) to improve imported intermediate use coefficients Add detail on processing imports for Mexico and China U.S. imports of electronics from China Apply BEC to 6-digit HS trade data to separate final goods and intermediates Electronics final products Electronics components Allocate its use to each industry based on import source structure Electronics Autos etc. 27

28 Database Construction: MRIO to IRIO Tables MRIO table from GTAP database BEC classification and bilateral trade data at 6 digit HS to separate final and intermediate goods trade Quadratic programming model Processing trade information from China and Mexico IRIO table for global value chain analysis 28
29 Why BEC is Better than Proportional Assumption Intermediate share of U.S. electronic machinery imports, by source Proportion method Japan EU 15 EFTA Canada India Rest of East Asia Indonesia China Vietnam Thailand Philippines Hong Kong Korea Taiwan Russian Brazil EU accession Mexico BEC is able to identify the heterogeneity by sources based on 6- digit HS trade data Proportion method applies share from US import use table (54.2%) to all sources
30 What end-use classifications can help Intermediate goods identified from gross trade flows are the row sum of each block matrix A rs in the IO coefficient matrix A. End use classification such as BEC distinguishes intermediate inputs from final goods in imports from each source in each sector, thus can help improve the accuracy of IO coefficients in IRIO table by giving better row total control for each block matrix in A. End-use classifications improve estimates of intermediate inputs entering the importing country from each sources, therefore is better than the alternative: Proportional method assumes the intermediate share in imports from each source country are the same so it will bias the value-added estimates from each source country, even in aggregate. 30
31 What end-use classifications can t help Still have to assume proportionality to allocate intermediate inputs to each industry within the importing country Required data not reported by most national statistical agencies Problem noted by Committee on Economic Statistics of the American Economic Association (Feenstra et al., 2010) Industry-level estimates of value-added trade based on such IRIO table may be unreliable with unknown biases, despite their theoretical tractability More reliable data collected by national and international agencies are needed to overcome this limitation. 31
32 Conclusions New trade measure in value-added framework Generalizes and harmonizes all measures in the literature Accounts for the entirety of gross trade, establishing a formal relationship between value-added measures of trade and official trade statistics. Provides new detail on regional differences in supply chain activity and trade costs It is now possible to measure trade in value-added terms consistent with official statistics, this will open the possibility for SNA to accept the concept of value-added trade without dramatically change current Custom trade data collection practice. 32
33 Limitations By design, this study is an ex post accounting exercise, we use IRIO table not as a model but as an accounting framework to decompose gross trade. The bias caused by fixed coefficient assumption will be smaller than that in a simulation exercise. It does not examine the causes and the consequences of valueadded trade and global production network. Although an accurate accounting of value added by source country is a necessary step toward a better understanding of these issues. We hope the new measure could be widely used in analytical work in comparison with gross trade data. 33
34 Ê Model Setup and Notations G countries, N industry world Production System : X ( I A) 1 VAS VB Y VAS _ E VBEˆ BY Value-added Share Matrix: Value-added Trade Matrix: Notation Matrix Name Dimension X Gross output GN 1 Y Final demand GN 1 A IO coefficient GN GN Ê Gross exports GN GN B Leontief inverse GN GN Direct value-added V coefficient G GN VAS Value-added share G GN VAS_E Value-added exports G GN 34
35 Malaysia Singapore Hong Kong Viet Nam Rest of east asia Thailand Taiwan Philippines EFTA ROW EU 12 Russian Korea Indonesia China South Africa Canada Rest of America Brazail Mexico South Asia AUS & NZL India EU 15 Japan USA Exports Dependence - Gross and value-added exports as % of GDP, Gross exports Value-added exports Data Source: Value-added trade estimate by the author based on version 7 GTAP database


36 Net Value Added Contribution by Source to Electronics Products Made in East Asia Sold at the U.S. Market Source: Author s estimate based on Asian IO table compiled by IDE of Japan 36


37 Net Value Added Contribution by Source to Wearing Apparel Made in East Asia Sold at the U.S. Market Source: Author s estimate based on Asian IO table compiled by IDE of Japan 37
Give credit where credit is due: Tracing value added in global production chains
 Give credit where credit is due: Tracing value added in global production chains William Powers United States International Trade Commission with Robert Koopman, Zhi Wang, and Shang-Jin Wei June 9, 0 The
Value Chains in East Asian Production Networks An International Input-Output Model Based Analysis
 No. 2009-0-C OFFICE OF ECONOMICS WORKING PPER U.S. INTERNTIONL TRDE COMMISSION Value Chains in East sian Production Networks n International Input-Output Model ased nalysis Zhi Wang* William Powers* U.S.
APEC, East Asia Consortium and Global Imbalance
 APEC, East Asia Consortium and Global Imbalance --for US-JI Symposium 2010 Xiaopeng Yin UIBE, China Presentation Outline 1. Proposed Role and Current Status of APEC Economic integration and regional co-op
Identifying hubs and spokes in global supply chains
 Identifying hubs and spokes in global supply chains with redirected trade in value added Paul Veenendaal Arjan Lejour Hugo Rojas-Romagosa Outline Background and purpose Methodology global input-output
Neil Foster, Robert Stehrer, Marcel Timmer, Gaaitzen de Vries. WIOD conference, april 2012 Groningen
 Neil Foster, Robert Stehrer, Marcel Timmer, Gaaitzen de Vries WIOD conference, 24-26 april 2012 Groningen Local and global value chains (1 st & 2 nd unbundling) From made in [country] to: Made in the World
Measuring Value-Added Trade: Implications for Macroeconomic Policy
 Measuring Value-Added Trade: Implications for Macroeconomic Policy Ranil Salgado (with Mika Saito) Trade and Policy Review Division International Monetary Fund Outline Changing Patterns of Global Trade
Trade Performance in Internationally Fragmented Production Networks: Concepts and Measures
 World Input-Output Database Trade Performance in Internationally Fragmented Production Networks: Concepts and Measures Working Paper Number: 11 Authors: Bart Los, Erik Dietzenbacher, Robert Stehrer, Marcel
Proximity and Production Fragmentation
 Proximity and Production Fragmentation Robert C. Johnson Guillermo Noguera December 30, 2011 Paper Prepared for the 2012 AEA Meetings We thank Nina Pavcnik for helpful conversations, as well as Joseph
Vertical Linkages and the Collapse of Global Trade
 Vertical Linkages and the Collapse of Global Trade Rudolfs Bems International Monetary Fund Robert C. Johnson Dartmouth College Kei-Mu Yi Federal Reserve Bank of Minneapolis Paper prepared for the 2011
The Comparative Advantage of Nations: How Global Supply Chains Change Our Understanding of Comparative Advantage
 The Comparative Advantage of Nations: How Global Supply Chains Change Our Understanding of Comparative Advantage Lauren Dai Harvard College May 2013 M-RCBG Associate Working Paper Series No. 15 Winner
Global Value Chain Participation and Recent Global Business Cycle
 Global Value Chain Participation and Recent Global Business Cycle Zhi Wang University of International Business and Economics & George Mason University Shang-Jin Wei Columbia University Xinding Yu and
Role of RCI in Addressing Developing Asia s Long-term Challenges
 Role of RCI in Addressing Developing Asia s Long-term Challenges Yasuyuki Sawada Chief Economist and Director General Economic Research and Regional Cooperation Department Asian Development Bank International
APEC Development Outlook and the Progress of Regional Economic Cooperation and Integration
 2017/FDM1/004 Session: 1 APEC Development Outlook and the Progress of Regional Economic Cooperation and Integration Purpose: Information Submitted by: Asian Development Bank Finance and Central Bank Deputies
The Next-Generation Interactive APEC Tariff Database
 The Next-Generation Interactive APEC Tariff Database A tool to help SMEs access trading markets in Asia Pacific Initiative by USCIB, NC-APEC, US-ASEAN Business Council, TradeMoves LLC & Mercor Consulting
Trade, Jobs and Value-Added: A new look at EU global trade performance. Lucian Cernat Chief Economist DG Trade
 Trade, Jobs and Value-Added: A new look at EU global trade performance Lucian Cernat Chief Economist DG Trade European Central Bank 2 April 2012 Trade in value added: why all this fuss? Essentially an
Appendix A Specification of the Global Recursive Dynamic Computable General Equilibrium Model
 Appendix A Specification of the Global Recursive Dynamic Computable General Equilibrium Model The model is an extension of the computable general equilibrium (CGE) models used in China WTO accession studies
Measures of Participation in Global Value Chains. and Global Business Cycles
 Measures of Participation in Global Value Chains and Global Business Cycles (Draft for comments) Zhi Wang University of International Business and Economics & George Mason University Shang-Jin Wei Columbia
Accounting for Intermediates: Production Sharing and Trade in Value Added
 Accounting for Intermediates: Production Sharing and Trade in Value Added Robert C. Johnson Dartmouth College Guillermo Noguera Columbia Business School First Draft: July 2008 This Draft: May 2011 Abstract
Slicing Up Global Value Chains
 Slicing Up Global Value Chains Marcel Timmer a Abdul Erumban a Bart Los a Robert Stehrer b Gaaitzen de Vries a (a) Groningen Growth and Development Centre, University of Groningen (b) The Vienna Institute
NBER WORKING PAPER SERIES MEASURES OF PARTICIPATION IN GLOBAL VALUE CHAINS AND GLOBAL BUSINESS CYCLES. Zhi Wang Shang-Jin Wei Xinding Yu Kunfu Zhu
 NBER WORKING PAPER SERIES MEASURES OF PARTICIPATION IN GLOBAL VALUE CHAINS AND GLOBAL BUSINESS CYCLES Zhi Wang Shang-Jin Wei Xinding Yu Kunfu Zhu Working Paper 23222 http://www.nber.org/papers/w23222 NATIONAL
New Measures of (UK) Trade Dependence
 Trade Dependence") New Measures of (UK) Trade Dependence Based on ESCoE paper: Measuring Bilateral Exports of Value Added: A Unified Approach and Application Bart Los and Marcel P. Timmer (University of Groningen and ESCoE)
New Measures of (UK) Trade Dependence Based on ESCoE paper: Measuring Bilateral Exports of Value Added: A Unified Approach and Application Bart Los and Marcel P. Timmer (University of Groningen and ESCoE)
Economic Integration in South East Asia and the Impact on the EU
 Economic Integration in South East Asia and the Impact on the EU Contents Executive summary... 4 1. Introduction... Error! Bookmark not defined. 2. Introduction to State of Economic Integration in South
Potential Effects of Regional Comprehensive Economic Partnership (RCEP) on the Philippine Economy*
 on the Philippine Economy*") Potential Effects of Regional Comprehensive Economic Partnership (RCEP) on the Philippine Economy* Caesar B. Cororaton Presented at the Philippine Institute for Development Studies Quezon City, Metro Manila
Potential Effects of Regional Comprehensive Economic Partnership (RCEP) on the Philippine Economy* Caesar B. Cororaton Presented at the Philippine Institute for Development Studies Quezon City, Metro Manila
Division on Investment and Enterprise
 Division on Investment and Enterprise Readers are encouraged to use the data in this publication for non-commercial purposes, provided acknowledgement is explicitly given to UNCTAD, together with the reference
Modelling Government Procurement in a General Equilibrium Framework
 Global Trade Analysis Project Modelling Government Procurement in a General Equilibrium Framework Presented by Angel Aguiar Based on work with Caitlyn Carrico, Thomas Hertel, Zekarias Hussein, Robert McDougall,
DETERMINANTS OF TRADE IN VALUE-ADDED:
 DETERMINANTS OF TRADE IN VALUE-ADDED: MARKET SIZE, GEOGRAPHY AND TECHNOLOGICAL GAPS May 19-20, 2014 The Third World KLEMS Conference Tokyo, Japan Eiichi NAKAZAWA (Meikai University) Norihiko YAMANO (OECD/DSTI)
Trade in Value-Added and Comparative Advantage. Dr Radford Schantz 25 th INFORUM Conference Riga August 28-September 2, 2017
 Trade in Value-Added and Comparative Advantage Dr Radford Schantz 25 th INFORUM Conference Riga August 28-September 2, 2017 How is TiVA Relevant to Inforum-type Models? 1. The mathematical question Models
The Domestic Segment of Global Supply Chains in China under State Capitalism
 Public Disclosure Authorized Policy Research Working Paper 6960 WPS6960 Public Disclosure Authorized Public Disclosure Authorized The Domestic Segment of Global Supply Chains in China under State Capitalism
The Relative Significance of EPAs in Asia-Pacific
 The Relative Significance of EPAs in Asia-Pacific 10 November 2015 Kenichi Kawasaki GRIPS/JIIA/RIETI 29 October 2011 Overview The relative significance of EPAs in Asia-Pacific TPP and RCEP are shown to
Role of PTAs for Promoting MSMEs Integration in GVCs
 Role of PTAs for Promoting MSMEs Integration in GVCs Masato Abe, Ph.D. IEDS, TIID, ESCAP Regional Dialogue on ENHANCING THE CONTRIBUTION OF PREFERENTIAL TRADE AGREEMENTS TO INCLUSIVE AND EQUITABLE TRADE
Rina Oktaviani Bogor Agricultural University, Indonesia
 Dhaka Roundtable on Reviving the Multilateral Trading System: Post-Bali Issues 23 24 November 2014, Bangladesh Session 6 Post-2015 International ti Development Agenda and Multilateral Trading System by
The Relative Significance of EPAs in Asia-Pacific
 The Relative Significance of EPAs in Asia-Pacific 19 June 2014 Consulting Fellow, RIETI Kenichi Kawasaki 29 October 2011 Overview The relative significance of EPAs in Asia-Pacific TPP and RCEP are shown
Decomposition of Poland s Bilateral Trade Imbalances by Value Added Content
 2017, Vol. 5, No. 2 DOI: 10.15678/EBER.2017.050203 Decomposition of Poland s Bilateral Trade Imbalances by Value Added Content Łukasz Ambroziak A B S T R A C T Objective: The objective of this paper is
Japan s New Trade Policy in Asia-Pacific
 Japan s New Trade Policy in Asia-Pacific August 22, 2013 Shujiro URATA Waseda University 1 Contents I. Japan s Economic Situation II. High Economic Growth and Regional Economic Integration in Asia-Pacific
Understanding International Trade in an Era of Globalization: A Value-Added Approach
 Understanding International Trade in an Era of Globalization: A Value-Added Approach By: Yingying Xu, Ph.D. Economist yxu@mapi.net Manufacturers Alliance for Productivity and Innovation 16 Wilson Blvd,
Essays on Trade and Production Sharing. Guillermo Marcelo Noguera. A dissertation submitted in partial satisfaction
 Essays on Trade and Production Sharing by Guillermo Marcelo Noguera A dissertation submitted in partial satisfaction of the requirements for the degree of Doctor of Philosophy in Economics in the GRADUATE
Asia-Pacific Trade Briefs: Hong Kong, China
 i Asia-Pacific Trade Briefs: Hong Kong, China Merchandise Trade Hong Kong, China has a trade-to-gdp ratio of 386.95%. Merchandise trade accounted for 86.3% of Hong Kong, China's total trade in 2017. Hong
Chinese imports and US labour market adjustment: Insights from value-added trade flows
 Chinese imports and US labour market adjustment: Insights from value-added trade flows Adam Jakubik & Victor Kummritz ERSD, WTO 6 July 2017, ILO 1 / 34 Overview We study the impact of the increased volume
Measuring What Matters in Global Value Chains and Value-Added Trade
 Policy Research Working Paper 8804 Public Disclosure Authorized Public Disclosure Authorized World Development Report 2020 Background Paper Measuring What Matters in Global Value Chains and Value-Added
Paper submitted to 23rd International Input-Output Conference. Revealed Comparative Advantage Based on Value Added Exports: An Analysis for China
 Paper submitted to 23rd International Input-Output Conference Revealed Comparative Advantage Based on Value Added xports: An Analysis for China Kailan Tian, Kunfu Zhu Academy of Mathematics and Systems
Tracing value added in gross exports of the automotive industry : the case of France and Germany
 Tracing value added in gross exports of the automotive industry : the case of France and Germany Katharina Birgitta Längle To cite this version: Katharina Birgitta Längle. Tracing value added in gross
What Drives Foreign Direct Investment in Asia and the Pacific?
 What Drives Foreign Direct Investment in Asia and the Pacific? Fahad Khan Economist Economic Research and Regional Cooperation Department Asian Development Bank International Conference on Regional Integration
Services Development and Comparative Advantage in Manufacturing *
 Services Development and Comparative Advantage in Manufacturing * Xuepeng Liu Kennesaw State University Aaditya Mattoo The World Bank Zhi Wang University of International Business & Economics Shang-Jin
Regional integration in Asia:
 Regional integration in Asia: Trends and Issues Cyn-Young Park Director Economic Research and Regional Cooperation Department Asian Development Bank ADB-ASIAN THINK TANK DEVELOPMENT FORUM 2017: Financing
Journal of International Economics
 Journal of International Economics 86 (22) 224 236 Contents lists available at SciVerse ScienceDirect Journal of International Economics journal homepage: www.elsevier.com/locate/jie Accounting for intermediates:
A General Method to Assess Domestic Value-added in Exports When Processing Trade is Pervasive, with an Application to China
 General Method to ssess omestic Value-added in Exports When rocessing Trade is ervasive, with an pplication to China Robert oopman and Zhi Wang US International Trade Commission Shang-Jin Wei Columbia
ASEAN+3 or ASEAN+6: Which Way Forward?
 ASEAN+3 or ASEAN+6: Which Way Forward? Masahiro Kawai Dean, ADBI Ganeshan Wignaraja Senior Economist, ADB Ten Years After the Crisis: Evolving East Asian Financial System and Challenges 12 June 2007 Tokyo,
Japan s FTA Strategy. August 7, Shujiro URATA Waseda University
 Japan s FTA Strategy August 7, 2014 Shujiro URATA Waseda University 1 Contents I. Japan s Economic Situation II. High Economic Growth and Regional Economic Integration in Asia-Pacific III. Japan s New
Appendix 1. Outline of BOP-Related Statistics and Release Schedule. The following is an overview of major BOP-related statistics.
 Appendix 1. Outline of BOP-Related Statistics and Release Schedule Outline of BOP-related statistics BOP-related statistics can be broadly divided into (1) flow data on various transactions and the associated
A value-added trade perspective on recent patterns in world trade (CEPR)
") KVL Economic Policy Research From the SelectedWorks of Henk LM Kox June, 215 A value-added trade perspective on recent patterns in world trade (CEPR) Paul Veenendaal, CPB Netherlands Bureau for Economic
KVL Economic Policy Research From the SelectedWorks of Henk LM Kox June, 215 A value-added trade perspective on recent patterns in world trade (CEPR) Paul Veenendaal, CPB Netherlands Bureau for Economic
Malaysia s export growth at record high in 2017
 Dr. Mohd Afzanizam Abdul Rashid Chief Economist 03-2088 8075 afzanizam@bankislam.com.my Malaysia s export growth at record high in 2017 Facts Total exports in 2017 grew by 18.9% (2016: 1.2%) to RM935.4
Asia and the Pacific: Economic Outlook. PFTAC Steering Committee Meeting March 27, 2018 Suva, Fiji
 Asia and the Pacific: Economic Outlook PFTAC Steering Committee Meeting March 27, 2018 Suva, Fiji 1 Growth in the region remains strong... Growth Projections: World and Selected Asia (Percent change from
Asia and the Pacific: Economic Outlook and Drivers
 2018/FDM1/004 Session 2.1 Asia and the Pacific: Economic Outlook and Drivers Purpose: Information Submitted by: International Monetary Fund Finance and Central Bank Deputies Meeting Port Moresby, Papua
Strategic benefits Building bridges, shaping globalisation
 Strategic benefits Building bridges, shaping globalisation An even closer relationship Taking a stand for open trade Working together to shape globalisation Strengthening our ties with Asia The EU-Singapore
Economic Outlook and Risks in the APEC Region
 2018/FMM/002 Agenda Item: 1.1 Economic Outlook and Risks in the APEC Region Purpose: Information Submitted by: ADB 25th Finance Ministers Meeting Port Moresby, Papua New Guinea 17 October 2018 Economic
GATS + Liberalization in East Asian FTAs: Architectural Aspects and Achievements
 2007/SOM2/IEG-GOS/WKSP/016 Session 3 GATS + Liberalization in East Asian FTAs: Architectural Aspects and Achievements Submitted by: World Bank Workshop on the Relationship Between Investment and Trade
The Global Economic Crisis: Asia and the role of China Elliott School of International Affairs, George Washington University March 31, 2009
 The Global Economic Crisis: Asia and the role of China Elliott School of International Affairs, George Washington University March 31, 29 Anoop Singh Asia and Pacific Department IMF 1 Five key questions
July 12, 2013 Hanoi,Vietnam
 The 6th Dialogue between Secretary General of ASEAN and Federation of ese Chambers of Commerce and Industry in ASEAN (FJCCIA) July 12, 2013 Hanoi,Vietnam is the principal investor in ASEAN(2011), in terms
Charting Brunei s Economy
 Charting Brunei s Economy Designed to help executives catch up with the economy and incorporate macro impacts into company s planning. Annual subscription includes 2 semiannual issues published in June
Domestic Value-added in China's Exports and its Distribution by Firm Ownership
 Domestic Value-added in China's Exports and its Distribution by Firm Ownership Hong Ma. Zhi Wang. Kunfu Zhu Tsinghua. USITC. CAS International Conference on the Measurement of International Trade and Economic
US Economic Indicators: Import Prices, PPI, & CPI
 US Economic Indicators: Import Prices, PPI, & CPI December 1, 17 Dr. Edward Yardeni 51-97-73 eyardeni@ Debbie Johnson --1333 djohnson@ Please visit our sites at blog. thinking outside the box Table Of
Lecture 6: International Fragmentation
 Lecture 6: International Fragmentation Gregory Corcos Isabelle Méjean International Economics http://www.isabellemejean.com/ensaeinternationaltrade.html 17 December 2014 International Trade Introduction
Enhancing Customs Transparency in APEC. Next Generation APEC Tariff Database
 Enhancing Customs Transparency in APEC Next Generation APEC Tariff Database The Problem ABAC acknowledged the need for more transparency in tariffs and rules of origin in 2009. Lack of publicly available
Global/Regional Economic and Financial Outlook. Odd Per Brekk Director IMF Regional Office for Asia and the Pacific APEC SFOM, June
 Global/Regional Economic and Financial Outlook Odd Per Brekk Director IMF Regional Office for Asia and the Pacific APEC SFOM, June 11-12 2015 2015/SFOM13/002 Session: 1 Global/Regional Economic and Financial
Economic Impact of Canada s Participation in the Comprehensive and Progressive Agreement for Trans-Pacific Partnership
 Economic Impact of Canada s Participation in the Comprehensive and Progressive Agreement for Trans-Pacific Partnership Office of the Chief Economist, Global Affairs Canada February 16, 2018 1. Introduction
International Comparative Evidence on Global Value Chains
 International Comparative Evidence on Global Value Chains International Comparative Evidence on Global Value Chains Koen De Backer and Norihiko Yamano OECD, Directorate for Science, Technology and Industry
The Domestic Segment of Global Supply Chains In China under State Capitalism *
 Federal Reserve Bank of Dallas Globalization and Monetary Policy Institute Working Paper No. 186 http://www.dallasfed.org/assets/documents/institute/wpapers/2014/0186.pdf The Domestic Segment of Global
Legal Review of FTA Tariff Negotiations
 Legal Review of FTA Tariff Negotiations Prof. Jong Bum Kim August 6, 2007 Legal Review of FTA Tariff Negotiations 1. Recent state of FTAs in the world Causes behind FTA Proliferation 2. WTO Consistent
Trade Linkages Between the Belt and Road Economies
 Policy Research Working Paper 8423 WPS8423 Trade Linkages Between the Belt and Road Economies Mauro Boffa Public Disclosure Authorized Public Disclosure Authorized Public Disclosure Authorized Public Disclosure
Yen and Yuan. The Impact of Exchange Rate Fluctuations on the Asian Economies. C. H. Kwan RIETI
 Yen and Yuan The Impact of Exchange Rate Fluctuations on the Asian Economies C. H. Kwan RIETI November 21 The Yen-dollar Rate as the Major Determinant of Asian Economic Growth -4-3 -2 Stronger Yen Yen
International Fragmentation, Specialization and Comparative Advantage: An Asian-Pacific Input-Output Approach
 ! http://www.upo.es/econ/iiomme08 I nternational I nput O utput M eeting on M anaging the E nvironment International Fragmentation, Specialization and Comparative Advantage: An Asian-Pacific Input-Output
U.S. Trade and Industry: A Glimpse Under the Hood
 U.S. Trade and Industry: A Glimpse Under the Hood Michael Sposi May 12, 217 Dallas, TX The views expressed here are those of the author and do not necessarily reflect the views of the Federal Reserve Bank
Impacts on Global Trade and Income of Current Trade Disputes
 Public Disclosure Authorized July 2018 Number 2 Public Disclosure Authorized Public Disclosure Authorized Public Disclosure Authorized Impacts on Global Trade and Income of Current Trade Disputes Caroline
Global Services Forum in association with REDLAS Conference 2018:
 Global Services Forum in association with REDLAS Conference 2018: Knowledge-based for sustainable development 13 14 September 2018, Buenos Aires, Argentina Session I presentation by Ms. Francesca Spinelli,
Statistics List (Balance of Payments)
") Category of Statistics Name of Statistics [Database Name] Name of Items Balance of Payments Balance of Payments [BP01] Balance of Payments (Data Based on the BPM6) Balance of Payments Goods & services
Category of Statistics Name of Statistics [Database Name] Name of Items Balance of Payments Balance of Payments [BP01] Balance of Payments (Data Based on the BPM6) Balance of Payments Goods & services
APEC AND PROGRESS TOWARD BOGOR GOALS
 APEC AND PROGRESS TOWARD BOGOR GOALS Inter-American Development Bank March 2010 This document was prepared by the Integration and Trade Sector (INT) of the Inter-American Development Bank (IDB) for the
Measuring Global Value Chains using the WIOD : Focused on Korea with Major Countries
 Group of Experts on National Accounts Interim meeting on Global Production 3-4 April 2013 Geneva, Switzerland Measuring Global Value Chains using the WIOD : Focused on Korea with Major Countries Yung Taek
Charting Mexico s Economy
 Charting Mexico s Economy Designed to help executives catch up with the economy and incorporate macro impacts into company s planning. Annual subscription includes 2 semiannual issues published in June
Charting Myanmar s Economy
 Charting Myanmar s Economy Designed to help executives catch up with the economy and incorporate macro impacts into company s planning. Annual subscription includes 2 semiannual issues published in June
Five Facts about Value-Added Exports and Implications for Macroeconomics and Trade Research
 Journal of Economic Perspectives Volume 28, Number 2 Spring 2014 Pages 119 142 Five Facts about Value-Added Exports and Implications for Macroeconomics and Trade Research Robert C. Johnson International
DFA Global Equity Portfolio (Class F) Quarterly Performance Report Q2 2014
 Quarterly Performance Report Q2 2014") DFA Global Equity Portfolio (Class F) Quarterly Performance Report Q2 2014 This presentation has been prepared by Dimensional Fund Advisors Canada ULC ( DFA Canada ), manager of the Dimensional Funds.
DFA Global Equity Portfolio (Class F) Quarterly Performance Report Q2 2014 This presentation has been prepared by Dimensional Fund Advisors Canada ULC ( DFA Canada ), manager of the Dimensional Funds.
Why Corporate Governance is Important in APEC Economies
 2008/SOM3/EC/WKSP/007 Agenda Item: 2 Why Corporate Governance is Important in APEC Economies Submitted by: Chile Workshop on Corporate Governance Lima, Peru 17 August 2008 Why Corporate Governance is Important
Economic Integration in Asia: Progress and Challenges
 Economic Integration in Asia: Progress and Challenges Cyn Young Park Director, Regional Cooperation and Integration Division Economic Research and Regional Cooperation Department (ERCD) Asian Development
Characterizing Service Components of China s Manufacturing Exports
 ANNALS OF ECONOMICS AND FINANCE 18-2, 443 469 (2017) Characterizing Service Components of China s Manufacturing Exports Weigang Liu National Academy of Economic Strategy, Chinese Academy of Social Sciences
Methodology Calculating the insurance gap
 Methodology Calculating the insurance gap Insurance penetration Methodology 3 Insurance Insurance Penetration Rank Rank Rank penetration penetration difference 2018 2012 change 2018 report 2012 report
Chikahisa Sumi Director, Regional Office for Asia and the Pacific International Monetary Fund
 Chikahisa Sumi Director, Regional Office for Asia and the Pacific International Monetary Fund (percent YOY) 8 6 Real GDP Growth ASSUMPTIONS A more gradual monetary policy normalization 4 2 21 211 212
TPP11 Agreement in Principle: Japan s Role in Mega-regional Trade Agreements
 TPP11 Agreement in Principle: Japan s Role in Mega-regional Trade Agreements December 15, 2017 Shujiro URATA Waseda University Contents Mega-regional FTA Negotiations Japan s objectives behind mega-regional
DFA Global Equity Portfolio (Class F) Performance Report Q3 2015
 Performance Report Q3 2015") DFA Global Equity Portfolio (Class F) Performance Report Q3 2015 This presentation has been prepared by Dimensional Fund Advisors Canada ULC ( DFA Canada ), manager of the Dimensional Funds. This presentation
DFA Global Equity Portfolio (Class F) Performance Report Q3 2015 This presentation has been prepared by Dimensional Fund Advisors Canada ULC ( DFA Canada ), manager of the Dimensional Funds. This presentation
DFA Global Equity Portfolio (Class F) Performance Report Q2 2017
 Performance Report Q2 2017") DFA Global Equity Portfolio (Class F) Performance Report Q2 2017 This presentation has been prepared by Dimensional Fund Advisors Canada ULC ( DFA Canada ), manager of the Dimensional Funds. This presentation
DFA Global Equity Portfolio (Class F) Performance Report Q2 2017 This presentation has been prepared by Dimensional Fund Advisors Canada ULC ( DFA Canada ), manager of the Dimensional Funds. This presentation
DFA Global Equity Portfolio (Class F) Performance Report Q3 2018
 Performance Report Q3 2018") DFA Global Equity Portfolio (Class F) Performance Report Q3 2018 This presentation has been prepared by Dimensional Fund Advisors Canada ULC ( DFA Canada ), manager of the Dimensional Funds. This presentation
DFA Global Equity Portfolio (Class F) Performance Report Q3 2018 This presentation has been prepared by Dimensional Fund Advisors Canada ULC ( DFA Canada ), manager of the Dimensional Funds. This presentation
DFA Global Equity Portfolio (Class F) Performance Report Q4 2017
 Performance Report Q4 2017") DFA Global Equity Portfolio (Class F) Performance Report Q4 2017 This presentation has been prepared by Dimensional Fund Advisors Canada ULC ( DFA Canada ), manager of the Dimensional Funds. This presentation
DFA Global Equity Portfolio (Class F) Performance Report Q4 2017 This presentation has been prepared by Dimensional Fund Advisors Canada ULC ( DFA Canada ), manager of the Dimensional Funds. This presentation
Exchange Rate Volatility, Exports and Global Value Chains
 RIETI-IWEP-CESSA Joint-Worshop Exchange Rates and International Currency: Perspective from China and Japan 19 November 2016 Exchange Rate Volatility, Exports and Global Value Chains Kiyotaa Sato and Shajuan
Extending the Input-Output Table Based on Firm-level Data
 Extending the Input-Output Table Based on Firm-level Data Heiwai Tang Fei Wang Zhi Wang CESIFO WORKING PAPER NO. 5811 CATEGORY 8: TRADE POLICY MARCH 2016 An electronic version of the paper may be downloaded
PMITM. The world s leading economic indicator
 PMITM The world s leading economic indicator The Purchasing Managers IndexTM (PMITM) is based on monthly surveys of carefully selected companies representing major and developing economies worldwide. KEY
Measuring Trade in Value-Added and Beyond
 Upjohn Institute Press Measuring Trade in Value-Added and Beyond Nadim Ahmad Organisation for Economic Co-operation and Development Chapter 6 (pp. 165-204) in: Measuring Globalization: Better Trade Statistics
Vietnam. HSBC Global Connections Report. October 2013
 HSBC Global Connections Report October 2013 Vietnam The pick-up in GDP growth will be modest this year, with weak domestic demand and exports still dampening industrial confidence. A stronger recovery
Presented by S K Mohanty, Fellow, RIS
 Economics of an East Asian FTA Presented by S K Mohanty, Fellow, RIS 1 Structure of Presentation Sustainability of the Asian Eco. Community East Asia FTA emerging as a Mega RTA Changing structure of regional
TRADE IN VALUE ADDED: NEW ZEALAND
 TRADE IN VALUE ADDED: NEW ZEALAND The international fragmentation of production in global value chains (GVCs) challenges the way we look at the global economy. Today, what you do - the activities a firm
Table 3: The Growth of Macro Economy in Asian Countries in 2005 and the estimation of 2006
 INTERNATIONAL ECONOMY Asia remain to be the center of the world economic growth, particularly Southeast Asia and East Asia, which held 7.5% growth in 2005, compared to the economic growth in developed
GGDC RESEARCH MEMORANDUM 138
 GGDC RESEARCH MEMORANDUM 138 Globalization or Regionalization? A New Approach to Measure International Fragmentation of Value Chains Bart Los, Marcel P. Timmer and Gaaitzen J. de Vries August 2013 university