H Results Presentation
|
|
|
- Randall Underwood
- 6 years ago
- Views:
Transcription


1 H Results Presentation Tuesday, 22 August 2017 Michael Carvill, Managing Director Deirdre Corcoran, Financial Controller & Company Secretary Jeremy Dibb, Corporate Development & Investor Relations
2 Disclaimer This Presentation (the Presentation ) has been prepared and issued by Kenmare Resources plc (the Company or Kenmare ). While this Presentation has been prepared in good faith, the Company and its respective officers, employees, agents and representatives expressly disclaim any and all liability for the contents of, or omissions from, this Presentation, and for any other written or oral communication transmitted or made available to the recipient or any of its officers, employees, agents or representatives. No representations or warranties are or will be expressed or are to be implied on the part of the Company, or any of its respective officers, employees, agents or representatives in or from this Presentation or any other written or oral communication from the Company, or any of its respective officers, employees, agents or representatives concerning the Company or any other factors relevant to any transaction involving the Company or as to the accuracy, completeness or fairness of this Presentation, the information or 2 opinions on which it is based, or any other written or oral information made available in connection with the Company. This Presentation does not constitute or form part of, and should not be construed as, an offer, invitation or inducement to purchase or subscribe for any securities of the Company nor shall it or any part of it form the basis of, or be relied upon in connection with, any contract or investment decision relating to such securities, nor does it constitute a recommendation regarding the securities of the Company. This Presentation is as of the date hereof. This Presentation includes certain statements, estimates and projections provided by the Company with respect to the anticipated future performance of the Company or the industry in which it operates. Such statements, estimates and projections reflect various assumptions and subjective judgments by the Company s management concerning anticipated results, certain of which assumptions and judgments may be significant in the context of the statements, estimates and projections made. These assumptions and judgments may or may not prove to be correct and there can be no assurance that any projected results are attainable or will be realised. In particular, certain statements in this Presentation relating to future financials, results, plans and expectations regarding the Company s business, growth and profitability, as well as the general economic conditions to which the Company is exposed, are forward looking by nature and may be affected by a variety of factors. The Company is under no obligation to update or keep current the information contained in this Presentation, to correct any inaccuracies which may become apparent, or to publicly announce the result of any revision to the statements made herein and any opinions expressed in the Presentation or in any related materials are subject to change without notice.
3 H Highlights Production Cash costs EBITDA Ilmenite >1,000,000t last 12m US$131/t 14% YoY US$30m US$41m YoY Net debt to US$39m Ilmenite prices 61% YoY + H2 contract increases Zircon prices 6% YoY + improving On track to achieve full year guidance 3
4 Operating Overview Annual Production (000t) EBITDA (US$m) Guidance range H2 H H1 H * Ilmenite (LHS) Zircon (RHS) 0 20 H1 H2 H1 H2 H1 H2 H Production benefitting from increased utilisation (operating hours) of mining plants H production of Heavy Mineral Concentrate +18%, ilmenite +25% and zircon +32% US$41m improvement in H1 17 EBITDA from H1 16 Safety improvements LTIFR 1 decreased to 0.23 from 0.37 (H1 2016) * Guidance provided on 16 January Lost Time Injury Frequency Rate per 200,000 hours worked 4
5 2017 Guidance 2017 Guidance* Production Ilmenite kt 950,000 1,050,000 Zircon kt 72,000 83,000 of which primary kt 47,000 52,500 of which secondary kt 25,000 30,500 Rutile kt 9,000 10,000 Costs Total cash operating costs US$m Cash costs per tonne of finished product US$/t H production of ilmenite and primary zircon tracking favourably against guidance Primary / secondary production volumes may be affected by on going projects to capture a higher proportion of zircon in primary products * Guidance provided on 16 January
6 2017 H1 Financial Results
7 H Financial Results Summary Production (1) 26% H1 17: 546,900t H1 16: 434,400t Revenue 82% H1 17: US$102m H1 16: US$56m Cash costs (2) 14% H1 17: US$131/t H1 16: US$153/t EBITDA US$41m H1 17: US$30m H1 16: (US$11m) Net Profit US$56m H1 17: US$9m H1 16: (US$47m) Net Debt US$6m 30/06/17:US$39m 31/12/16: US$45m Strong first half 2017 performance 1. Total final product production ilmenite, zircon, rutile 2. Total cash cost per tonne of finished product 7
8 H Income Statement Review H H US$m US$m Comment Revenue % (volumes +21%, average prices +50%) Cost of Sales & Other Opex (87.4) (81.1) +8% on increased sales volumes (depreciation $14.8m) Operating profit/(loss) 15.0 (24.9) $39.9m improvement Net finance costs (3.4) (21.5) Lower debt levels and reduced interest rate Foreign exchange loss (1.8) (2.7) FX loss on payables and bank balances Profit/(loss) before tax 9.8 (49.1) Tax (charge)/credit (0.5) 1.9 Deferred tax asset utilised in H Profit/(loss) after tax 9.3 (47.2) $56.5m improvement H1 17 EBITDA US$29.8m up from negative US$10.7m in H
9 H Revenue Review Shipments (000 s tonnes) Price (US$/tonne) $200 $1,000 $ $150 $750 $ $100 $500 $ H H H H H $50 H H H H H $250 Ilmenite Primary Zircon Secondary Zircon Ilmenite (LHS) Primary Zircon (RHS) H1 17 Ilmenite volumes up 19%, prices up 61% H1 17 Primary zircon volumes up 46%, prices up 6% H1 17 Average price per tonnes shipped up 54% to US$186/t from US$121/t H1 17 volumes lower than H2 16 due to the timing of shipments 1 Primary zircon includes Standard and Special Grade 2 All prices on an FOB (Free On Board) basis received prices excluding shipping costs 9
10 Cash Operating Costs H H US$m US$m Cost of Sales Other Operating Costs (1) Freight (CIF charged to customers) (2.9) (2.4) Total Depreciation (14.8) (14.2) Share based payments (0.4) (0.1) Finished product movements Adjusted cash operating costs % Finished Product Production 546, ,400 26% Total cash cost per tonne (1) $131 $153 14% Cost management + increased production = significant unit cost reduction (1) Total cash cost per tonne of finished product is an all in cost including all company S,G&A 10
11 Sustainable Cost Reductions 220 1, ,000 US$/t 160 Tonnes * 500 Final Product Production (RHS) Unit cash costs (LHS) * 2017 numbers based on guidance given on 16 January Total cash cost per tonne of finished product is an all in cost including all company S,G&A 11 H Cash Operating Cost US$131/t, 14% reduction on H FX headwinds in H strengthening Rand & Metical Phased replacement of rented mobile equipment with owned fleet
12 Net Debt Reductions US$m Net debt Dec 16 Operating cashflow PPE Inventories Debtors Creditors Interest payment Net debt June 17 Operating cashflow of US$30.1 million in H Working capital increase of US$10.5 million Inventories fluctuate with shipments from period to period Factoring less invoices to reduce costs, retains flexibility Creditors reduced by US$1.0 million 12
13 Balance Sheet Review at 30 June Jun 17 US$m 31 Dec 16 Comment US$m Property, plant & equipment US$9.5m additions + US$1.5m closure cost adj US$14.8m depreciation Inventories Final mineral products US$32.7m, consumables US$19.8m Trade & other receivables Receivables US$23.1m, prepayments US$5.4m Deferred tax asset KMML tax losses utilised in period Cash Total assets Equity & reserves Profit US$9.4m, share based payment US$0.4m Bank loans Principal US$100m plus interest US$2.8m Trade & other payables Includes final US$2.9m arbitration payment notified Provisions US$1.5m increase in mine closure provision Total equity & liabilities
14 Capital Expenditure Sustaining capital expected to average US$20m annually in medium term 2016 sustaining capital constrained at US$6.7m 2017 sustaining capital expected to be approx. US$25m: including US$5m carry over from low 2016 sustaining capital purchase of mobile equipment replacement will reduce rental costs H PPE additions of US$9.5m Sustaining capital of US$9m Feasibility study spends of US$0.5m H feasibility studies expected to cost ~US$3.0m 14
15 Principal Debt Repayments US$m Repayment holiday finishes in February 2018 Scheduled repayments exclude partial cash sweep from February 2018 All debt now USD denominated 15


16 Outlook
17 Mine development strategy Wet Concentrator Plant B upgrade From 2,000 to 2,400tph Definitive Feasibility Study expected Q Wet Concentrator Plant C Located in higher grade Pilivilli zone Pre Feasibility Study progressing well Assessing options which may significantly reduce (or defer) capital whilst optimising production volumes 17
18 Market Overview Kenmare Supply/Demand Forecast 10,000 '000 TiO2 units 8,000 6,000 4, Potential New Supply Demand Existing Supply Solid demand growth from end use pigment sector in H Strong H1 price growth for ilmenite, further price increases agreed for contracted volumes in H2 2017, but the feedstock market in China has been weaker recently Higher prices have incentivised additional supply; lower quality ilmenite and concentrates entering the Chinese market (includes sales from stockpiles, which are not expected to provide long term supply) Improving zircon market conditions due to supply constraints and recovering demand 18

19 Summary
20 Company Strategy Structured and disciplined approach to capital management ST Short Term MT Medium Term Maintain robust balance sheet and generate free cash flow Optimise mining capacity for market conditions Increase utilisation rates and revenue capture Deliver shareholder returns Continue to drive down cash costs Balance sheet optimisation Deliver safe operations 20


21 Appendices
22 H Cash Operating Costs Production Overheads 13% Fuel 8% Other 9% H Logistics & Travel 10% Distribution Costs 5% Production Overheads 13% Labour payroll 25% Fuel 12% Other 12% Logistics & Travel 9% H Distribution Costs 5% Labour payroll 25% Power 11% Repairs & Maintenance 21% Power 8% Repairs & Maintenance 20% Operating costs largely fixed Rounding may cause total percentages to higher or lower than 100%. 22
 Total revenue increased by 82% to US$102.4m (H1 2016: US$56.")
 received prices excluding shipping costs +62% +46% +19% Ilmenite (US$/t) $200 $180 $160 $140 $120")
23 2017 Revenue Review H1 Shipments (000's tonne's) Volume/Mix Movement Pricing Movement (FOB) 1 2 H H Ilmenite Primary Zircon Secondary Zircon H sales volumes increased by 21% to 535,700 tonnes (H1 2016: 441,700 tonnes) Total revenue increased by 82% to US$102.4m (H1 2016: US$56.2m) Ilmenite volumes up 19%, prices (FOB) up 61% Primary zircon volumes up 46%, prices (FOB) up 5% Secondary zircon volumes up 62%, prices (FOB) up 35% Average price per tonnes shipped (FOB) up 54% to US$186/t from US$121/t 1 Primary zircon includes Standard and Special Grade 2 Free On Board (FOB) received prices excluding shipping costs +62% +46% +19% Ilmenite (US$/t) $200 $180 $160 $140 $120 $100 $80 $60 $40 $20 $0 Primary Zircon Price Ilmenite Price H H % +5% $1,000 $900 $800 $700 $600 $500 $400 $300 $200 $100 $0 Primary Zircon (US$/t) 23
24 Group Lenders at 30 June 2017 Loan principal Loan interest Loan balance US$ 000 US$ 000 US$ 000 Senior Loans AfDB 4, ,353 Absa 14, ,943 EAIF EIB 1, ,579 FMO 1, ,668 KfW IPEX Bank (Hermes) 1, ,322 KfW IPEX Bank (MIGA) 1, ,525 Total Senior Loans 25, ,893 Subordinated Loans EIB 43,877 1,364 45,241 EAIF 17, ,859 FMO 13, ,819 Total Subordinated Loans 74,600 2,319 76,919 Total Group Loans 100,000 2, ,812 24
25 Adjusted Cash Operating Costs H H Change YoY US$ 000 US$ 000 US$ 000 % Logistics & Travel 7,124 5,972 1,152 19% Distribution Costs 3,055 3, % Labour payroll 17,165 16, % Repairs & Maintenance 14,668 13,590 1,078 8% Power 7,200 6,106 1,094 18% Fuel 3,962 4, % Production Overheads 9,138 8, % Other 9,067 7,997 1,070 13% 71,379 66,571 4,808 7% Logistics & travel up 19% - increase due to higher volumes of plant spares transported to the mine Labour costs due to higher catering, training and recruitment costs Repairs & maintenance up 8% mainly as a result of increase in production Electricity costs up 18% due to increase mine infrastructure increasing power demand Fuel costs down 16% due to lower fuel prices Production overheads up 10% due to increased head office costs 25
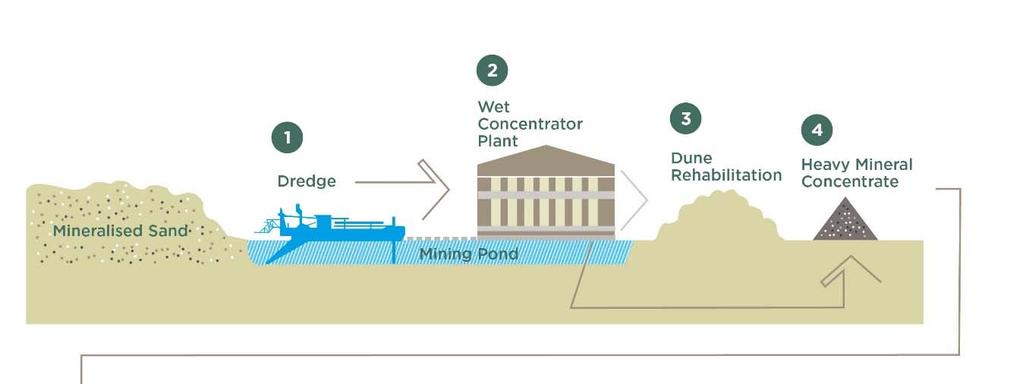
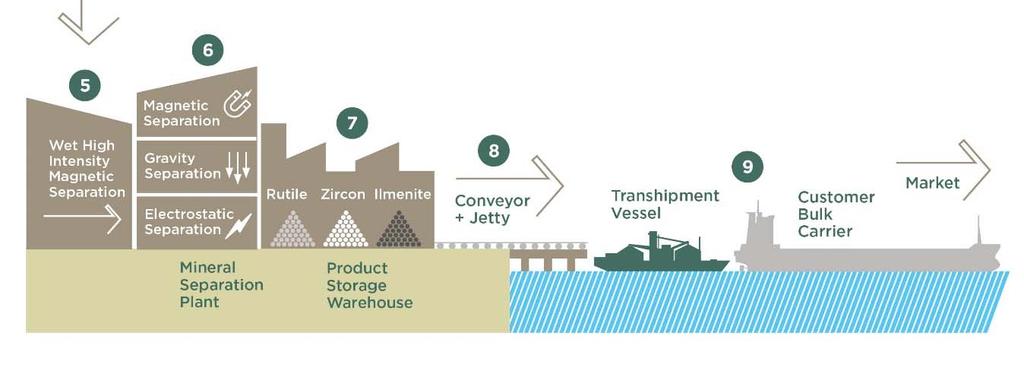
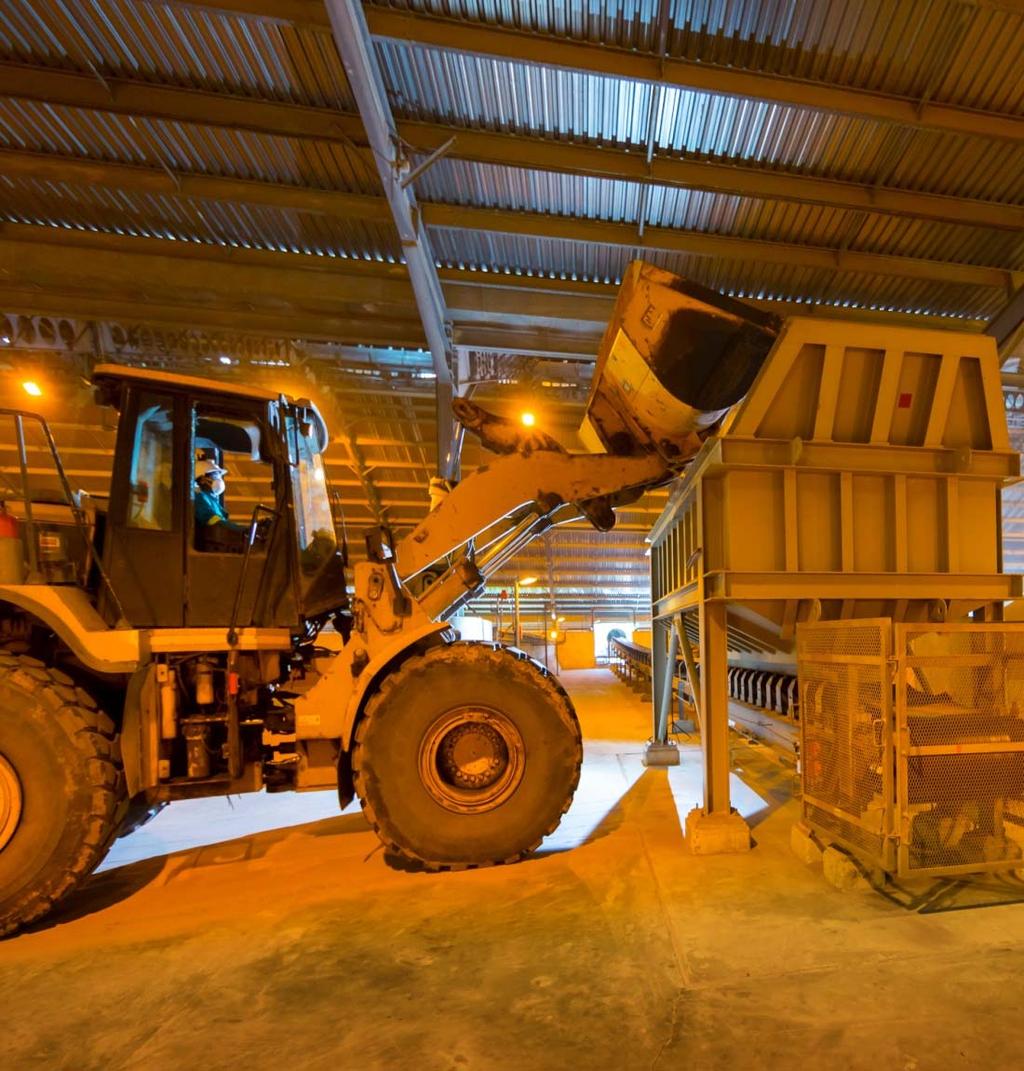
26 Operations schematic 26

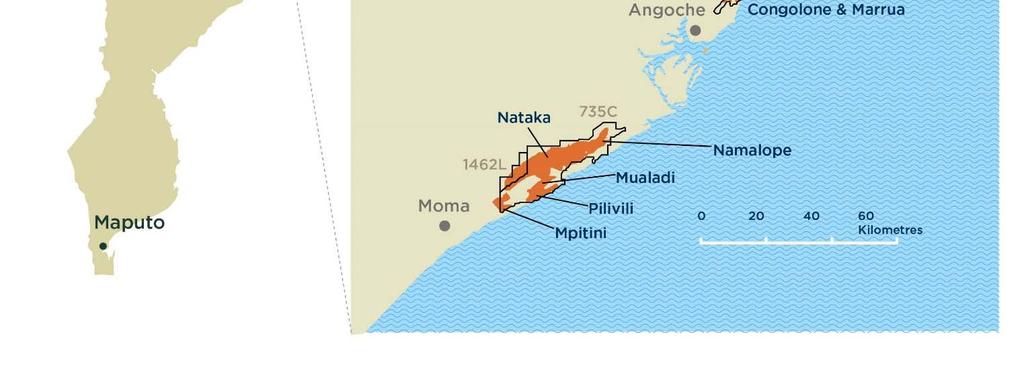
27 Map of license areas 27
Kenmare Resources plc Past, present & future. TZMI Congress, Hong Kong 2016
 Kenmare Resources plc Past, present & future. TZMI Congress, Hong Kong 2016 L I S T E D P R E M I U M Disclaimer This Presentation (the Presentation ) has been prepared and issued by Kenmare Resources
16/10/2018 Q Production Report, Capital Markets Day and Adoption of Dividend Policy - RNS - London Stock Exchange
 Regulatory Story Go to market news section Kenmare Resources PLC - KMR Released 07:00 16-Oct-2018 Q3 2018 Production Report, Capital Markets Day and Adoption of Dividend Policy Kenmare Resources plc (
Positioned for Growth. TZMI Congress 2016, Hong Kong 8 th November 2016
 Positioned for Growth TZMI Congress 2016, Hong Kong 8 th November 2016 Disclaimer and important notices This document has been prepared by Base Resources Limited ( Base Resources ). Information in this
MDL INVESTOR PRESENTATION
 MDL INVESTOR PRESENTATION Investor Presentation April 2018 ASX: MDL STATEMENTS MDL OVERVIEW Mineral Deposits Limited (MDL) jointly owns and manages the TiZir Limited (TiZir) joint venture, which owns 90%
Disclaimer. No offer of securities This presentation does not constitute an offer to sell or the solicitation of an offer to buy any securities.
 Disclaimer Forward looking statements Certain statements in this document are not historical facts and are or are deemed to be forward-looking. NWR s prospects, plans, financial position and business strategy,
MDL UPDATE ASX: MDL. Investor Presentation September 2017
 MDL UPDATE ASX: MDL Investor Presentation September 2017 STATEMENTS MDL OVERVIEW MDL s primary asset is a 50% interest in the TiZir joint venture, which owns the Grande Côte mineral sands operation (GCO)
The Realities of Rutile-Titanium 2014
 Iluka Resources Limited The Realities of Rutile-Titanium 2014 Robert Hudson, Vice President TiO 2 Sales The Americas, Europe and Middle East 24 September 2014 1 Disclaimer Forward Looking Statements Forward
Iluka Resources Limited
 Iluka Resources Limited Iluka Getting Set In The Cycle TZMI Congress 2016 Matt Blackwell - Head of Marketing Hong Kong, 8 November 2016 Disclaimers Forward Looking Statements Slide 24 Important Notice
Kenmare Resources plc. Half Yearly Financial Report. for the period ended 30 June 2016
 Kenmare Resources plc Half Yearly Financial Report for the period ended 30 June 2016 Contents Interim Management Report 1 Responsibility Statement 14 Independent Review Report to the Members of Kenmare
REVIEWED GROUP INTERIM RESULTS AND INTERIM DIVIDEND DECLARATION
 REVIEWED GROUP INTERIM RESULTS AND INTERIM DIVIDEND DECLARATION Six-month period ended 30 June 2009 Presentation Sipho Nkosi : Chief Executive Officer Wim de Klerk : Finance Director 20 August 2009 Disclaimer
Fortescue Metals Group
 Fortescue Metals Group March 2019 Together we are Fortescue Forward looking statements Disclaimer Important Notice The purpose of this presentation is to provide general information about Fortescue Metals
Iluka Resources Limited
 Iluka Resources Limited Presentation to Resources Investor Roadshow Dr Robert Porter, General Manager Investor Relations 27 & 29 September 2016 Disclaimer Forward Looking Statements Forward Looking Statements
December Quarter 2014 Review*
 December Quarter 2014 Review* 29 January 2015 *This presentation should be read in conjunction with the December quarter 2014 activities report 2 Key points Strong quarterly production performance: quarterly
Avocet Mining. Annual General Meeting. 2 nd May 2013
 Avocet Mining Annual General Meeting 2 nd May 2013 Page 1 Quality portfolio of assets Inata Gold Mine o Producing mine with significant exploration potential o Inata cashflows strengthened following reprofiled
Half Yearly Financial Report 2011
 Half Yearly Financial Report 2011 Kenmare Resources plc Contents Interim Management Report 1 Responsibility Statement 8 Independent Review Report to the Members of Kenmare Resources plc 9 Group Condensed
Half Year Financial Results to 31 December 2017
 21 February 2018 Half Year Financial Results to 31 December 2017 Fortescue Metals Group Limited (ASX: FMG, Fortescue) Net profit of US$681 million and interim dividend of A$0.11 per share Fortescue has
Broadening Base Creating a unique mineral sands company. Africa Down Under Conference 30 August 2018
 Broadening Base Creating a unique mineral sands company Africa Down Under Conference 30 August 2018 Click to edit Master text styles Second level Third level Fourth level Fifth level Disclaimer and Important
Capital Markets Day th October 2018
 Capital Markets Day 2018 16th October 2018 Disclaimer This Presentation (the Presentation ) has been prepared and issued by Kenmare Resources plc (the Company or Kenmare ). While this Presentation has
Group financial results presentation for the 12-month period ended 31 December 2009
 Group financial results presentation for the 12-month period ended 31 December 2009 Overview Sipho Nkosi: Chief Executive Officer Overview 15% decrease in lost time injury frequency rate to 0,33 8% increase
Interim Condensed Consolidated Unaudited Financial Statements of TiZir Limited for the half-year ended 30 June Registered No:
 Interim Condensed Consolidated Unaudited Financial Statements of TiZir Limited for the half-year ended 30 June 2018 Registered No: 07727671 TABLE OF CONTENTS This report does not include all the notes
2016 Half Year Financial Results. Presentation
 2016 Half Year Financial Results Presentation 10 AUGUST 2016 Disclaimer Forward looking statements This presentation has been prepared by OZ Minerals Limited ( OZ Minerals ) and consists of written materials/slides
A N N U A L R E S U L T S for the year ended 30 September Discover Develop Deliver
 A N N U A L R E S U L T S for the year ended 30 September 2018 Discover Develop Deliver HIGHLIGHTS RECORD PRODUCTION YEAR FOR ALL PGM AND CHROME PRODUCTS FREE CASH FLOW PER SHARE US$ 18.9 cents (FY2017:
2018 Interim Financial Results 24 July 2018
 2018 Interim Financial Results 24 July 2018 DISCLAIMER Certain statements made in this presentation constitute forward-looking statements. Forward-looking statements are typically identified by the use
Q Results Overview
 Q1 2017 Results Overview 2 Disclaimer This presentation does not constitute, or form part of, any offer to sell or issue or any solicitation of any offer to purchase or subscribe for, any shares in Caledonia
2017 Full Year Results
 2017 Full Year Results Tom O Leary, Managing Director Doug Warden, Chief Financial Officer 27 February 2018 Jacinth-Ambrosia, South Australia Disclaimer Forward Looking Statements This presentation has
1. Based on the assumption of foreign exchange rate of 60 roubles per dollar
 Total gold output declined by 7% q-o-q to 640 koz. The Company sold a total of 644 koz of gold, down 8% q-o-q. Revenue totaled $774 mln, down 7% q-o-q, reflecting seasonally lower sales from alluvials
Sustainable Competitive and Reliable Supplier of Iron Ore
 Sustainable Competitive and Reliable Supplier of Iron Ore Forward looking statements Disclaimer Important Notice The purpose of this presentation is to provide general information about Fortescue Metals
FY 2017 Results Overview
 FY 2017 Results Overview 2 Disclaimer This presentation about our results for the year ending 31 December 2017 (the Year ) and fourth quarter of 2017 (the Quarter or Q4 ) does not constitute, or form part
Third quarter October 28, 2009
 Third quarter 2009 October 28, 2009 Disclaimer Forward-Looking Statements This document may contain forward-looking information and statements about ArcelorMittal and its subsidiaries. These statements
Overview Sipho Nkosi: Chief Executive Officer
 Overview Sipho Nkosi: Chief Executive Officer Highlights LTIFR* LTIFR down from 0,33 to 0,25 0,36 0,39 0,33 0,25 14% increase in revenue to R17 billion 3% increase in coal production to 47Mt 105% increase
2009 FULL YEAR FINANCIAL RESULTS
 OZ MINERALS 2009 FULL YEAR FINANCIAL RESULTS TERRY BURGESS MANAGING DIRECTOR & CEO ANDREW COLES CHIEF FINANCIAL OFFICER 25 February 2010 WWW.OZMINERALS.COM OZ MINERALS NOVEMBER 2009 PAGE 1 IMPORTANT NOTICE
Third quarter 2009 Media Presentation. October 28, 2009
 Third quarter 2009 Media Presentation October 28, 2009 Disclaimer Forward-Looking Statements This document may contain forward-looking information and statements about ArcelorMittal and its subsidiaries.
For personal use only
 Iluka Resources Limited Sierra Rutile Acquisition 9 December 2016 Overview Tom O Leary, Managing Director and CEO 2 Important Notices This presentation contains information regarding Sierra Rutile Limited
2016 ANNUAL RESULTS 14 FEBRUARY 2017
 2016 ANNUAL RESULTS 14 FEBRUARY 2017 DISCLAIMER Certain statements made in this presentation constitute forward-looking statements. Forward-looking statements are typically identified by the use of forward-looking
2009 Full Year Financial Results Iluka Resources Limited. 25 February 2010
 2009 Full Year Financial Results Iluka Resources Limited 25 February 2010 Disclaimer Forward Looking Statements This presentation contains forward-looking statements that are subject to risk factors associated
Investor Presentation
 Investor Presentation ASX Code: NMT March 2016 1 Disclaimer 2 Summary information: This document has been prepared by Neometals Ltd ( Neometals or the Company ) to provide summary information about the
Transpacific FY15 Half Year Results Presentation
 Transpacific FY15 Half Year Results Presentation Robert Boucher CEO Brendan Gill CFO 20 February 2015 - Disclaimer Forward looking statements - This presentation contains certain forward-looking statements,
Driving Long-Term Value from Solid Foundations. Denver Gold Forum. Octavio Alvídrez. 19 September 2016
 Driving Long-Term Value from Solid Foundations Denver Gold Forum Octavio Alvídrez 19 September 2016 Disclaimer This document includes statements that are, or may be deemed to be, forward-looking statements.
De-icing salt opportunity May 2016
 De-icing salt opportunity May 016 1 Important notices This document is produced for information only and not in connection with any specific or proposed offer (the Offer ) of securities in Sirius Minerals
Avocet Mining Full Year Results. 6 th March 2014
 Avocet Mining 2013 Full Year Results 6 th March 2014 Page 1 Quality assets in a highly prospective region Inata Gold Mine o o o Producing mine with significant exploration potential Cash generative asset
Q2 EARNINGS PRESENTATION. August 2nd, 2018
 Q2 EARNINGS PRESENTATION August 2nd, 2018 1 Safe Harbor Statement Certain statements in the Business Update and Order Backlog sections contain forward-looking statements within the meaning of the safe
Tuesday, 25 November Annual General Meeting
 Tuesday, 25 November 20 20 Annual General Meeting Disclaimer and Important Notice This presentation contains forward looking statements that are subject to risk factors associated with an underground mining
2017 Half Year Results Tom O Leary, Managing Director Doug Warden, Chief Financial Officer and Head of Strategy and Planning.
 2017 Half Year Results Tom O Leary, Managing Director Doug Warden, Chief Financial Officer and Head of Strategy and Planning 16 August 2017 Disclaimer Forward Looking Statements Forward Looking Statements
Negotiating Cyclone project buy in
 4 July 2017 Negotiating Cyclone project buy in Cape Bedford : High quality silica sand Recommendation Strong BUY, High Risk Price Valuation Products : 0.7c 6.5c Mineral Sands (Zircon rich) Silica sand
RESERVES of 700,000 ounces Gold (43-101) RESOURCES of 4.2 million ounces Gold (43-101) 25 th February 2013 Annual General Meeting
 RESOURCES of 4.2 million ounces Gold (43-101) 25 th February 2013 Annual General Meeting") RESERVES of 700,000 ounces Gold (43-101) RESOURCES of 4.2 million ounces Gold (43-101) 25 th February 2013 Annual General Meeting www.vatukoulagoldmines.com info@vgmplc.com +44(0)207 440 0643 DISCLAIMER
RESERVES of 700,000 ounces Gold (43-101) RESOURCES of 4.2 million ounces Gold (43-101) 25 th February 2013 Annual General Meeting www.vatukoulagoldmines.com info@vgmplc.com +44(0)207 440 0643 DISCLAIMER
For personal use only
 ASX ANNOUNCEMENT 7 November 2017 ASX waiver secured for extended maturity date of RCF Additional Working Capital Facility MZI Resources Ltd (ASX: MZI) refers to the Additional Working Capital Facility
For personal use only
 Fourth Quarter 2013 Operations Review MDL owns 50% of TiZir Limited which owns the Grande Côte Mineral Sands Project in Senegal, West Africa and an ilmenite upgrading facility in Tyssedal, Norway. Overview
FY 2016 Results Overview
 FY 2016 Results Overview 2 Disclaimer This presentation does not constitute, or form part of, any offer to sell or issue or any solicitation of any offer to purchase or subscribe for, any shares in Caledonia
MDL UPDATE. Investor Presentation February 2018 ASX: MDL
 MDL UPDATE Investor Presentation February 2018 ASX: MDL STATEMENTS MDL OVERVIEW MDL s primary asset is a 50% interest in the TiZir joint venture, which owns the Grande Côte mineral sands operation (GCO)
Global Iron Ore and Steel Forecast Unlocking value across our portfolio. Edgar Basto, Asset President Western Australia Iron Ore 21 March 2018
 Global Iron Ore and Steel Forecast Unlocking value across our portfolio Edgar Basto, Asset President Western Australia Iron Ore Disclaimer Forward-looking statements This presentation contains forward-looking
01 August 2012 INTERIM RESULTS PRESENTATION
 01 August 2012 INTERIM RESULTS PRESENTATION 1 Overview Safety and sustainability Fatality free Increase in LTIFR* Integrated sustainability management Reputation Growing brand Various achievements and
OAO Raspadskaya Management s discussion and analysis of financial condition and results of operations for the six-month period ended 30 June 2012
 This discussion and analysis should be read in conjunction with Raspadskaya s unaudited interim condensed consolidated financial statements prepared in accordance with International Financial Reporting
Managing Director s Review of Operations
 ASX ANNOUNCEMENT Managing Director s Review of Operations 25 October 2017 Attached is a copy of the MD s review of operations as delivered at today s annual general meeting. For further information please
JSW Steel Limited Q1 FY Results Presentation July 25, Better Everyday
 JSW Steel Limited Q1 FY 2018-19 Results Presentation July 25, 2018 Better Everyday 1 Key highlights Q1 FY19 Standalone performance Crude Steel production: 4.11 million tonnes, up by 5% YoY Saleable Steel
Titanium Resources Group Limited. Preliminary Results
 Titanium Resources Group Limited Preliminary Results May 14, 2008: Titanium Resources Group ( TRG or the Company ) announces preliminary results for the year ended 31 December, 2007. Highlights Sales of
Board approves Kwale Phase 2 mine optimisation project to deliver enhanced economics 1
 ASX, AIM and Media Release 23 May 2017 Board approves Kwale Phase 2 mine optimisation project to deliver enhanced economics 1 KEY BENEFITS Brings forward revenue by maintaining current production levels
PJSC Polyus. 4Q and FY 2017 Financial results
 PJSC Polyus 4Q and FY 2017 Financial results 4Q and FY 2017 key highlights Continued strong top-line performance The Company sold a total of 597 thousand ounces of gold in 4Q 2017, up 3% compared to 3Q
BUILDING A TIER 1 MINERAL SANDS COMPANY. Africa Downunder Conference August 2012 BRUCE GRIFFIN CEO
 BUILDING A TIER 1 MINERAL SANDS COMPANY Africa Downunder Conference August 2012 BRUCE GRIFFIN CEO Building a Tier 1 Mineral Sands Company 2 DISCLAIMER This presentation has been prepared by World Titanium
Financial results for the year ended December 2013
 Financial results for the year ended December 2013 Agenda OVERVIEW Results overview and recent developments Results analysis Steel market overview Operating results Finance Other key issues and outlook
H Results Overview
 H1 2016 Results Overview Disclaimer This presentation does not constitute, or form part of, any offer to sell or issue or any solicitation of any offer to purchase or subscribe for, any shares in Caledonia
Interim Results Presentation
 Interim Results Presentation Half Year 31 December 2015 Released 15 February 2016 Scott McMillan, Managing Director Lee Schofield, Chief Executive Officer Matt Dyer, Chief Financial Officer Key Messages
For personal use only
 GALAXY RESOURCES LIMITED FY2017 Results Presentation March 2018 ASX:GXY [xx] Slide 1 Disclaimer This document contains forward looking statements concerning the projects owned by Galaxy. Statements concerning
2015 PRELIMINARY RESULTS PRESENTATION 31 MARCH, 2016
 2015 PRELIMINARY RESULTS PRESENTATION 31 MARCH, 2016 DISCLAIMER Forward-Looking Information This document may contain forward-looking statements. These forward-looking statements are made as of the date
For personal use only
 GRAPHMADA GRAPHITE MINE OPERATIONAL UPDATE HIGHLIGHTS Bass Metals Ltd nearing completion of Stage 1 of the optimisation program: the establishment of 6000 tonnes per annum (tpa) production of premium graphite
MOUNT GIBSON IRON LIMITED QUARTERLY REPORT FOR THE PERIOD ENDED 31 DECEMBER January 2016
 MOUNT GIBSON IRON LIMITED QUARTERLY REPORT FOR THE PERIOD ENDED 31 DECEMBER 2015 20 January 2016 Key Points* December quarter iron ore sales of 1.5 million wet metric tonnes (Mwmt), and quarterly ore sales
Our business. Dredges Mary Ann, Katrina and WCP A
 Annual Report & Accounts 2017 Our business Kenmare Resources plc is one of the world s largest producers of mineral sands products, accounting for the production of approximately 8% of global titanium
BUILDING ON FIRM FOUNDATIONS DELIVERING A SUSTAINABLE FUTURE ENHANCING OUTCOMES
 KUMBA IRON ORE LIMITED 2017 ANNUAL FINANCIAL RESULTS FOR THE YEAR ENDED 31 DECEMBER 2017 BUILDING ON FIRM FOUNDATIONS DELIVERING A SUSTAINABLE FUTURE ENHANCING OUTCOMES MEDIA Sinah Phochana sinah.phochana@angloamerican.com
Delivering superior returns
 Delivering superior returns J-S Jacques, chief executive 2017 Global Metals & Mining Conference Bank of America Merrill Lynch, 16 May 2017 Cautionary statements This presentation has been prepared by Rio
31 December 2013 Half year results February 2014
 31 December 2013 Half year results February 2014 Disclaimer Important Notice The purpose of this presentation is to provide general information about Fortescue Metals Group Limited ("Fortescue"). It is
Straits Asia Resources Limited
 Straits Asia Resources Limited Strategic Outlook September 2009 Table of Contents 1 Sebuku 2 Jembayan 3 The Market for Straits Asia Coal 4 Straits Asia s Financials and Funding the High Growth Targets
31 Dec Dec Dec Dec Dec Dec Dec Dec Dec Dec Dec Dec 2017
 Shareholder returns Kumba s share price continued to recover significantly during the year from R159 at to end the year at R379, gaining the accolade of best performing share on the JSE. The share price
SHEFFIELD SIGNS TAURUS DEBT FACILITY AND EPC CONTRACT
 SHEFFIELD SIGNS TAURUS DEBT FACILITY AND EPC CONTRACT Sheffield Resources Limited ( Sheffield, the Company ) (ASX: SFX) is pleased to announce the signing of two key commercial agreements ( Agreements
Global Metals & Mining/Steel Conference. November 20, 2014
 Global Metals & Mining/Steel Conference November 20, 2014 Forward Looking Information Both these slides and the accompanying oral presentation contain certain forward-looking statements within the meaning
Third quarter r esults results th November 2008
 Third quarter results 2008 5th November 2008 Disclaimer Forward-Looking Statements This document may contain forward-looking information and statements about ArcelorMittal and its subsidiaries. These statements
30 OCTOBER Q Interim Management Statement
 30 OCTOBER 2018 Q3 2018 Interim Management Statement Important Notice This presentation has been prepared by the management of Nyrstar NV (the "Company"). It does not constitute or form part of, and should
The Evolution of Lithium. Lithium Supply and Markets 1 June 2017
 The Evolution of Lithium Lithium Supply and Markets 1 June 2017 1 Disclaimer Summary information: This document has been prepared by Neometals Ltd ( Neometals or the Company ) to provide summary information
Looking to the medium term
 Looking to the medium term Issued: 4 September 2013 Legal notice This presentation has been prepared to inform investors and prospective investors in the secondary markets about the Group and does not
China Iron Ore Beijing, 4 February 2015
 China Iron Ore 2015 Beijing, 4 February 2015 Disclaimer Important Notice The purpose of this presentation is to provide general information about Fortescue Metals Group Limited ("Fortescue"). It is not
QUARTERLY REPORT FOR THE PERIOD ENDING 30 SEPTEMBER 2017
 QUARTERLY REPORT FOR THE PERIOD ENDING 30 SEPTEMBER 2017 SUMMARY RECORD SALES REVENUE Invoiced sales at A$112m was an increase of 108% on prior corresponding period (pcp) and up 48% on the previous quarter
YEAR END RESULTS 31 MARCH Russell Down, Chief Executive Chris Morgan, Group Finance Director
 YEAR END RESULTS 31 MARCH 2018 Russell Down, Chief Executive Chris Morgan, Group Finance Director Customer service strategy improving performance Revenue (excluding disposals) 371.6m 6.4% FY17: 349.1m
Nigerian Aviation Handling Company PLC
 Nigerian Aviation Handling PLC Financial Statements -- Q2 2016 Nigerian Aviation Handling PLC Contents Page Consolidated Statement of Comprehensive Income 1 Consolidated Statement of Financial Position
Interim Results Presentation. For the six months ended 31 December 2018
 Interim Results Presentation For the six months ended 31 December 2018 1 STEEL & TUBE IS One of New Zealand s leading providers of steel solutions, and a proud New Zealand company, with over 65 years of
Xtract Resources Plc (AIM:XTR) First Quarter Update Presentation London 4 May 2016
 First Quarter Update Presentation London 4 May 2016") Xtract Resources Plc (AIM:XTR) First Quarter Update Presentation London 4 May 2016 Through our core strengths we are Xtracting shareholder value Opportunity spotters Value enhancing acquisitions Optimising
Xtract Resources Plc (AIM:XTR) First Quarter Update Presentation London 4 May 2016 Through our core strengths we are Xtracting shareholder value Opportunity spotters Value enhancing acquisitions Optimising
The Navigator Company Q Results Presentation
 The Navigator Company 2016 Results Presentation April 28th, 2016 Speakers Diogo da Silveira CEO Manuel Regalado CFO Joana Appleton - IR 1 Significant turnover growth and diversification over the last years
Q1 I Hapag-Lloyd AG. Investor Report. 1 January to 31 March 2018
 Q1 I 2018 1 Hapag-Lloyd AG Investor Report 1 January to 31 March 2018 SUMMARY OF HAPAG-LLOYD KEY FIGURES Q1 2018 Q1 2017 Change Key operating figures Total vessels, of which 221 172 28% Own vessels 98
Results Q1 2017
 www.heliostowersafrica.com Results Q1 2017 19 May 2017 www.heliostowersafrica.com Agenda 1 Executive Summary 2 Financial Results 3 Q&A 3 Today s Team Team from Helios Towers Africa ( HTA ) Kash Pandya
22 October 2018 LSE: PDL. Petra Diamonds Limited ("Petra" or the "Company" or the Group ) Trading Update Q1 FY 2019 Production and Sales Report
 Trading Update Q1 FY 2019 Production and Sales Report") 22 October 2018 LSE: PDL Petra Diamonds Limited ("Petra" or the "Company" or the Group ) Trading Update Q1 FY 2019 Production and Report Petra Diamonds Limited announces the following Trading Update (unaudited)
22 October 2018 LSE: PDL Petra Diamonds Limited ("Petra" or the "Company" or the Group ) Trading Update Q1 FY 2019 Production and Report Petra Diamonds Limited announces the following Trading Update (unaudited)
INVESTOR RELATIONS PRESENTATION
 INVESTOR RELATIONS PRESENTATION Q3 2015 DISCLAIMER This document has been prepared and issued by and is the sole responsibility of Aluminium Bahrain B.S.C. (the Company ). The document is being supplied
Annual Financial Results. for the twelve months ended 31 December 2009
 Annual Financial Results for the twelve months ended 31 December 2009 1 Introduction and overview Nonkululeko Nyembezi-Heita, CEO 2 Overview (2009 vs 2008) Headline loss of R440m Headline loss per share
Annual F inancial Financial Results 2008
 Annual Financial Results 2008 16 February 2009 Disclaimer Our presentation contains some forward looking statements with respect to the financial Our presentation contains some forward looking statements
Investor Presentation. H Results
 Investor Presentation H1 2018 Results September 4 th, 2018 Disclaimer This presentation provides general information about Compañía Sud Americana de Vapores S.A. ( CSAV ). It consists of summary information
Q Presentation. Hörður Arnarson, CEO Erik Kaman, CFO
 Q4 2008 Presentation Hörður Arnarson, CEO Erik Kaman, CFO February 11, 2009 M I S S I O N S T A T E M E N T We are innovative in everything we do and provide outstanding new solutions and services to the
RESERVES of 790,000 ounces Gold (43-101) RESOURCES of 4.2 million ounces Gold (43-101) PRODUCTION rate of 65,000 ounces/annum 2012
 RESOURCES of 4.2 million ounces Gold (43-101) PRODUCTION rate of 65,000 ounces/annum 2012") RESERVES of 790,000 ounces Gold (43-101) RESOURCES of 4.2 million ounces Gold (43-101) PRODUCTION rate of 65,000 ounces/annum 2012 TARGETING 100,000 ounces per annum 18 APRIL 2012 PROACTIVE INVESTOR PRESENTATION
RESERVES of 790,000 ounces Gold (43-101) RESOURCES of 4.2 million ounces Gold (43-101) PRODUCTION rate of 65,000 ounces/annum 2012 TARGETING 100,000 ounces per annum 18 APRIL 2012 PROACTIVE INVESTOR PRESENTATION
Results Q3 2017
 www.heliostowersafrica.com Results Q3 2017 27 November 2017 www.heliostowersafrica.com Agenda 1 Executive Summary 2 Financial Results 3 Q&A 3 Today s Team Team from Helios Towers ( HT ) Kash Pandya Chief
Saudi Arabian Mining Company (Ma aden)
") Saudi Arabian Mining Company (Ma aden) Earnings Conference Call Q2 2017 August 1, 2017 Earnings Call Presentation Q2, 2017 1 Walid Al-Hakim Head Investor Relations Earnings Call Presentation Q2, 2017 2
Saudi Arabian Mining Company (Ma aden) Earnings Conference Call Q2 2017 August 1, 2017 Earnings Call Presentation Q2, 2017 1 Walid Al-Hakim Head Investor Relations Earnings Call Presentation Q2, 2017 2
FY2015. For personal use only. Full Year Results
 2015 For personal use only Full Year Results Create Build Operate Global Minerals Message from the Board & Executive GROUP Group PERFORMANCE Performance Our NPAT for 2015 is a solid performance and testament
A S X A N N O U N C E M E N T
 A S X A N N O U N C E M E N T DATE: 24 February 2016 Attached is the Presentation regarding Pact s Half year Financial Results for the half year ended 31 December 2015. The Presentation will occur at 10am
GROWTH THROUGH CASH FLOW. Q Results 3 August 2017
 GROWTH THROUGH CASH FLOW 2017 Results 3 August 2017 2 DISCLOSURES Forward Looking Statements: There are risks associated with an investment in the shares of Centamin. Recipients of this presentation should
FY 2017 Operational and Financial Results. 28 February 2018
 FY 2017 Operational and Financial Results 28 February 2018 DISCLAIMER The information contained herein pertaining to SIBUR (the "Company") has been provided by the Company solely for use at this presentation.
Q EARNINGS PRESENTATION
 Q1 2014 EARNINGS PRESENTATION Presented by: Joe Nemeth, President & CEO Presented by: Kevin J. Clarke, President & CEO Brian Baarda, May 7, 2014 VP Finance & CFO Brian Baarda, VP Finance & CFO May 7, 2013