Variable cost per unit $ Fixed costs $
|
|
|
- Jason Bailey
- 6 years ago
- Views:
Transcription
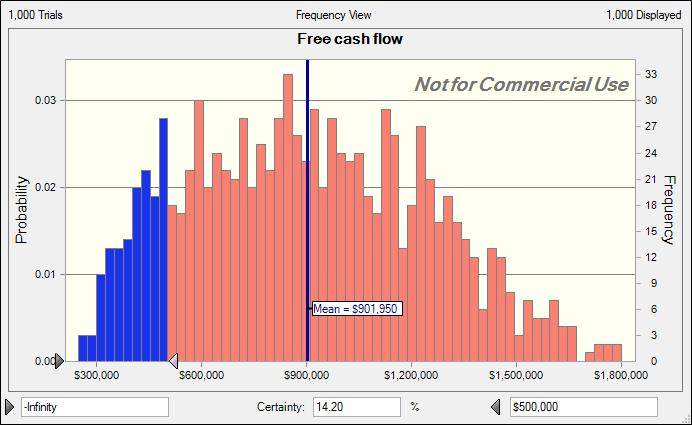
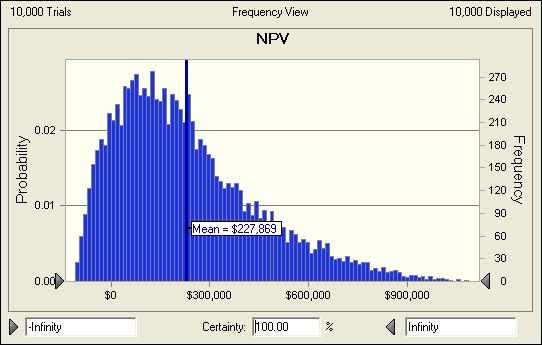
1 Initial cost of equipment Project and equipment life Salvage value of equipment Working capital requirement Depreciation method Depreciation expense Discount rate Tax rate Base case Unit sales 10,000 Price per unit $ Variable cost per unit $ Fixed costs $ 250, Best Case Solution Revenues $1,512,500 Variable cost 742,500 Fixed Expenses 225,000 Gross profit $545,000 Depreciation 100,000 Net operating income $445,000 Income tax expense 151,300 Net income $293,700 Cash flow $393,700 NPV Expected Case Solution Revenues $1,250,000 Variable cost 750,000 Fixed Expenses 250,000 Gross profit $250,000 Depreciation 100,000 Net operating income $150,000 Income tax expense 51,000 NOPAT $99,000 plus: Depreciation 100,000 less: CAPEX - less: Working capital investment - Free cash flow $199,000
2 NPV Worst Case Assuming the negative tax credit o Solution Revenues $1,012, Variable cost $742, Fixed Expenses $275, Gross profit -$5, Depreciation $100, Net operating income -$105, Income tax expense -$35, Net income -$69, Cash flow $30, NPV=PV(E12,E7,D50)-E6 NPV
3 Problem 3-1 Given $1,000, Straight-Line $100, % 34.00% Worst case Best Case $ $ $82.50 $67.50 $275, $225, Excel formula in previous column F17*F18 F17*F19 F20 D25-D26-D27 E11 D28-D29 D30* E13 D30-D31 D32+D29 $1,419, Excel formula d17*d18 d17*d19 d20 D25-D26-D27 E11 D28-D29 D46* e13 D30-D31 D32+D29
4 obtained here can used somewhere else or carried forward $222, Excel formula in previous column E17*E18 E17*E19 E20 D42-D43-D44 E11 D45-D46 D47*E13 D47-D48 D32+D29 ($811,361.79)
5 Solution Legend = Value given in problem = Formula/Calculation/Analysis required = Qualitative analysis or Short answer required = Goal Seek or Solver cell = Crystal Ball Input = Crystal Ball Output
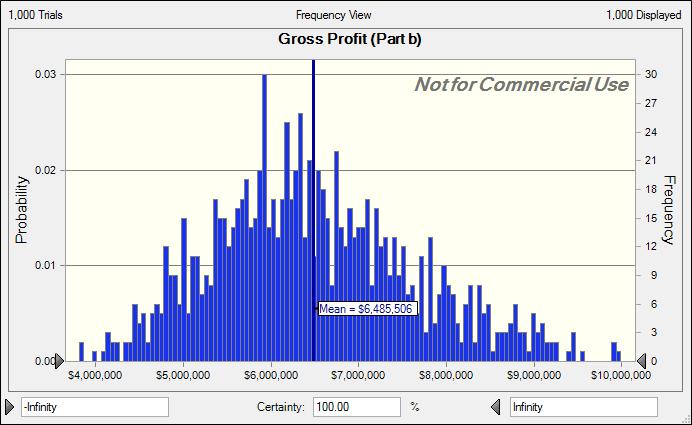
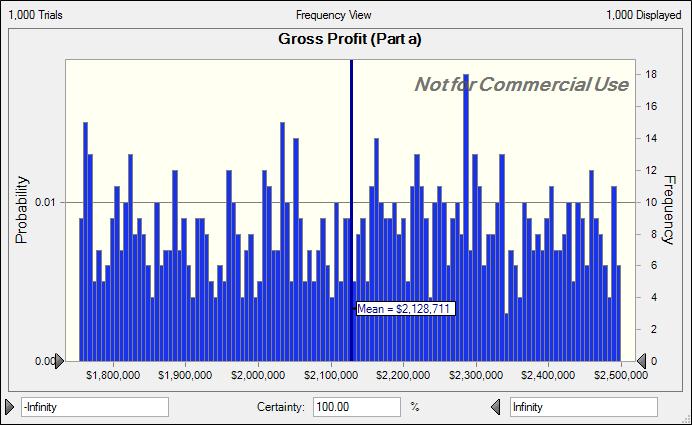
6 Problem 3-2 Initial cost of equipment Project and equipment life Salvage value of equipment Working capital requirement Depreciation method Depreciation expense Discount rate Tax rate Base case Unit sales 11,000 Price per unit $ Variable cost per unit $ Fixed costs $ 250, Part a. Expected Case Solution Revenues $1,375,000 Variable cost 825,000 Fixed Expenses 250,000 Gross profit $300,000 Depreciation 100,000 Net operating income $200,000 Income tax expense 68,000 NOPAT $132,000 plus: Depreciation 100,000 less: CAPEX - less: Working capital investment - Free cash flow $232,000 NPV Part b. Breakeven unit annual sales 8,901 Part c. Breakeven unit price (unit sales +15%) $
7 Given $1,000, Straight-Line $100, % 34.00% Worst case Best Case 9900 $ $ $82.50 $67.50 $275, $225, Excel formula d17*d18 d17*d19 d20 D25-D26-D27 E11 D28-D29 D46* e13 D30-D31 D32+D29 $425,539.57
8 Solution Legend = Value given in problem = Formula/Calculation/Analysis required = Qualitative analysis or Short answer required = Goal Seek or Solver cell = Crystal Ball Input = Crystal Ball Output
9 Problem 3-3 Given: Expected Values Distributional Assumptions Sales units 100,000 Uniform Unit price $ 50 Normal Fixed operating costs 120,000 NA Variable operating costs per unit 35 Triangular Tax rate 30% NA Depreciation expense $ 60,000 NA CAPEX 75,000 Uniform Working capital investment 20,000 Triangular a. Sales $ 5,000,000 less: Variable operating costs (3,500,000) less: (60,000) less: Fixed operating costs (120,000) Net Operating Profit $ 1,320,000 less: Taxes (396,000) NOPAT $ 924,000 plus: Depreciation expense 60,000 less: CAPEX (75,000) less: Working capital investment (20,000) Free cash flow $ 889,000 b.
10
11 Parameter Estimates max = 150,000; Min = 50,000 Meam = $50, standard deviation = $10 NA min = $30;most likely = $35; max = $40 NA NA min = $60,000; max = $90,000 min = $18,000; most likely = $20,000; max = $22,000 = Value giv = Formula/ = Qualitativ = Goal See = Crystal B = Crystal B
12
13 Solution Legend ven in problem /Calculation/Analysis required ve analysis or Short answer required ek or Solver cell Ball Input Ball Output
14 PROBLEM 3-4: Clayton Manufact Given EBITDA (Year 1) $ 200,000 Growth Rate in EBITDA 5% Initial investment $ 800,000 Depreciation (Straight line) over 5 years Estimated salvage value $ - Tax rate 35% Cost of capital 12% a EBITDA $ 200,000 $ 210,000 Less: Depreciation Expense (160,000) (160,000) EBIT $ 40,000 $ 50,000 Less: Taxes (14,000) (17,500) NOPAT $ 26,000 $ 32,500 Plus: Depreciation Expense 160, ,000 Less: CAPEX (800,000) - - Less: Change in Working Capital Project FCF $ (800,000) $ 186,000 $ 192,500 b. NPV $ (85,926) Solution c. Using "Goal Seek" to solve for the EBITDA in year 1 (C5) that yields a NPV of 0 (C28). Breakeven Year 1 EBITDA $ 233,551
15 turing Company Solution Legend = Value given in problem = Formula/Calculation/Analysis required = Qualitative analysis or Short answer required = Goal Seek or Solver cell = Crystal Ball Input = Crystal Ball Output Years $ 220,500 $ 231,525 $ 243,101 (160,000) (160,000) (160,000) $ 60,500 $ 71,525 $ 83,101 (21,175) (25,034) (29,085) $ 39,325 $ 46,491 $ 54, , , , $ 199,325 $ 206,491 $ 214,016
16 PROBLEM 3-5: Breakeven Sensitivity Given Investment (enter with "-" sign) $ (4,000,000) Plant life 5 Years Salvage value $ 400,000 Variable Cost % 45% Fixed operating cost $ 1,000,000 Tax rate 38% Working capital 10% (Percent of the expected change in revenues for the year) Required Rate of Return 15% Sales volume multiple 1.00 Yea Sales volume $ 1,000,000 $ 1,500,000 Unit price Revenues 2,000,000 3,000,000 Variable Operating Costs (900,000) (1,350,000) Fixed Operating Costs (1,000,000) (1,000,000) Depreciation Expense (800,000) (800,000) Net Operating Income $ (700,000) $ (150,000) Less: Taxes 266,000 57,000 NOPAT $ (434,000) $ (93,000) Plus: Depreciation 800, ,000 Less: CAPEX (4,000,000) - - Less: Working Capital (200,000) (100,000) (450,000) Free Cash Flow $ (4,200,000) $ 266,000 $ 257,000 NPV $ 419,435 IRR 18% Equivalent Annual Cost $ 125,124 Solution a. What are the key sources of risk that you see in this project? The "given" data or parameters capture the variables that are uncertain in the analysis. However, the sensitivity analysis is designed to identify the key sources of uncertainty that are most crucial. b. Breakeven sensitivity analysis Variable Estimated Value Breakeven Value Percent Difference
17 Initial Capex $ (4,000,000) $ (4,419,435) 10% Variable Cost as a % of Sales 45% 49% 9% Working Capital % of new Sales 10% 27% 170% Sales volume multiplier % c. Discuss results of part b. The initial capital cost, variable cost as a percent of sales and the sales volume are all roughly equally important in terms of their significance in driving the results of the investment. The kinds of things that can be done to control these costs entail careful cost contracting for the initial capital cost, and closely monitoring both the variable cost % and sales volume. It would also be helpful to know what "options" the firm might have with regard to reducing output or shutting down should the forecasts of sales volume or variable costs prove to be d. Should you always seek to reduce project risk? This should provide an interesting discussion since most students are taught that risk is bad. In fact, firms "choose" to assume risks for which they feel particularly well suited to manage. For example, most traditional E&P firms do not attempt to hedge the price risk of their oil and gas reserves but choose to assume this risk as a risk of doing business in an industry where their specialized knowledge and skills make the cost of bearing this risk less than for outsiders that might wish to assume this risk (for a price!).
18 y Analysis RENUMBER = Value given in p = Formula/Calcula = Qualitative anal = Goal Seek or So = Crystal Ball Inpu = Crystal Ball Out ar $ 3,000,000 $ 3,500,000 $ 2,000, ,500,000 8,750,000 5,000,000 (3,375,000) (3,937,500) (2,250,000) (1,000,000) (1,000,000) (1,000,000) (800,000) (800,000) (800,000) $ 2,325,000 $ 3,012,500 $ 950,000 (883,500) (1,144,750) (361,000) $ 1,441,500 $ 1,867,750 $ 589, , , , ,000 (125,000) 375, ,000 $ 2,116,500 $ 3,042,750 $ 2,137,000 Solution Legend = Value given in problem = Formula/Calculation/Analysis required = Qualitative analysis or Short answer required = Goal Seek or Solver cell = Crystal Ball Input = Crystal Ball Output
19
20 Solution Legend problem ation/analysis required lysis or Short answer required olver cell ut tput
21 PROBLEM 3-6ab: Bridgeway Pharmaceutic Given Investment cost (today) $ (400,000) Project life 5 years Depreciation expense $ 80,000 Waste disposal cost savings per year $ 18,000 Labor cost savings per year $ 40,000 Sale of reclaimed waste $ 200,000 Required rate of return 20% Tax rate 35% Solution Part a. Y Cash flow estimation Investment $ (400,000) Waste disposal cost savings per year 18,000 18,000 Labor cost savings per year 40,000 40,000 Proceeds from sale of reclaimed waste materials 200, ,000 EBITDA $ 258,000 $ 258,000 Less: Depreciation (80,000) (80,000) Additional EBIT $ 178,000 $ 178,000 Less: Taxes (62,300) (62,300) NOPAT $ 115,700 $ 115,700 Plus: Depreciation 80,000 80,000 Less: Capex - - Less: Additional working capital - - FCF $ (400,000) $ 195,700 $ 195,700 NPV $ 185,263 IRR 39.74% Analysis The project appears to be a good one with an expected N b. If sale of reclaimed waste drops in half, NPV $ (9,127) Critical B-E for sale of waste materials $ 104,695 Critical B-E Price decline in salvage materials 47.65% c. See next worksheet To answer part b. simply subs sale of reclaimed waste in C10 Solver has been used to find th Details given in text box above
22
23 The terminal period growth rates were estimated such that the intrinsic valuation of the firm's equity would equal the current market capitalization of the firm using the "Goal Seek" function.
24 cals = Value given = Formula/Ca = Qualitative = Goal Seek o = Crystal Ball = Crystal Ball Year ,000 18,000 18,000 40,000 40,000 40, , , ,000 $ 258,000 $ 258,000 $ 258,000 (80,000) (80,000) (80,000) $ 178,000 $ 178,000 $ 178,000 (62,300) (62,300) (62,300) $ 115,700 $ 115,700 $ 115,700 80,000 80,000 80, $ 195,700 $ 195,700 $ 195,700 NPV of over $185,000. stitute $100,000 for the 10. this answer. e.
25
26
27 Solution Legend n in problem alculation/analysis required analysis or Short answer required or Solver cell l Input l Output
28 PROBLEM 3-6c: Bridgeway Given Investment cost (today) $ (400,000) Project life 5 years Depreciation expense $ 80,000 Waste disposal cost savings per year $ 18,000 Labor cost savings per year $ 40,000 Sale of reclaimed waste $ 200,000 Required rate of return 20% Tax rate 35% Correlation (Year to year) in Proceeds from reclaimed waste 0.90 Solution c. Cash flow estimation 0 1 Investment $ (400,000) Waste disposal cost savings per year $ 18,000 Labor cost savings per year 40,000 Proceeds from sale of reclaimed waste 200,000 EBITDA $ 258,000 Less: Depreciation (80,000) Additional EBIT $ 178,000 Less: Taxes (62,300) NOPAT $ 115,700 Plus: Depreciation 80,000 Less: Capex - Less: Additional working capital - FCF (400,000) $ 195,700 NPV $ 185,263 IRR 39.74% Part i. Note: Your res here where you fact, if you do n slightly from on Preferences/Sa

29 Part ii. Part iii.
30 Pharmaceuticals Solution Legend = Value given in problem = Formula/Calculation/Analysis required = Qualitative analysis or Short answer required = Goal Seek or Solver cell = Crystal Ball Input = Crystal Ball Output Year $ 18,000 $ 18,000 $ 18,000 $ 18,000 40,000 40,000 40,000 40, , , , ,000 $ 258,000 $ 258,000 $ 258,000 $ 258,000 (80,000) (80,000) (80,000) (80,000) $ 178,000 $ 178,000 $ 178,000 $ 178,000 (62,300) (62,300) (62,300) (62,300) $ 115,700 $ 115,700 $ 115,700 $ 115,700 80,000 80,000 80,000 80, $ 195,700 $ 195,700 $ 195,700 $ 195,700 sults from the simulation experiment will differ slightly from those reported ou did not use the same "seed" value for the random number generator. In not "fix" the same seed value for each simulation your results will differ ne simulation of the same problem to another (see Run Sampling).
31
32
33 PROBLEM 3-4: TitMar Mo Given Assumptions and Predictions Estimates Price per unit $ 4,895 Market share (%) 15.00% Market size (Year 1) $ 200,000 units Growth rate in market size beginning in Year % Unit variable cost $ 4,250 Fixed cost $ 9,000,000 Tax rate 50.00% Cost of capital 18.00% of the predicted change in firm Investment in NWC 5.00% revenues. Initial investment in PP&E $ 7,000,000 Depreciation (5 year life w/no salvage) $ 1,400, Investment $ (7,000,000) Revenue 146,850,000 Variable Cost (127,500,000) Fixed cost (9,000,000) Depreciation (1,400,000) EBT(Net Operating Income) $ 8,950,000 Tax (4,475,000) Net Operating Profit after Tax (NOPAT) $ 4,475,000 Plus: Depreciation expense 1,400,000 Less: Capex (7,000,000) - Less: Change in NWC (7,342,500) (367,125) Free Cash Flow $ (14,342,500) $ 5,507,875 Net Present Value $ 9,526,209 Internal Rate of Return 39.82% Units Sold 30,000 a. If the market share is only 5% then the project's NPV = b. If market share = 15% and the price of the PTV falls to $4,500 the NPV = Solution Breakeven Sensitivity Analysis Critical % Change Critical Value Price per unit -3.88% $ 4,705 Market share (%) % 9.97% Market size (Year 1) % $ 132,936 Growth rate in market size beginning in Year % % Unit variable cost 4.40% $ 4,437
34 Fixed cost 67.69% $ 15,092,541 Tax rate 57.20% 78.60% Cost of capital % 39.82% Investment in NWC % 15.60% Analysis: The above analysis suggests that the two k
35 otor Company Part b. Substitute $4,500 for the price per unit. Part a. Substitute 5% for market share (%). Year ,192, ,902, ,997, ,497,093 (133,875,000) (140,568,750) (147,597,188) (154,977,047) (9,000,000) (9,000,000) (9,000,000) (9,000,000) (1,400,000) (1,400,000) (1,400,000) (1,400,000) $ 9,917,500 $ 10,933,375 $ 12,000,044 $ 13,120,046 (4,958,750) (5,466,688) (6,000,022) (6,560,023) $ 4,958,750 $ 5,466,688 $ 6,000,022 $ 6,560,023 1,400,000 1,400,000 1,400,000 1,400, (385,481) (404,755) (424,993) 8,924,855 $ 5,973,269 $ 6,461,932 $ 6,975,029 $ 16,884,878 31,500 33,075 34,729 36,465 $ $ (9,413,430) (10,261,801)
36 key value drivers are price per unit and unit variable cost!
37 Solution Legend = Value given in problem = Formula/Calculation/Analysis required = Qualitative analysis or Short answer required = Goal Seek or Solver cell = Crystal Ball Input = Crystal Ball Output
38 PROBLEM 3- Given Assumptions and Predictions Estimates Price per unit $ 4,895 Market share (%) 15.00% Market size (Year 1) 200,000 Growth rate in market size beginning in Year % Unit variable cost $ 4,250 Fixed cost $ 9,000,000 Tax rate 50.0% Cost of capital 18.00% Investment in NWC 5.00% of the predicted change in firm revenues. Initial investment in pp&e $ 7,000,000 Depreciation (5 year life w/no salvage) $ 1,400, Investment $ (7,000,000) - Growth rate in market size 5.0% Market Size (total PTV sold) 200,000 Market Share (units sold by Titmar) 30,000 Revenue 146,850,000 Variable Cost (127,500,000) Fixed cost (9,000,000) Depreciation (1,400,000) EBT(Net Operating Income) $ 8,950,000 Tax (4,475,000) Net Operating Profit after Tax (NOPAT) $ 4,475,000 Plus: Depreciation expense 1,400,000 Less: Capex (7,000,000) - Less: Change in NWC (7,342,500) (367,125) Free Cash Flow $ (14,342,500) $ 5,507,875 Net Present Value $ 9,526,209 Internal Rate of Return 39.82%
39
40 -8: TitMar Motor Company Solution Legend = Value given in problem = Formula/Calculation/Analysis required = Qualitative analysis or Short answer required = Goal Seek or Solver cell = Crystal Ball Input = Crystal Ball Output Solution Year % 5.0% 5.0% 5.0% 210, , , ,101 31,500 33,075 34,729 36, ,192, ,902, ,997, ,497,093 (133,875,000) (140,568,750) (147,597,188) (154,977,047) (9,000,000) (9,000,000) (9,000,000) (9,000,000) (1,400,000) (1,400,000) (1,400,000) (1,400,000) $ 9,917,500 $ 10,933,375 $ 12,000,044 $ 13,120,046 (4,958,750) (5,466,688) (6,000,022) (6,560,023) $ 4,958,750 $ 5,466,688 $ 6,000,022 $ 6,560,023 1,400,000 1,400,000 1,400,000 1,400, (385,481) (404,755) (424,993) 8,924,855 $ 5,973,269 $ 6,461,932 $ 6,975,029 $ 16,884,878
41
42
43
44 PROBLEM 3-9: Earthilizer Problem--Decision Tree Given EPA after-tax cost $ 80,000 Abandonment Value $ 350,000 Probability of Good EPA Ruling 80% Solution Panel a. No Option to Abandon Favorable EPA Ruling--Expected Project FCFs $ (580,000) $ 87,600 $ 78,420 $ 93,320 NPV (Favorable EPA Ruling) = $ 43,062 Unfavorable EPA Ruling--Expected FCFs $ (580,000) $ 7,600 $ (1,580) $ 13,320 NPV (Unfavorable EPA Ruling) $ (236,608) Revised Expected Project FCFs $ (580,000) $ 71,600 $ 62,420 $ 77,320 E[NPV] with No Option to Abandon $ (12,872) Panel b. Option to Abandon Project Not Abandoned (Favorable EPA) $ (580,000) $ 87,600 $ 78,420 $ 93,320 NPV (Favorable EPA Ruling) = $ 43,062 Project Abandoned (Unfavorable EPA) $ (580,000) $ 437,600 $ - $ - NPV (Unfavorable EPA Ruling) $ (193,598) Revised Expected Project FCFs $ (580,000) $ 157,600 $ 62,736 $ 74,656 E[NPV] with the Option to Abandon $ (4,270) Analysis: Reducing the abandonment value to $350,000 reduces the with the abandonment option to $(4,270). The break-even a makes the expected NPV of the proposed investment zero
45 Solution Legend = Value given in problem = Formula/Calculation/Analysis required $ 109,710 $ 658,770 = Qualitative analysis or Short answer re = Goal Seek or Solver cell = Crystal Ball Input $ 29,710 $ 578,770 = Crystal Ball Output $ 93,710 $ 642, $ 109,710 $ 658,770 $ - $ - $ 87,768 $ 527,016 expected NPV of the project abandonment value that is $374,177.
46 d equired
47 PROBLEM 3-10: Introductory Simulation Analysis Exercises a. Jason Enterprises Given Gross Profit/Sales 25% = Value given i Sales (upper limit) $ 10,000,000 = Formula/Calc Sales (lower limit) $ 7,000,000 = Qualitative a = Goal Seek or Solution = Crystal Ball I Forecasted Sales $ 8,500,000 = Crystal Ball O Gross profits $ 2,125,000 b. Aggiebear Dog Snacks, Inc. Given Revenues Minimum $ 18,000,000 Most likely $ 25,000,000 Maximum $ 35,000,000 Cost of Goods sold/revenues Minimum 70% Maximum 80% Solution Forecasted Sales $ 26,000,000 Cost of Goods Sold/Sales 0.75 Part i-iii. Sales $ 26,000,000 Less: Cost of Goods Sold (19,500,000) Gross Profit $ 6,500,000
48
49 Solution Legend in problem culation/analysis required analysis or Short answer required r Solver cell Input Output


50 PROBLEM 3-11: Rayner Aeronautics Given Solution Legend Investment Outlay (Year 0) $ 12,500,000 = Value given in problem Year 1 Expected Cash Flow $ 2,000,000 = Formula/Calculation/Analysis required Required Rate of Return 18% = Qualitative analysis or Short answer required = Goal Seek or Solver cell = Crystal Ball Input = Crystal Ball Output Solution a. Break-Even Growth Rate in Cash flows 41.06% Year Growth Rate Cash Flows 0 $ (12,500,000) NPV = (0.00) 1 0 2,000, % 2,821, % 3,979, % 5,613, % 7,918,699 b. Simulation Model Variable Mean Std. Deviation Year 1 cash flow $ 2,000,000 Normal distribution $ 2,000,000 $ 1,000,000 Annual Growth Rates Triangular Distrbution Year Most likely Minimum Maximum % 40.00% 20.00% 80.00% % 40.00% 10.00% % % 40.00% 5.00% % % 40.00% 2.50% % Year Growth Rate Cash Flows 0 $ (12,500,000) 1 0 2,000, % 2,933, % 4,530, % 7,407, % 12,897,684 c. Results of Simulation NPV $ 3,517,571 IRR 26.58% Expected NPV $ 4,469,510 see mean value in chart below Expected IRR 26.08% see mean value in chart below
51 PROBLEM 3-12: Cono Given ConocoPhillips's Cost of Capital for project 15.00% Project life 10 years Investment $ 1,200,000 Increase in NWC 145,000 MACRS Depr Rate (7 year) Natural Gas Wellhead Price (per MCF) 6 6 Volume (MCF/day) Days per year 365 Fee to Producer of Natural Gas $3.00 $3.00 Compression & processing costs (per MCF) Cash Flow Calculations Natural Gas Wellhead Price Revenue $ 1,971,000 $ 1,576,800 Lease fee expense 985, ,400 Compression & processing costs 213, ,820 Depreciation expense 171, ,880 Net operating Profit $ 600,495 $ 323,700 Less: Taxes (40%) (240,198) (129,480) Net operating profit after tax (NOPAT) $ 360,297 $ 194,220 Plus: Depreciation expense 171, ,880 Return of net working capital Project Free Cash Flow $ (1,345,000) $ 531,777 $ 488,100 NPV $ 280,051 IRR 22.43% 2a-c. Scenario Summary Current Values Best Case Most Likely Case Changing Cells NG Price Production Rate Result Cells NPV $ 280,051 $ 1,440,400 $ 280,051 IRR 22.43% 53.11% 22.43% Notes: Current Values column represents values of changing cells at time Scenario Summary Report 3. Breakeven Sensitivity Analsyis Students should use Goal Seek in Excel to answer this question. a. Breakeven nautral gas price for an NPV = 0 $ 4.98
52 b. Breakeven natural gas volume in Year 1 for an NPV = c. Breakeven investment for an NPV = 0 $ 1,573, Student answers will vary but most will probably recommend the project. The problem is intentionally set up to illustrate the risk of natural gas prices because the price is very suggest students go to the internet and look at current natural gas prices. A good website to suggest On November 29, 2007, the NYMEX price for natural gas was $7.56. At higher n prices, this project is very profitable. However, in subsequent years the price fell to below $3.00.
53 ocophillips Natural Gas Wellhead Project Solution Years $3.00 $3.00 $3.00 $3.00 $3.00 $3.00 $ $ 1,261,440 $ 1,009,152 $ 807,322 $ 645,857 $ 516,686 $ 413,349 $ 330, , , , , , , , , ,325 87,460 69,968 55,974 44,779 35, , , , , ,160 53,400 - $ 284,184 $ 245,371 $ 209,041 $ 145,801 $ 95,209 $ 108,495 $ 129,516 (113,674) (98,148) (83,616) (58,320) (38,083) (43,398) (51,806) $ 170,510 $ 147,223 $ 125,425 $ 87,480 $ 57,125 $ 65,097 $ 77, , , , , ,160 53,400 - $ 380,390 $ 297,103 $ 232,585 $ 194,640 $ 164,285 $ 118,497 $ 77,710 Worst Case $ (645,791) -2.34% t was created.
54 volatile. We t is natural gas
55 Solution Legend = Value given in problem 10 = Formula/Calculation/Analysis required = Qualitative analysis or Short answer required = Goal Seek or Solver cell = Crystal Ball Input 6 = Crystal Ball Output 121 $ $ $ $ $ 264, ,272 28, ,613 (41,445) 62, , ,168
56
57 PROBLEM 3-13: Blended Profile Applied, per A Given Purchase Cost (pre-installed) $000 $ (700,000) Airframe Maintenance Cost $ (2,100) Installation $000 $ (56,000) Useful Life (yrs) Average 20 Downtime Days (installation) 1 Runway Savings $ 500 Downtime Cost/Day $000 $ (5,000) Facility cost $ 1,200 Salvage % 15.00% Depreciation MACRS (see Gen. Escalation 3.00% Fuel Price (all-in) $ 0.80 Marginal Tax Rate 39.00% Fuel (gallons saved) 178,500 Discount Rate 9.28% Winglet Purchase $ (700,000) Winglet Installation $ (56,000) Install. Downtime costs $ (5,000) Airport Reconfiguration $ (1,200) Fuel Savings $ 142,800 $ 142,800 $ 142,800 $ 142,800 Airframe Maint. Costs (2,100) (2,163) (2,228) (2,295) Reduced restrictions (inflated 3%/yr) Less: depreciation (432,016) (92,572) (66,112) (47,212) EBIT $ (290,816) $ 48,580 $ 74,990 $ 93,839 Less: Income Tax (113,418) 18,946 29,246 36,597 Net Income $ (177,398) $ 29,634 $ 45,744 $ 57,242 Plus: Depreciation 432,016 92,572 66,112 47,212 Operating Cash Flow $ 254,618 $ 122,206 $ 111,856 $ 104,454 Salvage Value Tax on Salvage Value Total Project Cash Flow $ (762,200) $ 254,618 $ 122,206 $ 111,856 $ 104,454 b. NPV $ 260,980 IRR 15.0% MIRR 10.9% DEPRECIATION DETAILS MACRS Table Normal Table Normal Table x Year 1(a) Additional valid til 9/11/ % 50.00% Total (modified table) % 7.15% 50.00% 57.15% $ 756, % 12.25% 12.25% 756, % 8.75% 8.75% 756, % 6.25% 6.25% 756, % 4.47% 4.47% 756, % 4.46% 4.46% 756, % 4.47% 4.47% 756, % 2.23% 2.23% 756,000 (a) Job Creation and Worker Assistance Act of %
58 c. Breakeven fuel cost $ 0.53 per gallon Breakeven fuel savings 118,742 gallons d. Current Values Best Case Worst Case Changing Cells Fuel Price $ 0.80 $ 1.10 $ 0.50 Gallons Saved 178, , ,000 Result Cells NPV $ 260,980 $ 766,489 $ (130,981) IRR 15.00% 24.70% 6.00% MIRR 10.90% 13.10% 8.30% Notes: Current Values column represents values of changing cells at time Scenario Summary Report was created. e. Students should try to think of all possible qualitative and quantitative aspects of the project not already options excluded from the project: Southwest Airlines may be able to enter into new markets since the jets refueling. The jets can also carry more cargo with the greater fuel savings. It will make the airline more pri prices are high, especially when compared to their competitors with less fuel efficient jets. Potential risks, a increased accidents because the jets handle differently and the wingspan is wider. There are other potenti students are encouraged to "brainstorm" these. f. Impact on NPV and IRR if winglets have no salvage value. NPV $ 250,123 IRR $ 14.89
59 Aircraft B per year per year per aricraft e below) includes delivery, taxes and into plane charges S = Value give = Formula/C = Qualitative = Goal Seek = Crystal Ba = Crystal Ba Solution Year $ 142,800 $ 142,800 $ 142,800 $ 142,800 $ 142,800 $ 142,800 $ 142,800 $ 142,800 (2,364) (2,434) (2,508) (2,583) (2,660) (2,740) (2,822) (2,907) (33,755) (33,718) (33,755) (16,859) $ 107,244 $ 107,228 $ 107,134 $ 123,973 $ 140,773 $ 140,712 $ 140,650 $ 140,585 41,825 41,819 41,782 48,350 54,902 54,878 54,853 54,828 $ 65,419 $ 65,409 $ 65,352 $ 75,624 $ 85,872 $ 85,835 $ 85,796 $ 85,757 33,755 33,718 33,755 16,859 $ 99,174 $ 99,126 $ 99,107 $ 92,483 $ 85,872 $ 85,835 $ 85,796 $ 85,757 $ 99,174 $ 99,126 $ 99,107 $ 92,483 $ 85,872 $ 85,835 $ 85,796 $ 85,757 Tax Depr $ 432,016 92,572 66,112 47,212 33,755 33,718 33,755 16,859 $ 756,000
60 included. The are real s can fly further without ice competitive when jet fuel although remote, would be ial risks and benefits, and
61 Solution Legend en in problem Calculation/Analysis required e analysis or Short answer required k or Solver cell all Input all Output $ 142,800 $ 142,800 $ 142,800 $ 142,800 $ 142,800 $ 142,800 $ 142,800 $ 142,800 (2,994) (3,084) (3,176) (3,272) (3,370) (3,471) (3,575) (3,682) $ 140,519 $ 140,450 $ 140,380 $ 140,307 $ 140,232 $ 140,155 $ 140,076 $ 139,994 54,802 54,776 54,748 54,720 54,691 54,661 54,630 54,598 $ 85,716 $ 85,675 $ 85,632 $ 85,587 $ 85,542 $ 85,495 $ 85,446 $ 85,397 $ 85,716 $ 85,675 $ 85,632 $ 85,587 $ 85,542 $ 85,495 $ 85,446 $ 85,397 $ 105,000 $ 85,716 $ 85,675 $ 85,632 $ 85,587 $ 85,542 $ 85,495 85,446 (40,950) $ $ 149,447
62
CHAPTER 11. Proposed Project Data. Topics. Cash Flow Estimation and Risk Analysis. Estimating cash flows:
 CHAPTER 11 Cash Flow Estimation and Risk Analysis 1 Topics Estimating cash flows: Relevant cash flows Working capital treatment Inflation Risk Analysis: Sensitivity Analysis, Scenario Analysis, and Simulation
Project Free Cash Flows = NOPAT + Depreciation Gross Investment in Fixed Operating Assets Investment in Operating Working Capital
 Project Free Cash Flows = NOPAT + Depreciation Gross Investment in Fixed Operating Assets Investment in Operating Working Capital = EBIT (1 t) + Depreciation Gross Investment in Fixed Operating Assets
Real Options and Risk Analysis in Capital Budgeting
 Real options Real Options and Risk Analysis in Capital Budgeting Traditional NPV analysis should not be viewed as static. This can lead to decision-making problems in a dynamic environment when not all
CHAPTER 11. Topics. Cash Flow Estimation and Risk Analysis. Estimating cash flows: Relevant cash flows Working capital treatment
 CHAPTER 11 Cash Flow Estimation and Risk Analysis 1 Topics Estimating cash flows: Relevant cash flows Working capital treatment Risk analysis: Sensitivity analysis Scenario analysis Simulation analysis
EFIN/MFIN 301 Corporate Finance. Han Özsöylev (8) MECHANICS OF CAPITAL BUDGETING
 MECHANICS OF CAPITAL BUDGETING") EFIN/MFIN 301 Corporate Finance Han Özsöylev (8) MECHANICS OF CAPITAL BUDGETING THE VALUATION PROCESS Valua%on is an itera%ve process 5. Calculate and Interpret Results Once the model is complete, examine
EFIN/MFIN 301 Corporate Finance Han Özsöylev (8) MECHANICS OF CAPITAL BUDGETING THE VALUATION PROCESS Valua%on is an itera%ve process 5. Calculate and Interpret Results Once the model is complete, examine
ExcelSim 2003 Documentation
 ExcelSim 2003 Documentation Note: The ExcelSim 2003 add-in program is copyright 2001-2003 by Timothy R. Mayes, Ph.D. It is free to use, but it is meant for educational use only. If you wish to perform
INTRODUCING RISK MODELING IN CORPORATE FINANCE
 INTRODUCING RISK MODELING IN CORPORATE FINANCE Domingo Castelo Joaquin*, Han Bin Kang** Abstract This paper aims to introduce a simulation modeling in the context of a simplified capital budgeting problem.
= Value given in problem Given. Solution:
 Instant download and all chapters s Manual Valuation The Art and Science of Corporate Investment Decisions 3rd https://testbankdata.com/download/solutions-manual-valuation-art-science-corporate-investment-decisions-3rd-edition-sheridantitman/
Week 1 FINC $260,000 $106,680 $118,200 $89,400 $116,720. Capital Budgeting Analysis
 Dr. Ahmed FINC 5880 Week 1 Name Capital Budgeting Analysis Facts: Calculations Cost $200,000 Shipping $10,000 Installation $30,000 Depreciable cost $24,000 Inventories will rise by $25,000 Payables will
Chapter 8: Fundamentals of Capital Budgeting
 Chapter 8: Fundamentals of Capital Budgeting - 1 Chapter 8: Fundamentals of Capital Budgeting Note: Read the chapter then look at the following. Fundamental question: How do we determine the cash flows
SENSITIVITY ANALYSIS IN CAPITAL BUDGETING USING CRYSTAL BALL. Petter Gokstad 1
 SENSITIVITY ANALYSIS IN CAPITAL BUDGETING USING CRYSTAL BALL Petter Gokstad 1 Graduate Assistant, Department of Finance, University of North Dakota Box 7096 Grand Forks, ND 58202-7096, USA Nancy Beneda
2, , , , ,220.21
 11-7 a. Project A: CF 0-6000; CF 1-5 2000; I/YR 14. Solve for NPV A $866.16. IRR A 19.86%. MIRR calculation: 0 14% 1 2 3 4 5-6,000 2,000 (1.14) 4 2,000 (1.14) 3 2,000 (1.14) 2 2,000 1.14 2,000 2,280.00
Chapter 11 Cash Flow Estimation and Risk Analysis ANSWERS TO END-OF-CHAPTER QUESTIONS
 Chapter 11 Cash Flow Estimation and Risk Analysis ANSWERS TO END-OF-CHAPTER QUESTIONS 11-1 a. Project cash flow, which is the relevant cash flow for project analysis, represents the actual flow of cash,
SCAF Workshop Integrated Cost and Schedule Risk Analysis. Tuesday 15th November 2016 The BAWA Centre, Filton, Bristol
 The following presentation was given at: SCAF Workshop Integrated Cost and Schedule Risk Analysis Tuesday 15th November 2016 The BAWA Centre, Filton, Bristol Released for distribution by the Author www.scaf.org.uk/library
Investing in a Robotic Milking System: A Monte Carlo Simulation Analysis
 J. Dairy Sci. 85:2207 2214 American Dairy Science Association, 2002. Investing in a Robotic Milking System: A Monte Carlo Simulation Analysis J. Hyde and P. Engel Department of Agricultural Economics and
Chapter 9. Ross, Westerfield and Jordan, ECF 4 th ed 2004 Solutions. Answers to Concepts Review and Critical Thinking Questions
 Ross, Westerfield and Jordan, ECF 4 th ed 2004 Solutions Chapter 9. Answers to Concepts Review and Critical Thinking Questions 1. In this context, an opportunity cost refers to the value of an asset or
Chapter 8. Fundamentals of Capital Budgeting
 Chapter 8 Fundamentals of Capital Budgeting Chapter Outline 8.1 Forecasting Earnings 8.2 Determining Free Cash Flow and NPV 8.3 Choosing Among Alternatives 8.4 Further Adjustments to Free Cash Flow 8.5
TIE2140 / IE2140e Engineering Economy Tutorial 6 (Lab 2) Engineering-Economic Decision Making Process using EXCEL
 Engineering-Economic Decision Making Process using EXCEL") TIE2140 / IE2140e Engineering Economy Tutorial 6 (Lab 2) Engineering-Economic Decision Making Process using EXCEL Solutions Guide by Wang Xin, Hong Lanqing & Mei Wenjie 1. Learning Objectives In this lab-based
TIE2140 / IE2140e Engineering Economy Tutorial 6 (Lab 2) Engineering-Economic Decision Making Process using EXCEL Solutions Guide by Wang Xin, Hong Lanqing & Mei Wenjie 1. Learning Objectives In this lab-based
Lecture 10. Ski Jacket Case Profit calculation Spreadsheet simulation Analysis of results Summary and Preparation for next class
 Decision Models Lecture 10 1 Lecture 10 Ski Jacket Case Profit calculation Spreadsheet simulation Analysis of results Summary and Preparation for next class Yield Management Decision Models Lecture 10
JEM034 Corporate Finance Winter Semester 2018/2019
 JEM034 Corporate Finance Winter Semester 2018/2019 Lecture #4 Olga Bychkova Topics Covered Today Finalize more practical guidance on making investment decisions with NPV rule and capital budgeting (chapter
Notes for CHEE 332 Report
 Notes for CHEE 332 Report - binary VLE data should be from a reputable source (ex. not from somerandomwebsite.com) and if you are using Perry's Handbook then recognize that the data is not originally from
Foreign Exchange Risk Management at Merck: Background. Decision Models
 Decision Models: Lecture 11 2 Decision Models Foreign Exchange Risk Management at Merck: Background Merck & Company is a producer and distributor of pharmaceutical products worldwide. Lecture 11 Using
$82, $71, $768, $668,609.67
 Question # 1 of 15 ( Start time: 07:14:23 PM ) Total Marks: 1 If you deposit $12,000 per year for 16 years (each deposit is made at the beginning of each year) in an account that pays an annual interest
CHAPTER 2 LITERATURE REVIEW
 CHAPTER 2 LITERATURE REVIEW Capital budgeting is the process of analyzing investment opportunities and deciding which ones to accept. (Pearson Education, 2007, 178). 2.1. INTRODUCTION OF CAPITAL BUDGETING
Chapter Fourteen: Simulation
 TaylCh14ff.qxd 4/21/06 8:39 PM Page 213 Chapter Fourteen: Simulation PROBLEM SUMMARY 1. Rescue squad emergency calls PROBLEM SOLUTIONS 1. 2. Car arrivals at a service station 3. Machine breakdowns 4. Income
Yield Management. Decision Models
 Decision Models: Lecture 10 2 Decision Models Yield Management Yield management is the process of allocating different types of capacity to different customers at different prices in order to maximize
California Department of Transportation(Caltrans)
") California Department of Transportation(Caltrans) Probabilistic Cost Estimating using Crystal Ball Software "You cannot exactly predict an uncertain future" Presented By: Jack Young California Department
California Department of Transportation(Caltrans) Probabilistic Cost Estimating using Crystal Ball Software "You cannot exactly predict an uncertain future" Presented By: Jack Young California Department
Acritical aspect of any capital budgeting decision. Using Excel to Perform Monte Carlo Simulations TECHNOLOGY
 Using Excel to Perform Monte Carlo Simulations By Thomas E. McKee, CMA, CPA, and Linda J.B. McKee, CPA Acritical aspect of any capital budgeting decision is evaluating the risk surrounding key variables
INTRODUCTION TO RISK ANALYSIS IN CAPITAL BUDGETING PRACTICAL PROBLEMS
 CHAPTER8 INTRODUCTION TO RISK ANALYSIS IN CAPITAL BUDGETING PRACTICAL PROBLEMS PROBABILISTIC APPROACH Question 1: A project under consideration is likely to cost `5 lakh by way of fixed assets and requires
Excel Proficiency Exercises
 Excel Proficiency Exercises EXCEL REVIEW 2004-2005 1. Multiplication Table Problem Relative, Absolute, and Mixed Addressing The Exercise Create a 10x10 multiplication table in a spreadsheet, as shown below.
Revenues are forecast to be $100 million each year for the next 10 years, beginning next year.
 Problem 1: DCF (35 points) Bauer Industries is an automobile manufacturer. Management is currently evaluating a proposal to build a plant that will manufacture lightweight trucks. The proposal contains
CAPITAL BUDGETING Shenandoah Furniture, Inc.
 CAPITAL BUDGETING Shenandoah Furniture, Inc. Shenandoah Furniture is considering replacing one of the machines in its manufacturing facility. The cost of the new machine will be $76,120. Transportation
Detailed Course Curriculum Pre-seminar: Excel Crash Course
 December 5 8 2016 Detailed Course Curriculum Pre-seminar: Excel Crash Course We recommend that all boot camp trainees complete our online Excel Crash Course before the seminar. Access is included in enrollment.
Solutions to Problems
 Solutions to Problems 1. The investor would earn income of $2.25 and a capital gain of $52.50 $45 =$7.50. The total gain is $9.75 or 21.7%. $8.25 on a stock that paid $3.75 in income and sold for $67.50.
As a function of the stock price on the exercise date, what do the payoffs look like for European calls and puts?
 Pricing stock options This article was adapted from Microsoft Office Excel 2007 Data Analysis and Business Modeling by Wayne L. Winston. Visit Microsoft Learning to learn more about this book. This classroom-style
CA. Sonali Jagath Prasad ACA, ACMA, CGMA, B.Com.
 MANAGEMENT OF FINANCIAL RESOURCES AND PERFORMANCE SESSIONS 3& 4 INVESTMENT APPRAISAL METHODS June 10 to 24, 2013 CA. Sonali Jagath Prasad ACA, ACMA, CGMA, B.Com. WESTFORD 2008 Thomson SCHOOL South-Western
Pre-seminar: Excel Crash Course
 Pre-seminar: Excel Crash Course Introduction Getting Started The Excel Ribbon Excel Settings Basic Excel Shortcuts, Navigation & Editing Formatting in Excel Excel Navigation Splitting & Freezing Panes
Discussion Questions
 Understanding the Financial Environment of Public Utility Firms Sanford V. Berg Joel F. Houston 1 Overview Our plan is to help facilitate a series of discussions related to utility finance. We will pose
CASE 6: INTEGRATED RISK ANALYSIS MODEL HOW TO COMBINE SIMULATION, FORECASTING, OPTIMIZATION, AND REAL OPTIONS ANALYSIS INTO A SEAMLESS RISK MODEL
 ch11_4559.qxd 9/12/05 4:06 PM Page 527 Real Options Case Studies 527 being applicable only for European options without dividends. In addition, American option approximation models are very complex and
Corporate Valuation. By Edward Bodmer. Finance Energy Institute pg. 1
 Corporate Valuation By Edward Bodmer Finance Energy Institute www.financeenergyinstitutue.com pg. 1 INTERMEDIATE CORPORATE VALUATION MODELLING WITH EXCEL Target Audience The target audience is anyone who
Sunset Company: Risk Analysis For Capital Budgeting Using Simulation And Binary Linear Programming Dennis F. Togo, University of New Mexico
 Sunset Company: Risk Analysis For Capital Budgeting Using Simulation And Binary Linear Programming Dennis F. Togo, University of New Mexico ABSTRACT The Sunset Company case illustrates how the study of
The Journal of Applied Business Research May/June 2009 Volume 25, Number 3
 Risk Manage Capital Investment Decisions: A Lease vs. Purchase Illustration Thomas L. Zeller, PhD., CPA, Loyola University Chicago Brian B. Stanko, PhD., CPA, Loyola University Chicago ABSTRACT This paper
Business Case Modelling 2 Day Course
 Business Case Modelling 2 Day Course This course can be presented in-house for you on a date of your choosing 17 th 18 th May & 29 th 30 th Nov 2018 The Banking and Corporate Finance Training Specialist
Seminar on Financial Management for Engineers. Institute of Engineers Pakistan (IEP)
") Seminar on Financial Management for Engineers Institute of Engineers Pakistan (IEP) Capital Budgeting: Techniques Presented by: H. Jamal Zubairi Data used in examples Project L Project L Project L Project
Seminar on Financial Management for Engineers Institute of Engineers Pakistan (IEP) Capital Budgeting: Techniques Presented by: H. Jamal Zubairi Data used in examples Project L Project L Project L Project
Shanghai Jiao Tong University. FI410 Corporate Finance
 Shanghai Jiao Tong University FI410 Corporate Finance Instructor: Xiaorong Zhang Email: xrzhang@fudan.edu.cn Home Institution: Office Hours: Fudan University Office: Term: 2 July - 2 August, 2018 Credits:
Sample Questions for Chapters 10 & 11
 Name: Class: Date: Sample Questions for Chapters 10 & 11 Multiple Choice Identify the letter of the choice that best completes the statement or answers the question. 1. Sacramento Paper is considering
JEM034 Corporate Finance Winter Semester 2017/2018
 JEM034 Corporate Finance Winter Semester 2017/2018 Lecture #3 Olga Bychkova Topics Covered Today Making investment decisions with NPV rule (more practical guidance) and capital budgeting (chapter 6 in
chapter12 Home Depot Inc. grew phenomenally Cash Flow Estimation and Risk Analysis
 chapter12 Cash Flow Estimation and Risk Analysis Home Depot Inc. grew phenomenally during the 1990s, and it is still growing rapidly. At the beginning of 1990, it had 118 stores and annual sales of $2.8
36106 Managerial Decision Modeling Monte Carlo Simulation in Excel: Part II
 36106 Managerial Decision Modeling Monte Carlo Simulation in Excel: Part II Kipp Martin University of Chicago Booth School of Business November 8, 2017 Reading and Excel Files Reading: Powell and Baker:
 CA - FINAL 1.1 Capital Budgeting LOS No. 1: Introduction Capital Budgeting is the process of Identifying & Evaluating capital projects i.e. projects where the cash flows to the firm will be received
Financial Controls in Project Management Activities
 Financial Controls in Management Activities Objective Complete hands-on exercises to apply cost control techniques Budgeting Budgeting Process Overview Budgeting Budgeting - aggregating the estimated costs
FIN 350 Business Finance Homework 7 Fall 2014 Solutions
 FIN 350 Business Finance Homework 7 Fall 2014 Solutions 1. Home Builder Supply, a retailer in the home improvement industry, currently operates seven retail outlets in Georgia and South Carolina. Management
Uncertainty modeling revisited: What if you don t know the probability distribution?
 : What if you don t know the probability distribution? Hans Schjær-Jacobsen Technical University of Denmark 15 Lautrupvang, 275 Ballerup, Denmark hschj@dtu.dk Uncertain input variables Uncertain system
HPM Module_6_Capital_Budgeting_Exercise
 HPM Module_6_Capital_Budgeting_Exercise OK, class, welcome back. We are going to do our tutorial on the capital budgeting module. And we've got two worksheets that we're going to look at today. We have
Value of Information in Spreadsheet Monte Carlo Simulation Models
 Value of Information in Spreadsheet Monte Carlo Simulation Models INFORMS 010 Austin Michael R. Middleton, Ph.D. Decision Toolworks Mike@DecisionToolworks.com 15.10.7190 Background Spreadsheet models are
1) Side effects such as erosion should be considered in a capital budgeting decision.
 Side effects such as erosion should be considered in a capital budgeting decision.") Questions Chapter 10 1) Side effects such as erosion should be considered in a capital budgeting decision. [B] :A project s cash flows should include all changes in a firm s future cash flows. This includes
Questions Chapter 10 1) Side effects such as erosion should be considered in a capital budgeting decision. [B] :A project s cash flows should include all changes in a firm s future cash flows. This includes
CASH FLOW ESTIMATION AND RISK ANALYSIS
 C H A P T E 12 R CASH FLOW ESTIMATION AND RISK ANALYSIS AP PHOTO/NYSE, MEL NUDELMAN Home Depot Keeps Growing Home Depot Inc. (HD) has grown phenomenally since 1990, and it shows no signs of slowing down.
10. Estimate the MIRR for the project described in Problem 8. Does it change your decision on accepting this project?
 1 CHAPTER 5 Problems and Questions 1. You have been given the following information on a project: It has a five-year lifetime The initial investment in the project will be $25 million, and the investment
An Excel Modeling Practice Problem
 An Excel Modeling Practice Problem Excel Review Excel 97 1999-2000 The Padgett s Widgets Problem Market research by Padgett s Widget Company has revealed that the demand for its products varies with the
Lecture 7. Strategy and Analysis in Using Net Present Value
 Lecture 7 Strategy and Analysis in Using Net Present Value Strategy and Analysis in Using Net Present Value Decision Trees Sensitivity Analysis, Scenario Analysis, and Break-Even Analysis Monte Carlo Simulation
University of Toronto Department of Economics ECO 204 Summer 2013 Ajaz Hussain TEST 2 SOLUTIONS GOOD LUCK!
 University of Toronto Department of Economics ECO 204 Summer 2013 Ajaz Hussain TEST 2 SOLUTIONS TIME: 1 HOUR AND 50 MINUTES DO NOT HAVE A CELL PHONE ON YOUR DESK OR ON YOUR PERSON. ONLY AID ALLOWED: A
The NPV profile and IRR PITFALLS OF IRR. Years Cash flow Discount rate 10% NPV 472,27 IRR 11,6% NPV
 PITFALLS OF IRR J.C. Neves, ISEG, 2018 23 The NPV profile and IRR Years 0 1 2 3 4 5 Cash flow -10000 2000 2500 1000 4000 5000 Discount rate 10% NPV 472,27 IRR 11,6% 5 000,00 NPV 4 000,00 3 000,00 2 000,00
Improved Decision Making Under Uncertainty: Incorporating a Monte Carlo Simulation into a Discounted Cash Flow Valuation for Equities.
 Improved Decision Making Under Uncertainty: Incorporating a Monte Carlo Simulation into a Discounted Cash Flow Valuation for Equities Jack Nurminen Bachelor s Thesis Degree Programme in Finance and Economics
BINARY LINEAR PROGRAMMING AND SIMULATION FOR CAPITAL BUDGEETING
 BINARY LINEAR PROGRAMMING AND SIMULATION FOR CAPITAL BUDGEETING Dennis Togo, Anderson School of Management, University of New Mexico, Albuquerque, NM 87131, 505-277-7106, togo@unm.edu ABSTRACT Binary linear
Software Economics. Introduction to Business Case Analysis. Session 3
 Software Economics Introduction to Business Case Analysis Session 3 Recap How much profit will my investment give? What is the Risk of my Investment? When do I get benefit from my investment? Net Present
MS-E2114 Investment Science Exercise 4/2016, Solutions
 Capital budgeting problems can be solved based on, for example, the benet-cost ratio (that is, present value of benets per present value of the costs) or the net present value (the present value of benets
Chapter 9. Risk Analysis and Real Options
 Chapter 9 Risk Analysis and Real Options Grasp and execute decision trees Practically apply real options in capital budgeting Apply scenario and sensitivity analysis Comprehend and utilize the various
Copyright 2009 Pearson Education Canada
 Operating Cash Flows: Sales $682,500 $771,750 $868,219 $972,405 $957,211 less expenses $477,750 $540,225 $607,753 $680,684 $670,048 Difference $204,750 $231,525 $260,466 $291,722 $287,163 After-tax (1
Essential Learning for CTP Candidates TEXPO Conference 2017 Session #02
 TEXPO Conference 2017: Essential Learning for CTP Candidates Session #2 (Monday. 10:30 11:45 am) ETM5-Chapter 8: Financial Accounting and Reporting ETM5-Chapter 9: Financial Planning and Analysis Essentials
Business Case Modelling 2 Day Course This course is presented in London on: October, May 2018, November 2018
 Business Case Modelling 2 Day Course This course is presented in London on: 30-31 October, 17-18 May 2018, 29-30 November 2018 The Banking and Corporate Finance Training Specialist Background of the trainer
MODELING SCHEDULING UNCERTAINTY IN CAPITAL CONSTRUCTION PROJECTS. S. M. AbouRizk
 Proceedings of the 2005 Winter Simulation Conference M. E. Kuhl, N. M. Steiger, F. B. Armstrong, and J. A. Joines, eds. MODELING SCHEDULING UNCERTAINTY IN CAPITAL CONSTRUCTION PROJECTS Nathan D. Boskers
ECONOMIC ANALYSIS AND LIFE CYCLE COSTING SECTION I
 ECONOMIC ANALYSIS AND LIFE CYCLE COSTING SECTION I ECONOMIC ANALYSIS AND LIFE CYCLE COSTING Engineering Economy and Economics 1. Several questions on basic economics. 2. Several problems on simple engineering
Prioritization of Climate Change Adaptation Options. The Role of Cost-Benefit Analysis. Session 8: Conducting CBA Step 7
 Prioritization of Climate Change Adaptation Options The Role of Cost-Benefit Analysis Session 8: Conducting CBA Step 7 Accra (or nearby), Ghana October 25 to 28, 2016 8 steps Step 1: Define the scope of
Principles of Managerial Finance Solution Lawrence J. Gitman CHAPTER 10. Risk and Refinements In Capital Budgeting
 Principles of Managerial Finance Solution Lawrence J. Gitman CHAPTER 10 Risk and Refinements In Capital Budgeting INSTRUCTOR S RESOURCES Overview Chapters 8 and 9 developed the major decision-making aspects
Monte Carlo Simulation: Don t Gamble Away Your Project Success Maurice (Mo) Klaus January 31, 2012
 Klaus January 31, 2012") MBB Webcast Series Monte Carlo Simulation: Don t Gamble Away Your Project Success Maurice (Mo) Klaus January 31, 2012 Agenda Welcome Introduction of MBB Webcast Series Larry Goldman, MoreSteam.com Monte
MBB Webcast Series Monte Carlo Simulation: Don t Gamble Away Your Project Success Maurice (Mo) Klaus January 31, 2012 Agenda Welcome Introduction of MBB Webcast Series Larry Goldman, MoreSteam.com Monte
Jacob: The illustrative worksheet shows the values of the simulation parameters in the upper left section (Cells D5:F10). Is this for documentation?
. Is this for documentation?") PROJECT TEMPLATE: DISCRETE CHANGE IN THE INFLATION RATE (The attached PDF file has better formatting.) {This posting explains how to simulate a discrete change in a parameter and how to use dummy variables
PROJECT TEMPLATE: DISCRETE CHANGE IN THE INFLATION RATE (The attached PDF file has better formatting.) {This posting explains how to simulate a discrete change in a parameter and how to use dummy variables
Introduction to RELCOST. Carolyn Roos, Ph.D. Northwest CHP Technical Assistance Partnerships Washington State University Energy Program
 Introduction to RELCOST Carolyn Roos, Ph.D. Northwest CHP Technical Assistance Partnerships Washington State University Energy Program 1 Overview of RELCOST Presentation Outline Program use Results A review
Essential Learning for CTP Candidates TEXPO Conference 2017 Session #03
 TEXPO Conference 2017: Essential Learning for CTP Candidates Session #3 (Mon.1:45 3:00 pm) Overview of Basic CTP Math from ETM5 Chap 07: Earnings Credits Chap 11: Working Capital Chap 08: Fin. Statements
Analyzing Project Cash Flows. Chapter 12
 Analyzing Project Cash Flows Chapter 12 1 Principles Applied in This Chapter Principle 3: Cash Flows Are the Source of Value. Principle 5: Individuals Respond to Incentives. 2 Learning Objectives 1. Identify
Simulation. Decision Models
 Lecture 9 Decision Models Decision Models: Lecture 9 2 Simulation What is Monte Carlo simulation? A model that mimics the behavior of a (stochastic) system Mathematically described the system using a set
Oil & Gas Valuation Case Study: Ultra Petroleum [UPL] and its Acquisition of the Uinta Basin Acreage SHORT Recommendation
![Oil & Gas Valuation Case Study: Ultra Petroleum [UPL] and its Acquisition of the Uinta Basin Acreage SHORT Recommendation](/thumbs/77/76333188.jpg "Oil & Gas Valuation Case Study: Ultra Petroleum [UPL] and its Acquisition of the Uinta Basin Acreage SHORT Recommendation") Oil & Gas Valuation Case Study: Ultra Petroleum [UPL] and its Acquisition of the Uinta Basin Acreage SHORT Recommendation NOTES AND DISCLAIMERS: First, please do not construe this as investment advice.
Oil & Gas Valuation Case Study: Ultra Petroleum [UPL] and its Acquisition of the Uinta Basin Acreage SHORT Recommendation NOTES AND DISCLAIMERS: First, please do not construe this as investment advice.
A Brief Guide to Engineering Management Financial Calculations in ENGM 401 Section B1 Winter 2009
 A Brief Guide to Engineering Management Financial Calculations in ENGM 401 Section B1 Winter 2009 MG Lipsett 2008 last updated December 8, 2008 Introduction This document provides concise explanations
Elementary Statistics Triola, Elementary Statistics 11/e Unit 14 The Confidence Interval for Means, σ Unknown
 Elementary Statistics We are now ready to begin our exploration of how we make estimates of the population mean. Before we get started, I want to emphasize the importance of having collected a representative
BFC2140: Corporate Finance 1
 BFC2140: Corporate Finance 1 Table of Contents Topic 1: Introduction to Financial Mathematics... 2 Topic 2: Financial Mathematics II... 5 Topic 3: Valuation of Bonds & Equities... 9 Topic 4: Project Evaluation
A Brief Guide to Engineering Management Financial Calculations in ENGM 401 & ENGM 620 Section X1 Fall 2010
 A Brief Guide to Engineering Management Financial Calculations in ENGM 401 & ENGM 620 Section X1 Fall 2010 MG Lipsett last updated October 21, 2010 Introduction This document provides concise explanations
THE UNIVERSITY OF NEW SOUTH WALES JUNE / JULY 2006 FINS1613. Business Finance Final Exam
 Student Name: Student ID Number: THE UNIVERSITY OF NEW SOUTH WALES JUNE / JULY 2006 FINS1613 Business Finance Final Exam (1) TIME ALLOWED - 2 hours (2) TOTAL NUMBER OF QUESTIONS - 50 (3) ANSWER ALL QUESTIONS
Real Options. Katharina Lewellen Finance Theory II April 28, 2003
 Real Options Katharina Lewellen Finance Theory II April 28, 2003 Real options Managers have many options to adapt and revise decisions in response to unexpected developments. Such flexibility is clearly
Sixth Edition. Global Edition CONTEMPORARY ENGINEERING ECONOMICS. Chan S. Park Department of Industrial and Systems Engineering Auburn University
 Sixth Edition Global Edition CONTEMPORARY ENGINEERING ECONOMICS Chan S. Park Department of Industrial and Systems Engineering Auburn University PEARSON Boston Columbus Indianapolis New York San Francisco
80 Solved MCQs of MGT201 Financial Management By
 80 Solved MCQs of MGT201 Financial Management By http://vustudents.ning.com Question No: 1 ( Marks: 1 ) - Please choose one What is the long-run objective of financial management? Maximize earnings per
36106 Managerial Decision Modeling Sensitivity Analysis
 1 36106 Managerial Decision Modeling Sensitivity Analysis Kipp Martin University of Chicago Booth School of Business September 26, 2017 Reading and Excel Files 2 Reading (Powell and Baker): Section 9.5
Oil & Gas Modeling: Quiz Questions Module 3 Valuation and Simplified NAV Model
 Oil & Gas Modeling: Quiz Questions Module 3 Valuation and Simplified NAV Model 1. Some people argue that you SHOULD factor in the Net Value of Derivatives used for commodity price hedging when calculating
Topic 1 (Week 1): Capital Budgeting
: Capital Budgeting") 4.2. The Three Rules of Time Travel Rule 1: Comparing and combining values Topic 1 (Week 1): Capital Budgeting It is only possible to compare or combine values at the same point in time. A dollar today
4.2. The Three Rules of Time Travel Rule 1: Comparing and combining values Topic 1 (Week 1): Capital Budgeting It is only possible to compare or combine values at the same point in time. A dollar today
Essential Learning for CTP Candidates Carolinas Cash Adventure 2018 Session #CTP-04
 Carolinas Cash Adventure - 2018: CTP Track Financial Statements, Analysis & Decisions Session #4 (Mon. 9:15 10:15 am) ETM5-Chapter 8: Financial Accounting and Reporting ETM5-Chapter 9: Financial Planning
Strategic Investment & Finance Solutions to Exercises
 Strategic Investment & Finance Solutions to Exercises Exercise 1 Question a 40 30 30 20 20 0 1 2 3 4 5-100 With a discount rate equal to 10%: NPV 0 = 100 +40 1.1 1 +30 1.1 2 +30 1.1 3 +20 1.1 4 + 20 1.1
How to Consider Risk Demystifying Monte Carlo Risk Analysis
 How to Consider Risk Demystifying Monte Carlo Risk Analysis James W. Richardson Regents Professor Senior Faculty Fellow Co-Director, Agricultural and Food Policy Center Department of Agricultural Economics
FNCE 370v8: Assignment 3
 FNCE 370v8: Assignment 3 Assignment 3 is worth 5% of your final mark. Complete and submit Assignment 3 after you complete Lesson 9. There are 12 questions in this assignment. The break-down of marks for
Using Real Options to Quantify Portfolio Value in Business Cases
 Using Real Options to Quantify Portfolio Value in Business Cases George Bayer, MBA, PMP Cobec Consulting, Inc. www.cobec.com Agenda Contents - Introduction - Real Options in Investment Decisions - Capital
Lecture 7. Introduction to Retailer Simulation Summary and Preparation for next class
 Decision Models Lecture 7 1 Portfolio Optimization - III Introduction to Options GMS Stock Hedging Lecture 7 Introduction to Retailer Simulation Summary and Preparation for next class Note: Please bring
Lab 6. Microsoft Excel
 Lab 6 Microsoft Excel Objective At the end of this lesson, you should be able to describe components and functions in Excel perform and apply basic Excel operations Introduction to Management Information
Principles of Corporate Finance
 Principles of Corporate Finance Professor James J. Barkocy Business, that s easily defined it s other people s money. Peter Drucker McGraw-Hill/Irwin Copyright 2015 by The McGraw-Hill Companies, Inc. All