1Q17 Earnings. Release 1Q17 EARNINGS RELEASE CONFERENCE CALL
|
|
|
- Moris Roberts
- 6 years ago
- Views:
Transcription
 12:00 a.m. (Brasília time) Phone: +1 (412) 317-5450 Code: EZTEC Replay: +1 (412) 317-0088 Code: 10105007 Portuguese: November 12 th, 2017 09:30 a.m. (US EST) 10:30 a.")
1 1Q17 Earnings 1Q17 EARNINGS RELEASE CONFERENCE CALL Release English: November 12 th, :00 a.m. (US EST) 12:00 a.m. (Brasília time) Phone: +1 (412) Code: EZTEC Replay: +1 (412) Code: Portuguese: November 12 th, :30 a.m. (US EST) 10:30 a.m. (Brasília time) Phone: +55 (11) Code: EZTEC Replay: +55 (11) Code: EZTEC Contact IR: A. Emílio C. Fugazza Chief Financial Officer and Investors Relations Officer Tel.: +55 (11) EZTEC S.A. ON (Bovespa: EZTC3) Closing Price: R$21.61 # shares: 165,001,783 Market Share: R$3.566MN Date: 11/05/2017 For further information, please see page 27 of this document.
2 1Q17 Earnings Release EZTEC begins 2017 with R$31 million in Net Income Gross Margin of 47% and Net Margin of 33% São Paulo, May 11 th, EZTEC S.A. (BOVESPA: EZTC3) celebrates its 38 th anniversary as one of the most profitable builders and developers in Brazil. The Company announces its results for the first quarter of 2017 (1Q17). Except where stated otherwise, EZTEC s operating and financial information is presented on a consolidated basis and in Brazilian real (R$), in accordance with Generally Accepted Accounting Principles in Brazil ("BR GAAP") and the International Financial Reporting Standards (IFRS) applicable to real estate developers in Brazil, as approved by the Accounting Pronouncement Committee (CPC), Securities and Exchange Commission of Brazil (CVM) and Federal Accounting Board (CFC). Since January 1 st, 2013, the rules of the IFRS 10 and IFRS 11 were taken into effect. These rules regard the projects with shared control. When adopting the norms of the CPC 19, a share of the Assets and Liabilities, Revenues and Expenses stop being consolidated proportionally to the Company s stake. These changes will affect neither the Shareholder s Equity nor the Company s Net Income. OPERATING AND FINANCIAL HIGHLIGHTS By the end of the first quarter of 2017, EZTEC reported a Cash Equivalents and Financial Investments position of R$589 million. By excluding the Gross Debt of R$348 million (exclusively composed of SFH financing), the Company s Net Cash stands at R$241 million, of which R$30.9 million was Cash Generation in 1Q17. This is complemented by Performed Receivables from real estate projects of R$500 million, which is available for securitization and yields IGP-M + 10 to 12% p.a.; Net Revenue reached R$97 million in 1Q17; Gross Income totaled R$46 million, with Gross Margin of 47.2% in 1Q17,; EBITDA reached R$11 million for a EBITDA Margin of 11.3% in 1Q17; Net Income reached R$32 million, with Net Margin of 33% in 1Q17; In the 1Q17 EZTEC has not launched any project; EZTEC s Contracted Sales, net of rescissions, reached R$154 million in the 1Q17; On March 31th, 2017, the Company s Landbank totaled R$5.5 billion in own PSV. The average acquisition cost for these plots, including costs regarding increases in constructive potential, is 13.6% of the PSV; A Dividend Distribution in the amount of R$180,213, was approved in the shareholders General Assembly, representing a distribution of R$1.09 per share and a payout of 78.3%. Highlights 1Q17 1Q16 Va r.% 1Q17 4 Q16 Va r.% Net Revenue (R$ '000) % % Gross Profit (R$ '000) % % Gross Margin 47,2% 47,0% 0,2 p.p. 47,2% 53,6% - 6,4 p.p. Net Income (R$ '000) % % Net Margin 32,7% 49,0% - 16,3 p.p. 238,5% 45,6% 192,9 p.p. EPS (R$ '000) 0,191 0,446-57% 0,191 0,418-54% EBITDA (R$ '000) % % EBITDA Margin 11,3% 35,3% - 24,0 p.p. 11,3% 38,0% - 26,7 p.p. Number of Launched Developments - 1 n.a % Launched Usable Area (in '000 sq.m) - 6,9 n.a. 24,6 8,9 177% Launched Units - 38 n.a % PSV (R$ '000) (1) n.a % EZTEC s Stake total Launches (%) - 50% n.a. 80% 100% - 0,2 p.p. EZTEC s PVS (R$' 000) (2) n.a % Acquisition of Shares PSV (R$ '000) - - n.a. - 25,5 n.a. EZTEC's Contracted Sales (R$ '000) % % (1) Total PSV, regardless of the Company s share in the projects. (2) Calculated by multiplying total PSV by the Company's share in the projects. Page 2 of 30

3 INDICATORS OF FINANCIAL AND OPERATING PERFORMANCE I Page 3 of 30


4 INDICATORS OF FINANCIAL AND OPERATING PERFORMANCE II Page 4 of 30
5 CONTENTS INDICATORS OF FINANCIAL AND OPERATING PERFORMANCE I... 3 INDICATORS OF FINANCIAL AND OPERATING PERFORMANCE II... 4 MANAGEMENT S COMMENTS... 6 INCOME STATEMENT... 7 BALANCE SHEET... 8 INFORMATION BY SEGMENT... 9 FINANCIAL PERFORMANCE Net Revenue Cost of Properties Sold and Services Rendered Gross Profit Other Operating Revenue and Expenses Equity Income EBITDA Income and Social Contribution Taxes Net Income Deferred Revenue and Income Accounts Receivable Net Cash and Indebtedness OPERATIONAL INDICATORS Operations Land Bank Launches Units in Inventory CAPITAL MARKETS Ownership Structure Net Asset Value Return on Shareholders Equity CONFERENCE CALL AND MEETINGS ANNEX I: CONSOLIDATED CASH FLOW ANNEX II: REVENUE BY PROJECT GLOSSARY Page 5 of 30
6 MANAGEMENT S COMMENTS EZTEC s Management announces its consolidated results for the first quarter of 2016 with positive net profits and cash generation. The period has been marked by vacations and prolonged festivities this year, hurting inventory sales. In parallel to the sales efforts, the Company has worked in preparation for the launches for the following quarters, as is already the case for the first launch in April Net sales have remained positive, cancellations have remained stable, and the Company keeps delivering project constructions under the budget. SALES AND GROSS MARGIN: gross sales in the end of the quarter were R$114 million, 80% of which refer to ready units. Cancellations have totaled R$105 million in the period, remaining at the same level of magnitude as the previous quarter, culminating in net sales at R$9 million. The gross margin has reached 47.2 in the 1Q17, reflecting the accounting of budget economies in the constructions delivered in March/17. This level of margins, added to the Company s cash position, allows the Company to grant discounts in a judicious fashion and at the adequate moment, without the need to liquidate the Company s assets, ultimately allowing for a healthy profitability of its products. MANAGEMENT OF RECEIVABLES AND CANCELLATIONS: in analyzing the stability in the amount of cancellations incurred in the 1Q17 relative to that of the 4Q17, it is worth highlighting the volume of deliveries scheduled for the year. This has been accompanied by concentrated efforts to convert sales into transfers to banks, into the direct acquittance of the debt, and into statutory liens agreements. In that sense, the measures taken include: [i] in the month of February, 2017, the Company officially altered the financing agent for the Cidade Maia project the main delivery for the year to the Bank Caixa Econômica Federal, aiming to achieve better conditions for the final client to ultimately transfer their debt; [ii] campaigns offering discounts for those who acquitted the debt using their own resources; [iii] the Company s payment of the property transfer tax (ITBI) and of the registration for clients who make their transfer to the bank effective within the designated timeline; and [iv] statutory lien, whose total amount (including shared projects) has reached R$311 million by the end of the quarter, rewarding 10% to 12% of interest plus inflation (IGP-DI), which can be subjected to securitization, representing an important credit option that has assisted in the channeling of ready inventory. FINANCIAL RESULTS: EZTEC has obtained Net Revenues of R$96.5 million in the 1q17, for a Net Income of R$31.6 million, and Net Margin of 32.7%, justified by the smaller quantity of launches and volume of construction execution in the past quarters. Nonetheless, relative to the 1Q16, administrative expenses have dropped by 9.5%, reflecting the current conjuncture, while commercial expenses exhibit a rise of 6%, demonstrating the eagerness to take up on investments for new launches. CASH POSITION: The Company has ended the first quarter of 2017 with R$241.3 million in Net Cash, having generated R$30.9 million, reflecting the Company s active management over the outstanding balance of its clients who already have received their keys, be it through the transfer of the debt to a bank, or through the aquittance directly from the client. This financial position has allowed the Company s Management to submit and approve an extraordinary dividend distribution in the shareholders General Assembly of 04/28/2017 added to the legally required distribution, it totals R$180,213,662.18, implying R$1.09 per share, the greatest dividend paid by EZTEC, equivalent to a payout of 78.3%. EZTEC s Management reaffirm its commitment to its clients and shareholders, fulfilling its role in building and delivering high quality products, with a transparent management, constantly striving to deliver the best results to its investors, adding value to the foundations that have sustained the Company. EZTEC s Management. Page 6 of 30
7 INCOME STATEMENT Consolidated Income Statement Periods ended in March 31 th In thousands of Brazilian Reais (R$) 1Q17 1Q16 Var. % 1Q17 4Q16 Var. % Gross Operating Revenue % % Revenue from Sale of Real Estate % % Revenue from Services and Rental % % Gross Revenue % % Deductions from Gross Revenue (84.460) (85.467) -1% (84.460) (90.563) -7% Cancelled Sales (81.641) (81.550) 0% (81.641) (86.991) -6% Taxes on Sales, including Deferred Taxes (2.819) (3.917) -28% (2.819) (3.572) -21% Net Revenue % % Cost of Real Estate Sold, Rentals and Services (50.930) (79.574) -36% (50.930) (70.215) -27% Gross Profit % % Gross Margin 47,2% 47,0% 0,2 p.p. 47,2% 53,6% -6,4 p.p. (Expenses) / Operational Revenues (34.913) (19.044) 83% (34.913) (20.435) 71% Selling Expenses (16.359) (15.398) 6% (16.359) (13.188) 24% Administrative Expenses (17.881) (19.655) -9% (17.881) (16.494) 8% Management Fees (2.379) (2.720) -13% (2.379) (2.638) -10% Other Operating (Expenses) / Revenues (2.803) (3.844) -27% (2.803) % Equity Income % % Income from Operations before Financial Income % % Operational Margin 11,1% 34,3% -23,3 p.p. 11,1% 40,1% -29,1 p.p. Financial Income (Expenses) % % Financial Expenses (4.249) (4.850) -12% (4.249) (3.310) 28% Financial Income % % Operational Result % % Income Before Income Tax & Soc. Contrib % % Income Tax and Social Contribution (912) (1.948) -53% (912) (7.006) -87% (-) Current (3.391) (4.372) -22% (3.391) (4.631) -27% (-) Deferred % (2.375) -204% Net Income % % Attributable to Non-Controlling Interests (747) (24) 3014% (747) (1.675) -55% Attributable to Controlling Interests % % Net Margin 32,7% 49,0% -16,3 p.p. 32,7% 45,6% -12,9 p.p. *Throughout this release, the expression Net Income refers to the Net Income Attributable to the Controlling Shareholders. This line excludes the interest of minority developers from the results of subsidiaries. Page 7 of 30
8 BALANCE SHEET Balance Sheets Periods ended in March 31th In thousands of Brazilian Reais (R$) 1Q Var. % Assets % Current Assets % Cash and Cash Equivalents % Financial Investments % Trade Accounts Receivable % Real Estate Held for Sale % Recoverable Taxes % Dividends Receivables from Investments % Other Receivables % Non-Current Assets % Trade Accounts Receivable % Real Estate Held for Sale % Recoverable Taxes % Prepaid Taxes 54 0 n.a. Due from Related Parties % Notes receivable % Dividends Receivables from Investments 0 0 n.a. Other Receivables % Goodw ill over Investments n.a. Investments % Property and Equipment % Intangible % Liabilities & Shareholder's Equity % Current Liabilities % Suppliers % Payroll Obligations % Tax Obligations % Loans and Financing % Trade Accounts Payable % Reserve for Guarantee % Advances from Customers % Land Payable % Dividends Payable % Due to Related Parties % Deferred Taxes % Non-Current Liabilities % Loans and Financing % Land Payable % Reserve for Guarantee % Reserve for Contingencies % Deferred Taxes % Other Debts to Third Parties % Shareholder s Equity % Controlling Interests % Capital % Capital Reserve % Earnings Reserves % Accumulated Profits n.a. Special Goodw ill Reserve ,0% Income for the Period n.a. Non-Controlling Interests % Page 8 of 30
9 INFORMATION BY SEGMENT Results by Segment (Amount expressed in thousands of Brazilian Reais - R$) Commercial Residential 1Q17 1Q16 Var.% 1Q17 1Q16 Var.% Net Revenue ,6% ,3% Cost of Real Estate Sold and Services 166 (4.388) -103,8% (75.186) (50.930) 47,6% Gross Profit ,4% ,7% Gross Margin (%) 102,1% 51,5% 50,6 p.p. 46,7% 47,2% -0,5 p.p. Selling Expenses (3.032) (2.927) 3,6% (13.327) (12.471) 6,9% Assets and Liabilities by Segment (Amount expressed in thousands of Brazilian Reais - R$) Commercial Residential 1Q Var.% 1Q Var.% ASSETS Accounts Receivable ,1% ,3% Real Estate Held for Sale ,6% ,3% LIABILITIES Loans and Financing - - n.a ,5% Advances from Customers - - n.a ,6% Operational Results by Segment Commercial Residential 1Q17 1Q16 Var.% 1Q17 1Q16 Var.% Number of Launched Developments - - n.a. - 1 n.a. PSV (R$ '000) - - n.a ,0% Launched Usable Area (in thousands of sq.m) - - n.a. - 6,9 n.a. Launched Units (Units) - - n.a ,0% Launched Units Average Price (R$ '000) - - n.a n.a. Developments Average Price (R$/sq.m) - - n.a ,0% EZTEC s Stake Total Launches (%) - - n.a. - 50,0% n.a. EZTEC s PSV (R$ '000) - - n.a ,0% EZTEC's Contracted Sales (R$ '000) ,1% ,8% Contracted Sales (Units) ,7% ,0% Page 9 of 30
10 FINANCIAL PERFORMANCE Financial Highlights 1Q17 1Q16 Var.% 1Q17 4Q16 Var.% Gross Revenue (R$ '000) ,2% ,2% Net Revenue (R$ '000) page ,7% ,3% Cost of Real Estate Sold and Services (R$ '000) page11 (50.930) (79.574) -36,0% (50.930) (70.215) -27,5% Gross Profit (R$ '000) page ,5% ,9% Gross Margin (%) 47,2% 47,0% 0,2 p.p. 47,2% 53,6% -6,4 p.p. Selling Expenses (R$ '000) page12 (16.359) (15.398) 6,2% (16.359) (13.188) 24,0% General and Administrative Expenses (R$ '000) page12 (20.260) (22.375) -9,5% (20.260) (19.132) 5,9% Other Operating (Expenses) / Revenues (R$ '000) page13 (2.803) (3.844) -27,1% (2.803) ,8% Equity Income (R$ '000) page ,0% ,5% EBITDA (R$ '000) page ,4% ,0% EBITDA Margin (%) 11,3% 35,3% -24,0 p.p. 11,3% 38,0% -26,7 p.p. Financial Income (R$'000) page ,0% ,2% Income Tax and Social Contribution (R$'000) page14 (912) (1.948) -53,2% (912) (7.006) -87,0% Net Income (R$ '000) page ,1% ,3% Net Margin (%) 32,7% 49,0% -16,3 p.p. 32,7% 45,6% -12,9 p.p. EPS (R$) (1) 0,191 0,47-59,2% 0,191 0,42-54,3% Net Revenue Revenues from the sale of real estate projects are accounted for according to the percentage of completion (PoC) method, which is measured based on the costs incurred as a proportion of the total budgeted cost of the units sold in the projects, in line with the procedure stipulated by OCPC 04/12, discounting for the Adjustments to Present Value (AVP), in accordance with CPC 12. As the Company has reported in the past quarters, net revenues have reduced due to the reduction of construction sites. In this conjuncture, a scenario of increased revenues will largely depend upon inventory sales and smaller cancellations. It is worth remarking that the revenues coming from rents have started to be recognize in EZ Towers Tower B, albeit without any cash effect for the moment. The total Rental Revenue, including that of other commercial offices, parking, and plots, have reached R$7.3 million in the quarter. Managerial Data 1Q17 Page 10 of 30
![Cost of Properties Sold and Services Rendered Cost of properties sold and services rendered are essentially comprise of the following costs: [i] lot acquisition; [ii] project development; [iii]](/docs-images/79/79742195/images/11-2.jpg "construction; [iv] maintenance (including provisions); and [v] financial charges related to production financing (SFH). The Cost of Properties Sold totaled R$50.9 million in 1Q17; versus R$70.")
11 Cost of Properties Sold and Services Rendered Cost of properties sold and services rendered are essentially comprise of the following costs: [i] lot acquisition; [ii] project development; [iii] construction; [iv] maintenance (including provisions); and [v] financial charges related to production financing (SFH). The Cost of Properties Sold totaled R$50.9 million in 1Q17; versus R$70.2 million in The decrease is accounted for by a combination of three factors: [i] cost savings in projects delivered; [ii] a decrease in volume of construction and [iii] a reduction in net sales. A breakdown of costs by type is presented below: Cost by Nature (Amount expressed in thousands of Brazilian Reais - R$) 1Q17 1Q16 Var.% 1Q17 4Q16 Var.% Cost of Construction / land (45.710) (75.664) -39,6% (45.710) (69.929) -34,6% Capitalized Financial Charges (4.983) (3.780) 31,8% (4.983) (4.428) 12,5% Maintenance / Guarantee (237) (130) 82,3% (237) ,8% Total Costs (50.930) (79.574) -36,0% (50.930) (73.961) -31,1% Managerial Data 1Q17 Gross Income The year s Gross Income reached R$45.6 million, for a Gross Margin of 47.2%, which has remained stable relative to the 1Q16. This margin level, above the Company s minimally required profitability standard, has been reached through economies in constructions that have offset discounts and cancellations. Page 11 of 30
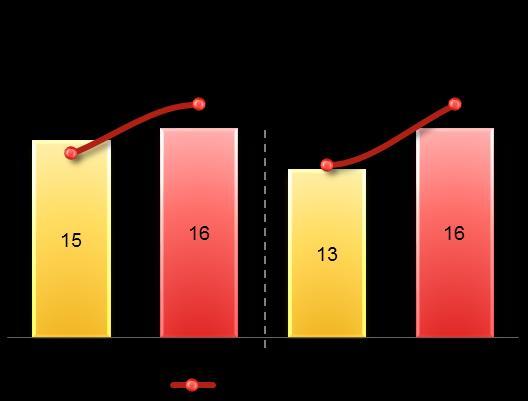
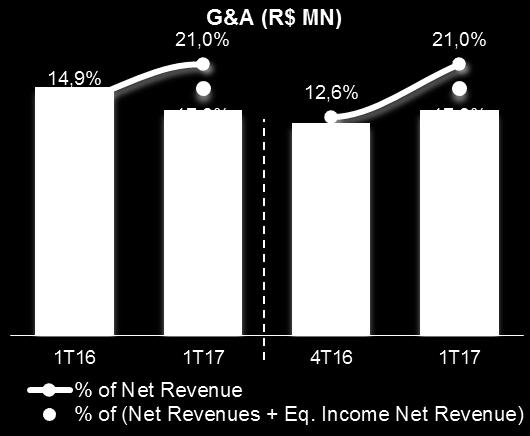
12 Selling and Administrative Expenses The following table presents a breakdown of Selling and Administrative Expenses as a percentage of Net Revenue: Selling, General and Administrative Expenses (SG&A) (Amount expressed in thousand of Brazilian Reais R$) 1Q17 1Q16 Var.% 1Q17 4Q16 Var.% Selling Expenses (16.359) (15.398) 6,2% (16.359) (13.188) 24,0% % of Net Revenue 17,0% 10,3% 6,7 p.p. 17,0% 8,7% 8,2 p.p. General and Administrative Expenses (G&A) (20.260) (22.375) -9,5% (20.260) (19.132) 5,9% % of Net Revenue 21,0% 14,9% 6,1 p.p. 21,0% 12,6% 8,4 p.p. Administrative Expenses (17.881) (19.655) -9,0% (17.881) (16.494) 8,4% Management Fees (2.379) (2.720) -12,6% (2.379) (2.638) -9,8% Total SG&A (36.619) (37.773) -3,1% (36.619) (32.320) 13,3% % of Net Revenue 37,9% 25,1% 12,8 p.p. 37,9% 21,3% 16,6 p.p. EZTEC recognized integrally all of the Commercial Expenses directly in its income statement at the moment that they are realized. Commercial expenses include all expenses related to tangible assets (sales stands, model apartments and their related furniture), advertising costs and other expenses related to the marketing efforts of developments, besides expenses related to brokerage fees Selling Expenses vary depending on the Company s need to carry out campaigns or invest in new sales stands or decorated apartments, either for upcoming launches or for inventory. It is also worth to highlight the impact of carrying expenses for ready units (including the expenses relating to the vacancy of EZ Towers Tower B). Selling Expenses by Nature (Amount expressed in thousands of Brazilian 1Q17 1Q16 Var.% 1Q17 4Q16 Var.% Advertising Expenses and Others (8.486) (11.601) -26,9% (8.486) (9.660) -12,2% expenses for property tax and condominium (5.290) (2.927) 80,7% (5.290) (3.248) 62,9% Expenses w ith stand (2.583) (870) 196,9% (2.583) (280) 822,5% Total Selling Expenses (16.359) (15.398) 6,2% (16.359) (13.188) 24,0% Page 12 of 30
13 General and Administrative Expenses totaled R$20.3 million in 1Q17, a nominal reduction of 10% relative to the first quarter of the previous year, as a result mainly of the economies in services within the payroll. The Administrative Expense / Net Revenue ratio was 21% in 1Q17, or 17% when considering the Revenue coming from Equity Income (projects over which EZTEC has a shared control), reminding that the Company is responsible for the integral administration of all of its projects, independently of fully having control over them or not.. Therefore, considering the IFRS 10 and IFRS 11 rules and the norms of CPC 19, Revenues from non-controlled projects are consolidated only by Equity Income, while the Expenses created for the management of these projects are still fully recognized in the Company s results. It s important to point out that EZTEC has been reviewing its expenses and administrative process in search of higher efficiency. G&A by Nature (Amount expressed in thousand of Brazilian Reais R$) 1Q17 1Q16 Var.% 1Q17 4Q16 Var.% Payroll and related taxes (1) (9.140) (9.645) -5,2% (9.140) (8.740) 4,6% Employee Benefits (1.281) (1.694) -24,4% (1.281) (1.186) 8,0% Depreciation and Amortization (592) (677) -12,6% (592) (1.391) -57,4% Service expenses (3.934) (4.812) -18,2% (3.934) (3.626) 8,5% Rentals and common area maintenance fees (1.110) (528) 110,2% (1.110) (562) 97,5% Maintenance of properties (130) (160) -18,8% (130) (89) 46,1% Taxes and Fees (240) (388) -38,1% (240) (313) -23,3% Other expenses (3.833) (4.471) -14,3% (3.833) (3.225) 18,9% Total G&A (20.260) (22.375) -9,5% (20.260) (19.132) 5,9% (1) Including Board s Fees Other Operating Revenue and Expenses The following table presents a breakdown of the line "Other Operating Revenue and Expenses" as a percentage of Net Revenue: Other Operating Revenue and Expenses (Amount expressed in thousand of Brazilian Reais R$) 1Q17 1Q16 Var.% 1Q17 4Q16 Var.% Total Other Operating Revenue and Expenses (2.803) (3.844) -27% (2.803) ,8% % of Net Revenue 2,9% 2,6% 0,3 p.p. 2,9% 2,2% 0,7 p.p. Tax Expenses (2.414) (2.936) -17,8% (2.414) (367) 557,8% Other Operating Revenue and Expenses (389) (908) -57,2% (389) ,6% Equity Income % ,5% % of Net Revenue 4,7% 15,0% -10,4 p.p. 4,7% 5,7% -1,0 p.p. Tax Expenses include basically expenses with the urban real estate tax (IPTU) and other taxes related to EZTEC s lots and units in inventory. Equity Income The IFRS 10 and IFRS 11 rules, which regard projects with shared control, were taken into effect in In adopting the CPC 19 norms, the share of Assets and Liabilities, Revenues and Expenses in projects that are not controlled by EZTEC cease being consolidated proportionally to EZTEC s stake in them. The Company understands as non-controlled projects those whose operational and financial decisions are not taken exclusively by EZTEC. Page 13 of 30
14 The table below shows the sum of the net results of non-controlled projects, subject to the Equity Income method, in proportion to the Company s stake in them. It is important to note that most shared-control projects have already been delivered, so their result becomes dependent on the sale of inventory units. Results for Shared Control projects (in R$ MN) 1Q17 1Q16 Var.% 1T17 4T16 Var.% Gross Revenues 44,1 71,0-37,9% 44,1 73,9-40,4% Sales Cancellations 22,7 32,8-30,9% 22,7 32,1-29,4% Taxes from Sales 0,5 0,6-16,2% 0,5 1,2-57,4% Net Revenues 20,9 37,5-44,4% 20,9 40,5-48,5% Cost of Real Estate Sold and Services 12,5 12,6-0,1% 12,5 24,9-49,7% Gross Profit 8,3 25,0-66,7% 8,3 15,6-46,7% Gross Margin (%) 39,9% 66,6% -26,7 p.p. 39,9% 38,5% 1,4 p.p. Commercial Expenses 3,1 5,5-43,8% 3,1 2,8 8,7% Net Revenues 4,5 22,6-79,8% 4,5 8,6-46,9% Cost of Real Estate Sold and Services 0,2 0,6-3831,9% 0,2 0,2 65,6% Net Income 4,5 22,6-79,8% 4,5 8,6-46,9% Net Margin (%) 21,8% 60,1% -38,3 p.p. 21,8% 21,1% 0,7 p.p. Average Control (% Net Revenue) (1) 61,1% 54,5% 6,6 p.p. 61,1% 56,5% 4,5 p.p. (1) Averages the stakes that EZTEC has among all projects in which it has a shared control, weighted for each project s revenue contribution. Balance Sheet for Shared Control projects (in R$ MN) 1Q17 1Q16 Var.% 1Q17 3Q16 Var.% Assets Cash and Equivalents 19,8 18,7 5,8% 19,8 28,1-29,6% Trade Accounts Receivable 168,9 390,3-56,7% 168,9 377,4-55,2% Real Estate held for Sale 201,1 208,7-3,7% 201,1 223,3-9,9% Liabilities Loans and Financing 60,3 111,6-46,0% 60,3 103,4-41,8% Advances from Customers 3,9 10,1-61,2% 3,9 7,6-48,9% From the table above, it is worth pointing out that, out of the total of receivables, R$32.9 million correspond to clients who have signed a statutory lien, having its outstanding balance financed directly by the Company. EBITDA In the 1Q17, EBITDA reached R$10.9 million with an EBITDA Margin of 11.3%. Such EBITDA margin level reflects [i] the lower dilution in operating expenses, given the quarter s diminished revenue; and [ii] the lower volume of equity income, from shared-control projects, when compared to previous quarters. Page 14 of 30
15 The following table shows in greater detail the EBITDA calculation adopted by EZTEC: EBITDA (Amount expressed in thousand of Brazilian Reais R$) 1Q17 1Q16 Var.% 1Q17 4Q16 Var.% Net Income ,1% ,3% Income Tax and Social Contribution ,2% ,0% Net Financial Result (22.557) (24.008) -6,0% (22.557) (16.932) 33,2% Depreciation and Amortization ,8% 990 (1.591) -162,2% EBITDA (1) ,4% ,0% EBITDA Margin (%) 11,3% 35,3% -24,0 p.p. 11,3% 38,0% -26,7 p.p. (1) EBITDA corresponds to net income before income and social contribution taxes, net financial result and expenses with depreciation and amortization. EBITDA is not a financial statement line in accordance with BR GAAP and does not represent cash flow for the periods presented. EBITDA does not have a standardized meaning and the definition of EBITDA used by EZTEC may not be comparable with that used by other companies. Net Financial Result In 1Q17, EZTEC registered a Net Financial Result of R$22.6 million, of which R$10.1 million is related to the Interest Income on Trade Accounts Receivable from our Performed Receivables; R$15.2 million relate to appliances. Financial Result by Nature (Amount expressed in thousand of Brazilian Reais R$) 1Q17 1Q16 Var.% 1Q17 4T16 Var.% Financial Revenues Financial Income ,6% ,1% Interest Income on Trade Accounts Receivable ,3% ,7% Other ,5% ,9% Total Revenues ,1% ,4% Fianancial Expenses Interest and Inflation Adjustments Losses (1.351) (78) 1632,1% (1.351) (53) 2449,1% Discounts on Trade Accounts Receivable (2.341) (4.580) -48,9% (2.341) (3.238) -27,7% Other (557) (192) 190,1% (557) (19) 2831,6% Total Expenses (4.249) (4.850) -12,4% (4.249) (3.310) 28,4% Net Financial Result ,0% ,2% Income and Social Contribution Taxes Income and Social Contribution Taxes amounted to R$0.9 million in the 1Q17, versus R$1.9 million in the 1Q16. EZTEC adopts Risk Segregation structures for its projects. This is justified partially by the fact that it leads to tax benefits on Revenue generated, in the form of a 4% tax rate (PIS+COFINS+IR+CSLL). Complementarily, since the mechanism obligatorily segregates the cash from its projects, it leads to a lower use of production financing, better margins for the Company, and, most importantly, conveys to clients, banks and suppliers a sense of security regarding the project s financial resources management. Net Income Net Income, in the 1Q17, reached R$31.6 million, with a Net Margin at 32.7%. In observing the reduction in quarterly net income, it is important to note the impact on net income that comes from the decline in net revenue both that from consolidated projects as that from projects under shared control due to the reduction in the volume of construction execution. Page 15 of 30
16 Deferred Revenue and Income Deferred Revenue, accounted for according to the percentage of conclusion (PoC) method, was R$86.6 million in the 1Q17. The table below shows the Company s Deferred Revenue, costs and income, as well as the expected margin of 49.4% related to the units that have been sold but still to be constructed: Revenues and Results to be Recognized (Amount expressed in thousand of Brazilian Reais R$) 1Q17 4Q16 Var.% 1Q17 1Q16 Var.% Revenues to be Recognized - end of the period ,9% ,4% Present Value Adjustment - On-Balance ,9% ,0% Present Value Adjustment - Off-Balance ,8% ,5% Cost of Units Sold to be Recognized - end of the period (88.847) ( ) -36,1% (88.847) ( ) -70,3% Result to be Recognized ,6% ,9% Margin to be Recognized (%) 49,4% 49,1% 0,2 p.p. 49,4% 50,8% -1,4 p.p. The downard trend for results to be recognized gets explained by the low volume of launches in the past years. Given that there are les projects under construction, the revenue for those that already exist get accounted for as constructions progress. The margin to be recognized has been a reliable indicator of the tendency for the Company s future gross margins. Page 16 of 30
17 Accounts Receivable Accounts Receivable represent sales of residential and commercial development projects. The outstanding balance of the contracts is updated in accordance with their respective contractual clauses; and the provision for doubtful credit is created based on risk analyses and on Management s judicious evaluation. Monetary restatement of accounts receivable is recorded on the income statement under revenue from property sales up to the delivery of keys, after which it is accounted for under financial income (interest). Trade Accounts Receivable (Amount expressed in thousand of Brazilian Reais R$) 1Q17 4Q16 Var.% Clients by Sales and Property Developments ,4% Short-Term ,4% Long-Term ,2% Accounts Receivable Off-Balance Sheet ,1% Short-Term ,3% Long-Term ,1% Total Trade Accounts Receivable ,2% By March 31, 2017, the Accounts Receivables, ex-revenues from services and provisions, has totaled R$1,027.5 million. At the end of the quarter, approximately 74% of the receivables portfolio regarded the clients in the stage prior to the repasse, when they may undergo credit analyses to get their outstanding balance with the Company transferred to a bank. Total Performed Receivables, which are qualified for securitization, came to R$500 million (considering only projects fully controlled by EZTEC). Accounting for projects with shared control also, the Company has R$311 million of receivables from clients who have effectively signed a statutory lien with EZTEC, which is adjusted by the IGP-DI index +10 to 12% p.a.. It is important to remark that receivables from statutory lien are not subject to unilateral cancellations. The table below shows the calculation of accounts receivable: Receivables (Amount expressed in thousand of Brazilian Reais R$) 1Q17 4Q16 Var.% Total Account Receivables of Developments (Concluded) ,0% Receivables for Property Development - Completed Construction (1) ,7% Receivables for Property Development - Construction in Progress (2) ,3% Total Accounts Receivable (Non-Concluded) (3) ,1% Advance from Costumers (4) (10.833) (12.254) -11,6% Total Accounts Receivable ,7% (1) The Company finances a maximum of 80% of the purchase price for its clients once the project is delivered. The accounts receivable of units delivered is subject to monetary restatement based on the variation in the IGP-M inflation index published by the Getúlio Vargas Foundation (FGV) plus annual interest of 12%, which is booked on the quarterly income statement under the item financial income. (2) Represented by receivables from sales based on the percentage of completion (PoC) of projects. The amounts related to monetary restatement are booked on the quarterly income statement under the item revenue from property sales up to the delivery of keys. (3) Represented by receivables from sales not recognized on the balance sheet due to the percentage of completion (PoC) criteria adopted for revenue recognition. The amounts related to monetary restatement are booked on the quarterly income statement under the item revenue from property sales up to the delivery of keys. (4) Receivables from clients originating from the sales of units under construction are based on the percentage of completion (PoC), with amounts received exceeding the revenue recognized based on the POC method under current liabilities as advances from clients. Page 17 of 30
18 Net Cash and Indebtedness The Company s Debt is composed exclusively of Homebuilding Financial System (SFH) financing lines. EZTEC reported a Net Cash position of R$241.3 million by the end of the first quarter of 2017, while Cash, Cash Equivalents and Financial Investments reached R$589.4 million and with a Cash Generation of R$30.9 million. EZTEC's debt is composed exclusively of financing lines for production, with rates ranging from 8.5% + TR p.a. to 9.2% + TR p.a.. Financial Debt (Amount expressed in thousand of Brazilian Reais R$) 1Q17 4Q16 Var.% Short-Term Debt ,5% Long-Term Debt ,1% Cash and Cash Equivalents (99.435) ( ) -4,3% Financial Investments ( ) ( ) 6,5% Net (Cash) Debt ( ) ( ) 14,7% Cash (Burn) Generation (8.480) -464,4% Dividendos Paid - 0 n.a. Cash (Burn) Generation Ex Dividends (8.480) -464,4% Page 18 of 30
19 OPERATIONAL INDICATORS Operations EZTEC adopts a fully integrated business model, divided into three business units: Development, which prospects and develops projects that meet the Company's returns criteria; Engineering and Construction, which assure quality during the execution of projects, timely delivery and the cost control; and Brokerage, whose team of brokers is responsible for maintaining the rapid pace of sales of the Company s developments. EZTEC also offers financing directly to its clients with terms of up to 240 months and interest of IGP-DI inflation index + 10 to 12% p.a. after delivery of keys. EZTEC firmly believes in its vertical model, which provides efficient negotiations with suppliers, flexibility in the creation of products and operational excellence in development and construction processes. The Company has an internal development team that creates new EZTEC products based on its clients needs, working jointly with other development departments to anticipate trends and make the most of the area available, while maintaining its social and environmental responsibility, in order to create value to the enterprise and contribute to higher prices. The internal development team is also cost-saving, since it reduces expenses with the acquisition of third-party services. EZTEC has over 120 employees in its engineering, budget, planning and supplying departments, as well as 1,770 workers, including employees and outsourced personnel at its construction sites, which ensures the execution and delivery of all projects with the required level of controls and quality, and within the established timetable. By focusing in the São Paulo Metropolitan Area, EZTEC is able to maintain long-term partnerships with its materials and services suppliers, which helps ensuring deadlines are met and reducing the effects from labor shortage and construction costs inflation. As of March 31, 2017, EZTEC had 14 sites under construction, 13 of which were constructed by EZTEC; the other 1 being outsourced to partners. Together, they represent 4,185 units under construction. The table below details the projects delivered throughout the 1Q17: Project Launched Launch (R$MN) % EZTEC Share EZTEC PSV (R$MN) # of Units % Units Sold Cidade Maia - Alameda Dec/ , % 127, % Cidade Maia - Praça Dec/ , % 210, % Total 337, , Page 19 of 30

 Excludes the City of São Paulo, i.e. the other 38 municipalities in the São Paulo Metropolitan Area (SPMA).")
20 Land Bank On March 31, 2017, EZTEC s Land Bank totaled R$5.5 billion in own PSV. The average cost of the land bank, including expenses related to increasing constructive potential (the floor space to lot area ratio), is equivalent to 13.6% of PSV. Managerial Data 1Q17 (1) Excludes the City of São Paulo, i.e. the other 38 municipalities in the São Paulo Metropolitan Area (SPMA). Page 20 of 30


![6 million in the 1Q17, it is important to highlight the following points: [i] sales in January are seasonally weak and, particularly in 2017, sales in February were harmed by the](/docs-images/79/79742195/images/21-3.jpg "extended carnival festivities; [ii] the composition of sales progressively tends towards being formed of ready units which are not subject to unilateral cancellations, having")
21 Launches The Company has not launched new products in the fourth quarter of Notwithstanding, in the month of April, as a subsequent event, it launched the first project of 2017, which, according to non-audited managerial figures, is 41% sold. The following table provides information on the real estate projects launched in 2015: Sales and Cancellations In the 1Q17 the Company maintained positive net sales. In analyzing the Net Sales of R$8.6 million in the 1Q17, it is important to highlight the following points: [i] sales in January are seasonally weak and, particularly in 2017, sales in February were harmed by the extended carnival festivities; [ii] the composition of sales progressively tends towards being formed of ready units which are not subject to unilateral cancellations, having represented 45% of sales in 1Q16, 75% in 4Q16, and reaching 79% in 1Q17; and [iii] sales stands started being mobilized to channel the new launches from the subsequent quarters, which not only generates sales of launches, but also tends to contribute towards stronger inventory sales as well. Page 21 of 30


22 Managerial Data - 1Q17 Gross Sales By Period of Launch % % % Cancellations By Period of Launch % R$ 114 MM Until % % % R$ 105 MM % % Until % Gross Sales By Standard Middle- High End 47% High-End 13% Cancellations By Standard Middle- High End 28% High-End 4% R$ 114 MM Commercial 3% R$ 105 MM Commercial 4% Middle- End 37% Middle- End 64% Guided by the transparency and continuity of information that had already been presented in the previous quarter, the graph below shows gross sales and 12-month accumulated cancellations for the previous 8 quarters: Q15 2Q15 3Q15 4Q15 1Q16 2Q16 3Q16 4Q16 1Q17 Gross Sales 12M (R$ MN) Gross Sales 12M (unit) Cancellations 12M (R$ MN) Cancellations 12M (unit) Page 22 of 30
23 In the 1Q17, the first two phases of the Cidade Maia project were delivered Praça and Alameda, collectively representing a PSV of R$388 million. Added to the following phases of the project, Cidade Maia represents by itself a PSV if R$948 million, being the last project remaining from the 2013 and 2014 launching cycle, which reached unprecedented volumes in the Company s history. The deliveries for the remaining phases of the Cidade Maia project will take place in the second semester of 2017, after which deliveries will reduce substantially Q14 1Q15 2Q15 3Q15 4Q15 1Q16 2Q16 3Q16 4Q16 1Q17 2Q17 3Q17 4Q17 1Q18 2Q18 3Q18 4Q18 1Q19 2Q19 3Q19 4Q19 1Q20 PSV EZTEC Deliveries Sold (R$MN) PSV EZTEC Deliveries in Inventory (R$MN) PSV EZTEC Cancellations (R$MN) Below is the VSO calculation (Sales Over Supply) weighted by EZTEC s participation, reflecting the liquidity of the products originated: SALES OVER SUPPLY 1Q17 1T16 1Q17 4Q16 + Beginning Inventory (m²) Launches in the Period (m²) = Inventory + Launches (m²) Contracted Sales in the Period (m²) = Final Inventory (m²) Gross Sales Over Supply (%) 10,4% 13,8% 10,4% 12,5% Net Sales Over Supply (%) 0,8% 1,9% 0,8% 3,1% Managerial Data 1Q17 Page 23 of 30
24 Units in Inventory P ro ject D ate Launched T o tal Units Launched % So ld (Units) Invento ry (Units) % EZ T EC Invento ry Units (R $ ) %EZ Invento ry P arking and Others (R $ ) %EZ Ready Units Bell'Acqua abr/ % 2 100% Supéria Paraíso ago/ % 0 100% Capital Corporate Office mai/ % 1 100% Massimo Residence mar/ % 0 50% 0 40 Quality House Jd. Prudência nov/ % 0 100% Supéria Moema mar/ % 0 100% Up Home abr/ % 0 100% 0 90 Prime House Sacomã mai/ % 0 100% 0 40 Sky jun/ % 0 90% Quinta do Horto mai/ % 0 100% Varanda Tremembé jun/ % 1 100% Royale Prestige out/ % 2 80% Art'E out/ % 2 50% NeoCorporate Offices jan/ % % Trend Paulista Offices fev/ % 6 50% Up Home Jd. Prudência fev/ % 0 100% 0 47 Royale Tresor mar/ % 4 80% Still Vila Mascote jun/ % 0 50% Chateau Monet jun/ % 3 100% Supéria Pinheiros jun/ % 1 100% Sophis Santana set/ % 4 100% Royale Merit nov/ % 19 80% Up Home Vila Carrão dez/ % 1 100% Vivart Tremembé dez/ % 1 100% Gran Village São Bernardo dez/ % 7 100% Vidabella 6 a 10 dez/ % 1 60% 99 0 Neo Offices fev/ % 2 100% Bosque Ventura mar/ % 59 70% Massimo Nova Saúde jun/ % 2 100% In Design jun/ % % The View Nova Atlântica jul/ % 1 100% Green Work jul/ % % Up Home Santana ago/ % 3 100% Chácara Cantareira set/ % % Prime House São Bernardo set/ % % Parque Ventura out/ % % Jardins do Brasil - Amazônia out/ % 92 28% Jardins do Brasil - Abrolhos out/ % % Brasiliano nov/ % 6 90% Premiatto Sacomã fev/ % % Splendor Vila Mariana mar/ % 1 100% Le Premier Paraíso mar/ % 5 100% EZ Mark mai/ % % Centro Empresarial Jardins do Brasil jun/ % % Jardins do Brasil - Mantiqueira jun/ % % Massimo Vila Mascote set/ % % Quality House Ana Costa set/ % % Cidade Maia - Alameda dez/ % % Cidade Maia - Praça dez/ % % Sub-Total Ready Units Under Construction Cidade Maia - Jardim dez/ % % Cidade Maia - Botânica mar/ % % Cidade Maia - Reserva mar/ % % Magnífico Mooca mai/ % 26 50% San Felipe - Giardino jun/ % % San Felipe - Palazzo jun/ % % Le Premier Flat Campos do Jordão jul/ % % Prime House Parque Bussocaba out/ % % Legítimo Santana dez/ % % Splendor Ipiranga fev/ % 8 100% Massimo Vila Carrão abr/ % % Jardins do Brasil - Atlântica jun/ % 30 28% Sub-Total Under Construction Launches Le Premier Moema mar/ % 18 50% Up Home Vila Mascote out/ % % Splendor Brooklin mai/ % % Sub-Total Launches Total Page 24 of 30
25 CAPITAL MARKETS Ownership Structure EZTEC stock is listed on the Novo Mercado special corporate governance segment of the BM&FBovespa under the EZTC3 ticker symbol; in March 31 st, 2017, its capital was composed of 165,001,783 common shares, 35.1% of which were free floating, an equivalent to 57,927,604 shares. Net Asset Value Since 2008, the Company has presented, on a quarterly basis, a calculation of its Net Asset Value, which serves to highlight, through a summary of its audited financial and managerial data, the Company's intrinsic book value that is still not fully reflected in its financial statements: Calculation of the Net Asset Value (Amount expressed in thousands of Brazilian Reais - R$) Note that the land pieces in the land bank are considered at book value, i.e., the effective amount paid for the acquisition, not considering the intrinsic price appreciation occurred in the period. Moreover, the calculation of Net Asset Value does not consider the PSV of R$5.5 billion that these land pieces could generate. 1Q17 4Q16 Controller (+) Cash (-) Debt ( ) ( ) (-) Dividends to be Paid (54.683) (54.676) (+) CEPAC - - (+) Unperformed Receivables (+) Performed Receivables (-) Construction Obligation ( ) ( ) (+) Land bank Inventory (1) (-) Land bank / Project Quotas Payable (2) (69.110) (69.110) Present Value Adjustment - On-Balance Present Value Adjustment - Off-Balance Inventory - Managerial Data (+) Units in Inventory (3) (+) EZ Tow ers (+) Sales to be Recognized - - Shared Control Adjusted Net Asset Value Total of Shares Adjusted Net Asset Value per Share 24,49 24,71 Net Asset per Share for new Total Shares 24,49 24,71 (1) Value of lots at acquisition cost. (2) Lands payable and accounts to pay for acquisition of project quotes. (3) Units in inventory based on current price list. Page 25 of 30


26 Return on Shareholders Equity On Return on Equity, regarding the creation of value, the Company presented positive results in the last years, being a benchmark to the market. It comes as a result of low indebtedness and the delivery of projects with high margins. In the past quarters, given the low level of launches and the cancellations incurred, the Company did not create new and relevant sources of revenue that could withstand the net results, rewarding the Company s capital at its historical level. Currently, the Company s net equity is composed of landbank, receivables, inventory, and net cash. With the purpose of maximizing the financial return to its shareholders, it approved in the General Assembly on the 04/28/2017, the extraordinary dividend distribution. Added to the legally-required dividend distribution, it represented a total of R$180,213,662.18, or R$1.09 per share. This distribution leads to a payout of 78.3%, the highest in EZTEC s history. Page 26 of 30
27 CONFERENCE CALL AND MEETINGS Information on the conference calls for the first quarter of 2017 results as follows: Conference Call Webcast (in English) Date: May 12 th, 2017 Time: 11:00 a.m. (U.S. EST) 12:00 p.m. (Brasilia time) Dial-in: +1 (412) Code: EZTEC Replay: +1 (412) Code: Webcast: Conference Call Webcast (in Portuguese) Date: May 12 th, 2017 Time: 09:30 a.m. (U.S. EST) 10:30 a.m. (Brasilia time) Dial-in: +55 (11) Code: EZTEC Replay: +55 (11) Code: EZTEC Webcast: The access links will be made available in the Investor Relations section of the Company s website ( Relationship with the independent auditors: In accordance with CVM Instruction 381/03, we inform that, in 1Q17, the independent auditors of the Company Deloitte Touche Tohmatsu Auditores Independentes. did not provide any services other than those related to the external audit. The Company s policy for contracting the services of independent auditors assures there are no conflicts of interests or loss of independence or objectivity. Data of financial and/or operational information such as, for example, the EBITDA, sales volume and launched PSV, and Income Statement for the 4Q14, were not audited by the independent auditors. Disclaimer: This release contains forward-looking statements relating to the prospects of the business, estimates for operating and financial results, and those related to growth prospects of EZTEC S.A. These are merely projections and as such are based exclusively on the expectations of EZTEC S.A.'s management concerning the future of the business and its continuous access to capital in order to finance its business plan. These forward-looking statements depend substantially on changes in market conditions, government regulations, competitive pressures, the economic performance of the industry and Brazil, among other factors, as well as the risks presented in the disclosure documents filed by EZTEC S.A., and therefore are subject to change without prior notice. Page 27 of 30
Preliminary Operational Results 4Q13
 Contact IR: Preliminary Operational Results 4Q13 A. Emílio C. Fugazza Chief Financial and Investor Relations Officer Pedro Henrique Rocha Nocetti Investor Relations Coordinator Erik Rodrigues Kragegaard
Preliminary Operational Results 2Q17
 Contact IR: Preliminary Operational Results 2Q17 A. Emílio C. Fugazza Chief Financial and Investor Relations Officer Augusto T. Yokoyama Investor Relations and Controllership Manager Hugo G. B. Soares
Corporate Presentation 1Q18
 Corporate Presentation 1Q18 Operational Record (Last Twelve Months) 2 1.57 Launches 1.136 1.157 1.166 1.253 1.371 1.89 494 46 887 81 742 642 52 395-37 -57-77 -68-55 -74-85 -12-13 -153-153 -173 96 915 727
3Q18. Quarterly Results
 Conference Call in English Nov 9 th, 2018 9h00 (US EST)) 12h00 (Brasilia time) Phone: +1 (412) 317-5450 Code: EZTEC Replay: +1 (412) 317-0088 Code: 10124422 Conference Call in Portuguese Nov 9 th, 2018
TRISUL S.A. ANNOUNCES 3Q14 AND 9M14 RESULTS
 TRISUL S.A. ANNOUNCES 3Q14 AND 9M14 RESULTS 3Q14 RESULTS CONFERENCE CALL November 12, 2014 Portuguese Date: November 12, 2014 Time: 11:0 a.m. (Brasília) 8:00 a.m. (US-EST) Phone: +55 (11) 2188-0155 Password:
Webcast 4Q16 March 2017
 Webcast 4Q16 March 2017 Management Presentation Participants Marcos Ernesto Zarzur CEO and Chief Commercial Officer Résumés Initiated activities in EZTEC in1986 Commercial Officer since 2007 Founder of
1Q15 Earnings Release
 1Q15 Earnings Release Barueri, April 28, 2015 - Smiles S.A. (BM&FBOVESPA: SMLE3), one of the largest loyalty programs in Brazil with over 10 million members, announces today its results for 1Q15. The financial
practices introduced by Law 11,638/07, and the pronouncements and guidelines of the CPC Accounting Pronouncements Committee. Low Income Segment
 Contracted sales reach a record R$ 842 million, 146% up vs. 1Q09 Launches total R$ 722 million Growth of 350% (vs. 1Q09) Gross income reaches R$ 118 million, with Gross margin of 26% São Paulo, May 13,
TRISUL S.A. ANNOUNCES 1Q14 RESULTS
 TRISUL S.A. ANNOUNCES 1Q14 RESULTS 1Q14 RESULTS CONFERENCE CALL May 14, 2014 Portuguese Date: May 15, 2014 Time: 11:00 a.m. (Brasília time) 10:00 a.m. (US-EST) Phone: +55 (11) 2188-0155 Password: Trisul
3Q16 EARNINGS RELEASE. Viver Announces its Results for the Third Quarter of Highlights
 3Q16 EARNINGS RELEASE Conference Call Wednesday, Nov 16, 2016 Portuguese (With simultaneous translation into English) 10:00 a.m. (Brasilia) 09:00 a.m. (New York) Phone: +55 (11) 3728-5971 +55 (11) 3127-4971
CR2 ANNOUNCES ITS RESULTS FOR 4Q17
 CR2 ANNOUNCES ITS RESULTS FOR Rio de Janeiro, March 23 th, 2018 CR2 Empreendimentos Imobiliários S.A. (Bovespa: CRDE3; OTC: CREIY) announces its results for the fourth quarter of 2017 (). The company s
Financial statements EZ TEC Empreendimentos e Participações S.A. and Subsidiaries
 Financial statements EZ TEC Empreendimentos e Participações S.A. and Subsidiaries December 31, 2013 with Independent Auditor s Report EZ Tec Empreendimentos e Participações S.A. and Subsidiaries Financial
PSV totals R$627 million Contracted sales grow by 110% (R$351 million)
") PSV totals R$627 million Contracted sales grow by 110% (R$351 million) São Paulo, November 13, 2007 Rossi Residencial S.A. (Bovespa: RSID3), one of the main residential real estate developers in Brazil,
PSV totals R$627 million Contracted sales grow by 110% (R$351 million) São Paulo, November 13, 2007 Rossi Residencial S.A. (Bovespa: RSID3), one of the main residential real estate developers in Brazil,
Cyrela Brazil Realty S.A. Empreendimentos e Participações
 (Convenience Translation into English from the Original Previously Issued in Portuguese) Cyrela Brazil Realty S.A. Empreendimentos e Participações Individual and Consolidated Financial Statements for the
2Q18. Quarterly Results
 Conference Call in English May 11 th, 2018 9h30 (US EST)) 10h30 (Brasilia time) Phone: +55 (11) 2188-0155 Code: EZTEC Replay: +55 (11) 2188-0400 Code: EZTEC Conference Call in Portuguese May 11 th, 2018
Interim Financial Statements (ITR) MRV Engenharia e Participações S.A.
 MRV Engenharia e Participações S.A.") Interim Financial Statements (ITR) MRV Engenharia e Participações S.A. Interim Individual and Consolidated Financial Statements for the Quarter ended March 31, 2018 and Report on Review of Interim Financial
Interim Financial Statements (ITR) MRV Engenharia e Participações S.A. Interim Individual and Consolidated Financial Statements for the Quarter ended March 31, 2018 and Report on Review of Interim Financial
4Q16 Earnings Release
 4Q16 Earnings Release Barueri, February 15, 2017 Smiles S.A. (BM&FBOVESPA: SMLE3) one of the largest loyalty programs in Brazil with over 12 million members, announces today its 4Q16 results. The financial
Helbor Empreendimentos S.A. Quarterly information (ITR) at September 30, 2016 and report on review of quarterly information
 at September 30, 2016 and report on review of quarterly information") Helbor Empreendimentos S.A. Quarterly information (ITR) at September 30, 2016 and report on review of quarterly information Registration Form - 2016 - HELBOR EMPREENDIMENTOS S.A. Version: 1 Contents Information
Helbor Empreendimentos S.A. Quarterly information (ITR) at September 30, 2016 and report on review of quarterly information Registration Form - 2016 - HELBOR EMPREENDIMENTOS S.A. Version: 1 Contents Information
Conference Call Transcript EZTec (EZTC3 BZ) August 11th, 2017
 August 11th, 2017") Conference Call Transcript EZTec (EZTC3 BZ) August 11th, 2017 Operator: Good afternoon, ladies and gentlemen. At this time, we would like to welcome everyone to EZTEC s 2Q17 results conference call. Note
Conference Call Transcript EZTec (EZTC3 BZ) August 11th, 2017 Operator: Good afternoon, ladies and gentlemen. At this time, we would like to welcome everyone to EZTEC s 2Q17 results conference call. Note
Even discloses 4Q16 results
 Even discloses 4Q16 results São Paulo, March 22, 2017 Even Construtora e Incorporadora S.A. EVEN (BM&FBOVESPA: EVEN3), with operations in São Paulo, Rio de Janeiro, Rio Grande do Sul and Minas Gerais and
Helbor Empreendimentos S.A. Financial statements at December 31, 2016, and independent auditor's report
 Financial statements at December 31, 2016, and independent auditor's report Registration Form - 2016 Contents Information General information 2 Address 3 Securities 4 Auditor 5 Share registrar 6 Investor
Helbor Empreendimentos S.A. Quarterly information (ITR) at March 31, 2012 and report on review of quarterly information
 at March 31, 2012 and report on review of quarterly information") Helbor Empreendimentos S.A. Quarterly information (ITR) at March 31, 2012 and report on review of quarterly information Report on review of quarterly information To the Board of Directors and Stockholders
Helbor Empreendimentos S.A. Quarterly information (ITR) at March 31, 2012 and report on review of quarterly information Report on review of quarterly information To the Board of Directors and Stockholders
1Q14 Earnings Release
 1Q14 Earnings Release Barueri, May 6, 2014 Smiles S.A. (BM&FBOVESPA: SMLE3), one of the largest coalition programs in Brazil, with over 9.9 million members, announces today its results for 1Q14. The financial
Consolidated Net Revenue growth by 22.8% vs 3Q12, to R$207.4mn. Europe : R$ 78.6mn (+56.6% vs. 3Q12) Americas: R$128.8mn (+8.5% vs.
 Americas: R$128.8mn (+8.5% vs.") São Paulo, Brazil, November 04 th, 2013 - Metalfrio Solutions S.A. (FRIO3) ( Metalfrio ), is pleased to announce results for the third quarter of 2013 ( 3Q13 ). Financial and operational information given
São Paulo, Brazil, November 04 th, 2013 - Metalfrio Solutions S.A. (FRIO3) ( Metalfrio ), is pleased to announce results for the third quarter of 2013 ( 3Q13 ). Financial and operational information given
1Q16 Results. Investor Relations Contact: Felipe Enck Gonçalves CFO and Investor Relations Director
 1Q16 Results Investor Relations Contact: Felipe Enck Gonçalves CFO and Investor Relations Director +55 (31) 3615-8400 ri@logcp.com.br www.logcp.com.br/relacoes-com-investidores A LOG COMMERCIAL PROPERTIES
1Q15 Results. Investor Relations Contacts: Felipe Enck Gonçalves CFO and Investor Relations. +55 (31)
") 1Q15 Results Investor Relations Contacts: Felipe Enck Gonçalves CFO and Investor Relations +55 (31) 3615-8400 ri@logcp.com.br www.logcp.com.br/ri LOG COMMERCIAL PROPERTIES ANNOUNCES THE 1Q15 RESULTS Belo
1Q15 Results Investor Relations Contacts: Felipe Enck Gonçalves CFO and Investor Relations +55 (31) 3615-8400 ri@logcp.com.br www.logcp.com.br/ri LOG COMMERCIAL PROPERTIES ANNOUNCES THE 1Q15 RESULTS Belo
Earnings Release - 2Q14
 Earnings Release - 2Q14 Barueri, July 31, 2014 Smiles S.A. (BM&FBOVESPA: SMLE3), one of the largest loyalty programs in Brazil with over 10 million members, announces today its results for 1Q14. The financial
Helbor Empreendimentos S.A. Quarterly information (ITR) as at March 31, 2013 and report on review of quarterly information
 as at March 31, 2013 and report on review of quarterly information") Helbor Empreendimentos S.A. Quarterly information (ITR) as at March 31, 2013 and report on review of quarterly information Report on review of quarterly information To the Board of Directors and Stockholders
Helbor Empreendimentos S.A. Quarterly information (ITR) as at March 31, 2013 and report on review of quarterly information Report on review of quarterly information To the Board of Directors and Stockholders
4Q15 and 2015 Results
 4Q15 and 2015 Results Investor Relations Contacts: Felipe Enck Gonçalves CFO and Investor Relations +55 (31) 3615-8400 ri@logcp.com.br www.logcp.com.br/relacoes-com-investidores 1 A LOG COMMERCIAL PROPERTIES
DIRECIONAL ANNOUNCES RESULTS OF 3Q18 WITH CASH GENERATION OF BRL 287 MILLION AND 54% INCREASE IN NET REVENUE COMPARED TO 3Q17.
 RELEASE OF RESULTS Belo Horizonte, November 08, 2018 - The Direcional Engenharia S.A., one of the largest real estate development and construction companies in Brazil, with focus on the development of
Even Construtora e Incorporadora S.A. Quarterly Information (ITR) at March 31, 2011 and Report on Review of Quarterly Information
 at March 31, 2011 and Report on Review of Quarterly Information") Even Construtora e Incorporadora S.A. Quarterly Information (ITR) at March 31, 2011 and Report on Review of Quarterly Information Report on Review of Quarterly Information To the Board of Directors and
Even Construtora e Incorporadora S.A. Quarterly Information (ITR) at March 31, 2011 and Report on Review of Quarterly Information Report on Review of Quarterly Information To the Board of Directors and
3Q18 Earnings Release
 3Q18 Earnings Release Barueri, October 30, 2018 Smiles Fidelidade S.A. (B3: SMLS3) one of the largest loyalty programs in Brazil with over 14 million members, announces today its 3Q18 results. The financial
INTER CONSTRUTORA E INCORPORADORA S.A QUARTERLY INFORMATION - ITR - EM 30 JUNE 2018 AND THE REVIEW REPORT OF OF THE INDEPENDENT AUDITORS
 INTER CONSTRUTORA E INCORPORADORA S.A QUARTERLY INFORMATION - ITR - EM 30 JUNE 2018 AND THE REVIEW REPORT OF OF THE INDEPENDENT AUDITORS INTER CONSTRUTORA E INCORPORADORA S/A Quarterly Information - ITR
EARNINGS RELEASE 1Q18 RESULTADOS
 EARNINGS RELEASE 1Q18 CONFERENCE CALL IN ENGLISH May 11 th, 2018 - Friday 10:00 a.m. (US ET) 11:00 a.m. (BRT) / 3:00 p.m. (London) Connecting Number: +1 (412) 317 6776 Code: Valid Webcast: click here Valid
2Q15 Earnings Release
 2Q15 Earnings Release Barueri, August 4, 2015 - Smiles S.A. (BM&FBOVESPA: SMLE3), one of the largest loyalty programs in Brazil with over 10 million members, announces today its results for 2Q15. The financial
EZ TEC Empreendimentos e Participações S.A. and Subsidiaries
 (Convenience Translation into English from the Original Previously Issued in Portuguese) EZ TEC Empreendimentos e Participações S.A. and Subsidiaries Individual and Financial Statements for the Year Ended
São Carlos Empreendimentos e Participações S.A. and Subsidiaries
 (Convenience Translation into English from the Original Previously Issued in Portuguese) São Carlos Empreendimentos e Participações S.A. and Subsidiaries Individual and Consolidated Financial Statements
Cyrela Brazil Realty S.A. Empreendimentos e Participações
 Cyrela Brazil Realty S.A. Empreendimentos e Participações Quarterly Information - ITR ended September 30, 2017 (A free translation of the original report in Portuguese as published in Brazil containing
GAFISA RELEASES 3Q16 RESULTS
 Conference Call November 9, 2016 8:00 am US EST In English (simultaneous translation from Portuguese) + 1-516-3001066 US EST Code: Gafisa 11h00 am Brasilia Time In Portuguese Telephone: +55-11-3728-5971
3Q17 EARNINGS RELEASE. Performance Comments on the Quartely Financial Information ITR ended on Third Quarter of Highlights
 3Q17 EARNINGS RELEASE Performance Comments on the Quartely Financial Information ITR ended on Third Quarter of 2017 São Paulo, November 13, 2017 Viver Incorporadora e Construtora S.A. (VIVR3) announces
Highlights (4Q15 and full year 2015 vs 2014) President & CEO Petros Diamantides said:
 President & CEO Petros Diamantides said:") São Paulo, Brazil, March, 1st 2016 - Metalfrio Solutions S.A. (FRIO3) ( Metalfrio ), one of the world s largest manufacturers of plug in commercial refrigeration equipment, announces its results for the
São Paulo, Brazil, March, 1st 2016 - Metalfrio Solutions S.A. (FRIO3) ( Metalfrio ), one of the world s largest manufacturers of plug in commercial refrigeration equipment, announces its results for the
Highlights: In this quarter the number of units transferred was 31% higher than 3Q17. In the Q-o-Q comparison the PSV increased 13%.
 3Q18 and 9M18 Earnings Results São Paulo, November 14 th, 2018: PDG Realty S.A. (PDGR3) Under Court-supervised Reorganization - announces today its results for the third quarter of 2018. Founded in 2003,
2009 Earnings Release
 NETC4: R$ 21.85 /share (BM&FBOVESPA) NETC: US$ 11.92 /ADR (NASDAQ) XNET: EUR 8.71 /share (Latibex) Total Shares: 342,963,601 Market Capitalization: R$ 7.5 billion Closing Price: 02/09/2010 São Paulo, Net
Quarterly information - ITR Quarter ended June 30, 2016
 PDG Realty S.A. Empreendimentos e Participações (A free translation of the original financial statements in Portuguese prepared in accordance with the accounting practices adopted in Brazil) KPDS 160363
2Q17 Net Revenues reached R$304.2 million, 4.7% below prior year, with revenues in Europe at historical high levels
 São Paulo, Brazil, August, 8 th 2017 - Metalfrio Solutions S.A. (FRIO3) ( Metalfrio ), one of the world s largest manufacturers of plug in commercial refrigeration equipment, announces its results for
4Q16 Results. CONFERENCE CALL ON RESULTS February 10, :00 p.m. (Brazil) / a.m. (US-EST)
 / a.m. (US-EST)") CONFERENCE CALL ON RESULTS February 10, 2017 1:00 p.m. (Brazil) / 10.00 a.m. (US-EST) 4Q16 Results Access in Portuguese: +55 11 3127-4971 +55 11 3728-5971 Access in English: +1 516-300-1066 Password: Lojas
CONFERENCE CALL ON RESULTS February 10, 2017 1:00 p.m. (Brazil) / 10.00 a.m. (US-EST) 4Q16 Results Access in Portuguese: +55 11 3127-4971 +55 11 3728-5971 Access in English: +1 516-300-1066 Password: Lojas
1Q09 EARNINGS RELEASE
 1Q09 EARNINGS RELEASE EBITDA and Net Income growth of 151% and 250% on 1Q08, respectively Sales-Over-Supply Ratio of 13% in 1Q09 and 20% YTD São Paulo, May 14, 2009 - Klabin Segall S.A. (BOVESPA: KSSA3),
Cyrela Brazil Realty S.A. Empreendimentos e Participações
 Cyrela Brazil Realty S.A. Empreendimentos e Participações Quarterly Information - ITR ended March 31, 2018 (A free translation of the original report in Portuguese as published in Brazil containing Financial
SABESP announces 2Q16 results
 - CIA. DE SANEAMENTO BÁSICO DO ESTADO DE SÃO PAULO - SABESP Rui de Britto Álvares Affonso Chief Financial Officer and Investor Relations Officer Mario Azevedo de Arruda Sampaio Head of Capital Markets
Even Construtora e Incorporadora S.A. and Subsidiaries
 (Convenience Translation into English from the Original Previously Issued in Portuguese) Even Construtora e Incorporadora S.A. and Subsidiaries Individual and Interim Financial Information for the Quarter
1Q17 GAFISA REPORTS RESULTS FOR
 FOR IMMEDIATE RELEASE - São Paulo, May 09, 2017 Gafisa S.A. (Bovespa: GFSA3; NYSE: GFA), one of Brazil s leading homebuilders, today reported financial results for the quarter ended March 31, 2017. GAFISA
PDG Realty S.A. Empreendimento s e Participações
 PDG Realty S.A. Empreendimento s e Participações - ITR Quarter ended (A free translation of the original financial statements in Portuguese prepared in accordance with the accounting practices adopted
Reduction of 445 p.p. in net debt to equity (% Rossi) 4Q17 vs. 3Q17
 4Q17 vs. 3Q17") Conference Call São Paulo, March 26, 2018. Rossi Residencial S.A. (BM&FBovespa: RSID3; Bloomberg: RSID3 BZ Equity), announces its results for the fourth quarter and the year of 2017. RSID3: R$ 6.40 per
Conference Call São Paulo, March 26, 2018. Rossi Residencial S.A. (BM&FBovespa: RSID3; Bloomberg: RSID3 BZ Equity), announces its results for the fourth quarter and the year of 2017. RSID3: R$ 6.40 per
3Q18 EARNINGS. Food Business Multivarejo Assaí. (R$ million) (1) 3Q18 3Q17 Δ 3Q18 3Q17 Δ 3Q18 3Q17 Δ 3Q18 3Q17 Δ
 (1) 3Q18 3Q17 Δ 3Q18 3Q17 Δ 3Q18 3Q17 Δ 3Q18 3Q17 Δ") São Paulo, October 25, 2018 - GPA [B3: PCAR4; NYSE: CBD] announces its results for the third quarter of 2018. Due to the ongoing divestment of the interest held by GPA in Via Varejo S.A., as announced
São Paulo, October 25, 2018 - GPA [B3: PCAR4; NYSE: CBD] announces its results for the third quarter of 2018. Due to the ongoing divestment of the interest held by GPA in Via Varejo S.A., as announced
3Q13 Earnings Release
 3Q13 Earnings Release São Paulo, October 31, 2013 Smiles S.A. (BM&FBOVESPA: SMLE3), one of the largest coalition programs in Brazil, with more than 9.5 million members, announces today its results for
Interim Financial Information (ITR) MRV Engenharia e Participações S.A.
 MRV Engenharia e Participações S.A.") Interim Financial Information (ITR) MRV Engenharia e Participações S.A. Individual and Consolidated Interim Financial Information for the quarter Ended June 30, 2015 and Report on Review of Interim Financial
Interim Financial Information (ITR) MRV Engenharia e Participações S.A. Individual and Consolidated Interim Financial Information for the quarter Ended June 30, 2015 and Report on Review of Interim Financial
Highlights of the third quarter of 2017
 Consolidated Highlights Free cash flow of R$ 500 million in 3Q17, double the amount generated in 2Q17. Selling, general and administrative expenses decrease 18% in 3Q17 compared to 3Q16, corresponding
Highlights of the second quarter of 2017
 Highlights of the second quarter of Consolidated Highlights EBITDA of R$ 1.1 billion in 2Q17, with EBITDA margin expansion in relation to 2Q16 and 1Q17. Selling, general and administrative expenses declined
2Q18 Earnings Release
 2Q18 Earnings Release Barueri, July 31, 2018 Smiles Fidelidade S.A. (B3: SMLS3) one of the largest loyalty programs in Brazil with over 14 million members, announces today its 2Q18 results. The financial
CETIP S.A. Mercados Organizados
 (A free translation of the original in Portuguese) CETIP S.A. Mercados Organizados Condensed interim financial statements as at Condensed interim financial statements as at Contents Comments on performance
2Q16 EARNINGS RELEASE
 2Q16 EARNINGS RELEASE INVESTOR RELATIONS Carlos Alberto Correa CFO and Investor Relations Officer Murilo Hyai Investor Relations Manager Eduardo Oliveira Investor Relations Specialist Website: ir.sonaesierra.com.br
Earnings Release 4Q15 and 2015
 FOR IMMEDIATE RELEASE - São Paulo, March 3, 2016 Gafisa S.A. (Bovespa: GFSA3; NYSE: GFA), one of Brazil s leading homebuilders, today reported financial results for the fourth quarter and year ended December
Results for the 4 th quarter 2016 February 23, 2017
 Results for the 4 th quarter 2016 February 23, 2017 20.1 billion points issued in the fourth quarter 17.9 billion points redeemed, 17.4% of these points redeemed for retail products Burn/earn rate of 89%
ITR Quarterly Information Form- 6/30/ RESTOQUE COM E CONFECÇÕES DE ROUPAS SA Version: 1. Statement of Capital 1.
 ITR Quarterly Information Form- 6/30/2013 - RESTOQUE COM E CONFECÇÕES DE ROUPAS SA Table of Contents Company Information Statement of Capital 1 Dividends Paid 2 Parent Company Financial Statements Statement
Number of Shares (million) Earnings per share (R$)
 Earnings per share (R$)") Abril Educação ends 1Q12 with 22% net revenue growth, totaling R$248.8 million. Consolidated EBITDA reached R$110.1 million, 13% up year-over-year, and net income increased by 26%. São Paulo, May 11, 2012
Abril Educação ends 1Q12 with 22% net revenue growth, totaling R$248.8 million. Consolidated EBITDA reached R$110.1 million, 13% up year-over-year, and net income increased by 26%. São Paulo, May 11, 2012
3Q17 Results. CONFERENCE CALL ON RESULTS October 25, :00 p.m. (Brazil) / 11:00 a.m. (US-EST)
 / 11:00 a.m. (US-EST)") 3Q17 Results CONFERENCE CALL ON RESULTS October 25, 2017 1:00 p.m. (Brazil) / 11:00 a.m. (US-EST) Access in Portuguese: +55 11 3127-4971 +55 11 3728-5971 Access in English: +1 516-300-1066 Password: Lojas
3Q17 Results CONFERENCE CALL ON RESULTS October 25, 2017 1:00 p.m. (Brazil) / 11:00 a.m. (US-EST) Access in Portuguese: +55 11 3127-4971 +55 11 3728-5971 Access in English: +1 516-300-1066 Password: Lojas
Financial Statements Rede D Or São Luiz S.A. December 31, 2013, 2012 and 2011 with Independent Auditor s Report on Financial Statements
 Financial Statements Rede D Or São Luiz S.A. with Independent Auditor s Report on Financial Statements Financial statements Contents Independent auditor s report on financial statements... 1 Audited financial
Commenting on the results, President & CEO Petros Diamantides said:
 São Paulo, Brazil, May, 24 th 2018 - Metalfrio Solutions S.A. (FRIO3) ( Metalfrio ), one of the world s largest manufacturers of plug in commercial refrigeration equipment, announces its results for the
Aug 11th, Q16 and 1H16 Results
 Aug 11th, 2016 2Q16 and 1H16 Results Executive Summary Agenda Asset Management: Sales Cancellations Accounts Receivable Inventory Liabilities Management: Net Debt Variation Deleveraging Corcovado Rio de
Commenting on the results, President & CEO Petros Diamantides said:
 São Paulo, Brazil, March, 5 th 2018 - Metalfrio Solutions S.A. (FRIO3) ( Metalfrio ), one of the world s largest manufacturers of plug in commercial refrigeration equipment, announces its results for the
3Q17 and 9M17 Earnings Results
 3Q17 and 9M17 Earnings Results São Paulo, November 3 th, 2017: PDG Realty S.A. (PDGR3) Under Court-supervised Reorganization - announces today its results for the third quarter and nine months of 2017.
1Q17 EARNINGS RELEASE
 1Q17 EARNINGS RELEASE INVESTOR RELATIONS Carlos Alberto Correa CFO and Investor Relations Officer Murilo Hyai Senior Investor Relations Manager Eduardo Oliveira Investor Relations Specialist Website: ir.sonaesierra.com.br
4Q17 Results. CONFERENCE CALL ON RESULTS February 09, :00 p.m. (Brazil) / 10:00 a.m. (US-EST)
 / 10:00 a.m. (US-EST)") 4Q17 Results CONFERENCE CALL ON RESULTS February 09, 2018 1:00 p.m. (Brazil) / 10:00 a.m. (US-EST) Access in Portuguese: +55 11 3127-4971 +55 11 3728-5971 Access in English: +1 516-300-1066 Password: Lojas
4Q17 Results CONFERENCE CALL ON RESULTS February 09, 2018 1:00 p.m. (Brazil) / 10:00 a.m. (US-EST) Access in Portuguese: +55 11 3127-4971 +55 11 3728-5971 Access in English: +1 516-300-1066 Password: Lojas
3Q17 RESULTS GAFISA ANNOUNCES
 FOR IMMEDIATE RELEASE - Gafisa S.A. (B3: GFSA3; NYSE: GFA), one of Brazil s leading homebuilders, today reports its financial results for the third quarter ended September 30, 2017 GAFISA ANNOUNCES 3Q17
3Q18 EARNINGS RELEASE. Viver Announces its Results for the Third Quarter of Highlights
 3Q18 EARNINGS RELEASE Conference Call Wednesday, November 14 th, 2018 Portuguese (with simultaneous interpreting into English) 11:00 a.m. (Brasilia) 08:00 a.m. (New York) Phone: +55 (11) 3728-5971 +55
Net revenue: R$ 140.7mn in 3Q09 Ebitda: R$ 15.2mn in 3Q09 (EBITDA margin 10.8%) Net profit: R$ 14.0mn in 3Q09 Operating cash flow: R$ 55.
 Net profit: R$ 14.0mn in 3Q09 Operating cash flow: R$ 55.") Net revenue: R$ 140.7mn in 3Q09 Ebitda: R$ 15.2mn in 3Q09 (EBITDA margin 10.8%) Net profit: R$ 14.0mn in 3Q09 Operating cash flow: R$ 55.8mn in 3Q09 São Paulo, Brazil, Nov. 5, 2009 This release gives third
Net revenue: R$ 140.7mn in 3Q09 Ebitda: R$ 15.2mn in 3Q09 (EBITDA margin 10.8%) Net profit: R$ 14.0mn in 3Q09 Operating cash flow: R$ 55.8mn in 3Q09 São Paulo, Brazil, Nov. 5, 2009 This release gives third
EBITDA of R$ 76.0 million (+18.4%), with a 25.4% margin (+3.8 p.p.). Higher full-price sales volume, with 46.5% reduction of remarked-price sales.
, with a 25.4% margin (+3.8 p.p.). Higher full-price sales volume, with 46.5% reduction of remarked-price sales.") São Paulo, Brazil, May 7, 2018 - Restoque Comércio e Confecções de Roupas S.A. ( Company ) (LLIS3), leading company in the premium clothing and apparel retail industry in Brazil, presents its results for
São Paulo, Brazil, May 7, 2018 - Restoque Comércio e Confecções de Roupas S.A. ( Company ) (LLIS3), leading company in the premium clothing and apparel retail industry in Brazil, presents its results for
Cyrela Commercial Properties S.A. Empreendimentos e Participações
 Cyrela Commercial Properties S.A. Empreendimentos e Participações (A free translation of the original reporting Portuguese as published in Brazil containing Financial Statement prepared in accordance with
REGISTRATION WITH CVM SHOULD NOT BE CONSTRUED AS AN EVALUATION OF THE COMPANY. COMPANY MANAGEMENT IS RESPONSIBLE FOR THE INFORMATION PROVIDED.
 REGISTRATION WITH CVM SHOULD NOT BE CONSTRUED AS AN EVALUATION OF THE COMPANY. COMPANY MANAGEMENT IS RESPONSIBLE FOR THE INFORMATION PROVIDED. 01.01 - IDENTIFICATION 1 - CVM CODE 2 - COMPANY NAME 3 - CNPJ
4Q17 AND 2017 EARNINGS RELEASE. Viver Announces its Results for the Fourth Quarter and Full-Year of Highlights
 4Q17 AND 2017 EARNINGS RELEASE Conference Call Thursday, March 29 th, 2017 Portuguese (with simultaneous interpreting into English) 10:00 a.m. (Brasilia) 09:00 a.m. (New York) Phone: +55 (11) 3728-5971
Gafisa S.A. (Translation of Registrant's name into English)
") SECURITIES AND EXCHANGE COMMISSION Washington, D.C. 20549 FORM 6-K REPORT OF FOREIGN ISSUER PURSUANT TO RULE 13a-16 OR 15d-16 OF THE SECURITIES EXCHANGE ACT OF 1934 For the month of August, 2018 (Commission
SECURITIES AND EXCHANGE COMMISSION Washington, D.C. 20549 FORM 6-K REPORT OF FOREIGN ISSUER PURSUANT TO RULE 13a-16 OR 15d-16 OF THE SECURITIES EXCHANGE ACT OF 1934 For the month of August, 2018 (Commission
FORM 6-K. SECURITIES AND EXCHANGE COMMISSION Washington, D.C Report of Foreign Private Issuer
 6-K 1 cbditr1q14_6k.htm ITR 1Q14 FORM 6-K SECURITIES AND EXCHANGE COMMISSION Washington, D.C. 20549 Report of Foreign Private Issuer Pursuant to Rule 13a-16 or 15d-16 of the Securities Exchange Act of
Consolidated Income Statement - (R$ MM) 1Q16 1Q15. Balance Sheet 1Q Equity 2, , % Net Debt¹ % O ther 1Q
 1Q16 1Q15. Balance Sheet 1Q Equity 2, , % Net Debt¹ % O ther 1Q") Qualicorp S.A. BOVESPA:QUAL3 Last Price May 11 th, 2016 R$ 15.00/share São Paulo, May 11, 2016. QUALICORP S.A (BM&FBOVESPA: QUAL3), one of the leading full-service healthcare benefits administrator and
Qualicorp S.A. BOVESPA:QUAL3 Last Price May 11 th, 2016 R$ 15.00/share São Paulo, May 11, 2016. QUALICORP S.A (BM&FBOVESPA: QUAL3), one of the leading full-service healthcare benefits administrator and
COMPANHIA DE SANEAMENTO BASICO DO ESTADO DE SAO PAULO-SABESP
 COMPANHIA DE SANEAMENTO BASICO DO ESTADO DE SAO PAULO-SABESP FORM 6-K (Report of Foreign Issuer) Filed 12/15/11 for the Period Ending 06/30/11 Telephone 011-55-11-3388-8000 CIK 0001170858 Symbol SBS SIC
Comgás gas sales revenue moves up 24.2% and EBITDA totals R$ 1,035.0 million in 2008
 Comgás gas sales revenue moves up 24.2% and EBITDA totals R$ 1,035.0 million in 2008 Annual Net Income increases by 16% to R$ 514.0 million in 2008 São Paulo, March 18, 2009. Companhia de Gás de São Paulo
Highlights in the second quarter of 2014
 Mission To create value for our customers, shareholders, employees and communities by operating as a sustainable steel business. Vision To be a global organization and a benchmark in any business we conduct.
Brasil Brokers announces its 4Q08 results
 Brasil Brokers announces its 4Q08 results Rio de Janeiro, March 16, 2009. Brasil Brokers Participações S.A. (Bovespa: BBRK3), a real estate brokerage and consulting firm with a strong presence in Brazil
2Q17 RESULTS. Conference Call: Aug/11th :00 (BZ) / 13:00 (ET) Dial-in: Portuguese: +55 (11) English: +1 (646)
 / 13:00 (ET) Dial-in: Portuguese: +55 (11) English: +1 (646)") 2Q17 RESULTS Conference Call: Aug/11th - 2017 14:00 (BZ) / 13:00 (ET) Dial-in: Portuguese: +55 (11) 2188-0155 English: +1 (646) 843 6054 Access Code: Marisa Webcast: www.marisa.com.br/ri Investor relations
2Q17 RESULTS Conference Call: Aug/11th - 2017 14:00 (BZ) / 13:00 (ET) Dial-in: Portuguese: +55 (11) 2188-0155 English: +1 (646) 843 6054 Access Code: Marisa Webcast: www.marisa.com.br/ri Investor relations
EARNINGS RELEASE INVESTOR RELATIONS CONFERENCE CALLS. Carlos Alberto Correa CFO and Investor Relations Officer. English
 EARNINGS RELEASE 2Q15 INVESTOR RELATIONS Carlos Alberto Correa CFO and Investor Relations Officer Murilo Hyai Investor Relations Manager Eduardo Oliveira Investor Relations Analyst Website: ir.sonaesierra.com.br
Cyrela Posts Gross Margin of 34.8% in 1Q16.
 Earnings Release Cyrela Posts Gross Margin of 34.8% in. São Paulo, May 10, 2016 - Cyrela Brazil Realty S.A. Empreendimentos e Participações ("CBR or Company or Cyrela ) (BM&FBOVESPA: CYRE3; OTCQX: CYRBY),
Consolidated Information
 Dear Shareholders: In, Gerdau prioritized positive free cash generation, which amounted to R$2.3 billion. This was achieved, in spite of the challenging scenario in the world steel industry, by reducing
BANCO CRUZEIRO DO SUL REPORTS 1Q10 RESULTS HIGHLIGHTS IN 1Q10
 1Q10 Conference Calls May 18, 2010 Portuguese 11:00 a.m. (Brasília) 10:00 a.m. (New York) Dial-in: (+55 11) 2188-0155 Replay: (+55 11) 2188-0155 Code: Banco Cruzeiro do Sul BANCO CRUZEIRO DO SUL REPORTS
Consolidated Income Statement - (R$ MM) Balance Sheet 1Q Equity 2, , % Net Debt¹ % O ther 1Q
 Balance Sheet 1Q Equity 2, , % Net Debt¹ % O ther 1Q") Qualicorp S.A. BOVESPA: QUAL3 Shares Outstanding (3/30/2018) 283,176,825 shares São Paulo, May 10th 2018. QUALICORP S.A (B3: QUAL3), one of the leading full-service healthcare benefits trader, administrator
Qualicorp S.A. BOVESPA: QUAL3 Shares Outstanding (3/30/2018) 283,176,825 shares São Paulo, May 10th 2018. QUALICORP S.A (B3: QUAL3), one of the leading full-service healthcare benefits trader, administrator
Cyrela Reports Cash Generation of R$184 Million in 1Q18.
 Cyrela Reports Cash Generation of R$184 Million in. São Paulo, May 10, 2018 - Cyrela Brazil Realty S.A. Empreendimentos e Participações ( CBR or Company or Cyrela ) (BM&FBOVESPA: CYRE3; OTCQPink: CYRBY),
CETIP S.A. Balcão Organizado de Ativos e Derivativos Quarterly information at March 31, 2011
 (A free translation of the original in Portuguese) CETIP S.A. Balcão Quarterly information at March 31, 2011 Quarterly information at March 31, 2011 Contents Comments on performance 3-10 Independent auditors
NET INCOME REACHES R$1.0 BILLION AND CIELO BRASIL FINANCIAL VOLUME EX AGRO GROWS 4.3% IN 1Q17
 NET INCOME REACHES R$1.0 BILLION AND CIELO BRASIL FINANCIAL VOLUME EX AGRO GROWS 4.3% IN 1Q17 Barueri, May 2, 2017 Cielo S.A. (BM&FBOVESPA: CIEL3 / OTCQX: CIOXY) announces today its results for the first
Magazine Luiza S.A. (Convenience Translation into English from the Original Previously Issued in Portuguese)
") Magazine Luiza S.A. (Convenience Translation into English from the Original Previously Issued in Portuguese) KPDS 214794 Financial statements as at Contents Independent Auditors Report on the Individual
Magazine Luiza S.A. (Convenience Translation into English from the Original Previously Issued in Portuguese) KPDS 214794 Financial statements as at Contents Independent Auditors Report on the Individual
T4F Entretenimento S.A.
 T4F Entretenimento S.A. 1Q17 Earnings Release T4F Entretenimento S.A. BM&FBOVESPA: SHOW3 Quotation Closing on 03/31/2017: R$6.41 1Q17 Average Volume: 109.0 thousand (0.33% of the free float) Price on 05/10/2017:
Highlights of the Period
 B2W REPORTS A 39% GROWTH IN GROSS REVENUE, 50% IN EBITDA AND AN IMPROVEMENT OF 32 DAYS ON THE CASH CONVERSION CYCLE IN 1Q08. Rio de Janeiro, May 08, 2008 B2W Companhia Global do Varejo (BOVESPA: BTOW3),
Usinas Siderúrgicas de Minas Gerais S.A. - USIMINAS Quarterly Information (ITR) at September 30, 2011 and Report on Review of Quarterly Information
 at September 30, 2011 and Report on Review of Quarterly Information") (A free translation of the original in Portuguese) Usinas Siderúrgicas de Minas Gerais S.A. - USIMINAS Quarterly Information (ITR) at September 30, 2011 and Report on Review of Quarterly Information (A
(A free translation of the original in Portuguese) Usinas Siderúrgicas de Minas Gerais S.A. - USIMINAS Quarterly Information (ITR) at September 30, 2011 and Report on Review of Quarterly Information (A