F. Barry Lawrence, Ph.D., Texas A&M University
|
|
|
- Myron Alexander
- 6 years ago
- Views:
Transcription


1 F101 Optimizing Supplier Alliances Best practices in formulating, formalizing, and leveraging strategic suppliers are cutting edge and understood by only a few distributors. This session will explore how best practice supplier relationships create more effective supply chains, capture more market share, and optimize profitability. The best practices will be supported with case study results from Texas A&M s many research projects with best practice firms. F. Barry Lawrence, Ph.D., Texas A&M University 3/12/2010, 9:30 a.m.
2 Session Objectives Develop business process framework Develop financial framework Link business processes and shareholder value Implement best practices Quantify impact of best practices on profitability 2
3 Return on Investment Opportunity Quantify impact of best practices on profitability Prioritize improvement opportunities Increased EBITDA and RONA 3
4 Additional Resources Optimizing Distributor Profitability available from the NAW. Educational Programs from the Thomas and Joan Read Center for Distribution Research and Education at Pricing Optimization Optimizing Distributor Profitability Certificate in Distribution Management Custom Programs Research from the Supply Chain Systems Laboratory tamu 4
5 The ROI Equation Financial Statements 5
")


6 Business Process Framework Key Performance Indicators (KPIs) Supply Chain Planning Supplier Customer Source Stock Store Sell Ship Support Services Information Management Human Resource Management Finance Managemnet 6


7 Financial Drivers 7
8 Step 1 Identify Gap Sample Assessment Report 8
9 Step 2: Map Shareholder Value Distributor Profitability Framework 9


10 Supplier Performance and ROI 10
11 Step 3: Assess Profitability Supplier Lead Time Variability Safety Stock Average Inventory GMROII % RONA 11

12 SOURCE Process Group Suppliers Key Performance Indicators (KPIs) Supply Chain Planning Supplier Customer Source Stock Store Sell Ship Support Services Information Management Human Resource Management Finance Managemnet 12
13 Source Processes Distribution Source Stock Store Sell Ship Support Services Supplier Management Supplier Selection Supplier Performance Supplier Stratification Supplier Relationship Right # Suppliers 13


")

14 Supplier Stratification Best Practices Good Practices Pe erforma ance Common Practices Segmentation based on COGS by supplier Pareto framework (80%-20%) Loyalty, Profitability, Services, Performance Risk/Exposure supply availability, technical requirements, financial factors, technological factors and environmental issues Landed Cost (TCO) Combination Methodology Purchase price variance Landed dcost Lacks segmentation framework Time 14


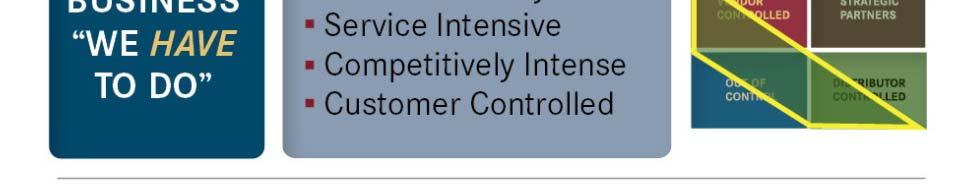

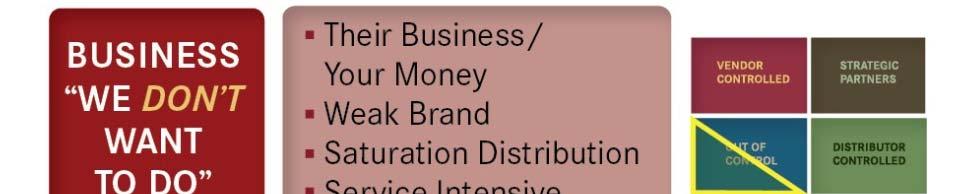
15 Supplier Stratification Relationships 15


16 Supplier Management Best Practices Good Practices Perform mance Common Practices On time delivery Lead time Quality & Delivery completeness On time delivery Lead time Quality & Delivery completeness Lead time variability Combination methodology - Supplier Performance Index (SPI) No supplier performance measurement On time delivery (Reactive measurement only) Quality Time 16
17 Supplier Performance Ranking Criteria Sample ranking criteria for supplier performance factors Factors A B C D Lead Time Average < 2 weeks 2 to 4 weeks 4 to 8 weeks > 8 weeks Lead Time Variability (COV) <= > 0.75 On-Time Index >= <= 0.25 Completeness Index >= <=
18 Supplier Performance Final Rank Weighting approach to combine individual ranks Supplier List 20% 30% 25% 25% Lead Time Average Lead Time Variability On-Time Index Completeness Index Final Rank Supplier 1 A A B A A Supplier 2 A A B D A Supplier 3 A D C A C Supplier 4 B A B C A Supplier 5 B C C A B : : : : : : 18


19 Lead Time Variability Schematic Basic Input Parameters Additional Revenue EBITDA Lead Time LT Var. Expected Turns P&L and Bal. Sheet Safety Stock Average Inventory % of reinvestment YES Re-invest? NO RONA GMROII Turns 19
20 Financial Statements Typical Distributor Income Statement Fixed Variable Net Sales $ 148,265, % Cost of Goods Sold $ 110,902, % 0% 100% Gross Margin $ 37,363, % Employee Compensation - Outside S $ 9,059, % 25% 75% Employee Compensation - Others $ 9,385, % 90% 10% Warehouse Expenses $ 4,477, % 50% 50% Delivery Expenses $ 4,536, % 20% 80% Other Operating Expenses (G&A) $ 2,194, % 25% 75% Total Operating Expenses $ 29,653, % 0% Operating Margin $ 7,709, % Other Income $ - 0.0% Other Expenses $ - 0.0% EBITDA $ 7,709, % Balance Sheet Assets By Total Assets Inventory $ 17,470, % Accounts Receivables $ 18,829, % Cash & Marketable Securities $ 1,990, % Other Currrent Assets $ 1,978, % Total Current Assets $ 40,268, % Fixed & Non-current Assets $ 6,153, % Total Assets $ 46,421, % Liabilities & Net Worth By Total Liabilities & Net Worth Accounts Payables $ 9,884, % Notes Payable (Short-term Debt) $ 1,427, % Other Current Liabilities $ 2,404, % Total Current Liabilities $ 13,716, % Long-term Liabilities $ 4,991, % Net Worth Or Owner's Equity $ 27,714, % Total Liabilities & Net Worth $ 46,421, % 0% 20
21 Financial KPIs Typical Distributor Financial KPIs Current CASH FLOW DSO 46.4 DPO 32.5 DOI Cash Conversion Cycle 71.3 Working Capital as a % of rev 17.9% PROFITABILITY Gross Margin % 25.2% EBITDA Margin % 5.2% Personnel Productivity it Ratio (PPR) GMROI % 214% % change in EBITDA $ GROWTH Revenue Growth % 5.3% ASSET EFFICIENCY Asset Turnover 3.19 Receivables Turnover 7.9 Inventory Turnover 6.35 RONA (EBITDA/Net Assets) 23.57% 21
22 Critical Information Current inventory = $ 17,470,663 6 critical suppliers account for 77% inventory Inventory considered = $ 13,452, (77%) Number of SKUs considered = 5,237 Objective is to reduce lead time variability by 10% 22
23 Input Parameters For a top selling item Supplier Parameters Average Lead Time 28 Days Lead Time Variability (Expressed as standard deviation) 7 Days Unit Cost $ Distributor Parameters Monthly Demand 12,050 Units Cycle Service Level (CSL) 85% Forecast Accuracy 80% Order Quantity (OQ) 2,400 units Calculation Cycle Inventory (Half of OQ) 1,200 Units Safety Inventory 4,416 Units Average Inventory (Cycle + Safety) 5,616 Units 23
24 Impact of LT Variability on Inventory Lead Time Varibility (Days) Safety Stock (Qty) Average Inventory (Qty) % of Current Inventory 7 4,416 5, % 6.3 4,201 5, % 5.6 3,998 5, % 4.9 3,811 5, % 4.2 3,641 4, % 3.5 3,491 4, % , , % 2.1 3,260 4, % 1.4 3,184 4, % , , % 0 3,122 4, % This implies a reduction in inventory for this SKU by 3.8% Let s extend this savings to the remaining SKU s Inventory reduction = 3.8% X $ 13,452,410 = $ 514,978 24


25 Lead Time Variability - Schematic Basic Input Parameters Additional Revenue = $ 514,978 X 6 / (1-25.2%) = $ 4,130,839 EBITDA Lead Time LT Var. Expected Turns 6 turns P&L and Bal. Sheet Safety Stock % of re- investment YES 100% RONA GMROII Turns Average Inventory Re-invest? NO $ 514,978 25
26 Impact on Income Statement Profitability Analysis - Income Statement Income Statement Current Scenario By Sales % Fixed Variable To-Be Scenario Formulae Column A B C D E Net Sales $ 148,265, % $ 152,396,718 New Net Sales Cost of Goods Sold (COGS) $ 110,902, % 0% 100% $ 113,992,745 (A * C) + (New Net Sales * B * D) Gross Margin $ 37,363, % $ 38,403,973 (New Net Sales - COGS) Employee Compensation - Outside Sales $ 9,059, % 25% 75% $ 9,248,341 (A * C) + (New Net Sales * B * D) Employee Compensation - Others $ 9,385, % 90% 10% $ 9,411,378 (A * C) + (New Net Sales * B * D) Warehouse Expenses $ 4,477, % 50% 50% $ 4,540,005 (A * C) + (New Net Sales * B * D) Delivery Expenses $ 4,536, % 20% 80% $ 4,638,059 (A * C) + (New Net Sales * B * D) Other Operating Expenses (G&A) $ 2,194, % 25% 75% $ 2,240,187 (A * C) + (New Net Sales * B * D) Total Operating Expenses $ 29,653, % $ 30,077,971 Operating Margin $ 7,709, % 5.2% $ 8,326,002 Gross Margin - Total Operating Expenses Other Income $ - 0.0% $ - Other Expenses $ - 0.0% $ 62,954 Interest expense for additional accounts 12% EBITDA $ 7,709, % $ 8,263,048 26
27 Impact on Balance Sheet Profitability Analysis - Balance Sheet Balance Sheet Current Scenario To-Be Scenario Formulae Assets By Total Assets Inventory $ 17,470, % $ 17,470,663 No change in inventory since re-allocated Accounts Receivables $ 18,829, % $ 19,354,383 Days Sales Outstanding * (New Net Sales / 365) Cash & Marketable Securities $ 1,990, % $ 1,990,029 Other Currrent Assets $ 1,978, % $ 1,978,468 Total Current Assets $ 40,268, % $ 40,793,543 Fixed & Non-current Assets $ 6,153, % $ 6,153,034 Total Assets $ 46,421, % $ 46,946,577 Liabilities & Net Worth By Total Liabilities & Net Worth Accounts Payables $ 9,884, % $ 10,159,781 Notes Payable (Short-term Debt) $ 1,427, % $ 1,427,456 Other Current Liabilities $ 2,404, % $ 2,404,335 Total Current Liabilities $ 13,716, % $ 13,991,572 Long-term Liabilities $ 4,991, % $ 4,991,618 Net Worth Or Owner's Equity $ 27,714,159, 59.7% $ 27,963,387, Total Liabilities & Net Worth $ 46,421, % $ 46,946,577 Days Payable Outstanding * (New COGS / 365) 27
28 Impact on Financial Metrics Key Metrics Current Potential Inventory Turns (Asset Efficiency) RONA (Asset Efficiency) 23.6% 25.1% Cash Conversion Cycle (Cash Flow) 71.3 Days 69.8 Days GMROII (Profitability) 214% 220% EBITDA (Profitability) 52% 5.2% 54% 5.4% 28
29 Potential Profitability - Typical Distributor 40% Potential Profitability Curve SOURCE RONA % MINIMUM RONA % MAXIMUM RONA % Typical Distributor 36.73% 30% 31.54% 31.79% 29.03% 28.22% 28.50% 25.08% 25.55% 26.28% 24.53% 25.72% 26.00% 23.57% 20% Base Case Lead Time Lead Time Variability Completeness Index Payment Terms 29
30 Potential Profitability - Typical Distributor Impact of SOURCE best practices on EBITDA % Typical Distributor 5.2% 5.8% 5.8% 5.5% 6.0% Base Case Lead Time Lead Time Variability Completeness Index Payment Terms 30
31 Potential Profitability (RONA) Impact of SOURCE, STOCK, SELL, STORE & SHIP best practices on RONA Typical Distributor 75.2% 61.2% 67.7% 85.0% 23.6% 33.4% Base Case Source & Stock Store & Ship Sell Combined Combined Best Practices Best Practices MIN MAX 31
32 Potential Profitability (EBITDA) Impact of SOURCE, STOCK, SELL, STORE & SHIP best practices on EBITDA % Typical Distributor 5.20% 9.32% 7.17% 11.41% 10.29% 11.52% Base Case Source & Stock Store & Ship Sell Combined Best Practices MIN Combined Best Practices MAX 32
33 Action Plan Step 1: Properly segment suppliers. Step 2: Measure supplier performance. Step 3: Develop scorecard and share results with suppliers. Step 4: Demonstrate impact of supplier performance on shareholder value 33
34 Summary POTENTIAL for improving profitability exists Process and financial performance can be MEASURED to assess potential AONE-to-ONE connection can always be established for processes and shareholder value This connection can be QUANTIFIED and PRIORITIZED Best practices can be ACHIEVED Education will ENABLE distributors to realize POTENTIAL profitability 34
35 Thank You For Attending F101 Optimizing Supplier Alliances F. Barry Lawrence, Ph.D. Please submit the Session Feedback Form To receive NASBA credits, please be sure to complete the Session Feedback Form and sign the class roster in the back of the room Total Solutions For Industrial Distributors and Manufacturers Thank You! For more info please visit: 35
F. Barry Lawrence, Ph.D., Texas A&M University
 Keynote Gaining Competitive Advantage Through Lean Distribution The cutting edge in gaining distribution competitive advantage is lean. Many customers and suppliers are implementing lean procedures and
Rebeccas Coffee 2018 Prepared for Rebeccas Coffee 05 December 2018
 Prepared for 5 December 218 Page 1/22 Data Reporting Period Period End 3-6-215 3-6-216 3-6-217 3-6-218 Period Length (months) 12 12 12 12 Profit & Loss Revenue 3,4, 5,, 5,8, 6,612, Gross Margin ($) 865,
Williams Plumbing 2018 Prepared for Williams Plumbing 05 December 2018
 Prepared for 5 December 218 Page 1/22 Data Reporting Period Period End 3-6-215 3-6-216 3-6-217 3-6-218 Period Length (months) 12 12 12 12 Profit & Loss Revenue 18,, 31,5, 35,, 42,, Gross Margin ($) 4,8,
Core-Mark Holding Company, Inc. B B & T Consumer, Food & Retail Conference New York December 3, 2013
 Core-Mark Holding Company, Inc. B B & T Consumer, Food & Retail Conference New York December 3, 2013 SAFE HARBOR Statements made in the course of this presentation that state the company s or management
{List Sales (1 Trade Discount) Total Cost} (1 Tax Rate) = 0.06K
 Total Cost} (1 Tax Rate) = 0.06K") FINAL CA MAY 2018 ADVANCED MANAGEMENT ACCOUNTING Test Code F84 Branch: Date : 04.03.2018 (50 Marks) Note: All questions are compulsory. Question 1(4 Marks) (c) Selling Price to Yield 20% Return on Investment
FINAL CA MAY 2018 ADVANCED MANAGEMENT ACCOUNTING Test Code F84 Branch: Date : 04.03.2018 (50 Marks) Note: All questions are compulsory. Question 1(4 Marks) (c) Selling Price to Yield 20% Return on Investment
Contents. Preface... xiii. CHAPTER 1 Introduction to Management Accounting and Control CHAPTER 2 Management Reporting... 29
 v Preface... xiii CHAPTER 1 Introduction to Management Accounting and Control... 1 The Concepts of Management, Accounting, and Control... 2 A Definition of Management... 2 A Definition of Accounting...
Lecture 7. Introduction to Retailer Simulation Summary and Preparation for next class
 Decision Models Lecture 7 1 Portfolio Optimization - III Introduction to Options GMS Stock Hedging Lecture 7 Introduction to Retailer Simulation Summary and Preparation for next class Note: Please bring
Software Economics. Introduction to Business Case Analysis. Session 1
 Software Economics Introduction to Business Case Analysis Session 1 Who am I? Sweden PhD Student in Computer Science (Business Process Management) Masters in Business Administration Worked with development
Index. Business unit, 311, 350 Business-unit level strategies, 309, 311 Business-unit strategies, 311, 350
 387 Index A Absenteeism rate, 239 Accounting, 26, 93 Definition, 3 Accounting system, 14 Accrual accounting, 176, 182, 194 Activity-based budgeting, 141 142, 150 Activity-based costing, 67 69, 71, 93,
Financing for Energy & Sustainability
 Financing for Energy & Sustainability Understanding the CFO and Translating Metrics This resource was completed with support from the Department of Energy s Office of Energy Efficiency and Renewable Energy
Core-Mark Holding Company Jefferies 2017 Consumer Conference. June 21 st 2017
 Core-Mark Holding Company Jefferies 2017 Consumer Conference June 21 st 2017 2 Safe Harbor & SEC Regulation G Safe Harbor Statements made in the course of this presentation that state the company s or
MERGERS & ACQUISITIONS. Michael Dudek, President (610)
") MERGERS & ACQUISITIONS Michael Dudek, President (610) 873-6555 mdudek@zygoquest.com www.zygoquest.com Preliminaries Who is an owner? Do you know your company s value? Within what degree of certainty? Do
MERGERS & ACQUISITIONS Michael Dudek, President (610) 873-6555 mdudek@zygoquest.com www.zygoquest.com Preliminaries Who is an owner? Do you know your company s value? Within what degree of certainty? Do
Wikipedia: "Financial Ratio" Contents. Sources of Data for Financial Ratios. Purpose and Types of Ratios
 Wikipedia: "Financial Ratio" A financial ratio or accounting ratio is a relative magnitude of two selected numerical values taken from an enterprise's financial statements. Often used in accounting, there
SAMPLE REPORT. Service Desk Benchmark DATA IS NOT ACCURATE! Outsourced Service Desks
 h SAMPLE REPORT DATA IS NOT ACCURATE! Service Desk Benchmark Outsourced Service Desks Report Number: SD-SAMPLE-OUT-0617 Updated: June 2017 MetricNet s instantly downloadable Service Desk benchmarks provide
Retailing Financial Strategy
 3 ways to increase the value of money turnover model Financial objectives and the strategic profit model ROI model Gross margin return on investment Monitoring retail performance Direct product profitability
Enhancing cash flow management and capital efficiency toward increased corporate value over the medium-to-long term
 FINANCIAL STRATEGY Message from the CFO Enhancing cash flow management and capital efficiency toward increased corporate value over the medium-to-long term Norio Tadakawa Corporate Executive Officer Chief
Total Risk Management: Mitigating Insurable & Uninsurable Risk in Your Portfolio Investments
 Total Risk Management: Mitigating Insurable & Uninsurable Risk in Your Portfolio Investments RISK MANAGEMENT OVERVIEW Effective and prudent portfolio management requires addressing, managing, and/or minimizing
CMA 2010 Support Package
 CMA 2010 Support Package Ratio Definitions CMA EXAM RATIO DEFINITIONS Abbreviations EBIT = Earnings before interest and taxes EBITDA = Earnings before interest, taxes, depreciation and amortization EBT
Session 2, Sunday, April 2nd (1:30-5:00) v Association for Financial Professionals. All rights reserved. Session 3-1
 v Association for Financial Professionals. All rights reserved. Session 3-1") Session 2, Sunday, April 2nd (1:30-5:00) v2.0 2014 Association for Financial Professionals. All rights reserved. Session 3-1 Chapters Covered Financial Accounting and Reporting: Part I, Domain B Chapter
Session 2, Sunday, April 2nd (1:30-5:00) v2.0 2014 Association for Financial Professionals. All rights reserved. Session 3-1 Chapters Covered Financial Accounting and Reporting: Part I, Domain B Chapter
Credit Insurance Limit Underwriting Case Studies AMAN Union 2 nd Training Session, Dubai - April 2012 Maroun Abi Saad
 Credit Insurance Limit Underwriting Case Studies AMAN Union 2 nd Training Session, Dubai - April 2012 Maroun Abi Saad Case 1: Unknown Limited Unknown Limited Financial Ratios and KPIs Key KPIs & Ratios
WORKING CAPITAL ANALYSIS OF SELECT CEMENT COMPANIES IN INDIA
 CHAPTER - IV WORKING CAPITAL ANALYSIS OF SELECT CEMENT COMPANIES IN INDIA CHAPTER IV WORKING CAPITAL ANALYSIS OF SELECT CEMENT COMPANIES IN INDIA In this chapter an attempt has been made to analyse the
Sample Extreme Client
 Take a snapshot of a projection and perform a what-if scenario on the current projection using the projection controls. Initial Current Projection 12/31/2013 12/31/2013 12/31/2013 Income Statement Sales
Effective Use of Pavement Management Programs. Roger E. Smith, P.E., Ph.D. Zachry Department of Civil Engineering Texas A&M University
 Effective Use of Pavement Management Programs Roger E. Smith, P.E., Ph.D. Zachry Department of Civil Engineering Texas A&M University 1 Pavement Management Is A Decision Making Process Effective Pavement
Essential Learning for CTP Candidates TEXPO Conference 2017 Session #03
 TEXPO Conference 2017: Essential Learning for CTP Candidates Session #3 (Mon.1:45 3:00 pm) Overview of Basic CTP Math from ETM5 Chap 07: Earnings Credits Chap 11: Working Capital Chap 08: Fin. Statements
Financials. Lecture 7
 Financials Lecture 7 1 Financial statements Income statement (P/L) Balance sheet Beginning Cash Flow statement Balance sheet Ending Changes in Shareholder Equities 2 Business Financial Flow Collection
Financial Analysis. Consolidated financial analysis ( ) Based on IFRS
 Based on IFRS") Financial Analysis Consolidated financial analysis (2012-2014) Based on IFRS 2012 2013 2014 Liability to asset ratio (%) 42.58 57.70 56.68 Long-term fund to PP&E ratio (%) 170.33 182.99 199.33 Current
Financial Analysis Consolidated financial analysis (2012-2014) Based on IFRS 2012 2013 2014 Liability to asset ratio (%) 42.58 57.70 56.68 Long-term fund to PP&E ratio (%) 170.33 182.99 199.33 Current
Applications of Linear Programming
 Applications of Linear Programming lecturer: András London University of Szeged Institute of Informatics Department of Computational Optimization Lecture 8 The portfolio selection problem The portfolio
Risk Management for Chemical Supply Chain Planning under Uncertainty
 for Chemical Supply Chain Planning under Uncertainty Fengqi You and Ignacio E. Grossmann Dept. of Chemical Engineering, Carnegie Mellon University John M. Wassick The Dow Chemical Company Introduction
Unlocking the Value of the Financial Supply Chain
 Unlocking the Value of the Financial Supply Chain Global Transaction Services Cash Management Trade Services and Finance Securities and Fund Services Unlocking the Value of the Financial Supply Chain Tuesday,
AFP Financial Planning & Analysis Learning System Session 2, Sunday, April 2nd (1:30-5:00)
") AFP Financial Planning & Analysis Learning System Session 2, Sunday, April 2nd (1:30-5:00) Chapters Covered Financial Accounting and Reporting: Part I, Domain B Chapter 7 Ratio Analysis: Part I, Domain
AFP Financial Planning & Analysis Learning System Session 2, Sunday, April 2nd (1:30-5:00) Chapters Covered Financial Accounting and Reporting: Part I, Domain B Chapter 7 Ratio Analysis: Part I, Domain
Portfolio Construction Research by
 Portfolio Construction Research by Real World Case Studies in Portfolio Construction Using Robust Optimization By Anthony Renshaw, PhD Director, Applied Research July 2008 Copyright, Axioma, Inc. 2008
FINANCIAL RATIOS. LIQUIDITY RATIOS (and Working Capital) You want current and quick ratios to be > 1. Current Liabilities SAMPLE BALANCE SHEET ASSETS
 You want current and quick ratios to be > 1. Current Liabilities SAMPLE BALANCE SHEET ASSETS") FINANCIAL RATIOS ROUND ALL ANSWERS TO TWO DECIMALS UNLESS REQUESTED OTHERWISE IN THE PROBLEM LIQUIDITY RATIOS (and Working Capital) You want current and quick ratios to be > 1 Current Ratio Quick Ratio
FINANCIAL RATIOS ROUND ALL ANSWERS TO TWO DECIMALS UNLESS REQUESTED OTHERWISE IN THE PROBLEM LIQUIDITY RATIOS (and Working Capital) You want current and quick ratios to be > 1 Current Ratio Quick Ratio
CHAPTER 2: CONSTRUCTING FINANCIAL STATEMENTS
 M2-18. a. no effect e. increase b. decrease f. increase c. decrease g. increase d. no effect M2-19. a. Balance sheet e. Balance sheet i. Income statement b. Income statement f. Balance sheet j. Income
Taking the Next Step Team Sauder. Jarl Greve Nadine Raida Morten Juhl Sebastian Kersting
 Taking the Next Step Team Sauder Jarl Greve Nadine Raida Morten Juhl Sebastian Kersting By expanding distribution and initiate production in India Nord- Lock can gain 1.5 BSEK by 2019 Revenue Introducing
B. Riley Investor Conference. May 23, 2018
 B. Riley Investor Conference May 23, 2018 About This Presentation Safe Harbor Statement This presentation includes forward-looking statements (statements which are not historical facts) within the meaning
Analytics That Work Tools for Creating Value and Focusing Performance
 Analytics That Work Tools for Creating Value and Focusing Performance 2010 Pork Management Conference June 17, 2010 Bruce R. Limpert CPS Management Services Who We Are: Providing practices, tools and management
Software Economics. Introduction to Business Case Analysis. Session 3
 Software Economics Introduction to Business Case Analysis Session 3 Recap How much profit will my investment give? What is the Risk of my Investment? When do I get benefit from my investment? Net Present
Executive Action Report. For the month ending January 31, 2014 (and the prior thirteen months) Hello Telephone Co
 Hello Telephone Co") Executive Action Report For the month ending January 31, 2014 (and the prior thirteen months) North American Industry Classification System (NAICS) 521210 Based on: Note: These reports are for discussion
Executive Action Report For the month ending January 31, 2014 (and the prior thirteen months) North American Industry Classification System (NAICS) 521210 Based on: Note: These reports are for discussion
Cost Risk and Uncertainty Analysis
 MORS Special Meeting 19-22 September 2011 Sheraton Premiere at Tysons Corner, Vienna, VA Mort Anvari Mort.Anvari@us.army.mil 1 The Need For: Without risk analysis, a cost estimate will usually be a point
Supply chain management and return on total net assets Understanding the impact of SCM decisions on financial performance
 Supply chain management and return on total net assets Understanding the impact of SCM decisions on financial performance CASE STUDY SUPPLY CHAIN MANAGEMENT Simon Templar AUTHOR BIOGRAPHY DR SIMON TEMPLAR
3 rd Quarter 2015 Earnings Release
 3 rd Quarter 2015 Earnings Release October 29 th, 2015 Highlights of Results Net Sales totaled R$ 4.095 billions in, down 22,7%, mainly due 1 to the market decline in consumption Adjustments in Cost structure,
ANALYSIS 1) Analysts are predicting that Krispy Kreme will be able to perform highly effectively and continue to grow rapidly in the coming two years.
 Analysts are predicting that Krispy Kreme will be able to perform highly effectively and continue to grow rapidly in the coming two years.") ASSIGNMENT 3 KRISPY KREME DOUGHNUTS Jonathan Suprovici Caroline Vennes Simon Foucher Presented to Professor Michel Magnan For the class of ACCO 691 - Business Valuation John Molson School of Business October
ASSIGNMENT 3 KRISPY KREME DOUGHNUTS Jonathan Suprovici Caroline Vennes Simon Foucher Presented to Professor Michel Magnan For the class of ACCO 691 - Business Valuation John Molson School of Business October
Cash flow and Treasury Driving to Positive Cash. December 2015
 Cash flow and Driving to Positive Cash December 2015 Agenda Changing role of 3 1 Cash flow projection/forecasting 4 1.a 1.b Why is Cash forecasting important? The CFO Agenda- cash efficiency 2 Working
Defense Health Agency Future Capital Funding
 Defense Health Agency Future Capital Funding March 27, 2017 1 Future Capital Funding Programming/Funding Models Support enterprise decision making for facilities investments Logical approach/common strategy
2015 IWDC Owners Meeting
 2015 IWDC Owners Meeting The Real Profit Drivers The Real Profit Drivers Prepared For IWDC The Real Profit Drivers Presented By Al Bates Objectives Of The Session Review the Profit Structure of the Industry
SAMPLE REPORT. Call Center Benchmark. In-house/Insourced Call Centers DATA IS NOT ACCURATE!
 SAMPLE REPORT DATA IS NOT ACCURATE! Call Center Benchmark In-house/Insourced Call Centers Report Number: CC-SAMPLE-IN-0116 Updated: January 2016 MetricNet s instantly downloadable Call Center benchmarks
YOUR SMALL BUSINESS SCORECARD. Your Small Business Scorecard. David Oetken, MBA CPM
 Your Small Business Scorecard David Oetken, MBA CPM 1 Being a successful entrepreneur takes a unique mix of skills and practices. You need to generate exciting ideas, deliver desirable products or services,
John A. Jaeger, CCE, MBA
 John A. Jaeger, CCE, MBA Session Outline General Info Review Company Introduction & Industry Review Company Financials Ratio Analysis Discussion Strengths & Weaknesses Decision Extend Credit Management
Q1 The committee set attainable initiatives.
 Planning & Budget Assessment End of Year Survey 216-217 Q1 The committee set attainable initiatives. 1 2 3 4 5 6 7 8 9 1 66.67% 4 33.33% 2 6 4.33 1 / 28 Planning & Budget Assessment End of Year Survey
Supplier A - INSOURCE
 Supplier A - INSOURCE Capacity = 10 units/week Price = $4/unit Lead Time = 0 weeks No Min Qty Supplier B - GOTHAM CITY Capacity = 15 units/week Price = $3/unit Lead Time = 1 week No Min Qty Supplier C
LIQUIDITY A measure of the company's ability to meet obligations as they come due. Financial Score for Restaurant
 Dear Client: In an effort to bring you more value as a financial management advisor, we have initiated a program to present your financial statements in an easier-to-read and more useful format. We are
Credit Risk Scoring - Basics
 Credit Risk Scoring - Basics Charles Dafler, Credit Risk Solutions Specialists, Moody s Analytics Mehna Raissi, Credit Risk Product Management, Moody s Analytics NCCA Conference February 2016 Setting the
How Advanced Pricing Analysis Can Support Underwriting by Claudine Modlin, FCAS, MAAA
 How Advanced Pricing Analysis Can Support Underwriting by Claudine Modlin, FCAS, MAAA September 21, 2014 2014 Towers Watson. All rights reserved. 3 What Is Predictive Modeling Predictive modeling uses
Investor Presentation. March 2016
 Investor Presentation March 2016 Safe Harbor Statement This presentation includes forward-looking statements (statements which are not historical facts) within the meaning of the Private Securities Litigation
Tykoh Valuation Utility - user guide v 1.1
 Tykoh Valuation Utility - user guide v 1.1 Introduction This guide describes a valuation utility that is basic in some ways and sophisticated in others - it combines a simple framework with advanced analytics.
SAMPLE REPORT. Contact Center Benchmark DATA IS NOT ACCURATE! Outsourced Contact Centers
 h SAMPLE REPORT DATA IS NOT ACCURATE! Contact Center Benchmark Outsourced Contact Centers Report Number: CC-SAMPLE-OUT-0617 Updated: June 2017 MetricNet s instantly downloadable Contact Center benchmarks
Ontario Energy Board
 Ontario Energy Board Commission de l énergie de l Ontario Ontario Energy Board Filing Requirements For Electricity Transmission Applications Chapter 2 Revenue Requirement Applications February 11, 2016
SAMPLE REPORT. Contact Center Benchmark DATA IS NOT ACCURATE! In-house/Insourced Contact Centers
 h SAMPLE REPORT DATA IS NOT ACCURATE! Contact Center Benchmark In-house/Insourced Contact Centers Report Number: CC-SAMPLE-IN-0617 Updated: June 2017 MetricNet s instantly downloadable Contact Center benchmarks
Analysis write-up at: GOOGLE INC. (GOOG) #2 SUSTAINABLE REVENUE GROWTH
 #2 SUSTAINABLE REVENUE GROWTH") GOOGLE INC. (GOOG) NOMINAL REVENUE 35.00% 3 25.00% 2 15.00% 1 5.00% #1 REAL REVENUE PRICE ADJUSTED REVENUE 29.7% 28.3% 23.8% 6.7% #4 OPERATING EXPENSE CONTROL NOI$ GP$ NOI% GP% CORE OPER EXP% 8 $30,000,000
GOOGLE INC. (GOOG) NOMINAL REVENUE 35.00% 3 25.00% 2 15.00% 1 5.00% #1 REAL REVENUE PRICE ADJUSTED REVENUE 29.7% 28.3% 23.8% 6.7% #4 OPERATING EXPENSE CONTROL NOI$ GP$ NOI% GP% CORE OPER EXP% 8 $30,000,000
An Empirical Examination of the Electric Utilities Industry. December 19, Regulatory Induced Risk Aversion in. Contracting Behavior
 An Empirical Examination of the Electric Utilities Industry December 19, 2011 The Puzzle Why do price-regulated firms purchase input coal through both contract Figure and 1(a): spot Contract transactions,
For 466W Forest Resource Management Lab 5: Marginal Analysis of the Rotation Decision in Even-aged Stands February 11, 2004
 For 466W Forest Resource Management Lab 5: Marginal Analysis of the Rotation Decision in Even-aged Stands February 11, 2004 You used the following equation in your first lab to calculate various measures
Option Value Analysis of Flexibility in Supply Chain Postponement. Option Value Analysis of Flexibility in Supply Chain Postponement
 Option Value Analysis of Flexibility in Supply Chain Postponement Executive Summary This paper presents the valuation of the flexibility option in postponing assembly of transformers to printer modules
The following learning and growth perspective measures could enhance the implementation and management of Wellgas strategy:
 SECTION A CASE QUESTIONS (Total: 50 marks) Answer 1(a) Wellgas strategy is to transform a fill-the-petrol tank routine into a delightful shopping experience for service-oriented customers who are ready
What Are the Key Business Problems?
 THE NEW NORMAL Creating Best Practices for Counsel and Claims Handlers by developing actionable metrics, consistent reporting, reward structures, and reserve accuracy. What Are the Key Business Problems?
EE266 Homework 5 Solutions
 EE, Spring 15-1 Professor S. Lall EE Homework 5 Solutions 1. A refined inventory model. In this problem we consider an inventory model that is more refined than the one you ve seen in the lectures. The
G/L Re-Indexing. Preliminary Considerations. Summary Re-Index Process
 This feature works by retroactively applying system settings to posted transactions. Some account numbers and account balances may change as a result of performing a re-index. Preliminary Considerations
Sigma Pharmaceuticals Limited
 Sigma Pharmaceuticals Limited Results Presentation for the Full Year ended 31 January 2013 Mark Hooper CEO& Managing Director Jeff Sells Chief Financial Officer 14 March 2013 Important notice The material
Setting the Ground for Business Success
 Setting the Ground for Business Success How to define your goals, strategy and metrics www.mrdashboard.com info@mrdashboard.com 211 MR Dashboard LLC. All Rights Reserved. Materials and forms in this guide
A Holistic Supply Chain Management Solution
 A Holistic Supply Chain Management Solution INFORMS Edelman Prize Presentation April 8, 2013 Don Walker SVP Distribution Operations McKesson Bob Gooby VP Process Redesign McKesson Kaan Katircioglu Research
Breakfast Talk Series: Strategies to unlock working capital. Marvin Tan Executive Director
 Breakfast Talk Series: Strategies to unlock working capital Marvin Tan Executive Director Self Introduction Executive Director of Nufin Data & JK Tech Group Previously, -Group CFO of JK Tech Group -Consultant
The Business Case for Automation
 The Business Case for Automation Presented by: Troy VanWormer, Director, Warehouse Automation 2018 MHI Copyright claimed for audiovisual works and sound recordings of seminar sessions. All rights reserved.
Production Management Winter 2002 Odette School of Business University of Windsor. Midterm Exam 2 Solution Tuesday, March 26, 7:00 9:00 pm
 Name (print, please) ID Production Management 7-604 Winter 00 Odette School of Business University of Windsor Midterm Exam Solution Tuesday, March 6, 7:00 9:00 pm Instructor: Mohammed Fazle Baki Aids Permitted:
Financial Aspects in Franchising
 Learning Objectives By the end of this chapter, you should be able to understand: The financial aspects from the franchisor s perspective. The investment required and how to identify suitable sources for
Supply Chains: Planning with Dynamic Demand
 Department of Industrial Engineering Supply Chains: Planning with Dynamic Demand Jayant Rajgopal, Ph.D., P.E. Department of Industrial Engineering University of Pittsburgh Pittsburgh, PA 15261 PRODUCTION
Finance Recruiting Interview Preparation
 Finance Recruiting Interview Preparation Discounted Cash Flows Session #3 This presentation is for informational purposes only, and is not an offer to buy or sell or a solicitation to buy or sell any securities,
The Complete Course On Budgeting: Planning, Forecasting, What If Analysis And Reporting
 The Complete Course On Budgeting: Planning, Forecasting, What If Analysis And Reporting SECTOR / ACCOUNTING AND FINANCE NON-TECHNICAL & CERTIFIED TRAINING COURSE The use of Excel as the toolbox of choice
Stress Testing Challenges:
 Stress Testing Challenges: Forecasting Consistent Credit & Market Risk Losses JOSE CANALS-CERDA, Federal Reserve Bank of Philadelphia JUAN M. LICARI, Senior Director, Moody s Analytics OCTOBER 2015 Agenda
Q3 Fiscal Year 2016 Financial Results January 20, 2016
 Q3 Fiscal Year 2016 Financial Results January 20, 2016 FORWARD-LOOKING STATEMENTS This presentation contains forward-looking statements within the meaning of the federal securities laws, including, without
TIPS TO CREATING A HEALTHY CASH FLOW
 TIPS TO CREATING A HEALTHY CASH FLOW Presented By: Jen Nord, CPA Rudd & Company, PLLC Bozeman, MT May 23, 2013 OUTLINE FOR THIS SESSION Cash Flow Statements vs. Income Statements Cash flow crunches & where
CORNERSTONES. of Managerial Accounting. Dan L. Heitger. Maryanne M. Mowen. Don R. Hansen. Miami University ~ Oxford. Oklahoma State University
 FUNDAMENTAL CORNERSTONES of Managerial Accounting Dan L. Heitger Miami University ~ Oxford Maryanne M. Mowen Oklahoma State University ;... ^.. _ ;... Don R. Hansen Oklahoma State University THOMSON SOUTH-WESTERN
CHAPTER 3. Topics in Chapter. Analysis of Financial Statements
 CHAPTER 3 Analysis of Financial Statements 1 Topics in Chapter Ratio analysis DuPont equation Effects of improving ratios Limitations of ratio analysis Qualitative factors 2 Determinants of Intrinsic Value:
QuickBooks Integration (Enterprise)
") One Blue Hill Plaza, Second Floor, PO Box 1546 Pearl River, NY 10965 1-800-PC-AMERICA, 1-800-722-6374 (Voice) 845-920-0800 (Fax) 845-920-0880 QuickBooks Integration (Enterprise) CRE/RPE now exports sales
One Blue Hill Plaza, Second Floor, PO Box 1546 Pearl River, NY 10965 1-800-PC-AMERICA, 1-800-722-6374 (Voice) 845-920-0800 (Fax) 845-920-0880 QuickBooks Integration (Enterprise) CRE/RPE now exports sales
Business Ratios. Current Ratio
 Current Ratio Business Ratios Measures whether or not the firm has enough resources to pay its debt over the next 12 months formula: Current Ratio = Current Assets Current Liabilities Acceptable ratios
May 2017 Investor Meetings
 May 2017 Investor Meetings Safe Harbor Statement This presentation includes forward-looking statements (statements which are not historical facts) within the meaning of the Private Securities Litigation
Week-2. Dr. Ahmed. Strategic Plan
 FINC 5880 Dr. Ahmed Week-2 Name Strategic Plan Financial Plan Projected Financial Statements Additional Funds Needed (AFN, EFN, DFN) Internal and External Funding Evaluation and Control Sales Forecast
Paper P2 PERFORMANCE MANAGEMENT. Acorn Chapters
 Paper P2 PERFORMANCE MANAGEMENT Acorn Chapters 1 Relevant costing 2 Learning curve theory 3 Pricing 4 Budgeting 5 Break-even analysis (CVP analysis) 6 Activity based costing 7 Modern manufacturing techniques
Raising Your Actuarial IQ (Improving Information Quality)
") Raising Your Actuarial IQ CAS Management Educational Materials Working Party with Martin E. Ellingsworth Actuarial IQ Introduction IQ stands for Information Quality Introduction to Quality and Management
Raising Your Actuarial IQ CAS Management Educational Materials Working Party with Martin E. Ellingsworth Actuarial IQ Introduction IQ stands for Information Quality Introduction to Quality and Management
Operational Risk Management: How Emerging Best Practices Can Improve Performance
 Operational Risk Management: Enter Presentation Title Here How Emerging Best Practices Can Improve Performance Charles Taylor Director, Operational Risk RMA 1 BBC Photograph 2 Controls Failures New Business
ENGINEERING FIRM #2 SUSTAINABLE REVENUE GROWTH PRICE ADJ REV SUSTAINABLE REV NOMINAL REV
 25.00% 22.50% 2 17.50% 15.00% 12.50% 1 7.50% 5.00% 2.50% 2 15.00% 1 5.00% #1 REAL REVENUE NOMINAL REVENUE PRICE ADJUSTED REVENUE $2,500,000 () () #4 OPERATING EXPENSE CONTROL NOI$ GP$ NOI% GP% CORE OPER
The CEO s End Game: Realizing Shareholder Value
 The CEO s End Game: Realizing Shareholder Value By George Isaac, Family Business & Management Consultant You re a busy executive. Are you spending your most valuable resource -- your senior executive team
Q (Ended June 30, 2018) Conference Call. August 10, 2018
 Conference Call. August 10, 2018") Q2 2018 (Ended June 30, 2018) Conference Call August 10, 2018 Preliminary Comments Certainstatementsmadeinthispresentationareforward looking statements. These forward looking statements include, but are
Q2 2018 (Ended June 30, 2018) Conference Call August 10, 2018 Preliminary Comments Certainstatementsmadeinthispresentationareforward looking statements. These forward looking statements include, but are
All tied up MENA. Working capital management report 2017
 All tied up MENA Working capital management report 2017 Foreword All tied up MENA: working capital report 2017 is part of a series of working capital (WC) management reports based on EY research, reviewing
BATCH All Batches. DATE: MAXIMUM MARKS: 100 TIMING: 3 Hours. PAPER 3 : Cost Accounting
 BATCH All Batches DATE: 25.09.2017 MAXIMUM MARKS: 100 TIMING: 3 Hours PAPER 3 : Cost Accounting Q. No. 1 is compulsory. Wherever necessary suitable assumptions should be made by the candidates. Working
Building the Business Case for Automation
 Building the Business Case for Automation Presented by: Thomas Coyne, System Logistics Jerry Koch, Intelligrated John Hill, St. Onge Company Sponsored by: MHI s Automation 2014 MHI Copyright claimed as
Solutions to questions in Chapter 8 except those in PS4. The minimum-variance portfolio is found by applying the formula:
 Solutions to questions in Chapter 8 except those in PS4 1. The parameters of the opportunity set are: E(r S ) = 20%, E(r B ) = 12%, σ S = 30%, σ B = 15%, ρ =.10 From the standard deviations and the correlation
Chapter 23 Performance Evaluation for Decentralized Operations Study Guide Solutions Fill-in-the-Blank Equations. Exercises
 Chapter 23 Performance Evaluation for Decentralized Operations Study Guide Solutions Fill-in-the-Blank Equations 1. Service department expense 2. Income from operations 3. Profit margin 4. Invested assets
Essential reading. If maximum possible points are scored at Disclosure level, 1 Leadership point is awarded (please see % Weightings tab for details).
.") CDP 2017 climate change scoring methodology Introduction The scoring methodology provides a score which assesses progress towards environmental stewardship as reported by a company's CDP response. The
CDP 2017 climate change scoring methodology Introduction The scoring methodology provides a score which assesses progress towards environmental stewardship as reported by a company's CDP response. The
Half Year 2016 Results Presentation
 Half Year 2016 Results Presentation EYE CARE, WE CARE MORE 5 August 2016 Forward looking statements This presentation contains forward-looking statements that reflect GrandVision s current views with respect
 FINALTERM EXAMINATION Spring 2009 MGT201- Financial Management (Session - 2) Question No: 1 ( Marks: 1 ) - Please choose one What is the long-run objective of financial management? Maximize earnings per
Performance Highlights. Prepared for. MEGALO Hospitality. CLIENT Restaurant Client. Period. Jun Created on 10th June 2017
 Performance Highlights Prepared for CLIENT Restaurant Client Period Jun 2017 Created on 10th June 2017 Executive Summary OBSERVATIONS Comparing Jun 2017 with the same month last year Jun 2016. REVENUE