ANNUAL RESULTS Publication, 3 March 2015
|
|
|
- Douglas Gilmore
- 6 years ago
- Views:
Transcription
1 ANNUAL RESULTS Publication, 3 March 2015
2 Agenda Key Facts and Figures 3 Portfolio and Vacancy Rate 10 Financial Results FY Capital Structure 20 Development Sites & Projects 23 Outlook 33 Subsequent Events 35 Annex 37 PSP Swiss Property I Page 2
3 Current Market Environment Swiss market environment Strong appreciation of Swiss France expected to have negative implications on Swiss Economy in general Office rents to come slightly down on average; higher lease incentives and longer lease-up times; ongoing strong interest for high street retail space Growing supply in Zurich intensifies competition; vacancy rates are generally increasing Outskirts of main cities, peripheral regions and smaller agglomerations: pressure on rents Yields for prime assets expected to stay low due to unabated investors demand supported by the low interest environment Economic outlook for Switzerland GDP 1.7% -1.0 to +1.0% Inflation nil Unemployment 3.2% 1 Source: Consensus forecast The Economist, 24 January PSP Swiss Property I Page 3
4 Main Developments Real estate portfolio Portfolio value CHF 6.6bn (up 2.2% compared with December 2013) Stable rents across the portfolio for 2014, however with selectively more lease incentives and longer lease-up times Sale of one non-core property in Zurich for CHF 10.6m (23.7% above latest valuation) Acquisition of one commercial property in Basel for CHF 71.9m (CHF 1.15m below valuation) Vacancy and rental situation Vacancy rate of 10.0%, of which 2.8%-point due to renovations Of all 2015 maturities (CHF 26.5m), 41% renewed Expected vacancy for year-end 2015: 10% Financing Passing average interest rate on 31 December 2014 of 1.70% Low leverage with a LTV of 28.9% Majority of bank lines maturing in 2019 and 2020 PSP Swiss Property I Page 4


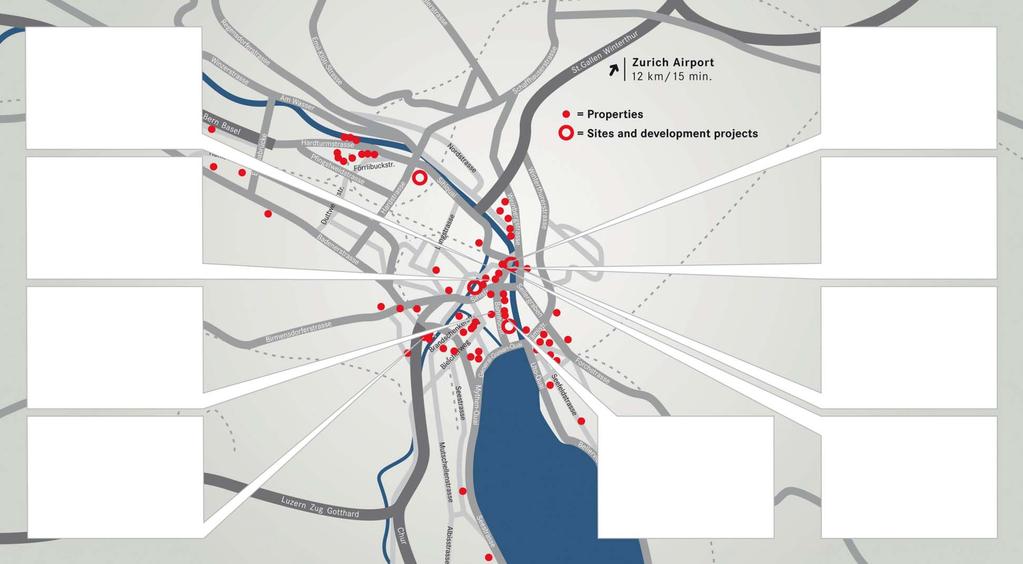
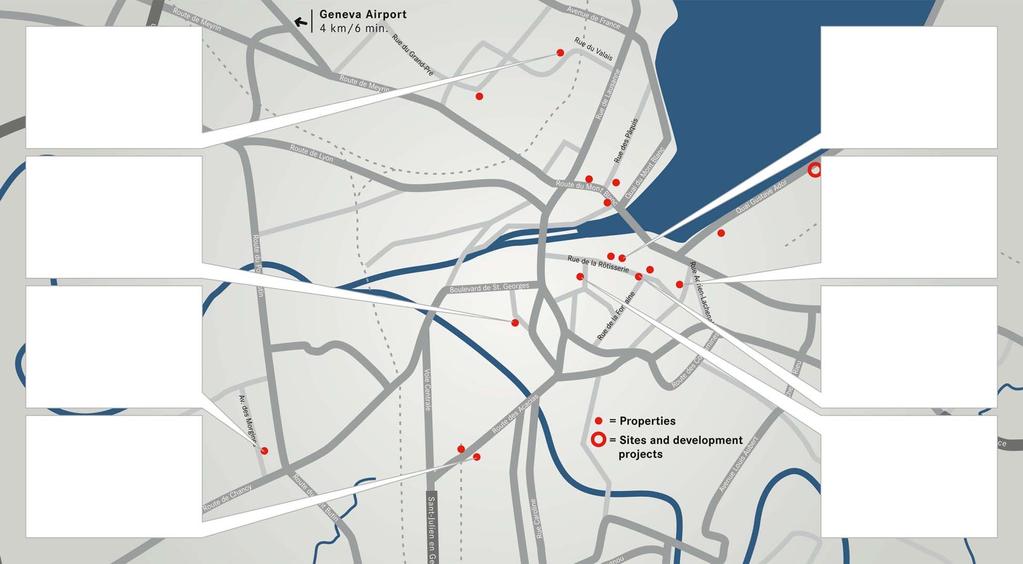
5 Property Portfolio (December 2014) Portfolio value CHF 6.6 bn 1. Zurich 59% CHF 3.9 bn 2. Geneva 13% CHF 0.9 bn 3. Basel 7% CHF 0.5 bn 4. Bern 4% CHF 0.2 bn 5. Lausanne 5% CHF 0.3 bn Other locations 5% CHF 0.3 bn Sites & development properties 7% CHF 0.4 bn In total, PSP owns and manages 161 properties and 5 sites and 5 projects. PSP Swiss Property I Page 5
6 Key Figures Consolidated, in CHF m Ebitda excl. -RE % Net income excl. -RE % Net income % ROE (net income) 9.7% 13.0% 10.6% 7.2% 4.6% Per share, in CHF EPS % EPS excl. -RE % NAV % NAV before deferred taxes % Distribution % 1 Proposal to the AGM on 1 April 2015 (cash payment from capital contribution reserves). PSP Swiss Property I Page 6
7 Per Share Distribution (in CHF) For business year * Y-t-y growth 25.0% 20.0% 10.0% 20.0% 6.0% 4.8% 9.1% 4.2% 8.0% 3.7% 7.1% 6.7% 1.6% 0.0% Payout ratio** 45.5% 52.1% 57.0% 53.6% 71.2% 76.9% 78.0% 86.3% 85.0% 82.7% 84.8% 86.5% 88.9% 85.8% 88.1% Payout yield*** 2.6% 3.9% 4.0% 3.8% 4.0% 3.7% 3.1% 4.2% 4.7% 4.6% 3.7% 3.8% 3.7% 4.3% 3.8% * Proposal to the AGM on 1 April 2015 (cash payment from capital contribution reserves). ** Payout / EPS excl. -RE. *** Payout / share-price year-end. PSP Swiss Property I Page 7

8 Share Price ( ) Source: Bloomberg, 20 February Performance since PSP SPI EPRA 160.5% 80.1% 57.3% PSP Swiss Property I Page 8
9 Agenda Key Facts and Figures 3 Portfolio and Vacancy Rate 10 Financial Results FY Capital Structure 20 Development Sites & Projects 23 Outlook 33 Subsequent Events 35 Annex 37 PSP Swiss Property I Page 9
10 Portfolio and Vacancy Rate % 10% 7 8.5% 8.3% 8.0% 8.9% 9% 6 8.0% 8% 7% 5 6% 4 5% % 3% 2% 1 1% % Real estate portfolio value in CHF bn Vacancy rate in % (CHF) Vacancy rate excl. properties reclassified to developments at the end of 2013 PSP Swiss Property I Page 10
11 Vacancy Rate (December 2014) 10% 9% 8% 1 Total: 10.0% 2.8% Thereof 1.3% Hardturmstr.161/Förrlib % Hardturmstr.181,183, % Förrlibuckstr.178/180 Total: CHF 6.2 bn ~ 0.3 bn ~ 0.6 bn 7% 6% 5% 4% 3% 2% 2 2.2% 5.0% Thereof 0.4% Bernerstr. Süd 167/ % Förrlibuckstr. 60/62 0.3% Hardturmstr.131,133, % Businesspark Wallisellen Thereof 2.6% Zurich 0.9% Geneva 0.4% Lausanne ~ 5.3 bn (86% of value vacancy 6.1%) 1% 0% Vacancy Value (CHF m) 1 Due to renovation 2 Zurich West / Businesspark Wallisellen PSP Swiss Property I Page 11
12 Expiry Profile of Leases (December 2014) (Legal termination option by tenants) 25% 20% 21% 15% 15% 10% 5% 0% 11% 12% 11% 10% 8% 4% 3% 2% 2% 1% NL Of all 2015 maturities (CHF 26.5 m), 41% are renewed as per end of December % open NL: Contracts not limited in time, but subject to notice PSP Swiss Property I Page 12
13 Agenda Key Facts and Figures 3 Portfolio and Vacancy Rate 10 Financial Results FY Capital Structure 20 Development Sites & Projects 23 Outlook 33 Subsequent Events 35 Annex 37 PSP Swiss Property I Page 13
14 Consolidated Income (CHF 1 000) Rental income % 2 Valuation gains Property sales (inventories) Property sales (portfolio) Income from associated companies Capitalised own services Other income Total operating income % 1 Restated, initial application of IAS 19 (revised). 6 Of which CHF 3.8m VAT-opting-in effect. 2 Like-for-like rental growth was 0.2%. 7 Of which CHF 2.9m VAT-opting-in effect. 3 Of which CHF 43.1m first time adoption of IFRS Of which CHF 3.3m VAT-opting-in effect. 4 Of which CHF 4.9m VAT-opting-in effect. 5 Of which CHF 6.3m VAT-opting-in effect. PSP Swiss Property I Page 14
15 Consolidated Expenses (CHF 1 000) Properties opex % Properties maintenance/renovation % Personnel expenses % Fees to subcontractors General and administrative expenses % Impairment properties Depreciation Total operating expenses % 1 Restated, initial application of IAS 19 (revised). PSP Swiss Property I Page 15
16 Consolidated Results (CHF 1 000) Profit before financial expenses % Net financial expenses % Profit before taxes % Taxes % Net income continuing operations % Net income discontinued operations Net income % Net income excl. -RE % 1 Restated, initial application of IAS 19 (revised). PSP Swiss Property I Page 16
17 Changes in Fair Value (December 2014) (CHF m) Existing portfolio Acquisitions / first-time valuation Total net changes in fair value From the acquisition of a single property (Zurich, Seestrasse 353). 2 From the acquisition of a single property (Locarno, Via Respini 7/9, spa development project). 3 Of which CHF 43.1 m from first time adoption IFRS From the acquisition of a single property (Geneva/Cologny, Port Noir, spa development project). 5 From the acquisition of a single property (Basle, Peter Merian-Str. 88/90). PSP Swiss Property I Page 17
18 Changes in Fair Value: Discount Rates (Dec. 2014) Nominal Discount Rate Area Minimum Maximum Weighted Ø Zurich 3.9% 6.1% 4.8% Geneva 4.3% 5.4% 4.8% Basel, Bern 4.2% 5.3% 4.8% Lausanne 4.3% 5.9% 4.9% Other locations 4.6% 6.1% 5.4% All areas 3.9% 6.1% 4.8%* Weighted Ø discount rate 5.72%** 5.44%* 5.25%* 5.03%* 4.91%* 4.81%* * Nominal discount rate includes 1.0% annual inflation. ** Nominal discount rate includes 1.2% annual inflation. Valuation done by Wüest & Partner PSP Swiss Property I Page 18
19 Agenda Key Facts and Figures 3 Portfolio and Vacancy Rate 10 Financial Results FY Capital Structure 20 Development Sites & Projects 23 Outlook 33 Subsequent Events 35 Annex 37 PSP Swiss Property I Page 19
20 Debt Diversified and stable lender portfolio 9 domestic banks and 1 syndicated loan (with 14 Swiss Cantonal banks) High visibility on debt maturity profile Majority of bank lines maturing between 2019 and 2020, with average maturity of loans: 4.6 years All loan agreements based on multi-year committed credit lines with rollover clauses New bond issue 10yr 1% CHF100m bond due on 02/2025 CHF 690m unused committed credit lines as per today Rating: A-, Stable outlook Fitch Ratings affirmed (March 2014) PSP s Senior Unsecured Rating at A- with stable outlook PSP Swiss Property I Page 20
21 Capital Structure Money values in CHF m Shareholders equity % - % of total assets 52.7% 54.0% 58.1% 58.7% 57.5% Deferred tax liabilities (net) % of total assets 9.2% 9.9% 10.5% 10.9% 10.9% Interest-bearing debt % - % of total assets 35.7% 32.2% 28.4% 28.1% 28.9% - Loans, unsecured Bonds % long-term 97.5% 83.8% 91.7% 86.4% 100.0% Net financial expenses Ø interest rate 2.58% 2.56% 2.37% 1.95% 1.76% 1 Interest coverage ratio 4.8 x 5.3 x 6.4 x 7.9 x 7.8 x Fixed interest rate > 1 year 92.0% 82.0% 85.6% 77.2% 83.9% Ø fixed-interest period in years Reflects the average interest rate over the past four quarters. As per 31 December 2014, the passing rate was 1.70 % (end of 2013: 1.85%). PSP Swiss Property I Page 21
22 Agenda Key Facts and Figures 3 Portfolio and Vacancy Rate 10 Financial Results FY Capital Structure 20 Development Sites & Projects 23 Outlook 33 Subsequent Events 35 Annex 37 PSP Swiss Property I Page 22
 and 16 000 m 2 residential area (113 freehold apartments, 36")

23 «Salmenpark» Rheinfelden Stage 1 under construction (since August 2013) Conversion of existing site (former brewery) and new buildings; mixed use: m 2 commercial area (office, commerce and seniors residence) and m 2 residential area (113 freehold apartments, 36 apartments for rent) As per 31 Dec. 2014: 45% of the commercial area and 13 apartments let; 46 freehold apartments sold Investment sum approx. CHF m; thereof CHF 67.1 m spent at year-end 2014 (investment sum stage 1 and 2 approx. CHF 250 m) Completion: 2016 PSP Swiss Property I Page 23


24 «Salmenpark» Rheinfelden (cont.) November 2014 PSP Swiss Property I Page 24
 Conversion of existing site and new buildings, 100%")

25 Project «Health Spa Genève Plage» Geneva/Cologny Under construction (since June 2013) Conversion of existing site and new buildings, 100% let Planned investment sum approx. CHF 30 m; thereof CHF 11.4 m spent at year-end 2014 Completion: end of 2015 PSP Swiss Property I Page 25
 As per 31 Dec.")

26 Project «Löwenstrasse» Zurich Under construction (since June 2013) New building with mixed use (office and retail, one apartment) As per 31 Dec : 3 rd floor and apartment (4 th floor) let Planned investment sum approx. CHF 6.1 m; thereof CHF 5.1 m spent at year-end 2014 Completion: Q Architektur: Züst Gübeli Gambetti / Bild: Valentin Jeck. PSP Swiss Property I Page 26
 Mixed use (18 000 m 2, office and hotel) LEED Gold, Swiss")

27 Project «Grosspeter Tower» Basel Under construction (since Nov. 2014) Mixed use ( m 2, office and hotel) LEED Gold, Swiss Minergie, zero-emission operation Investment sum approx. CHF 115 m; thereof CHF 12.3 m spent at year-end 2014 Completion: end of 2016 PSP Swiss Property I Page 27
, in particular infrastructure and technical installations Overall investment sum approx. CHF 77.")
; thereof CHF 0.")
28 Project «Bahnhofquai / Bahnhofplatz» Zurich Under renovation (since April 2014) Total renovation (3 stages) of four existing buildings (all part of the same block ), in particular infrastructure and technical installations Overall investment sum approx. CHF 77.5 m, thereof: - Stage 1: Bahnhofquai 9/11/15 and Bahnhofplatz 1 CHF 33 m (construction ); thereof CHF 4.1 m spent at year-end Stage 2: Waisenhausstr. 2, 4 / Bahnhofquai 7 CHF 33 m (end of ); thereof CHF 0.5 m spent at year-end Stage 3: Bahnhofplatz 2 CHF 11.5 m (presumably ) PSP Swiss Property I Page 28
 Total renovation, in particular technical installations As per 31")

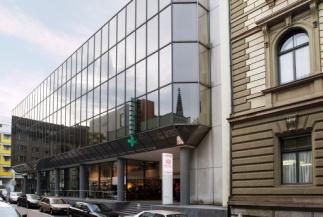
29 Project «Bahnhofstrasse 10 / Börsenstrasse 18» Zurich Under renovation (since June 2013) Total renovation, in particular technical installations As per 31 Dec. 2014: 80% pre-let (retail space) Investment sum approx. CHF 15 m; thereof CHF 3.3 m spent at year-end Completion: summer 2015 PSP Swiss Property I Page 29

 B2 Förrlibuckstr.")
30 Project «Zurich West» Zurich Under evaluation A Hardturmstr. 161 (Complete re-development) B1 Hardturmstr. 181/183/185 (New building) B2 Förrlibuckstr. 178/180 (New building) PSP Swiss Property I Page 30
31 Capex Overview (CHF m) Expected Paradiso site, Lugano Gurten site, Wabern/Bern Salmenpark, Rheinfelden Grosspeter Tower, Basel Genève Plage, Cologny Bahnhofquai/-platz, Zurich Total development sites thereof committed n.a. n.a. Total investment portfolio n.a. n.a. 1 In construction. 2 In planning. PSP Swiss Property I Page 31
32 Agenda Key Facts and Figures 3 Portfolio and Vacancy Rate 10 Financial Results FY Capital Structure 20 Development Sites & Projects 23 Outlook 33 Subsequent Events 35 Annex 37 PSP Swiss Property I Page 32
33 Outlook 2015 Consolidated Ebitda excl. -RE CHF 225 m Vacancy rate portfolio (year-end) 10% PSP Swiss Property I Page 33
34 Agenda Key Facts and Figures 3 Portfolio and Vacancy Rate 10 Financial Results FY Capital Structure 20 Development Sites & Projects 23 Outlook 33 Subsequent Events 35 Annex 37 PSP Swiss Property I Page 34
35 Subsequent Events Bond issue on 6 February 2015 CHF 100 m, 1.0%, PSP Swiss Property I Page 35
36 Agenda Key Facts and Figures 3 Portfolio and Vacancy Rate 10 Financial Results FY Capital Structure 20 Development Sites & Projects 23 Outlook 33 Subsequent Events 35 Annex 37 PSP Swiss Property I Page 36
37 Board of Directors and Executive Board Board of Directors Günther Gose, 1944, Chairman Luciano Gabriel, 1953, Delegate and CEO Peter Forstmoser, 1943, Member Adrian Dudle, 1965, Member Nathan Hetz, 1952, Member Gino Pfister, 1942, Member Josef Stadler, 1963, Member Aviram Wertheim, 1958, Member Executive Board Luciano Gabriel, 1953, CEO Giacomo Balzarini, 1968, CFO Ludwig Reinsperger, 1961, CIO PSP Swiss Property I Page 37
38 Group Overview (December 2014) Executive Board (3) Legal unit (4) HR/Services (5) Secretarial (1) Real Estate Investments Property Management Finance, Administration Asset Management (5) Zurich Office (14) Accounting (11) Lettings (2) Olten Office (7) Communication (2) Analysis/Reporting (2) Geneva Office (8) Treasury (1) Construction Services (13) IT (5) Total number of employees: 83 (FTE: 78) PSP Swiss Property I Page 38
39 PSP Strategy Strategy Switzerland only Commercial properties only Acquisitions to be justified by price and operational logic Risk-conscious financing policy Priority Optimising profitability of existing portfolio Ensuring long term attractiveness of assets Organic growth Develop sites in the Portfolio (all former breweries) Repositioning of assets to best use Assessing acquisition opportunities and corporate deals PSP Swiss Property I Page 39
40 Why Investing in PSP? Company Premium portfolio with limited downside risk Transparent business model Pure Swiss play Properties with further optimisation potential Financial flexibility to take advantage of market opportunities Acquisition/integration experience Sustainability oriented (ecological, economic, social) Share Liquid stock Attractive payout yield Broadly diversified shareholder structure PSP Swiss Property I Page 40
41 Shareholder Base Largest shareholders (31 December 2014) Alony Hetz: 12.21% BlackRock, Inc.: 5.08% 1 Three Nominees: 4.22%, 3.36% resp. 3.07% UBS Fund Management (Switzerland) AG: 3.02% 2 Number of registered shareholders: Individuals: (11% of registered shares) - Legal entities: 584 (89% of registered shares) Non registered, 30% CH, 39% 1 As per notification 13 December As per notification 13 November Other, 5% Rest of Europe, 1% France / BeNeLux, 4% UK, 9% Israel, 12% PSP Swiss Property I Page 41
42 Ebitda % 81.5% 81.0% 81.3% 81.8% 85% % % % % % % % Ebitda excl. -RE in CHF m Ebitda margin in % PSP Swiss Property I Page 42
43 Net Income Components Net income excl. -RE in CHF m Contribution of -RE in CHF m PSP Swiss Property I Page 43
44 EPS EPS in CHF EPS excl. -RE in CHF PSP Swiss Property I Page 44
45 NAV + Cumulative Dividend per Share NAV per share in CHF Payout in CHF, cumulative (allocation according to payment date) PSP Swiss Property I Page 45
46 NAV vs. Share Price NAV per share in CHF Share price in CHF PSP Swiss Property I Page 46
47 EPRA Performance Measures 2013 H (CHF or %) EPRA PSP EPRA PSP EPRA PSP A. EPS B. NAV C. NNNAV D. Net yield 4.1% 3.9% 4.1% 3.9% 4.0% 3.9% E. Vacancy rate 7.5% 8.0% 8.4% 9.1% 9.1% 10.0% F. Cost ratio % 15.1% 17.5% 14.6% 17.7% 14.7% G. Like-for-like rental change 1.7% n.a % n.a. 0.2% n.a. H. Cap ex in CHF n.a n.a n.a. 1 Excl. direct vacancy costs. PSP Swiss Property I Page 47
48 Portfolio Key Figures Numbers of properties Rental income in CHF m Revaluation in CHF m Value in CHF m Net yield in % Vacancy in % Zurich Geneva Basel Bern Lausanne Others Sites n.a. n.a n.a. n.a. Total PSP Swiss Property I Page 48
49 Portfolio Value by Area Sites and developement properties, 7% Other locations, 5% Lausanne, 5% Bern, 4% Basel, 7% Zurich, 59% Geneva, 13% PSP Swiss Property I Page 49
50 Rent by Use Other, 10% Gastronomy, 4% Parking, 6% Retail, 15% Office, 65% PSP Swiss Property I Page 50
51 Rent by Type of Tenants Other, 16% Retail, 23% Government, 6% Gastronomy, 7% Financial Services, 9% Services, 17% Technology, 10% Telecommunication, 12% PSP Swiss Property I Page 51
52 Largest Tenants Swisscom, 10% Google, 5% JT International, 3% Roche, 3% Swiss Post, 2% Next five largest, 9% Other, 68% PSP Swiss Property I Page 52
53 Sustainability Ecological sustainability Energy consumption (kwh) Water consumption (m 3 ) CO 2 (heating and electricity) output (t resp. kg) Economic sustainability Long-term oriented business and investment policy Quality- and value-oriented portfolio management Long-term oriented and balanced financing policy Social sustainability (main stakeholders) Employees Clients and suppliers Public PSP Swiss Property I Page 53
54 Ecological Sustainability Organisation Operational responsibility: 3 employees (1 asset management, 2 construction services) Implementation: construction services, property management, facility management Environmental key figures (specific figure/m 2 ) in 2014 (2013) Heating in kwh: 73.6 (87.0) Electricity in kwh: 26.0 (26.8) CO 2 -eq output (heating and electricity) in kg: 17.1 (19.9 ) Water consumption in m 3 : 0.55 (0.56) PSP Swiss Property I Page 54

55 Portfolio Grid Source: Wüest & Partner, December PSP Swiss Property I Page 55


56 Zurich Area Bahnhofplatz 9 Bahnhofplatz 1 Bahnhofstr. 81 Bahnhofplatz 2 Bahnhofstr. 39 Bahnhofquai 9, 11, 15 Brandschenkestr. 90 Bahnhofstr. 28a Uraniastr. 9 PSP Swiss Property I Page 56


57 Geneva Area Rue Richard-Wagner 6 Palace du Molard 7 Rue des Bains 31-33/35 Cours de Rive 13/15 Av. des Morgines 8-10 Rue de la Fontaine 5 Rue de la Gabelle 6 Rue de la Corraterie 24/26 PSP Swiss Property I Page 57


58 Basel Area Marktplatz 30/30a Freie Strasse 38 Barfüsserplatz 10 St. Alban-Anlage 46 Steinentorberg 8/12 Grosspeterstr. 18/20 Kirschgartenstr Dornacherstr. 210 PSP Swiss Property I Page 58


59 Bern Area Bollwerk 15 Zeughausgasse 26/28 Laupenstrasse 18/18a Kramgasse 49 Seilerstrasse 8 Kramgasse 78 Eigerstrasse 2 Spitalgasse 9 PSP Swiss Property I Page 59


60 Lausanne Area Rue de Sébeillon 2 Rue du Pont 22 Avenue de Sévelin 54 Rue Saint Martin 7 Avenue de Sévelin 40 Place Saint-François 5 Avenue de Cour 135 Place Saint-François 15 PSP Swiss Property I Page 60


61 Selected Properties Zurich Zurich, Bahnhofplatz 1 Zurich, Bahnhofquai 9, 11, 15 Zurich, B hofstr. 28a/Waagg. 6 rentable area: m 2 rentable area: m 2 rentable area: m 2 Zurich, B hofstr. 81/Schw.g. 2/4 rentable area: m 2 Zurich, Binzring 15/17 Zurich, Brandschenkestr. 90 Zurich, Brandschenkestr. 110 Zurich, Förrlibuckstr. 181 rentable area: m 2 rentable area: m 2 rentable area: m 2 rentable area: m 2 Zurich, Schaffhauserstr. 611 Zurich, Uraniastr. 9 Zurich, Waisenhausstr. 2/4 Wallisellen, Richtistr. 3 rentable area: m 2 rentable area: m 2 rentable area: m 2 rentable area: m 2 PSP Swiss Property I Page 61


62 Selected Properties Geneva Carouge-GE, Rte d. Acacias rentable area: m 2 Carouge-GE, Rue de la Gabelle 6 rentable area: m 2 Geneva, Cours de Rive 13, 15 rentable area: m 2 Geneva, Place du Molard 7 rentable area: m 2 Geneva, Rue d. Bains 31bis,33,35 rentable area: m2 Geneva, Rue de Berne 6 rentable area: m 2 Geneva, Rue de la Corraterie 24/26 rentable area: m 2 Geneva, Rue de la Fontaine 5 rentable area: m 2 Geneva, Rue du Marché 40 rentable area: m 2 Geneva, Rue F. Bonivard 12 rentable area: m 2 Geneva, Rue Richard-Wagner 6 rentable area: m 2 Lancy, Avenue des Morgines 8-10 rentable area: m 2 PSP Swiss Property I Page 62


63 Selected Properties Basel & Bern Basel, Barfüsserplatz 10 rentable area: m 2 Basel, Falknerstrasse 31 rentable area: m 2 Basel, Freie Strasse 38 rentable area: m 2 Basel, Grosspeterstrasse 18, 20 rentable area: m 2 Basel, Kirschgartenstrasse rentable area: m 2 Basel, St. Alban-Anlage 46 rentable area: m 2 Bern, Bollwerk 15 rentable area: m 2 Bern, Eigerstrasse 2 rentable area: m 2 Bern, Laupenstrasse 18/18a rentable area: m 2 Bern, Seilerstrasse 8 rentable area: m 2 Bern, Spitalgasse 9 rentable area: m 2 Bern, Zeughausgasse 26/28 rentable area: m 2 PSP Swiss Property I Page 63


64 Selected Properties Lausanne & Others Lausanne, Place St-François 5 rentable area: m 2 Lausanne, Rue du Sébeillon 1, 3, 5 rentable area: m 2 Lausanne, Rue du Grand-Chêne 2 Lausanne, Rue du Pont 22 rentable area: m 2 rentable area: m 2 Lausanne, Saint-Martin 7 rentable area: m 2 Aarau, Bahnhofstrasse 29/33 rentable area: m 2 Fribourg, Av. de Beauregard 1 rentable area: m 2 Fribourg, Rte des Arsenaux 41 rentable area: m 2 Luzern, Maihofstrasse 1 rentable area: m 2 Winterthur, Marktgasse 74 rentable area: m 2 Winterthur, Untertor 34 rentable area: 719 m 2 Zug, Kolinplatz 2 rentable area: m 2 PSP Swiss Property I Page 64
65 Contacts Luciano Gabriel CEO Phone +41 (0) Mobile +41 (0) Giacomo Balzarini CFO Phone +41 (0) Mobile +41 (0) Vasco Cecchini Corporate Communications Phone +41 (0) Mobile +41 (0) PSP Swiss Property I Page 65
66 Disclaimer None of the information in this presentation constitutes an offer of securities for sale in the United States. Securities may not be offered or sold in the United States absent registration or an exemption from registration. None of the securities of the Company referred to in this presentation have been or will be registered under the United States Securities Act of 1933, as amended (the "Securities Act"), or under the applicable securities laws of any state or other jurisdiction of the United States. PSP Swiss Property I Page 66
Q1 RESULTS Publication, 12 May 2015
 Q1 RESULTS Publication, 12 May 2015 Agenda Key Facts and Figures 3 Financial Results Q1 2015 7 Portfolio and Vacancy Rate 14 Capital Structure 20 Development Sites & Projects 23 Outlook 33 Subsequent Events
ANNUAL RESULTS 28 February 2014
 ANNUAL RESULTS 28 February 2014 Agenda Key Facts and Figures 3 Portfolio and Vacancy Rate 10 Financial Results 2013 14 Capital Structure 22 Development Sites 25 Subsequent Events 37 Outlook 39 Annex 41
Q1-3 RESULTS November 2012 COMPETENCE IN SWISS REAL ESTATE
 Q1-3 RESULTS 2012 13 November 2012 COMPETENCE IN SWISS REAL ESTATE AGENDA Key Facts and Figures 3 Portfolio and Vacancy Rate 10 Financial Results Q1-3 2012 14 Capital Structure 22 Development Sites 25
H1 RESULTS. 18 August 2017
 H1 RESULTS 18 August 2017 Agenda Key Facts and Figures 3 Financial Results H1 2017 7 Portfolio and Vacancy Rate 14 Capital Structure 20 Development Sites and Projects 23 Subsequent Events 36 Outlook 38
Q1-Q3 RESULTS. 14 November 2017
 Q1-Q3 RESULTS 14 November 2017 Agenda Key Facts and Figures 3 Financial Results Q1-Q3 2017 7 Portfolio and Vacancy Rate 14 Capital Structure 20 Development Sites and Projects 23 Outlook 37 Annex 39 PSP
ANNUAL RESULTS. 27 February 2018
 ANNUAL RESULTS 27 February 2018 Agenda Key Facts and Figures 3 Financial Results FY 2017 7 Portfolio and Vacancy Rate 14 Capital Structure 20 Development Sites and Projects 23 Subsequent Events 38 Outlook
Q1 RESULTS. 8 May 2018
 Q1 RESULTS 8 May 2018 Agenda Key Facts and Figures 3 Financial Results Q1 2018 7 Portfolio and Vacancy Rate 14 Capital Structure 20 Development Sites and Projects 23 Subsequent Events 35 Outlook 37 Annex
H1 RESULTS August 2018
 H1 RESULTS2018 17 August 2018 Agenda Key Facts and Figures 3 Financial Results H1 2018 7 Portfolio and Vacancy Rate 14 Capital Structure 20 Development Sites and Projects 23 Subsequent Events 35 Outlook
Short Version. Report
 Short Version Annual Report 2015 2 PSP Swiss Property Short Version 2015 Key figures Key financial figures (in CHF 1 000) 2014 2015 Change 1 Rental income 277 150 275 063 0.8 % EPRA like-for-like change
Quarterly report Q1 Short report
 2018 Quarterly report Q1 Short report 2 PSP Swiss Property Short report Q1 2018 Key figures Key financial figures Unit 2017 1 Q1 2017 1 Q1 2018 +/ 2 Rental income CHF 1 000 272 454 68 375 69 123 1.1 %
Additional information Financial statements Overview. Half-year report H1
 2017 Half-year report H1 Additional information Financial statements Overview 2 3 Contents 4 Key figures 6 H1 2017 report 10 Portfolio summary 17 Financial statements Charts/tables Due to roundings, certain
Quarterly report Q1 Q3. Short report
 2017 Quarterly report Q1 Q3 Short report 2 PSP Swiss Property Short report Q1 Q3 2017 Key figures Key financial figures Unit 2016 Q3 2016 Q3 2017 Q1 Q3 2016 Q1 Q3 2017 +/ 1 Rental income CHF 1 000 276
Press release. Quarterly results as per 30 September 2018
 Press release 13 November 2018 Quarterly results as per 30 September 2018 PSP Swiss Property with successful letting activities. The vacancy guidance as per year-end 2018 has been improved to 5%. The ebitda
Quarterly Report Q1 Q3
 Quarterly Report Q1 Q3 2015 2 Key figures Key figures Key financial figures Unit 1 January to 31 Dec. 2014 1 July to 30 Sept. 2014 1 July to 30 Sept. 2015 1 January to 30 Sept. 2014 1 January to 30 Sept.
Quarterly report Q1 Q3
 2017 Quarterly report Q1 Q3 Additional information Financial statements Overview 2 3 Contents 4 Key figures 6 Q1 Q3 2017 report 10 Portfolio summary 17 Financial statements Charts/tables Due to roundings,
Quarterly report Q1 2014
 Quarterly Report Q1 2014 2 Key figures Key figures 1 January to 1 January to 1 January to Key financial figures Unit 31 Dec. 2013 31 March 2013 31 March 2014 Change 1 Rental income CHF 1 000 279 143 67
Industry Newsletter SWISS PROPERTY SUCCESS STORY LUCIANO GABRIEL CEO, PSP SWISS PROPERTY EUROPEAN PUBLIC REAL ESTATE ASSOCIATION ISSUE 54 MAY 2016
 EUROPEAN PUBLIC REAL ESTATE ASSOCIATION Industry Newsletter ISSUE 54 MAY 2016 Download the full EPRA Industry Newsletter at www.epra.com/newsroom/epra-articles/ SWISS PROPERTY SUCCESS STORY LUCIANO GABRIEL
HALF-YEAR 2018 RESULTS IR-PRESENTATION 30 AUGUST 2018
 HALF-YEAR 2018 RESULTS IR-PRESENTATION 30 AUGUST 2018 1 Disclaimer This communication contains specific forward-looking statements, beliefs or opinions, including statements with respect to objectives,
PSP Management Ltd Property Management. SIX Swiss Exchange, Zurich Market capitalisation 31 December 2014 PSP shares held by subsidiaries 0 %
 116 This report follows the Directive of 1 September 2014 of the SIX Exchange Regulation on Information relating to ( DCG ). 1 Group structure and shareholders 1.1 Group structure* PSP Swiss Property Ltd
CAPITAL MARKETS DAY 2017 ZURICH, 25 OCTOBER 2017
 CAPITAL MARKETS DAY 2017 ZURICH, 25 OCTOBER 2017 Welcome address Today s Agenda Swiss Prime Site Capital Markets Day 2017 10.00 11.00 Management presentations René Zahnd (CEO Swiss Prime Site) & Peter
2008 Results and Outlook
 VZ Group VZ Holding Ltd Beethovenstrasse 24 CH-8002 Zurich Telephone: +41 44 207 27 27 Fax: +41 44 207 27 28 vermoegenszentrum.ch vzonline.ch 2008 Results and Outlook Aarau Basle Berne Frankfurt Geneva
HIAG Immobilien Half-Year Results September HIAG Immobilien, 5 September
 Half-Year Results 206 5 September 206, 5 September 206 Disclaimer The financial data as well as the other information presented herein constitute selected information. The information in this presentation
SEMI-ANNUAL 2017 RESULTS ZURICH, 24 AUGUST 2017
 SEMI-ANNUAL 2017 RESULTS ZURICH, 24 AUGUST 2017 1 2 3 4 Welcome address H1 2017 highlights Key financial data for H1 2017 Outlook Hans Peter Wehrli René Zahnd Markus Meier René Zahnd 2 Welcome address
Press release. Mobimo achieves 2018 half-year results in line with expectations
 Press release Mobimo achieves 2018 half-year results in line with expectations Mobimo achieved solid half-year results, with profit of CHF 37.9 million. As expected this was lower than in the previous
Presentation Results. Semi-annual. Züblin Group Semi-annual results 2013_2014
 Presentation Semi-annual Results 2013-2014 1 Agenda > Facts > Portfolio overview > Non-strategic portfolio > Renovation projects > Financials > Corporate Governance > Outlook 2 Facts 3 Facts 2013/2014
1H 2011 Results and Outlook
 VZ Holding Ltd Beethovenstrasse 24 CH-8002 Zurich Telephone: +41 44 207 27 27 Fax: +41 44 207 27 28 vermoegenszentrum.ch vzfinanzportal.ch VZ Group 1H 2011 Results and Outlook Zurich, 18 August 2011 Disclaimer
HIAG Immobilien Holding AG Half-Year September 2018
 Immobilien Holding AG Half-Year 208 3 September 208, 03.09.208 Disclaimer The financial data as well as the other information presented herein constitute selected information. The information in this presentation
Sustainable Investments. With CS REF Green Property.
 Public Sustainable Investments. With CS REF Green Property. Credit Suisse Asset Management (Switzerland) Ltd. Global Real Estate Switzerland October 2017 Credit Suisse Real Estate Fund Green Property Key
2010 Results and Outlook
 VZ Holding Ltd Beethovenstrasse 24 CH-8002 Zurich Telephone: +41 44 207 27 27 Fax: +41 44 207 27 28 vermoegenszentrum.ch vzonline.ch VZ Group 2010 Results and Outlook Zurich, 8 March 2011 Disclaimer Forward-looking
2017 ANNUAL RESULTS ZURICH, 1 MARCH 2018
 2017 ANNUAL RESULTS ZURICH, 1 MARCH 2018 1 2 3 4 Welcome address 2017 highlights Key metrics for 2017 Outlook Zurich 1 March 2018 2017 results 2 Welcome address Successful performance in 2017 Operating
Full-year results 2013
 Full-year results 03 03.03.4 Page Cautionary statement regarding forwardlooking statements This presentation by AG ( the Bank ) includes forward-looking statements that reflect the Bank s intentions, beliefs
2017 Annual Results. 12 March la foncière parisienne
 2017 Annual Results 12 March 2018 Content I. Introduction II. Portfolio III. Rental business IV. Financial results V. Outlook 2 2017 key figures EPRA liquidation NAV Rental income strategic assets (Offices
2013 Half-year Report Shortform
 2013 Half-year Report Shortform Sound results reported for first half of 2013 Stable rental income and gratifying net yield Continued increase of project volume Favourable financing Confirmation of expectations
ADDITIONAL INFORMATION
 SEMI-ANNUAL REPORT ADDITIONAL INFORMATION PRIME TIMES Our «Prime Times» magazine August 2015 edition features a summary of results and trends in the first half-year 2015, starting from page 33. The publication
Friendly takeover bid to the shareholders of Immobiliengesellschaft Fadmatt AG
 Friendly takeover bid to the shareholders of Immobiliengesellschaft Fadmatt AG Mobimo s motivation for the offer Good quality of locations: The Immobiliengesellschaft Fadmatt AG owns 503 apartments spread
HIAG Immobilien Holding AG Martin Durchschlag, CEO. Investora September 2017
 Immobilien Holding AG Martin Durchschlag, CEO Investora 207 20 September 207, 08.09.207 Disclaimer The financial data as well as the other information presented herein constitute selected information.
Swiss Prime Site reports record values for property portfolio and operating income
 MEDIA RELEASE Olten, 2 March 2017 Swiss Prime Site reports record values for property portfolio and operating income Real estate portfolio expands to over CHF 10 billion Operating income exceeds CHF 1
Investor presentation H results
 Investor presentation H1 2011 results Recent highlights New lettings in Belgian and US office portfolio. Occupancy rate improving Heads of terms agreed for hotel in Eilan-project: 20 yr fixed lease, operator
We are driven to design sustainable living spaces Seehallen, Horgen
 Half-Year Report 2018 We are driven to design sustainable living spaces Seehallen, Horgen www.seehallen.ch Selected key figures for the first half of 2018 Mobimo recorded a solid result in the first half
Investor Presentation
 Investor Presentation Urs Leinhäuser, Chief Financial Officer & Deputy CEO, January 2014 Agenda Who is Autoneum? / Positioning Highlights of HY1 2013 Industry and strategic priorities Mid term financial
9M 2018 RESULTS 09 NOVEMBER 2018 TLG IMMOBILIEN AG 9M 2018 RESULTS
 TLG IMMOBILIEN AG 9M 208 RESULTS DISCLAIMER This presentation includes statements, estimates, opinions and projections with respect to anticipated future performance of TLG IMMOBILIEN ("Forward-Looking
Press Release. Züblin concentrates on Germany and France. Zurich, 15 May 2014
 Press Release Zurich, 15 May 2014 Züblin concentrates on Germany and France Züblin ended the financial year 2013/2014 with another substantial loss of CHF 64 million (2012/2013: loss of CHF 89 million).
Half-year Report 2003
 Half-year Report 2003 Key figures at a glance 1 st half-year 2003 1 st half-year 2002 Change resp. 30.06.2003* resp. 31.12.2002* in % Allreal Group Total income incl. revaluation gains CHF million 82.0
Q HIGHLIGHTS MEUR MEUR % MEUR MEUR 48.4 MEUR 94.8 MEUR % 1.87% +2.2% +1.9 PP +3.5% +73.8% + >100% +19.9% +81.
 Q1-2 2018 HIGHLIGHTS STRENGTHENED OPERATING PERFORMANCE Occupancy rate 94.7% Rental income MEUR 119.0 Rental income lfl MEUR 98.2 +1.9 PP +3.5% +2.2% KPIs SIGNIFICANTLY IMPROVED Results of AM MEUR 94.8
swiss prime as at 30 June 2008
 swiss prime report insightsemi-annual as at 30 June 2008 Contents 1 Swiss Prime Insight as at 30 June 2008 Summary of the key figures 2 Valuation expert s report 9 Financial commentary 15 Consolidated
Investor presentation 9M 2012 results
 Investor presentation 9M 2012 results Key results: stabilising in Q3 Direct result p/s: 3.05 (-17.6% yoy) Q3: + 0.01 vs Q2 Revaluation portfolio: -4.75% Q3: -0.25% NAV p/s: 63.72 (-12.9% yoy) Q3: +0.4%
1H 2008 Results and Outlook
 VZ Group VZ Holding Ltd Beethovenstrasse 24 CH-8002 Zurich Telephone: +41 44 207 27 27 Fax: +41 44 207 27 28 vermoegenszentrum.ch vzonline.ch 1H 2008 Results and Outlook Aarau Basle Berne Frankfurt Geneva
ANNUAL RESULTS 2015 MARCH 22, 2016
 ANNUAL RESULTS 2015 MARCH 22, 2016 01 OVERVIEW & INVESTMENT HIGHLIGHTS Overview ADO the pure-play Berlin residential specialist Investment highlights 1 2 3 4 Berlin residential pure play with a 1.5bn quality
Swiss Equities Conference 2016
 Swiss Equities Conference 206 4 January 206 Page Cautionary statement regarding forwardlooking statements This presentation by AG ( the Bank ) includes forward-looking statements that reflect the Bank
2011 first-half earnings
 2011 first-half earnings Bernard Michel Non-executive chairman Christophe Clamageran Chief executive officer Gilles Bonnier Chief financial officer Paris, July 27, 2011 H1 2011 snapshot in mn June 30,
MEDIA RELEASE. 31 August 2009 For immediate publication. Profitable growth maintained. Interim report as at 30 June 2009
 NOT FOR RELEASE, PUBLICATION OR DISTRIBUTION IN WHOLE OR IN PART, IN, INTO OR FROM THE UNITED STATES, CANADA OR AUSTRALIA OR ANY OTHER JURISDICTION WHERE TO DO SO WOULD CONSTITUTE A VIOLATION OF THE RELEVANT
Valiant investor presentation
 Valiant investor presentation Baader Helvea Swiss Equities Conference Bad Ragaz 12 January 2018 Our key messages 100% Focus on retail banking 100% focus on retail and SME banking in Switzerland Very high
Investor presentation, March 20th 2018
 Investor presentation, March 20th 2018 Another year of strong results 2017 ANNUAL RESULTS BKW 20.03.2018 2 Growth achieved on all levels: revenue +5%, operating profit +10% and net profit +16% Strong operating
Investment property Rental apartments. Opfikon-Glattpark Farmanstrasse
 A n n u a l R e p o r t 2 0 1 0 Investment property Rental apartments Opfikon-Glattpark Farmanstrasse 47 + 49 K e y f i g u r e s Mobimo Group (consolidated) 2010 2009 Profit on sale of trading properties
Portfolio by use (in CHF) Return on equity (in %) Net income (in CHF m) Net yield and vacancy rate (in %) Office. Education
 Return on equity (in %) Net income (in CHF m) Net yield and vacancy rate (in %) Office. Education") Summary 2016 2 Portfolio by use (in CHF) 6% 6% 7% Office Education 39% Light industrial, logistics Retail, restaurants 33% 9% Residential Parking Return on equity (in %) 12 10 8 6 4 2 0 2012 2013 2014
Summary 2016 2 Portfolio by use (in CHF) 6% 6% 7% Office Education 39% Light industrial, logistics Retail, restaurants 33% 9% Residential Parking Return on equity (in %) 12 10 8 6 4 2 0 2012 2013 2014
FINANCIAL REPORT 2017
 FINANCIAL REPORT 2017 112 Valuation Expert s Report FINANCIAL REPORT 1 2 Contents 5 Summary of group key figures 7 Annual Report for the financial year 2017 13 Valuation Expert s Report 23 Consolidated
Prime Office REIT-AG EXCELLENCE IN GERMAN REAL ESTATE. Roadshow FY 2011 results Zurich, London, Frankfurt, Brussels, Paris and Amsterdam April 2012
 Prime Office REIT-AG EXCELLENCE IN GERMAN REAL ESTATE Roadshow FY 2011 results Zurich, London, Frankfurt, Brussels, Paris and Amsterdam April 2012 0 Disclaimer The statements contained herein may include
Mobimo. Affordable residential real estate still in demand. Mobimo. Equity Note. Rating: Buy
 AA Mobimo Equity Note Rating: Buy Stock Market Data 08.03.2013 Sector Financials Industry Group Real Estate Price (CHF) 210.00 52 week high 228.00 52 week low 208.00 Market cap (CHFm) 1'301 Shares out
2014 Annual Results. 10 March la foncière parisienne
 2014 Annual Results 10 March 2015 Content I. Introduction II. Portfolio III. Rental business IV. Financial results V. Outlook 2 2014: key figures Rental income Cash Flow before disposals Revalued portfolio
Interim Report 1 Jan 30 Jun August 2008 Kari Inkinen, President and CEO Robert Öhman, CFO
 Interim Report 1 Jan 30 Jun 2008 7 August 2008 Kari Inkinen, President and CEO Robert Öhman, CFO Financial review Market overview Operational review Business areas Appendix 2 Financial review Market overview
SHORT REPORT. First half-year
 SHORT REPORT First half-year 2018 1 2 Contents 2 Foreword 5 Summary of key figures 6 Success story 8 Board of Directors 9 Executive Board 11 Strategy 12 Business model 14 Group companies 18 Real estate
ANNUAL REPORT FINANCIAL REPORT
 ANNUAL REPORT FINANCIAL REPORT 2014 ABOUT THE ANNUAL REPORT 2014 Swiss Prime Site s Annual Report is now divided into three parts, all of which are available for download at www.swiss-prime-site.ch/.
2015 Annual Results. March 9, la foncière parisienne
 2015 Annual Results March 9, 2016 Content I. Introduction II. Portfolio III. Rental business IV. Financial results V. Outlook 2 2015: key figures EPRA liquidation NAV Rental income Parisian Tertiary Revalued
DRAFT 10. Februar 2017
 2016 RESULTS results Zurich, 2 March 2017 FINANCIAL YEAR 2016 ZURICH, 2 MARCH 2017 DRAFT 10. Februar 2017 1 2 3 4 5 6 Welcome address 2016 highlights Key financial data 2016 Overview of property portfolio
Second Analysts Meeting. Zurich, 20 August 1998
 Second Analysts Meeting Zurich, 20 August 1998 Introduction Tony Reis CEO Swisscom is outperforming Market stimulation through increased marketing by Swisscom and competitors Retention of market share
Conference Call 1st quarter 2018
 Conference Call 1st quarter 2018 Dr. Rüdiger Mrotzek Hans Richard Schmitz Dr. Rüdiger Mrotzek Hans Richard Schmitz 25 April 2018 First quarter 2018 Highlights Berlin Positive operational business development
Return to trend growth in 2017
 www.pwc.ch/immospektive PwC-Immospektive Interpretation of the FPRE real estate meta-analysis Q1/17 References to FPRE graphics in our text are marked (1) etc. 17.02.2017 Key points in brief: Economic
The BKW Group «We are shaping the future of energy straightforward, reliable and integrated»
 The BKW Group «We are shaping the future of energy straightforward, reliable and integrated» COMPANY PRESENTATION, LONDON 28.04.2016 ROADSHOW LONDON BKW 28.04.2016 Contents Overview Financial results 2015
June Review and results
 June 2005 - Review and results Contents Business overview Financial highlights Debt structure Property statistics Operational highlights Share capital structure Pipeline 2005/6 2 Business overview Property
2017 Half-Year Results. Analysts Presentation 17 August 2017
 Half-Year Results Analysts Presentation 17 August Disclaimer Waiver of liability. While we make every reasonable effort to use reliable information, we make no representation or warranty of any kind that
10th Annual General Meeting. Vienna, 20 May 2011
 10th Annual General Meeting Vienna, 20 May 2011 Market overview and company development 2010 Earnings performance and balance sheet indicators 2010 Implementation of strategy Overview 1 st Quarter 2011
The Swiss real estate environment
 The Swiss real estate environment January 2018 Swiss GDP forecasts revised down to +0.9% in 2017, with confirmed inflation expectation after 5 years of negative rates (+0.5%). No material quarterly change
2017 ANNUAL RESULTS. Lausanne, Flon (Les Garages)
") 2017 ANNUAL RESULTS Lausanne, Flon (Les Garages) Disclaimer The financial data as well as the other information presented herein constitute selected information. The information in this presentation does
2017 ANNUAL RESULTS Lausanne, Flon (Les Garages) Disclaimer The financial data as well as the other information presented herein constitute selected information. The information in this presentation does
Investor Presentation
 Investor Presentation December 2017 Page Cautionary statement regarding forwardlooking statements This presentation by AG ( the Bank ) includes forward-looking statements that reflect the Bank s intentions,
Investor Presentation
 Investor Presentation April 08 Page Cautionary statement regarding forwardlooking statements This presentation by AG ( the Bank ) includes forward-looking statements that reflect the Bank s intentions,
Open minds, open spaces
 Open minds, open spaces A presentation by Laurent Carlier, CFO of Befimmo 18 November 2017 Finance Avenue Speaker Laurent Carlier > CFO of Befimmo since 2006 > 17 years of experience as Finance Director
FINANCIAL REPORT 2016
 FINANCIAL REPORT 2016 STRUCTURE OF THE ANNUAL REPORT Swiss Prime Site s Annual Report is divided into three parts, all of which are available for download as PDF files via the website www.sps.swiss. PART
SWISS PRIME SITE AG FINANCIAL RESULTS PRESS CONFERENCE
 27 August 2015 Zurich Prime Tower SWISS PRIME SITE AG FINANCIAL RESULTS PRESS CONFERENCE Report for first half of 2015 FINANCIAL RESULTS PRESS CONFERENCE Speakers Thomas Wetzel Vice Chairman of the Board
Acceleration of Development Pipeline 3-months 2018 Rents. Milan, 12 April 2018
 Acceleration of Development Pipeline 3-months 2018 Rents Milan, 12 April 2018 3M 2018 CONFERENCE CALL SPEAKERS Alexei Dal Pastro General Manager Barbara Pivetta CFO 2 AGENDA > MARKET UPDATE PAGE 4 >3M
CONTENT. 01 Highlights. 02 Portfolio Performance. 03 Optimisation of Financing Structure. 04 FY 2017 Results. 05 Outlook FY
 CONTENT 01 Highlights 02 Portfolio Performance 03 Optimisation of Financing Structure 04 FY 2017 Results 05 Outlook FY 2017 2 IMMOFINANZ RESTRUCTURING 5/2015 12/2017 Sale of logistics asset class - focus
Conference call presentation Q
 Conference call presentation Q1 2018 2018 Content 2 I. TAG highlights Q1 2018 II. TAG financials Q1 2018 III. TAG portfolio Q1 2018 IV. TAG outlook FY 2018 V. Appendix 3 5 12 16 19 Portfolio details, vacancy
Schroder ImmoPLUS EPRA Sustainability Reporting Performance Measures
 Schroder ImmoPLUS EPRA Sustainability Reporting Performance Measures The Fund reports environmental data in accordance with EPRA Best Practice Recommendations on Sustainability Reporting (2014, 2 nd Edition)
Kempen conference. Amsterdam 30 May 2013
 Kempen conference Amsterdam 30 May 2013 Company snapshot Description Dutch REIT: NSI is a real estate asset management company and qualifies as fiscal investment institution under Dutch law (REIT) Full
About Valiant: Presentation for investors
 About Valiant: Presentation for investors May 2018 Our key messages 100% focus on retail banking Simple business model with a clear focus on mortgages Very high loan quality, with 97% of loans secured
MIRLAND DEVELOPMENT CORPORATION PLC ( MirLand / Company ) UNAUDITED INTERIM CONSOLIDATED REPORT FOR THE NINE MONTHS ENDED 30 SEPTEMBER 2010
 UNAUDITED INTERIM CONSOLIDATED REPORT FOR THE NINE MONTHS ENDED 30 SEPTEMBER 2010") 17 November 2010 MIRLAND DEVELOPMENT CORPORATION PLC ( MirLand / Company ) UNAUDITED INTERIM CONSOLIDATED REPORT FOR THE NINE MONTHS ENDED 30 SEPTEMBER 2010 MIRLAND CONTINUES TO GROW INCOME AS RUSSIAN
17 November 2010 MIRLAND DEVELOPMENT CORPORATION PLC ( MirLand / Company ) UNAUDITED INTERIM CONSOLIDATED REPORT FOR THE NINE MONTHS ENDED 30 SEPTEMBER 2010 MIRLAND CONTINUES TO GROW INCOME AS RUSSIAN
2013 ANNUAL RESULTS. Investor presentation. Pierre-Alain Urech, CEO. Denis Matthey, CFO. Zurich April 1st,
 2013 ANNUAL RESULTS Investor presentation Zurich April 1st, 2014 Pierre-Alain Urech, CEO Denis Matthey, CFO Romande Energie at a glance Challenges facing the energy industry Financial results Remarks and
13 th Kepler Cheuvreux German Corporate Conference Frankfurt, 22 January 2014 Rolf Buch, CEO
 1 Syndicate Analyst Presentation May 2013 13 th Kepler Cheuvreux German Corporate Conference Frankfurt, 22 January 2014 Rolf Buch, CEO Deutsche Annington: Innovation leader based on a long-term vision,
012 t 2 Repor nnual A
 Annual Report 2012 Commercial investment properties Lausanne-Flon KEY FIGURES Mobimo Group (consolidated) 2012 2011 Net rental income CHF million 79.8 76.0 Net income from revaluation CHF million 36.9
June 30, Bank Degroof 11/09/2009
 Full Year Results June 30, 2009 Bank Degroof 11/09/2009 Table of contents Achievements Portfolio analysis Financial review Shares and shareholders Outlook Conclusion 2 Growth strategy in Belgium Unfurnished
HIAG Immobilien Holding AG Business Year March 2018
 Immobilien Holding AG Business Year 207 9 March 208, 9.03.208 Disclaimer The financial data as well as the other information presented herein constitute selected information. The information in this presentation
VASTNED RETAIL REALISES LOWER DIRECT INVESTMENT RESULT, BUT PROPERTY VALUES UP FOR SECOND CONSECUTIVE QUARTER
 Interim report VASTNED RETAIL REALISES LOWER DIRECT INVESTMENT RESULT, BUT PROPERTY VALUES UP FOR SECOND CONSECUTIVE QUARTER Reinier van Gerrevink, CEO VastNed Retail: Lease negotiations provide us with
Strong full-year result with PBT of EUR 204 mn - Increase of pay-out ratio for Annual Press Briefing 7 March 2018
 Strong full-year result with PBT of EUR 204 mn - Increase of pay-out ratio for -2019 Annual Press Briefing 7 March 2018 Andreas Arndt CEO/CFO Deutsche Pfandbriefbank AG Strong full-year result with PBT
FINANCIAL RESULTS Q3 2018
 FINANCIAL RESULTS Q3 2018 November 14, 2018 OVERVIEW & INVESTMENT HIGHLIGHTS Chapter 01 Kapitel Titel ADO THE PURE PLAY BERLIN RESIDENTIAL SPECIALIST Investment highlights 1 Berlin residential pure play
2017 HALF YEAR 25 JULY 2017
 2017 HALF YEAR RESULTS 25 JULY 2017 Strong financial results and robust balance sheet Driving performance through operational excellence and disciplined capital allocation High quality pipeline of growth
Financial Results Q Kari Inkinen, President and CEO Erik Hjelt, CFO Pia Arrhenius, SVP, IR
 Financial Results Q2 2009 Kari Inkinen, President and CEO Erik Hjelt, CFO Pia Arrhenius, SVP, IR Introduction Market review Business overview Financial overview Appendix 2 Overview of reporting segments
Autumn Presentation. la foncière parisienne
 Autumn 2017 Presentation I. Background II. Portfolio centered on Paris Central Business District III. Key aspects of TERREÏS Model IV. H1 2017 Results 2 TERREÏS at a glance Property investment company
Introduction. Organisation. Message from the Fund management company. Management report for the financial year Statement of net assets
 ANNUAL REPORT 2016 CONTENTS Introduction 2 Organisation 3 Message from the Fund management company 4 Management report for the financial year 2016 5 Statement of net assets 6 Statement of income 7 Mortgages
2016 FULL YEAR FINANCIAL RESULTS PRESENTATION TO INVESTORS & ANALYSTS
 2016 FULL YEAR FINANCIAL RESULTS PRESENTATION TO INVESTORS & ANALYSTS Stephan Widrig Chief Executive Officer Lukas Brosi Chief Financial Officer SCHEDULE 1. Business Update 2. Financial performance FY2016
BKW Group Financial Report 2013
 BKW Group Financial Report 2013 The BKW Group is one of Switzerland s largest energy companies. It employs more than 3,000 people, with its partners supplies around one million people with electricity,
Swisscom Annual Press Conference. 17 February 2011, Zurich
 Swisscom Annual Press Conference 17 February 2011, Zurich 2 Dr Anton Scherrer Chairman of the Board of Directors 3 4 2010 Strong consolidated results > Rise in consumer confidence in a still uncertain