Quarterly report Q1 Q3
|
|
|
- Marion Hart
- 5 years ago
- Views:
Transcription


1 2017 Quarterly report Q1 Q3 Additional information Financial statements Overview
2 2
3 3 Contents 4 Key figures 6 Q1 Q report 10 Portfolio summary 17 Financial statements Charts/tables Due to roundings, certain numbers presented in this report may not add up precisely to the totals provided. All key figures and changes were calculated using the precise numbers and not the presented, rounded ones. English translation of German original This is an English translation of the German original. Only the German original is legally binding. Sustainability For environmental reasons, there is no printed version of this report. This report is available as PDF on 37 Additional information 54 Contacts and important dates 55 Customer care EPRA reporting PSP Swiss Property is a member of EPRA (European Public Real Estate Association). Domiciled in Brussels, EPRA was founded in It is a non-profit organisation promoting and supporting the European public real estate industry. We apply EPRA s Best Practices Recommendations in the disclosure of our performance measures and in sustainability reporting. Additional information Financial statements Overview Further publications and information are available on
4 4 Key figures Key figures Key financial figures Unit 2016 Q Q Q1 Q Q1 Q / 1 Rental income CHF % EPRA like-for-like change % Net changes in fair value of real estate investments CHF Income from property sales (freehold apartments) CHF Income from property sales (investment properties) CHF Total other income CHF Net income CHF % Net income excluding gains/losses on real estate investments 3 CHF % Ebitda excluding gains/losses on real estate investments CHF % Ebitda margin % Total assets CHF % Shareholdersʼ equity CHF % Equity ratio % Return on equity % Interest-bearing debt CHF % Interest-bearing debt in % of total assets % Portfolio key figures Number of properties Number Carrying value properties CHF % Implied yield, gross 5 % Implied yield, net 5 % Vacancy rate (CHF) 5, 6 % Number of sites and development properties Number Carrying value sites and development properties CHF % Employees End of period People Full-time equivalents FTE Per share figures Earnings per share (EPS) 7 CHF % EPS excluding gains/losses on real estate investments 7 CHF % Distribution per share CHF n.a. n.a. n.a. n.a. Net asset value per share (NAV) 9 CHF % NAV per share before deduction of deferred taxes 9 CHF % Share price end of period CHF % 1 Change to previous year s period 1 January to 30 September 2016 or carrying value as of 31 December 2016 as applicable. 2 Excl. property at Av. des Morgines 8/10 in Petit-Lancy: %. 3 See definition Net income excluding gains/losses on real estate investments on page 34, footnote 2. 4 LTV, excluding CHF 275 million of fixed-term deposits (made in relation to private placement and bond issue) would amount to 31.9 %. 5 For investment properties. 6 Equals the lost rental income in % of the potential rent, as per reporting date. 7 Based on average number of outstanding shares. 8 For the 2016 business year. Cash payment was made on 11 April Based on number of outstanding shares.
5 Key figures 5 Overview Real estate portfolio Shareholders equity % 10.0% 8.5% 9.3% 8.3% % 4.6% 4.9% 3.5% 5.7% Q Q Portfolio value in CHF billion Vacancy rate end of period in % Shareholders equity in CHF billion Return on equity in % Ebitda Net income components % 82.0% 81.3% 81.5% 82.0% Q Q Ebitda excl. gains/losses on real estate investments in CHF million Ebitda margin in % Q Q Net income excl. gains/losses on real estate investments in CHF million Contribution gains/losses on real estate investments in CHF million
6 6 Q1 Q report Q1 Q report In good locations, the office market seems to be stabilising. In the wake of an economic upswing, demand might pick up. Market environment Competition on the letting market for commercial space remains strong; thereby, location and quality of the properties are crucial for success. One positive aspect is the fact that the office market seems to be stabilising, at least in good locations, especially in Zurich s city centre. In Zurich West, we observe lively interest in modern office space. If the promising economic outlook for 2018 is correct, the demand for office space might accelerate even more. Interest rates still hardly moved from their historically low levels in Q and fixed income investments remain unattractive. Consequently, institutional investors continue to look for qualitative real estate investments providing a positive, stable yield. Demand for the purchase of prime commercial properties is unlikely to decline in the foreseeable future. Letting market Office In Switzerland as a whole, there is still a lot of vacant office space. However, at least in our main market, Zurich, the pace of new constructions is decreasing slightly, except in Zurich North. Here, building activity continues and vacancies keep growing, while rents are declining moderately. Especially in peripheral regions, the reduction of vacancies is likely to take years. The situation is markedly better in economic centres. Central office locations in Zurich have been doing particularly well recently. The situation is stable in Basel. However, supply of office space will expand in the coming years due to a number of new construction projects. The demand for office space is relatively brisk, especially from the life-sciences, insurance and IT sectors. The most difficult market is Geneva. Here, demand remains stagnant. In addition, supply will expand due to new construction projects, especially in outlying districts. Furthermore, Geneva is still behind Zurich with regard to the consolidation of the financial sector. Consequently, the trend for rents in Geneva remains negative. Overall, we do not expect office rents to rise quickly. On the other hand, the signs of a pickup in demand in central locations are encouraging. It remains to be seen, however, whether this will lead to a sustainable market recovery. Retail The situation on the market for retail space remains tense and demand is subdued. Shopping tourism and online shopping keep pressure on rents. Central locations ( high street retail ) are more resilient. Most of our retail properties are located in this more stable market segment. Portfolio At the end of September 2017, our real estate portfolio included 158 office and commercial properties. In addition, we had twelve sites respectively projects. The carrying value of the total portfolio was CHF 7.0 billion.
7 Q1 Q report 7 Overview Investment properties On 3 April 2017, we sold the property located at Eisenbahnstrasse 95 in Gwatt (Thun) for CHF 7.0 million. We did not purchase any investment properties in the reporting period. Along with regular smaller renovations we do in our investment portfolio, several of our buildings are going through an extensive modernisation process. We are currently focusing on Zurich s city centre, several properties in Zurich West as well as one property each in Geneva and Lausanne. In 2017 and 2018, we invest around CHF 100 million for renovations and conversions in our investment properties. Vacancy At the end of September 2017, the vacancy rate stood at 8.3 % (end of 2016: 9.3 %). 0.6 percentage points of these 8.3 % were due to ongoing renovations. Of the lease contracts maturing in 2017 (CHF 31.4 million), 90 % were renewed respectively extended at the end of September As at year-end 2017, we expect a vacancy rate of below 8.5 %. Sites and development properties The ongoing work at several projects proceeded as planned during the reporting period. The most important developments in short: The new construction Grosspeter Tower in Basel will be completed by the end of The current letting rate of 70 % is encouraging. The Ibis Style Business Hotel on the lower floors has been in operation since spring Furthermore, 10 of the 22 floors (all office space) have already been let. The Grosspeter Tower has an imposing exterior and meets the most stringent criteria with regard to sustainability and technology. A fully integrated photovoltaic installation will generate enough power to cover the basic electricity needs of the building. For that reason, the Grosspeter Tower recently received the Swiss Solar Award At the Rue du Marché project in Geneva, the comprehensive renovation will cost around CHF 30 million and last until With the international hotel group citizenm, we have a prominent anchor tenant. citizenm will open a 144-room boutique hotel following the renovation. The remaining space, which is partly let, will be dedicated to retail. Construction of the Residenza Parco Lago in Paradiso (Lugano) with m 2 floor space (predominantly condominiums) started in March The investment total will amount to approximately CHF 80 million. Once completed, we will sell all units towards the end of The project Bahnhofquai/Bahnhofplatz in Zurich (total renovation, particularly infrastructure and technical installations) consists of several properties and will be carried out in three stages: Renovation work for stage 1 (Bahnhofplatz 1, Bahnhofquai 9/11/15) will cost approximately CHF 51 million. Work began in June 2017 and is likely to take around two years. Most of the space will be dedicated to offices and retail use. CBRE has been appointed as letting agent. For stage 2 (Waisenhausstrasse 2/4, Bahnhofquai 7) our chosen project was approved by the City Historical Building Committee in May The project includes a restaurant, like before the renovation. For the remaining space, both office and hotel options are being assessed. From todayʼs perspective, capital expenditure will amount to approximately CHF 33 million. We plan to submit the building permission request in spring 2018.
8 8 Q1 Q report Stage 3 (Bahnhofplatz 2) is under review. Our cost estimate for this renovation is approximately CHF 12 million. There are still ongoing lease agreements. The Hardturmstrasse / Förrlibuckstrasse project (investment total approximately CHF 60 million) in Zurich West is also on track. This property will undergo a comprehensive renovation and will be upgraded to modern standards in terms of technical installations by the end of The building will allow flexible and individual office layouts. 60 % of the space is already let. Space demand is originated among others from telecommunications, medtech, IT and energy firms. In 2018, we will start the Orion project in Zurich West (a replacement building for two properties). High-quality, flexibly partitionable office areas are planned. The investment total will be approximately CHF 130 million. The Salmenpark II residential project in Rheinfelden was sold for CHF 27.6 million on 18 August For further information on the current projects see pages 50 to 51. Consolidated quarterly results (January to September 2017) During the reporting period, we achieved a net income (excluding gains/losses on real estate investments) 1 of CHF million (Q1 Q3 2016: CHF million). The increase resulted mainly from the higher income from condominium sales compared to the previous year s period; this income increased by CHF 6.8 million to CHF 19.9 million (Q1 Q3 2016: CHF 13.1 million). Thereof, the sale of the residential project Salmenpark II in Rheinfelden during Q accounted for CHF 17.8 million. Rental income decreased by CHF 3.4 million, in particular because of the lease termination by the single tenant at the property located at Av. des Morgines 8/10 in Petit-Lancy. Earnings per share (excluding gains/losses on real estate investments) amounted to CHF 3.01 (Q1 Q3 2016: CHF 2.88); this EPS forms the basis for the distribution to shareholders. Operating expenses decreased by CHF 1.3 million to CHF 41.8 million (Q1 Q3 2016: CHF 43.1 million). Financial expenses decreased by CHF 1.3 million to CHF 19.0 million (Q1 Q3 2016: CHF 20.3 million). Net income (including gains/losses on real estate investments) was CHF million (Q1 Q3 2016: CHF million). The increase compared to the previous year s period was mainly caused by the semi-annual revaluation of the properties, which resulted in an overall appreciation of CHF 17.7 million (Q1 Q3 2016: depreciation of CHF 38.4 million), as well as by higher income from condominium/project sales. Furthermore, tax expenses decreased by CHF 2.1 million to CHF 20.6 million (Q1 Q3 2016: CHF 22.7 million). In this regard, it should be considered that the new lower corporate tax rate in the Canton of Vaud was applied in Q This resulted in a positive effect (release of deferred taxes) in the amount of CHF 17.0 million. Thereof, CHF 12.9 million are related to revaluations of the property portfolio and do not impact the net result excluding gains/losses on real estate investments. Earnings per share (including gains/losses on real estate investments) amounted to CHF 3.60 (Q1 Q3 2016: CHF 2.24). At the end of September 2017, net asset value (NAV) per share was CHF (end of 2016: CHF 84.30); in this regard, the dividend payment made on 11 April 2017 of CHF 3.35 per share must be taken into account. NAV before deducting deferred taxes amounted to CHF (end of 2016: CHF ). 1 See definition on page 34, note 2.
9 Q1 Q report 9 Overview Capital management With total equity of CHF billion (end of 2016: CHF billion) corresponding to an equity ratio of 53.4 % (end of 2016: 54.9 %) the capital base remained strong at the end of September Interest-bearing debt amounted to CHF billion, corresponding to 34.5 % of total assets (end of 2016: CHF billion respectively 31.9 %). In order to lengthen the interest fixing period, a bond and the private placement were increased by overall CHF 225 million during the reporting period. In this context, fixed-term deposits were increased by CHF 175 million to CHF 275 million. Excluding these CHF 275 million, interest-bearing debt amounts to CHF billion, corresponding to 31.9 % of total assets. At the end of September 2017, the passing average interest rate was 0.99 % (end of 2016: 1.28 %). The average fixed-interest period was 3.8 years (end of 2016: 4.3 years). No major committed bank loans will be due until At the end of September 2017, we had unused committed credit lines of CHF 730 million. PSP Swiss Property has ratings from two international rating agencies: a Senior Unsecured Rating A- (outlook stable) from Fitch and an A3 Issuer Rating (outlook stable) from Moody s. Subsequent events Outlook The outlook for Switzerland s economy as a whole is positive. Nevertheless, the property market will remain a challenge, especially in peripheral regions. In this competitive market, location and quality of the properties are key factors for rental success. Landlords that offer state-ofthe-art new buildings or comprehensively renovated and upgraded properties in good locations have a competitive advantage. This holds true for both office buildings and the retail sector. Our focus remains on the renovation and modernisation of selected properties, the further development of our sites and projects as well as the letting activities. Due to the continuing low interest rates and the resulting investment plight of institutional investors, competition on the acquisition market for top properties will remain fierce. For the 2017 business year, we expect an ebitda (excluding gains/losses on real estate investments) of more than CHF 240 million (2016: CHF million). With regard to the vacancies at year-end 2017, we now expect a lower rate of below 8.5 % (previous forecast: 8.5 %; end of September 2017: 8.3 %). The Executive Board, November 2017 There were no material subsequent events.
10 10 Portfolio Portfolio summary Q C A D E 2 B 6 5 Areas 4 Sites 8 Projects Project pipeline 1 1 Basel, project Grosspeter Tower CHF 120 million 2 Lausanne, project Rue Saint-Martin CHF 13 million 3 Zurich, project Hardturmstrasse / Förrlibuckstrasse 4 Zurich, project Bahnhofquai/-platz CHF 60 million CHF 51 million (stage 1) CHF 45 million (stages 2 & 3) 5 Paradiso, Residenza Parco Lago CHF 80 million 6 Geneva, project Rue du Marché CHF 30 million 7 Zurich, project Orion CHF 130 million 1 Details see on pages 50 to
11 Portfolio 11 Portfolio value by area 9% Sites and development properties 6% Other locations Overview 5% Lausanne 4% Bern 8% Basel 58% Zurich 11% Geneva Portfolio key figures A Zurich area B Geneva area Portfolio value CHF 4.0 billion Portfolio value CHF 0.7 billion Rental income CHF million Rental income CHF 19.6 million Implied yield, net 3.5 % Vacancy rate 6.3 % Rentable area m² Implied yield, net 2.7 % Vacancy rate 17.4 % Rentable area m² C Basel area D Bern area Portfolio value CHF 0.5 billion Portfolio value CHF 0.3 billion Rental income CHF 18.6 million Rental income CHF 9.6 million Implied yield, net 3.9 % Vacancy rate 2.2 % Rentable area m² Implied yield, net 3.8 % Vacancy rate 10.4 % Rentable area m² E Lausanne area Other locations Portfolio value CHF 0.3 billion Portfolio value CHF 0.4 billion Rental income CHF 12.9 million Rental income CHF 14.6 million Implied yield, net 4.3 % Vacancy rate 6.7 % Rentable area m² Implied yield, net 4.1 % Vacancy rate 15.8 % Rentable area m²
12 12 Portfolio Rent by use 5% Parking 4% Gastronomy 11% Other 17% Retail 62% Office Rent by type of tenant 17% Other 20% Retail 6% Government 8% Gastronomy 19% Services 9% Financial services 9% Technology 12% Telecommunication Rent by largest tenants 11% Swisscom 69% Other 4% Google 2% Roche 2% Schweizer Post 2% Bär & Karrer 9% Next five largest tenants

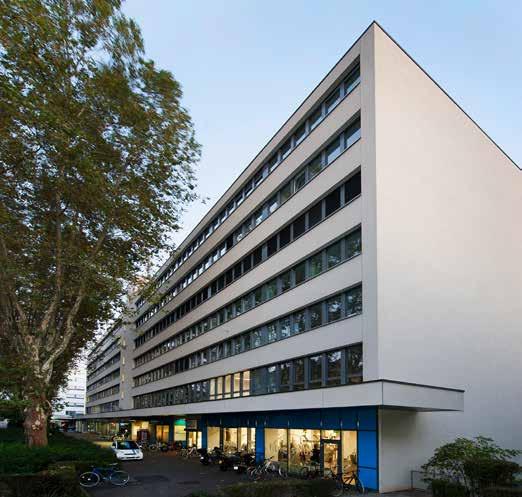

13 Portfolio 13 Overview Dornacherstrasse 210, Basel

14 14 Portfolio


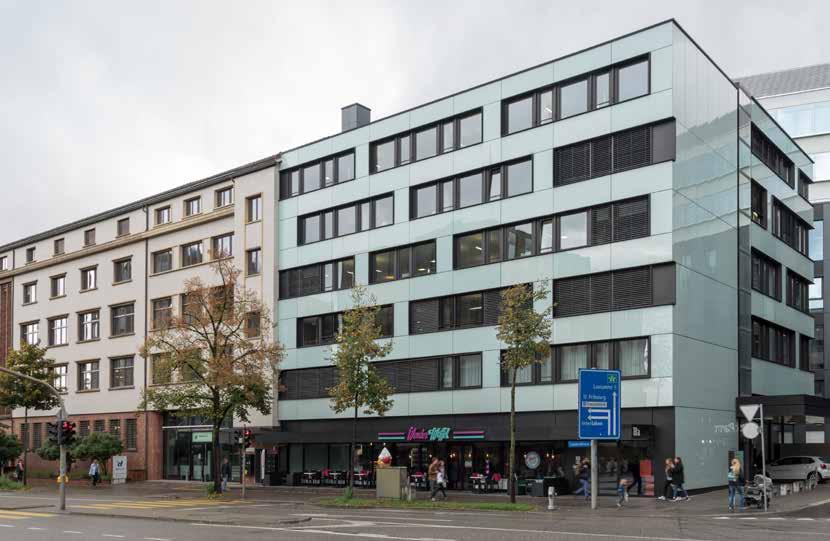
15 Portfolio 15 Overview Laupenstrasse 18 / 18a, Bern
16 16
17 17 Financial statements 18 Consolidated financial statements 18 Consolidated statement of profit or loss (July to September) 19 Consolidated statement of comprehensive income (July to September) 20 Consolidated statement of profit or loss (January to September) 21 Consolidated statement of comprehensive income (January to September) 22 Consolidated statement of financial position 23 Consolidated cash flow statement (January to September) 25 Consolidated statement of shareholders equity 26 Notes to the consolidated interim financial statements as of 30 September Review report Financial statements
18 18 Consolidated financial statements Consolidated statement of profit or loss (July to September) (in CHF 1 000) Q Q Note Rental income Net changes in fair value of real estate investments Income from property sales (inventories) Expenses from sold properties (inventories) Income from investments in associated companies 12 6 Capitalised own services Other income Total operating income Real estate operating expenses Real estate maintenance and renovation expenses Personnel expenses Fees to subcontractors General and administrative expenses Depreciation Total operating expenses Operating profit (ebit) Financial income Financial expenses Profit before income taxes Income taxes Net income attributable to shareholders of PSP Swiss Property Ltd Earnings per share in CHF (basic and diluted) Incl. release of deferred taxes due to changes in tax rate of CHF 17.0 million. The notes are part of these condensed consolidated financial information.
19 Consolidated financial statements 19 Consolidated statement of comprehensive income (July to September) (in CHF 1 000) Q Q Note Net income attributable to shareholders of PSP Swiss Property Ltd Items that may be reclassified subsequently to profit or loss: Changes in interest rate hedging Attributable taxes Items that will not be reclassified subsequently to profit or loss: Changes in pension schemes Attributable taxes Other comprehensive income Comprehensive income attributable to shareholders of PSP Swiss Property Ltd The notes are part of these condensed consolidated financial information. Financial statements
20 20 Consolidated financial statements Consolidated statement of profit or loss (January to September) (in CHF 1 000) Q1 Q Q1 Q Note Rental income Net changes in fair value of real estate investments Income from property sales (inventories) Expenses from sold properties (inventories) Income from other property sales Income from investments in associated companies 10 7 Capitalised own services Other income Total operating income Real estate operating expenses Real estate maintenance and renovation expenses Personnel expenses Fees to subcontractors General and administrative expenses Impairment charge properties Depreciation Total operating expenses Operating profit (ebit) Financial income Financial expenses Profit before income taxes Income taxes Net income attributable to shareholders of PSP Swiss Property Ltd Earnings per share in CHF (basic and diluted) The notes are part of these condensed consolidated financial information.
21 Consolidated financial statements 21 Consolidated statement of comprehensive income (January to September) (in CHF 1 000) Q1 Q Q1 Q Note Net income attributable to shareholders of PSP Swiss Property Ltd Items that may be reclassified subsequently to profit or loss: Changes in interest rate hedging Attributable taxes Items that will not be reclassified subsequently to profit or loss: Changes in pension schemes Attributable taxes Other comprehensive income Comprehensive income attributable to shareholders of PSP Swiss Property Ltd The notes are part of these condensed consolidated financial information. Financial statements
22 22 Consolidated financial statements Consolidated statement of financial position (in CHF 1 000) 1 January December September 2017 Note Cash and cash equivalents Accounts receivable Deferrals Derivative financial instruments /7 Sites and development properties for sale Investment properties for sale Total current assets Tangible assets Intangible assets Derivative financial instruments /7 Accounts receivable Financial investments Investments in associated companies Sites and development properties Own-used properties Investment properties Deferred tax assets Total non-current assets Total assets Accounts payable Deferrals Current tax liabilities Bonds Derivative financial instruments /7 Total current liabilities Debt Bonds Derivative financial instruments /7 Pension liabilities Deferred tax liabilities Total non-current liabilities Share capital Capital reserves Retained earnings Revaluation reserves Total shareholders equity Total liabilities and shareholders equity The notes are part of these condensed consolidated financial information.
23 Consolidated financial statements 23 Consolidated cash flow statement (January to September) (in CHF 1 000) Q1 Q Q1 Q Note Net income attributable to shareholders of PSP Swiss Property Ltd Net changes in fair value of investment properties Capitalised/released rent-free periods Income from other property sales Income from investments in associated companies 10 7 Capitalised own services Impairment charge properties Changes in pension liabilities recorded in the statement of profit or loss Depreciation Financial result Income taxes Changes in sites and development properties for sale Changes in accounts receivable Changes in accounts payable Changes in deferrals (assets) Changes in deferrals (liabilities) Interest paid Interest received Dividends received 1 1 Taxes paid Cash flow from operating activities Financial statements Purchases of investment properties Capital expenditures on investment properties Capital expenditures on own-used properties Capital expenditures on sites and development properties Sales of properties Payout of loans Repayment of loans Investment in fixed-term deposit Investments in tangible assets 29 0 Investments in intangible assets Cash flow from investing activities (Continued on next page)
24 24 Consolidated financial statements (Continued from previous page) (in CHF 1 000) Q1 Q Q1 Q Note Purchases of own shares Sales of own shares Increase in financial debt Repayment of financial debt Issue of bonds Issue expenses of bonds Repayment of bond Distribution to shareholders Cash flow from financing activities Changes in cash and cash equivalents Cash and cash equivalents at beginning of period Cash and cash equivalents at end of period The notes are part of these condensed consolidated financial information.
25 Consolidated financial statements 25 Consolidated statement of shareholders equity (in CHF 1 000) Share capital Capital reserves Own shares Retained earnings Revaluation reserves Total shareholdersʼ equity 31 December Net income attributable to shareholders of PSP Swiss Property Ltd Changes in interest rate hedging Changes in pension schemes Attributable taxes Other comprehensive income Comprehensive income attributable to shareholders of PSP Swiss Property Ltd Distribution to shareholders Purchase of own shares Compensation in own shares Elimination tax effect on profits on own shares in statutory accounts September Net income attributable to shareholders of PSP Swiss Property Ltd Changes in interest rate hedging Changes in pension schemes Attributable taxes Other comprehensive income Comprehensive income attributable to shareholders of PSP Swiss Property Ltd Purchase of own shares Compensation in own shares Elimination tax effect on profits on own shares in statutory accounts December Financial statements Net income attributable to shareholders of PSP Swiss Property Ltd Changes in interest rate hedging Changes in pension schemes Attributable taxes Other comprehensive income Comprehensive income attributable to shareholders of PSP Swiss Property Ltd Distribution to shareholders Purchase of own shares Compensation in own shares September The notes are part of these condensed consolidated financial information.
26 26 Consolidated financial statements Notes to the consolidated interim financial statements as of 30 September General information PSP Swiss Property Ltd is a public company whose shares are traded on the Swiss Exchange (SIX Swiss Exchange). The registered office is located at Kolinplatz 2, 6300 Zug. PSP Swiss Property Group owns 158 office and commercial properties as well as four development sites and eight individual projects throughout Switzerland. The properties are mainly in prime locations in Zurich, Geneva, Basel, Bern and Lausanne. As of 30 September 2017, PSP Swiss Property had 86 employees, corresponding to 81 full-time equivalents (end of 2016: 90 respectively 84). The condensed consolidated interim financial statements as of 30 September 2017 are based on the interim accounts of the controlled individual subsidiaries, which have been prepared in accordance with uniform accounting policies and valuation principles. They were authorised for issue by the Board of Directors on 13 November Summary of significant accounting policies The condensed consolidated interim financial statements have been prepared in accordance with International Financial Reporting Standards (IFRS), published by the International Accounting Standards Board (IASB), and comply with Swiss law and the Directive on Financial Reporting (DFR) of the SIX Swiss Exchange. The condensed consolidated interim financial statements as of 30 September 2017 have been prepared in accordance with IAS 34 (Interim Financial Reporting). They do not include all the information and disclosure, which is required for the annual report and should therefore be read together with the financial reports for the 2016 business year. The properties are valued semi-annually (at the end of June and at the end of December) by an external, independent real estate valuation company. A systematic value analysis is made by PSP Swiss Property internally at the end of the first and third quarter in order to identify any substantial changes in value. If this analysis results in property-specific changes in value (more than 2 % compared to the total value of the property portfolio per quarter respectively more than CHF 5 million for individual properties), the properties involved are also valued by the external, independent valuation company at the end of the respective quarter. Thereby the change in fair value is recognised in the income statement. Properties newly acquired during the reporting period are valued externally at the end of the quarter. Thereby the change in fair value is recognised in the income statement. Investment properties respectively investment properties earmarked for sale, which are sold by the time the financial statements are drawn up, but for which the transfer of benefits and risks takes place only in a later reporting period, are basically valued at the contractually agreed sales price deducting sales costs. A corresponding change in fair value is recognised in the income statement.
27 Consolidated financial statements 27 Furthermore, the same consolidation, accounting and valuation principles have been applied for the interim financial statements as of 30 September 2017, as those which are described on pages 50 to 61 of the 2016 annual report of PSP Swiss Property. There were no changes in the consolidated companies compared to the annual report as of 31 December Apart from the holding company PSP Swiss Property Ltd, none of the Group companies is listed on a stock exchange. Since 1 January 2017, the following amended IFRS accounting standard has been used in the consolidated financial statements for the first time: Amendments to IAS 7 Statement of Cash Flows (Disclosure Initiative): The amendments require entities to provide disclosures about changes in their liabilities arising from financing activities, including both changes arising from cash flows and non-cash changes (such as foreign exchange gains or losses). On initial application of the amendment, entities are not required to provide comparative information for preceding periods. PSP Swiss Property is not required to provide additional disclosures in its condensed interim consolidated financial statements, but will disclose additional information in its annual consolidated financial statements for the year ended 31 December Financial statements 3 Segment reporting Revenue includes operationally billed products and services. The following positions in the income statement are not included in revenue: net changes in fair value of the properties, expenses from sold properties (inventories), income from other property sales and income from participations in associated companies.
28 28 Consolidated financial statements Segment information Q1 Q (in CHF 1 000) Real Estate Investments Property Management Holding Subtotal Eliminations Total Group Rental income Net changes in fair value of real estate investments Income from property sales (inventories) Expenses from sold properties (inventories) Income from other property sales Income from investments in associated companies Property management services Capitalised own services Other income Total operating income Real estate operating expenses Real estate maintenance and renovation expenses Personnel expenses Fees to subcontractors General and administrative expenses Impairment charge properties Depreciation Total operating expenses Operating profit (ebit) Financial income 104 Financial expenses Profit before income taxes Income taxes Net income attributable to shareholders of PSP Swiss Property Ltd Revenue with third parties Revenue with other segments Total revenue The Real Estate Investments Segment exclusively invests in commercial properties. As PSP Swiss Property is exclusively active in Switzerland, no geographical segment information is disclosed.
29 Consolidated financial statements 29 Segment information Q1 Q (in CHF 1 000) Real Estate Investments Property Management Holding Subtotal Eliminations Total Group Rental income Net changes in fair value of real estate investments Income from property sales (inventories) Expenses from sold properties (inventories) Income from other property sales Income from investments in associated companies Property management services Capitalised own services Other income Total operating income Real estate operating expenses Real estate maintenance and renovation expenses Personnel expenses Fees to subcontractors General and administrative expenses Depreciation Total operating expenses Financial statements Operating profit (ebit) Financial income 234 Financial expenses Profit before income taxes Income taxes Net income attributable to shareholders of PSP Swiss Property Ltd Revenue with third parties Revenue with other segments Total revenue The Real Estate Investments Segment exclusively invests in commercial properties. As PSP Swiss Property is exclusively active in Switzerland, no geographical segment information is disclosed.
30 30 Consolidated financial statements 4 Real estate investments (in CHF 1 000) Investment properties Investment properties for sale Ownused properties Sites and development properties at market value at historical value Development properties for sale IAS 40 IFRS 5 IAS 16 IAS 40 IAS 40 IAS 2 Total real estate investment Carrying value at 31 December Purchases Capitalised/released rent-free periods Transfers Capital expenditures Capitalised own services Capitalised interest expenses Sales Net changes in fair value of real estate investments n.a n.a. n.a Net changes in fair value of properties held at 1 January n.a n.a. n.a Net changes in fair value of properties acquired, completed, transferred and sold n.a n.a. n.a Impairment charge n.a. n.a. 0 n.a Depreciation n.a. n.a. 665 n.a. n.a. n.a. 665 Carrying value at 31 December Historical cost Accumulated depreciation Carrying value, net Capitalised/released rent-free periods Transfers Capital expenditures Capitalised own services Capitalised interest expenses Sales Net changes in fair value of real estate investments n.a n.a. n.a Depreciation n.a. n.a. 506 n.a. n.a. n.a. 506 Carrying value at 30 September Historical cost Accumulated depreciation Carrying value, net Straightlining of incentives given to tenants.
31 Consolidated financial statements 31 On 3 April 2017, the property located at Eisenbahnstrasse 95 in Gwatt (Thun) was sold for CHF 7.0 million. On 18 August 2017 the project Salmenpark II was sold for CHF 27.6 million. The revaluation of the properties resulted in an overall appreciation of CHF 17.7 million (thereof CHF 14.5 million were related to the investment portfolio and CHF 3.2 million to the project developments). Mid-2017, the portfolio s weighted average nominal discount rate stood at 3.73 % (year-end 2016: 3.82 %). The discount rate reduction by 9 basis points and successful new lettings had a positive effect on valuations, compensating the depreciations due to selective lower market rents and higher renovation expenses at various properties. The internal value analysis as at the end of Q did not give any indications of further changes in values on the portfolio level or for individual properties, which would have passed the thresholds as defined in the chapter Accounting principles. As at the end of September 2017, payment obligations for current development and renovation work totalled CHF 53.6 million (end of 2016: CHF 49.9 million). 5 Financial result (in CHF 1 000) Q1 Q Q1 Q Financial income Income from financial investments 1 1 Total financial income Financial expenses Capitalised interest expenses Amortisation of issue expenses of bonds Total financial expenses Financial statements Total financial result Overall financial expenses for financial instruments at amortised cost Interest-bearing debt amounted to CHF billion at the end of September 2017 (end of 2016: CHF billion). Over the past four quarters the average interest rate was 1.23 % (previous year s period: 1.50 % respectively 1.42 % for the financial year 2016). At the end of September 2017, the average interest rate stood at 0.99 % (end of 2016: 1.28 %).
32 32 Consolidated financial statements 6 Fair value hierarchy Financial instruments, investment properties and other properties held at fair value are valued according to a three-level fair value hierarchy. The fair value definition is classified into three categories: level 1 regards instruments with price quotations in a liquid market. If there is no liquid market for a position and there are no official price quotations, the fair value is determined according to a recognised valuation method: at level 2, the valuation method is mainly based on input parameters with observable market data; at level 3, the valuation method is based on one or several input parameters without observable market data. The following table shows the market value (fair value) of these positions recognised in the balance sheet. Assets (in CHF 1 000) Level 1 Level 2 Level 3 Market value 31 December 2016 Properties (IAS 40 & IFRS 5) Financial investments Derivative financial instruments (hedging) Total financial assets Liabilities (in CHF 1 000) Derivative financial instruments (hedging) Total financial liabilities Assets (in CHF 1 000) Level 1 Level 2 Level 3 Market value 30 September 2017 Properties (IAS 40 & IFRS 5) Financial investments Derivative financial instruments (hedging) Total financial assets Liabilities (in CHF 1 000) Derivative financial instruments (hedging) Total financial liabilities During the reporting period, no positions were transferred in between the fair value levels (previous year: none). 7 Derivative financial instruments The fair value of derivative financial instruments (interest rate swaps) is calculated as the present value of future cash flows. The fair value is based on counterparties valuations. These valuations are checked by PSP Swiss Property with regard to their plausibility by means of Bloomberg valuations. The fair value of derivative financial instruments corresponds to their carrying value. During the reporting period, four interest rate payer swaps and four interest rate receiver swaps matured. One forward starting interest rate payer swap for CHF 50 million was newly signed (beginning in the year 2019 and maturing in 2027).
33 Consolidated financial statements 33 All interest rate swaps (pay fix/receive floating) fulfil the requirements for applying hedge accounting. The fixed interest rate basis for the interest rate swaps existing at the end of September 2017 was % to %; the variable interest rates are based on the CHF Libor. As in the previous year, the cash flow hedges were effective in the reporting period. 8 Debt (in CHF 1 000) 31 December September 2017 Long-term debt Long-term bonds Total interest-bearing debt In the reporting period, fixed-term loans totalling CHF 140 million were drawn using existing credit lines and CHF 100 million were repaid. During the same period, an already existing private placement with maturity in 2021 was increased by nominal CHF 50 million and an already existing bond with maturity in 2023 was increased by nominal CHF 175 million. As in the previous year, no debt was outstanding at the end of September 2017, which was secured by mortgages on properties, and no debt was outstanding with an amortisation obligation. All financial key figures (financial covenants) set out in the existing credit agreements were adhered to in the reporting period. The most important financial covenants concern the consolidated equity ratio, the interest coverage and the debt ratio. At the respective balance sheet dates, the exposure of all debt with regard to changes in interest rates was as follows: Financial statements (in CHF 1 000) 31 December September 2017 < 6 months to 12 months to 5 years > 5 years Total interest-bearing debt At the end of September 2017, the average fixed-interest period was 3.8 years (end of 2016: 4.3 years). 9 Share capital During the reporting period, a total of own shares were purchased at an average price of CHF per share totalling CHF 0.2 million and own shares were sold at an average price of CHF per share totalling CHF 0.2 million (previous year s period: own shares purchased at an average price of CHF and own shares sold at an average price of CHF 84.25). Further information on changes in equity is shown on page 25.
34 34 Consolidated financial statements 10 Per share figures Earnings per share is calculated by dividing the reported net income by the average weighted number of shares, excluding own shares. Earnings per share excluding gains/losses on real estate investments is based on Net income excluding gains/losses on real estate investments 2. Q Q Q1 Q Q1 Q Net income in CHF Net changes in fair value of real estate investments in CHF Impairment charge properties in CHF Income from property sales in CHF Attributable taxes in CHF Net income excl. gains/losses on real estate investments in CHF Number of average outstanding shares Earnings per share in CHF (basic and diluted) Earnings per share excl. gains/losses on real estate investments in CHF (basic and diluted) Release of deferred taxes from temporary valuation differences on real estate investments. Equity per share changed as follows: 31 December September 2017 Shareholdersʼ equity in CHF Deferred taxes in CHF Number of outstanding shares Net asset value per share in CHF Net asset value per share before deduction of deferred taxes in CHF Based on number of outstanding shares. 11 Dividend payment Based on a resolution of the Annual General Meeting on 5 April 2017, a payment of an ordinary dividend of CHF 3.35 per share (totalling CHF million) was made on 11 April 2017 (previous year: CHF 3.30 per share, thereof CHF 1.80 out of the capital contribution reserves and CHF 1.50 as ordinary dividend). 12 Subsequent events There were no material subsequent events. 2 Net income excluding gains/losses on real estate investments corresponds to the consolidated annual net income excluding net changes in fair value of the real estate investments, realised income on sales of investment properties and all of the related taxes. Income from the sale of properties which were developed by the Company itself is, however, included in the Net income excluding gains/losses on real estate investments.
35 Consolidated financial statements 35 Ernst & Young Ltd Maagplatz 1 P.O. Box CH-8010 Zurich Phone Fax To the Board of Directors of PSP Swiss Property Ltd, Zug Zurich, 13 November 2017 Report on the review of interim condensed consolidated financial statements Introduction We have reviewed the interim condensed consolidated financial statements (income statement, statement of comprehensive income, balance sheet, cash flow statement, statement of changes in equity and notes, pages 18 to 34 and 38 to 53) of PSP Swiss Property Ltd for the period from 1 January to 30 September The review of comparable figures was performed by another auditor. The Board of Directors is responsible for the preparation and presentation of these interim condensed consolidated financial statements in accordance with International Financial Reporting Standard IAS 34 Interim Financial Reporting and article 17 of the Directive on Financial Reporting (DFR) of the SIX Swiss Exchange. Our responsibility is to express a conclusion on these interim condensed consolidated financial statements based on our review. Scope of Review We conducted our review in accordance with Swiss Auditing Standard 910 and with International Standard on Review Engagements 2410 Review of Interim Financial Information Performed by the Independent Auditor of the Entity. A review of interim financial information consists of making inquiries, primarily of persons responsible for financial and accounting matters, and applying analytical and other review procedures. A review is substantially less in scope than an audit conducted in accordance with International Standards on Auditing and consequently does not enable us to obtain assurance that we would become aware of all significant matters that might be identified in an audit. Accordingly, we do not express an audit opinion. Financial statements Conclusion Based on our review, nothing has come to our attention that causes us to believe that the interim condensed consolidated financial statements are not prepared, in all material respects, in accordance with International Financial Reporting Standard IAS 34 Interim Financial Reporting and article 17 of the Directive on Financial Reporting (DFR) of the SIX Swiss Exchange. Ernst & Young Ltd Daniel Zaugg Licensed audit expert (Auditor in charge) Tobias Meyer Licensed audit expert
Quarterly report Q1 Q3. Short report
 2017 Quarterly report Q1 Q3 Short report 2 PSP Swiss Property Short report Q1 Q3 2017 Key figures Key financial figures Unit 2016 Q3 2016 Q3 2017 Q1 Q3 2016 Q1 Q3 2017 +/ 1 Rental income CHF 1 000 276
Additional information Financial statements Overview. Half-year report H1
 2017 Half-year report H1 Additional information Financial statements Overview 2 3 Contents 4 Key figures 6 H1 2017 report 10 Portfolio summary 17 Financial statements Charts/tables Due to roundings, certain
Quarterly Report Q1 Q3
 Quarterly Report Q1 Q3 2015 2 Key figures Key figures Key financial figures Unit 1 January to 31 Dec. 2014 1 July to 30 Sept. 2014 1 July to 30 Sept. 2015 1 January to 30 Sept. 2014 1 January to 30 Sept.
Quarterly report Q1 Short report
 2018 Quarterly report Q1 Short report 2 PSP Swiss Property Short report Q1 2018 Key figures Key financial figures Unit 2017 1 Q1 2017 1 Q1 2018 +/ 2 Rental income CHF 1 000 272 454 68 375 69 123 1.1 %
Quarterly report Q1 2014
 Quarterly Report Q1 2014 2 Key figures Key figures 1 January to 1 January to 1 January to Key financial figures Unit 31 Dec. 2013 31 March 2013 31 March 2014 Change 1 Rental income CHF 1 000 279 143 67
Press release. Quarterly results as per 30 September 2018
 Press release 13 November 2018 Quarterly results as per 30 September 2018 PSP Swiss Property with successful letting activities. The vacancy guidance as per year-end 2018 has been improved to 5%. The ebitda
Short Version. Report
 Short Version Annual Report 2015 2 PSP Swiss Property Short Version 2015 Key figures Key financial figures (in CHF 1 000) 2014 2015 Change 1 Rental income 277 150 275 063 0.8 % EPRA like-for-like change
H1 RESULTS. 18 August 2017
 H1 RESULTS 18 August 2017 Agenda Key Facts and Figures 3 Financial Results H1 2017 7 Portfolio and Vacancy Rate 14 Capital Structure 20 Development Sites and Projects 23 Subsequent Events 36 Outlook 38
ANNUAL RESULTS. 27 February 2018
 ANNUAL RESULTS 27 February 2018 Agenda Key Facts and Figures 3 Financial Results FY 2017 7 Portfolio and Vacancy Rate 14 Capital Structure 20 Development Sites and Projects 23 Subsequent Events 38 Outlook
Q1-Q3 RESULTS. 14 November 2017
 Q1-Q3 RESULTS 14 November 2017 Agenda Key Facts and Figures 3 Financial Results Q1-Q3 2017 7 Portfolio and Vacancy Rate 14 Capital Structure 20 Development Sites and Projects 23 Outlook 37 Annex 39 PSP
Q1 RESULTS. 8 May 2018
 Q1 RESULTS 8 May 2018 Agenda Key Facts and Figures 3 Financial Results Q1 2018 7 Portfolio and Vacancy Rate 14 Capital Structure 20 Development Sites and Projects 23 Subsequent Events 35 Outlook 37 Annex
H1 RESULTS August 2018
 H1 RESULTS2018 17 August 2018 Agenda Key Facts and Figures 3 Financial Results H1 2018 7 Portfolio and Vacancy Rate 14 Capital Structure 20 Development Sites and Projects 23 Subsequent Events 35 Outlook
Industry Newsletter SWISS PROPERTY SUCCESS STORY LUCIANO GABRIEL CEO, PSP SWISS PROPERTY EUROPEAN PUBLIC REAL ESTATE ASSOCIATION ISSUE 54 MAY 2016
 EUROPEAN PUBLIC REAL ESTATE ASSOCIATION Industry Newsletter ISSUE 54 MAY 2016 Download the full EPRA Industry Newsletter at www.epra.com/newsroom/epra-articles/ SWISS PROPERTY SUCCESS STORY LUCIANO GABRIEL
Q1 RESULTS Publication, 12 May 2015
 Q1 RESULTS Publication, 12 May 2015 Agenda Key Facts and Figures 3 Financial Results Q1 2015 7 Portfolio and Vacancy Rate 14 Capital Structure 20 Development Sites & Projects 23 Outlook 33 Subsequent Events
record your global partner for entrance solutions agta record ltd interim report 2017 your global partner for entrance solutions
 record your global partner for entrance solutions agta record ltd interim report 2017 your global partner for entrance solutions interim report 2017 Half-year report 30 June 2017 Trade activity Markets
ANNUAL RESULTS Publication, 3 March 2015
 ANNUAL RESULTS Publication, 3 March 2015 Agenda Key Facts and Figures 3 Portfolio and Vacancy Rate 10 Financial Results FY 2014 14 Capital Structure 20 Development Sites & Projects 23 Outlook 33 Subsequent
Quarterly Statement A S O F
 Quarterly Statement AS OF KEY FACTS Q3 / 2017 T 1 Key facts RESULTS OF OPERATIONS Q3 2017 Q3 2016 + / % / bp 01.01. 01.01. 30.09.2016 Rental income million 134.7 131.9 2.1 398.4 381.3 4.5 Net rental and
Roche Capital Market Ltd Half-Year Report 2018
 Roche Capital Market Ltd Half-Year Report 2018 Roche Capital Market Ltd Interim Financial Statements The Interim Financial Statements have been reviewed by Roche Capital Market Ltd s auditor and their
ANNUAL RESULTS 28 February 2014
 ANNUAL RESULTS 28 February 2014 Agenda Key Facts and Figures 3 Portfolio and Vacancy Rate 10 Financial Results 2013 14 Capital Structure 22 Development Sites 25 Subsequent Events 37 Outlook 39 Annex 41
Compagnie Financière Tradition Interim Condensed Consolidated Financial Statements For the period ended 30 June 2007
 Compagnie Financière Tradition Interim Condensed Consolidated Financial Statements For the period ended 30 June 2007-1- Ernst & Young S.A. Place Chauderon 18 Case postale CH-1002 Lausanne Telephone +41
Portfolio by use (in CHF) Return on equity (in %) Net income (in CHF m) Net yield and vacancy rate (in %) Office. Education
 Return on equity (in %) Net income (in CHF m) Net yield and vacancy rate (in %) Office. Education") Summary 2016 2 Portfolio by use (in CHF) 6% 6% 7% Office Education 39% Light industrial, logistics Retail, restaurants 33% 9% Residential Parking Return on equity (in %) 12 10 8 6 4 2 0 2012 2013 2014
Summary 2016 2 Portfolio by use (in CHF) 6% 6% 7% Office Education 39% Light industrial, logistics Retail, restaurants 33% 9% Residential Parking Return on equity (in %) 12 10 8 6 4 2 0 2012 2013 2014
Press release. Mobimo achieves 2018 half-year results in line with expectations
 Press release Mobimo achieves 2018 half-year results in line with expectations Mobimo achieved solid half-year results, with profit of CHF 37.9 million. As expected this was lower than in the previous
Interim Report January September
 2017 Interim Report January September Key financial figures In CHF million, except where indicated 1.1. 30.9.2017 1.1. 30.9.2016 Change Net revenue and results Net revenue 8,604 8,643 0.5% Operating income
Q1-3 RESULTS November 2012 COMPETENCE IN SWISS REAL ESTATE
 Q1-3 RESULTS 2012 13 November 2012 COMPETENCE IN SWISS REAL ESTATE AGENDA Key Facts and Figures 3 Portfolio and Vacancy Rate 10 Financial Results Q1-3 2012 14 Capital Structure 22 Development Sites 25
Interim Report January March
 2018 Interim Report January March KPIs In CHF million, except where indicated 31.3.2018 31.3.2017 Change Revenue and results Net revenue 1 2,885 2,831 1.9% Operating income before depreciation and amortisation
CONSOLIDATED FINANCIAL STATEMENTS
 90 DEUTSCHE ANNINGTON IMMOBILIEN SE FINANCIAL REPORT 2013 CONSOLIDATED FINANCIAL STATEMENTS As at the reporting date, the Group had a stable financial and asset position. With total assets rising slightly,
CONDENSED CONSOLIDATED INTERIM STATEMENT OF FINANCIAL POSITIONS
 Financial Report H1-2017 CONDENSED CONSOLIDATED INTERIM STATEMENT OF FINANCIAL POSITIONS 30 June 31 December Notes 2017 2016 2016 ASSETS Cash and balances with central bank 3,135,253,291 1,956,195,315
Consolidated Statement of Financial Performance
 Consolidated Statement of Financial Performance in CHF 1,000 Note 2018 2017 (reviewed) (reviewed) Revenue from product sales 3 1,822.7 909.5 Revenue from research & development 3 1,974.3 2,708.3 Other
L1E Finance GmbH & Co. KG Consolidated Interim Financial Statements for the Period 1 January - 30 June 2017
 L1E Finance GmbH & Co. KG Consolidated Interim Financial Statements for the Period 1 January - 30 June - 2 - L1E Finance GmbH & Co. KG - Consolidated Income Statement 2. Quarter 2. Quarter Sales and other
CONDENSED CONSOLIDATED FINANCIAL STATEMENTS MARCH 31, 2018 (UNAUDITED)
") CONDENSED CONSOLIDATED FINANCIAL STATEMENTS (UNAUDITED) CONDENSED CONSOLIDATED BALANCE SHEETS March 31, December 31, Assets Current assets Cash $ 48,243 $ 11,370 Marketable securities 404 404 Trade and
CONDENSED CONSOLIDATED FINANCIAL STATEMENTS (UNAUDITED) CONDENSED CONSOLIDATED BALANCE SHEETS March 31, December 31, Assets Current assets Cash $ 48,243 $ 11,370 Marketable securities 404 404 Trade and
CONDENSED CONSOLIDATED FINANCIAL STATEMENTS JUNE 30, 2018 (UNAUDITED)
") CONDENSED CONSOLIDATED FINANCIAL STATEMENTS (UNAUDITED) CONDENSED CONSOLIDATED BALANCE SHEETS (In thousands of Canadian dollars) June 30, December 31, 2018 2017 Assets Current assets Cash $ 12,195 $ 11,370
CONDENSED CONSOLIDATED FINANCIAL STATEMENTS (UNAUDITED) CONDENSED CONSOLIDATED BALANCE SHEETS (In thousands of Canadian dollars) June 30, December 31, 2018 2017 Assets Current assets Cash $ 12,195 $ 11,370
Nationale Suisse. Interim report 1 st half-year In the Studio kunstbericht.ch
 Nationale Suisse Interim report 1 st half-year 2014 In the Studio kunstbericht.ch Publishing details Published by Swiss National Insurance Company Ltd Steinengraben 41 4003 Basel www.nationalesuisse.com
ANNOUNCEMENT OF INTERIM RESULTS FOR THE SIX MONTHS ENDED 30 JUNE 2018
 Hong Kong Exchanges and Clearing Limited and The Stock Exchange of Hong Kong Limited take no responsibility for the contents of this announcement, make no representation as to its accuracy or completeness
The Warehouse Group Limited Financial Statements For the 52 week period ended 27 July 2014
 The Warehouse Limited Financial Statements Financial Statements The Warehouse Limited is a limited liability company incorporated and domiciled in New Zealand. The address of its registered office is Level
GROSS PROFIT 4,500 4,000 3,500 3,000 2,500 2,000 1,500 1,000 6M 2017 FY 2013 IN MILLIONS OF CHF FY M 2017
 SIX MONTHS REPORT 2017 DUFRY AT A GLANCE TURNOVER GROSS PROFIT MARGIN 9,000 8,000 7,000 6,000 5,000 4,000 3,000 2,000 1,000 0 2013 2014 2015 2017 4,500 4,000 3,500 3,000 2,500 2,000 1,500 1,000 500 0 2013
Net income for the period % %
 QUARTERLY STATEMENT Q3 2018 Key figures KION Group overview in million Q3 2018 Q3 2017 * Change Q1 Q3 2018 Q1 Q3 2017 * Change Order intake 2,060.3 1,847.2 11.5% 6,369.3 5,699.5 11.8% Revenue 1,895.9 1,832.4
GROSS PROFIT 4,500 4,000 3,500 3,000 2,500 2,000 1,500 1,000 9M 2017 FY 2013 IN MILLIONS OF CHF FY M 2017
 NINE MONTHS REPORT SEPTEMBER 2017 DUFRY AT A GLANCE TURNOVER GROSS PROFIT MARGIN 9,000 8,000 7,000 6,000 5,000 4,000 3,000 2,000 1,000 0 2013 2014 2015 2017 4,500 4,000 3,500 3,000 2,500 2,000 1,500 1,000
Consolidated Statement of Financial Performance
 Consolidated Statement of Financial Performance in CHF 1,000 Note 2017 2016 (reviewed) (reviewed) Revenue from product sales 3 909.5 420.4 Revenue from research & development 3 2,708.3 3,257.7 Total income
Finance Report Excerpt from the 46 th Annual Report 2008/2009. EMS-CHEMIE HOLDING AG Domat/Ems Switzerland
 Finance Report 2008 Excerpt from the 46 th Annual Report 2008/2009 EMS-CHEMIE HOLDING AG Domat/Ems Switzerland Contents EMS Group Spotlight on Share Performance 2 Key Figures 2004-2008 3 Consolidated Income
Solutions for a connected world
 Solutions for a connected world Interim Report 2016 WELCOME Temenos: the software specialist for banking and finance Who we are Founded in 1993, Temenos is the marketleading provider of mission critical
BKW Group Financial Report 2013
 BKW Group Financial Report 2013 The BKW Group is one of Switzerland s largest energy companies. It employs more than 3,000 people, with its partners supplies around one million people with electricity,
FINANCIAL REPORT H1-2016
 FINANCIAL REPORT H1-2016 CONDENSED CONSOLIDATED INTERIM STATEMENT OF FINANCIAL POSITIONS ASSETS 30 June 31 December Notes 2016 2015 2015 Cash and balances with central bank 1,956,195,315 1,807,136,242
Q HIGHLIGHTS MEUR MEUR % MEUR MEUR 48.4 MEUR 94.8 MEUR % 1.87% +2.2% +1.9 PP +3.5% +73.8% + >100% +19.9% +81.
 Q1-2 2018 HIGHLIGHTS STRENGTHENED OPERATING PERFORMANCE Occupancy rate 94.7% Rental income MEUR 119.0 Rental income lfl MEUR 98.2 +1.9 PP +3.5% +2.2% KPIs SIGNIFICANTLY IMPROVED Results of AM MEUR 94.8
Consolidated Interim Report 3rd quarter and nine months ended 30 September 2018
 Consolidated Interim Report 3rd quarter and nine months ended 30 September 2018 (translation of the Estonian original) EfTEN Real Estate Fund III AS Commercial register number: 12864036 Beginning of financial
Illustrative IFRS consolidated financial statements 2013 Investment property
 www.pwc.com/ifrs Illustrative IFRS consolidated financial statements 2013 Investment property Stay informed. Visit inform.pwc.com Introduction This publication provides an illustrative set of consolidated
Press Release. Züblin concentrates on Germany and France. Zurich, 15 May 2014
 Press Release Zurich, 15 May 2014 Züblin concentrates on Germany and France Züblin ended the financial year 2013/2014 with another substantial loss of CHF 64 million (2012/2013: loss of CHF 89 million).
2008 Results and Outlook
 VZ Group VZ Holding Ltd Beethovenstrasse 24 CH-8002 Zurich Telephone: +41 44 207 27 27 Fax: +41 44 207 27 28 vermoegenszentrum.ch vzonline.ch 2008 Results and Outlook Aarau Basle Berne Frankfurt Geneva
Responsible Entity: Aspen Funds Management Ltd
 ASPEN GROUP LIMITED ABN 50 004 160 927 ASPEN PROPERTY TRUST ARSN 104 807 767 Responsible Entity: Aspen Funds Management Ltd ABN 48 104 322 278 Appendix 4D For the period ended 31 December 2015 Results
Summit Germany Limited (the "Company") Proposed Bond Issue and Q3 Results
 Proposed Bond Issue and Q3 Results") This announcement contains inside information which is disclosed in accordance with the Market Abuse Regulation. 15 January 2018 Summit Germany Limited (the "Company") Proposed Bond Issue and Q3 Results
This announcement contains inside information which is disclosed in accordance with the Market Abuse Regulation. 15 January 2018 Summit Germany Limited (the "Company") Proposed Bond Issue and Q3 Results
Consolidated Statement of Financial Position
 Consolidated Statement of Financial Position in CHF 1,000 Note 30 June 2015 31 December 2014 (review ed) (audited) Assets Non-current assets Property, plant and equipment 11,109.3 10,483.9 Intangible assets
CONSOLIDATED FINANCIAL STATEMENTS
 CONSOLIDATED FINANCIAL STATEMENTS FOR THE YEAR ENDED 31 DECEMBER ENDESA, S.A. AND SUBSIDIARIES CONSOLIDATED STATEMENTS OF FINANCIAL POSITION AT 31 DECEMBER AND 31 DECEMBER ASSETS 31 December 31 December
SEMI-ANNUAL 2017 RESULTS ZURICH, 24 AUGUST 2017
 SEMI-ANNUAL 2017 RESULTS ZURICH, 24 AUGUST 2017 1 2 3 4 Welcome address H1 2017 highlights Key financial data for H1 2017 Outlook Hans Peter Wehrli René Zahnd Markus Meier René Zahnd 2 Welcome address
Andermatt Swiss Alps Group Consolidated financial statements together with auditor's report for the year ended 31 December 2016
 Andermatt Swiss Alps Group Consolidated financial statements together with auditor's report for the year ended 31 December 2016 F-1 Andermatt Swiss Alps AG Consolidated statement of comprehensive income
Summary 1-2. Chairman's and Managing Director's report 3-9. Independent auditor s review report 10
 REPORT AND ACCOUNTS June 2018 INDEX Page Summary 1-2 Chairman's and Managing Director's report 3-9 Independent auditor s review report 10 Condensed Consolidated Statements of Financial Position 11-12 Condensed
HIAG Immobilien Half-Year Results September HIAG Immobilien, 5 September
 Half-Year Results 206 5 September 206, 5 September 206 Disclaimer The financial data as well as the other information presented herein constitute selected information. The information in this presentation
Amount $000's. Amount. Imputed amount Foreign tax credit per share. per share per share Dividend payable N/A. N/A N/A Special dividend payable
 Trustpower Limited Results for announcement to the market Reporting period 6 months to 30 September 2016 Previous reporting period 6 months to 30 September 2015 Amount $000's Percentage change Revenue
Equity per share (NOK) Equity ratio 43 % 40 % 41 % Non-current net asset value per share (NOK) (EPRA NNNAV) 2)
 Equity ratio 43 % 40 % 41 % Non-current net asset value per share (NOK) (EPRA NNNAV) 2)") REPORT FOR Q3 2017 KEY FIGURES Amounts in NOK million 30.09.17 30.09.16 31.12.16 Net rental income 1 822 1 688 2 243 Fair value adjustments in investment properties and interest rate derivatives 1) 2 045
REPORT FOR Q3 2017 KEY FIGURES Amounts in NOK million 30.09.17 30.09.16 31.12.16 Net rental income 1 822 1 688 2 243 Fair value adjustments in investment properties and interest rate derivatives 1) 2 045
International Financial Reporting Standards (IFRS) (Circular No. 2, CIR2)
 (Circular No. 2, CIR2)") Circular No. 2 Circular No. 2 International Financial Reporting Standards (IFRS) (Circular No. 2, CIR2) Status on Basis 30 September 2009 Arts. 49 to 51 LR and Directive Financial Reporting (DFR) This
Circular No. 2 Circular No. 2 International Financial Reporting Standards (IFRS) (Circular No. 2, CIR2) Status on Basis 30 September 2009 Arts. 49 to 51 LR and Directive Financial Reporting (DFR) This
CONSOLIDATED FINANCIAL STATEMENTS
 CONSOLIDATED FINANCIAL STATEMENTS FOR THE SIX MONTHS ENDED 30 JUNE 2017 ENDESA, S.A. AND SUBSIDIARIES CONSOLIDATED STATEMENTS OF FINANCIAL POSITION AT 30 JUNE 2017 AND 31 DECEMBER 2016 (*) Unaudited ASSETS
CONDENSED CONSOLIDATED INTERIM FINANCIAL STATEMENTS SIX MONTHS ENDED 30 JUNE 2017
 CONDENSED CONSOLIDATED INTERIM FINANCIAL STATEMENTS SIX MONTHS ENDED 30 JUNE 2017 APRR Group - a French limited company (société anonyme) with share capital of 33,911,446.80. Dijon Trade and Companies
For personal use only
 Appendix 4D Name of entity (SFH) Appendix 4D Half year report ABN Half yearly (tick) 43 057 569 169 Preliminary final (tick) 1. Details of the reporting period Current reporting period Previous corresponding
SIX MONTHS REPORT 2018
 SIX MONTHS REPORT 2018 DUFRY AT A GLANCE TURNOVER GROSS PROFIT MARGIN 9,000 8,000 7,000 6,000 5,000 4,000 3,000 2,000 1,000 0 2014 2015 2016 2017 6M 2017 6M 2018 4,500 4,000 3,500 3,000 2,500 2,000 1,500
2010 Results and Outlook
 VZ Holding Ltd Beethovenstrasse 24 CH-8002 Zurich Telephone: +41 44 207 27 27 Fax: +41 44 207 27 28 vermoegenszentrum.ch vzonline.ch VZ Group 2010 Results and Outlook Zurich, 8 March 2011 Disclaimer Forward-looking
Highlights of Stadshypotek s Annual Report. January December 2017
 Highlights of Stadshypotek s Annual Report January December Highlights of Stadshypotek s Annual Report January December Income totalled SEK 13,373m (12,415). Expenses before loan losses increased by SEK
Kathmandu Holdings Limited. FINANCIAL STATEMENTS 31 July 2018
 Kathmandu Holdings Limited FINANCIAL STATEMENTS 31 July 2018 Introduction and Table of Contents In this section The financial statements have been presented in a style which attempts to make them less
Housing Financing Fund Condensed Interim Financial Statements 30 June 2018
 Housing Financing Fund Condensed Interim Financial Statements 30 June 2018 These Financial Statements are translated from the original statements which are in Icelandic. Should there be discrepancies between
Finance Report Excerpt from the 55 th Annual Report 2017/2018. EMS-CHEMIE HOLDING AG Domat/Ems Switzerland
 Finance Report 2017 Excerpt from the 55 th EMS-CHEMIE HOLDING AG Domat/Ems Switzerland 1 Content EMS Group Share Performance 3 Key Figures 2013-2017 4 Remuneration Report 5 Report of the Statutory Auditor
Consolidated Statement of Financial Performance
 Consolidated Statement of Financial Performance in CHF 1,000 Note 2016 2015 (reviewed) (reviewed) Revenue from product sales 3 420.4 214.8 Revenue from research & development 3 3,257.7 4,100.5 Other income
Akelius Fastigheter. Annual Report 2012 TRANSLATION
 Akelius Fastigheter Annual Report 2012 TRANSLATION Table of contents Page Administration report.. 3 Consolidated income statement 9 Consolidated balance sheet. 10 Consolidated change in equity... 12 Consolidated
FIRST QUARTER Q 2013
 FIRST QUARTER 2013 1Q 2013 IMPORTANT EVENTS IN THE FIRST QUARTER OF 2013 POSITIVE RENTAL MARKET BUT CONVERSION PROJECTS TEMPORARILY IMPACT OPERATION Stable operation, temporary impact from conversion projects
Half Year Report _EFG_HalfYearLetter_2017.indd :28
 Half Year Report 2017 EFG International is a global private banking group offering private banking and asset management services and is headquartered in Zurich. Its registered shares (EFGN) are listed
Unaudited Consolidated Statement Of Comprehensive Income For The Six Months To 31 October 2017 UNAUDITED 6 MONTHS
 Financial Statements For The Six Months To 31 October 2017 (Unaudited) The Interim Financial Statements presented are signed for and on behalf of the Board and were authorised for issue on the 20December
ADDITIONAL INFORMATION
 SEMI-ANNUAL REPORT ADDITIONAL INFORMATION PRIME TIMES Our «Prime Times» magazine August 2015 edition features a summary of results and trends in the first half-year 2015, starting from page 33. The publication
GREAT MOMENTS FOR EVERYONE, EVERYDAY
 Condensed Consolidated Interim Financial Statements for the six month period ended 2016 GREAT MOMENTS Contents 01 Independent auditors' report on review of condensed consolidated interim financial information
mbank Hipoteczny S.A. IFRS Condensed Financial Statements for the first half of 2018
 IFRS Condensed Financial Statements for the first half of 2018 Selected financial data The following selected financial data constitute supplementary information to the condensed financial statements of
HALF-YEAR 2018 RESULTS IR-PRESENTATION 30 AUGUST 2018
 HALF-YEAR 2018 RESULTS IR-PRESENTATION 30 AUGUST 2018 1 Disclaimer This communication contains specific forward-looking statements, beliefs or opinions, including statements with respect to objectives,
Emirates Telecommunications Group Company PJSC
 Review report and condensed consolidated interim financial information for the period ended 30 September 2017 Review report and condensed consolidated interim financial information for the period ended
2013 Half-year Report Shortform
 2013 Half-year Report Shortform Sound results reported for first half of 2013 Stable rental income and gratifying net yield Continued increase of project volume Favourable financing Confirmation of expectations
NOTES TO THE CONSOLIDATED FINANCIAL STATEMENTS
 Financial Statements NOTES TO THE CONSOLIDATED FINANCIAL STATEMENTS 1. General information ScS Group plc (the Company ) is a Company incorporated and domiciled in the UK (Company registration number 03263435).
Good Group (International) Limited
 Limited") EY IFRS Core Tools Good Group (International) Limited International GAAP Illustrative interim condensed consolidated financial statements for the period ended 30 June 2015 Based on International Financial
EY IFRS Core Tools Good Group (International) Limited International GAAP Illustrative interim condensed consolidated financial statements for the period ended 30 June 2015 Based on International Financial
First Quarter 2014 Interim Unaudited Condensed Consolidated Financial Statements and Notes
 First Quarter 2014 Interim Unaudited May 15, 2014 CONSOLIDATED STATEMENT OF FINANCIAL POSITION Unaudited March 31, (Canadian dollars in millions) 2014 ASSETS Current December 31, 2013 Cash and cash equivalents
Condensed Consolidated Financial Statements June 30, 2014
 Andrew Peller Limited Condensed Consolidated Financial Statements June 30, 2014 ANDREW PELLER LIMITED Condensed Consolidated Balance Sheets These financial statements have not been reviewed by our auditors
Hysan Development Company Limited
 stock code 00014 Hysan Development Company Limited INTERIM REPORT 2013 VISION To be the PREMIER property company that is superior to its peers in its market of choice. MISSION Provide our stakeholders
Notes to the consolidated financial statements A. General basis of presentation
 86 Notes to the consolidated financial statements A. General basis of presentation Accounting principles The consolidated financial statements of Franz Haniel & Cie. GmbH, Duisburg, for the year ended
INTERIM REPORT
 The holding company of Dah Sing Bank, Limited (Incorporated in Hong Kong with limited liability under the Companies Ordinance) 2356 (Stock Code: 2356) 2017 2017 INTERIM REPORT 2017 6 30 6 2017 6 30 6 12
For personal use only
 PRELIMINARY FULL YEAR REPORT ANNOUNCEMENT The a2 Milk Company Limited For the year ended 30 June 2016 Preliminary full year (12 month) report on consolidated results (including the results for the previous
Condensed Interim Consolidated Financial Statements. For the 13-week and 39-week periods ended October 29, 2017 and October 30, 2016
 Condensed Interim Consolidated Financial Statements For the 13-week and 39-week periods ended and (Unaudited, expressed in thousands of Canadian dollars, unless otherwise noted) Interim Consolidated Statement
The consolidated financial statements were authorised for issue by the Board of Directors on 1 June 2015.
 ACCOUNTING POLICIES for the year ended 31 March 2015 Transnet SOC Ltd (the Company ) is a company domiciled in South Africa. The consolidated financial statements for the year ended 31 March 2015 comprise
HONGKONG LAND HOLDINGS LIMITED
 HONGKONG LAND HOLDINGS LIMITED Preliminary Financial Statements for the year ended 31st December 2017 1 Consolidated Profit and Loss Account for the year ended 31st December 2017 Underlying Non- Underlying
idated Ffinancial statements Notes to the consolidated financial statements Financial statements of Swisscom Ltd
 idated Ffinancial statements Consolidated financial statements Notes to the consolidated financial statements Consolidated statement of comprehensive income 94 Consolidated balance sheet 95 Consolidated
Bendigo and Adelaide Bank Limited ABN
 Bendigo and Adelaide Bank Limited Appendix 4D Half Year Report Half Year Announcement Half Year Financial Report For the period ending 31 December 2011 Released 20 February 2012 This report comprises information
Facts and figures. Interim Report as of June 30, 2017
 Facts and figures. Interim Report as of June 30, 2017 2 Key figures as of June 30, 2017 3 Sustained growth and improved results 5 Consolidated interim financial statements 8 Notes to the consolidated interim
Financial Statements
 Financial Statements Financial statements Consolidated income statement Note Trading Acquisition and disposal costs Exceptional items Revenue 1 1,276 1,276 Operating expenses 3 (1,026) (59) (75) (1,160)
2017 HALF YEAR 25 JULY 2017
 2017 HALF YEAR RESULTS 25 JULY 2017 Strong financial results and robust balance sheet Driving performance through operational excellence and disciplined capital allocation High quality pipeline of growth
SECOND QUARTER AND HALF YEAR ENDED 30 JUNE 2018 FINANCIAL STATEMENTS & RELATED ANNOUNCEMENT
 SEMBCORP MARINE LTD Registration Number: 196300098Z SECOND QUARTER AND HALF YEAR ENDED 30 JUNE 2018 FINANCIAL STATEMENTS & RELATED ANNOUNCEMENT TABLE OF CONTENTS Item No Description Page Financial Statements
Conference call presentation Q
 Conference call presentation Q1 2018 2018 Content 2 I. TAG highlights Q1 2018 II. TAG financials Q1 2018 III. TAG portfolio Q1 2018 IV. TAG outlook FY 2018 V. Appendix 3 5 12 16 19 Portfolio details, vacancy
swiss prime as at 30 June 2008
 swiss prime report insightsemi-annual as at 30 June 2008 Contents 1 Swiss Prime Insight as at 30 June 2008 Summary of the key figures 2 Valuation expert s report 9 Financial commentary 15 Consolidated
2014 Financial Report
 Consolidated Financial Statements A 2014 Financial Report Consolidated Financial Statements 71 CONSOLIDATED FINANCIAL STATEMENTS CONTENTS Consolidated Income Statement Consolidated Statement of Comprehensive
Illustrative IFRS consolidated financial statements 2014
 www.pwc.co.uk Illustrative IFRS consolidated financial statements 2014 Investment Property Stay informed. Visit inform.pwc.com December 2014 Contents Introduction 1 Consolidated statement of financial
Builders Capital Mortgage Corp. Condensed Consolidated Financial Statements For the Three Months ended June 30, 2018 and 2017
 Condensed Consolidated Financial Statements For the Three Months ended June 30, 2018 and Notice of No Auditor Review of Interim Financial Statements In accordance with National Instrument 51-102 released