SIGNIFICANT DEVELOPMENTS
|
|
|
- Rafe Pierce
- 6 years ago
- Views:
Transcription


1 COMPANY PRESENTATION October 2006

2 2 CONTENTS 1. THE COMPANY at a glance 3 2. FINANCIAL HIGHLIGHTS 5 3. SIGNIFICANT DEVELOPMENTS PROPERTIES 9 5. CORPORATE STRATEGY & GROWTH PROSPECTS APPENDICES 26 a. PROPERTY MARKETS 27 b. PROPERTY MARKETS IN CEE 29 c. FINANCIAL HIGHLIGHTS 1 st Half Page
3 THE COMPANY at a glance Market Cap NAV Shares Major shareholder Headcount Listed Indices : 352million October 15, 2006 : 359million June 30, 2006 : 44 million : Latsis Group 63% : 85 : ASE in 2000 : FTSE EPRA/NAREIT & FTSE ASE Mid-40 Company Presentation October
4 THE COMPANY at a glance Company Presentation October Market leader in Retail sector Successful portfolio diversification in the residential/office sectors Investment portfolio of 700m Euro 99% occupancy rates based on long term leases with highly credible tenants S.E. Europe expansion strategy based on local established networks
5 5 FINANCIAL HIGHLIGHTS KEY FINANCIAL INDICATORS Forecast EBITDA 1 m 142 m 80 m EBT -1 m 136 m 62 m Properties Fair Market Value 332 m 657 m 677 m* Net Debt/Equity 0,84 1,06 1,11* L/T Loans Hedging % 0% 61% 100% NAV / Share 4,10 6,90 8,2 * Share Price 3,16 5,76 - * Figures provided are as of June 30, Due to efftect of revaluation, to be performed in Dec. 2006, no forecast is provided
6 6 FINANCIAL HIGHLIGHTS REAL ESTATE REVENUES (in million euros) (6 months) RENTAL REVENUES 3,7 8,1 19,7 R.E. SALES REVENUES 11,8 31,4 30,2 OTHER R.E. REVENUES 10,8 8,1 7, million euros RENTAL REVENUES R.E. SALES REVENUES OTHER R.E. REVENUES (6months) YEAR
7 7 SIGNIFICANT DEVELOPMENTS Size of completed developments 2 Shopping centers sq.m. GLA 6 Office buildings sq.m. GLA 4 Residential complexes sq.m. 1 Marina 260 yachts sq.m. Strategic & Partnership alliances with major international players: HSBC SONAE SIERRA ECE LATSIS Group of companies PARKRIDGE Divestment of non R.E. investments and low yield/growth R.E. projects Organizational restructuring & cost containment Management compensation plan
8 02/08/ /08/ /09/ /10/ STOCK DATA LAMDA Development & ASE General Index: 03/01/ /10/2006 LAMDA Development ASE Gen.Index 03/01/ /10/2006 Change % LAMDA Development 3,16 8,00 153% ASE Gen. Index 2.824, ,89 44% ASE MID , ,48 97% Company Presentation October /04/ /05/ /05/ /06/ /07/ /08/ /08/ /09/ /10/ /11/ /12/ /12/ /01/ /02/ /03/ /04/ /04/ /05/ /06/ /07/ /03/ /02/ /01/ /01/2005 P r i c e I n d e x
9 9 PROPERTIES
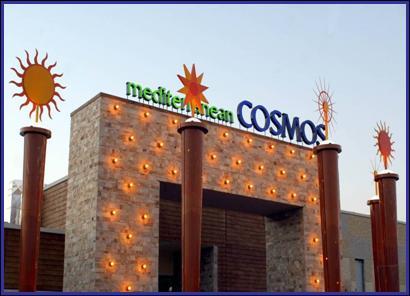
10 10 RETAIL PROPERTIES The 2 largest and first of this type developments in Greece were completed, at year-end The Mall Athens 100% occupancy GLA sq.m. Managed by ECE - LAMDA Development JV MEDITERRANEAN COSMOS Thessaloniki 97% occupancy GLA sq.m. Managed by Sonae Sierra - LAMDA Development JV 2006 projection : Turnover 40million - EBIDTA 30million Agreement to sell 50% of The Mall, Athens Agreement with HSBC for the sale of 50% of participation in The Mall Athens. Transaction is subject to Competition Authorities approval. Agreed valuation of property at approximately 414 million, reflecting initial yield of 6,1%. ROE 78%.
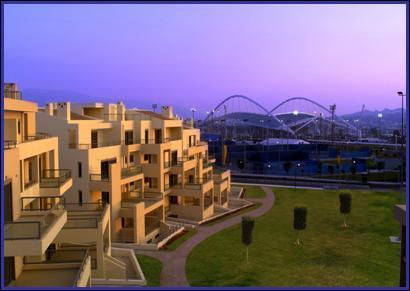
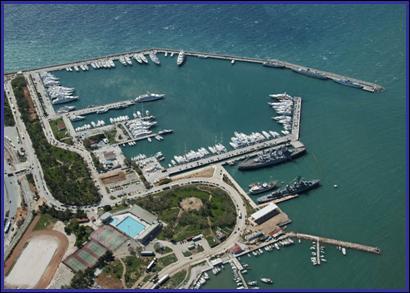
11 OTHER PROPERTIES Office buildings Cecil, Kifissia Athens, (6.000 sq.m.) developed in 2002, 98% occupancy. Kronos Business Centre, Maroussi, Athens, (4.000 sq.m.) developed in 2003, 100% occupancy. Ilida Business Center in Maroussi, Athens ( sq.m.), developed in Sale completion anticipated within Residential Ilida residential apartments in Maroussi, Athens, developed in Out of 241 units, 77 remain available for sale. Flisvos Marina Development of 260 yachts births marina sq.m. commercial and recreational facilities Completion before year end 2006 Company Presentation October
12 PROPERTY & INVESTMENT VALUES Company Presentation October (in million) INVESTMENT PROPERTY AT FAIR MARKET VALUE (IFRS) (30/06/2006) NAME LOCATION MARKET VALUE TOTAL * LAMDA Development % LAMDA Development % Value The Mall Athens MAROUSSI 398,3 98,5 392,2 Mediterannean Cosmos THESSALONIKI 150,6 60,1 90,5 Ilida Business Centre MAROUSSI 43,4 98,5 42,7 Cecil KEFALARI 31,0 100,0 31,0 Kronos Business Centre MAROUSSI 12,1 80,0 9,7 Other Investment Property 7,8 100,0 7,8 SUB-TOTAL 643,2 574,0 OTHER REAL ESTATE PROPERTY (at book value) Ilida (residential) MAROUSSI 33,9 98,48 33,4 Prokalisi Spata (Land plot) SPATA 15,9 100,00 15,9 LAMDA Akinita (Land plot) KIFISSIA 16,4 50,00 8,2 Kronos Parking MAROUSSI 4,2 100,00 4,2 Flisvos Marina FALIRO 10,9 33,75 3,7 SUB-TOTAL 81,3 65,4 EQUITY INVESTMENT IN LISTED REIT EFG Eurobank Properties 366,0 10,2 37,3 TOTAL 1.090,5 676,7 * Valuations by Savills as of 31/12/2005. The MALL was revalued as of 30/06/2006, partially reflecting the HSBC transaction
13 PROPERTY VALUES 1 st half 2006 Company Presentation October (Ιn million ) 33,4 (5%) 87,7 (13%) 3,7 (1%) 24,1 (4%) 37,3 ( 6%) 482,7 (70%) 7,8 (1%) RETAIL PROPERTIES RESIDENTIAL OFFICES MARINA LAND LISTED REIT OTHER GROSS INITIAL YIELDS PROPERTY YIELD (%) The Mall, Athens 6,1 Mediterranean Cosmos 7,8 Office Buildings 7,0
14 14 CORPORATE STRATEGY & GROWTH PROSPECTS
15 CORPORATE STRATEGY Company Presentation October Maximize shareholders value through: NAV enhancement by further improvement of current portfolio performance. NAV enhancement via new developments and investments in Greece and South-Eastern Europe. New investment plan of 400 million by year end Pay dividend starting from Maintain leadership in Greece in developing and managing: Shopping and Leisure Centers Retail developments (Big Boxes, Factory & Designer Outlets) Prime quality residential Resorts & Office developments Pursue opportunities in retail, office and residential sectors in CEE.
16 CORPORATE STRATEGY Company Presentation October Expand into property fund management in CEE. Focus in Bulgaria, Romania, Serbia, Russia and Ukraine in retail, office and residential sectors. Own participation 30 million. Further exploit International Strategic Alliances (ECE, SONAE SIERRA, HSBC and PARKRIDGE) as well as local players (GEK, J&P) to strengthen competitive position as appropriate. Target leverage: 65%. Minimum target Total ROI: 30%, Total ROE: 75%. Optimum balance of risk reward ratio. Maintain a lean organization.
17 17 GROWTH PROSPECTS Current Portfolio Existing Properties Portfolio Recurring EBIDTA 25million based on 50% proportional consolidation of The Mall Athens NAV Sensitivity Existing Properties Portfolio (L.D. portion) NAV Effect of 1% change in yields 60million NAV Effect of 1m additional EBIDTA 20million The Mall (currently valued at 6,15% yield) Mediterranean Cosmos (currently valued at 7,8 yield) Offices (currently valued at 7,0% yield)
18 GROWTH PROSPECTS New Projects Investment cost : 400million Total ROI : 30% Total ROE : 85% Leverage : 65% Generated Annual EBIDTA : 15million * * Excl. Residential gains Company Presentation October
19 PROPERTY PORTFOLIO MIX Company Presentation October Current* Target Retail : 60% 60% Office : 20% 5% Residential : 5% 20% Other : 15% 15% Total 100% 100% New projects Greece : 70% Romania, Bulgaria, Serbia : 30% * after The Mall s 50% disposal
20 20 ACTIVE DEVELOPMENT PIPELINE Total L.D. Participation : 80million IBC, Maroussi, Athens - 40 year concession & 6 year renewal option - Shopping center : around sq.m. GLA - Office space : sq.m parking spaces - Total investment cost : 60 million ( 40million construction cost) - Expected construction period : months - Expected inauguration : Autumn Managed by ECE LAMDA Development JV Romania - Started development of office building in Bucharest (6.500 sq.m.) - Land : one acre - Investment cost : 5,2 million - LAMDA Development participates by 40% - Completion : end of 2007
21 21 ACTIVE DEVELOPMENT PIPELINE Total L.D. Participation : 80million Sophia, Bulgaria - LAMDA Development/GEK joint participation - Acquisition of sq.m. of land for retail complex development - Land cost : 5million - Retail development - Alternatives under examination - Estimated Investment Cost : 15million Sophia, Bulgaria - LAMDA Development - Acquisition of sq.m. of land for luxury residential development - Land cost : 2,4million - Estimated Investment Cost : 10million - Estimated construction period: 1,5 years
22 22 OWN LAND - DEVELOPMENT PIPELINE Total L.D. Participation : 100million GREECE PROJECT TYPE POTENTIAL ESTIMATED INVESTMENT ( m illion) PARTICIPATION (%) Residential (Kifissia) Office (Kifissia) Office/Logistics (Spata) Concession/Motorway Services Stations
23 23 DEVELOPMENT PROJECTS UNDER CONSIDERATION GREECE CITY Athens Heraklion Athens Rhodes Anavissos Athens Athens PROJECT TYPE Free Hold / Factory Outlet Concession / Port Regeneration Concession / PPP Concession / Tourist Concession / Tourist Free Hold / Leisure Conscession / Exhibition Center Total Estimated Project Cost - Greece 770 million LAMDA PARTICIPATION - Greece 450 million Note: Development projects under consideration is a dynamic process, subject to due diligence results, public tender procedures and time schedules, as well as negotiation outcomes.
24 24 DEVELOPMENT PROJECTS UNDER CONSIDERATION CITY / COUNTRY S.E. EUROPE PROJECT TYPE TOTAL PROJECTS COST ( million) SOPHIA Offices 7 TOTAL BULGARIA 7 BUCHAREST Residential 19 Mixed Use 90 Logistics 20 Mixed Use 47 TOTAL ROMANIA 176 BELGRADE Residential 29 Mixed Use 90 Residential 20 TOTAL SERBIA 139 TOTAL S.E. EUROPE LAMDA PARTICIPATION S.E. EUROPE 322 million 200 million Note: Development projects under consideration is a dynamic process, subject to due diligence results and satisfactory negotiation outcomes.
25 SWOT ANALYSIS Company Presentation October Strengths Market leader in Retail development & management Proven expertise in Office & Residential development Asset & Property Management Financial, Legal, Fiscal structuring Management team Easy access to debt financing Region knowledge Corporate Governance Weaknesses Critical mass Opportunities Economies of scale Significant demand for R.E. developments & re-developments in Greece and SEE Above average GNP growth in the region Yield compression Long-term investor relationship Fund Management Threats Negative market(s) development
26 26 APPENDICES
27 27 a. PROPERTY MARKETS
28 28 RETAIL SECTOR IN SOUTHERN EUROPE Country Total Shopping Centre Density (sq.m. per 1000 inhabitants) France 235 Spain 231 Portugal 200 Italy 150 Greece 55 Source: Savills European Research
29 29 b. PROPERTY MARKETS in CEE
30 RETAIL TRENDS Consumer spending in CEE is increasing at a significant rate New developments need to be high quality to be competitive Retail parks offer best development prospects Increasing attention towards thematic shopping malls, big box developments (accessibility!) Company Presentation October
31 31 LEISURE / TOURISM TRENDS Important boost in tourism next decade: many new developments in peripheral area (hotels, resorts, facilities etc) Growing importance in mixed-use projects (incl. restaurants, bars etc) Shopping as leisure activity Large-scale thematic parks & attractions
32 32 INDUSTRIAL SITES Urgent need for brownfield development Much space at outskirts of major cities Demand for modern facilities Importance of connections road, rail, airport Insufficient logistics and distribution infrastructure
33 33 RESIDENTIAL TRENDS Growing middle class looking for quality accommodation, international standards and affordable prices Growing foreign investment attracting ex-pats Urban regeneration Growth in mortgage lending
34 34 CHALLENGES FOR CENTRAL & EASTERN EUROPE Availability of medium & long term debt Availability of local developers Infrastructure within regions
35 35 c. FINANCIAL HIGHLIGHTS 1 st Half 2006
36 36 FINANCIAL HIGHLIGHTS INCOME STATEMENT SUMMARY 1st Half - Euro M % Change Turnover 67,1 33,5 100% Fair Value gains 43,2 0,0 Cost & Administration Expenses -54,7-43,1 27% Participations 11,1 3,1 Other income/expense -0,5-0,6 EBIDTA 66,2-7,1 Interest expense / income -8,6-1,3 Depreciation -1,7-1,5 Pretax Profit 55,9-10,0 Taxes -9,8-1,2 Minority Interest -1,5 4,4 Net Profit after Minorities 44,6-6,9
37 FINANCIAL HIGHLIGHTS Company Presentation October TURNOVER 6 Months 2006 (in million ) 1,7 (3%) 9,8 (15%) 30,2 (44%) 25,5 (38%) RETAIL TURNOVER RESIDENTIAL SALES OFFICE RENTAL INCOME OT HER
38 38 FINANCIAL HIGHLIGHTS PROFITABILITY DRIVERS - 1 st Half ,2 Pretax Profit : 55,9 M EBIDTA : 66,2 M Euro-M 10,3 4,9 3,5 4,5 5,8 1,1 Mall revaluation Ilida residential The Mall Athens Mediterranean Cosmos Argonautis Eurobank Properties Other Rental prop. Marina Shipyards Overheads Net Interest Depreciation -0,9-2,5-1,7-3,8-8,6
39 39 FINANCIAL HIGHLIGHTS TURNOVER - 1 st Half : 2006 vs , : 67,1 M 2005 : 33,5 M Euro M 16,6 13,3 8,9 0,0 0,2 1,7 1,9 3,0 1,9 3,9 5,7 2,9 5,0 5,6 The Mall Athens Mediterranean Cosmos Other Rental Income Residential sales Flisvos Marina Shipyards Services Swissport
40 FINANCIAL HIGHLIGHTS Company Presentation October EBITDA 6 Months 2006 (In million ) FORECASTED EBITDA (In million ) 43,2 (54)% 10,3 (13%) 1,1 (1%) 51,2 (43%) 11,7 (10%) 2,2 (2%) 6 ( 5%) 4,9 (6%) -17,10 (15%) -7,2 (9%) 13,8 (17%) 29 (25%) ( I ( ) 2, 2 ( 2% ) 6 ( 5% ) ( ) - ( ) 29 ( 25% ) RETAIL FO RECASTED EBI TDA 2006 n m ilion ) RETAIL REVALUATION 11, 7 10% SALE OF PARTICIPATIONS OTHER RENTAL PROPERTIES 51, 2 43% 17, 10 15% RESIDENTIAL OTHER, OVERHEADS
41 41 OUTSTANDING LOAN BALANCES & INTEREST RATE HEDGING TYPE OF LOANS BALANCES % HEDGED % SHORT TERM % 29 25% LONG TERM % % TOTAL % % NON HEDGED 0% LONG TERM 72% SHORT TERM 28% LONG TERM HEDGED 100% HEDGED 25% SHORT TERM NON HEDGED 75%
42 INCOME STATEMENT - Consolidated Company Presentation October Amounts in Euro to to Sale of property Rents Other Real Estate revenues Other Non-Real Estate Revenues Sales Cost of sales ( ) ( ) Gross profit Administrative expenses ( ) ( ) Fair value gains/ (losses) of investment property Profit / (loss) from participations sale in associates Other operating income / (expenses) - net ( ) Operating profit ( ) Finance costs - net ( ) Share of (loss) / profit of associates ( ) Profit before income tax ( ) Current tax ( ) ( ) Deferred tax ( ) ( ) Profit for the period ( ) Attributable to : Equity holders of the Company ( ) Minority interest ( ) ( )
43 BALANCE SHEET - Consolidated Company Presentation October Amounts in Euro 30/06/ /12/ /06/ /12/2005 ASSETS Non-current assets EQUITY Capital and reserves attributable to the Company's shareholders Investment property Share capital Property, plant and equipment Other reserves Intangible assets Retained earnings /(Accumulated losses) Available for sale fianancial assets Investments in subsidiaries Minority interest Deferred income tax asset Total equity Derivative financial instruments Other receivables LIABILITIES Non-current liabilities Current assets Borrowings Inventories Deferred income tax liability Trade and other receivables Retirement benefit obligations Current income tax asset Other liabilities Cash and cash equivalents Current liabilities Total assets Trade and other liabilities Current income tax liability Borrowings Provisions Total liabilities Total equity and liabilities
44 INCOME STATEMENT - Consolidated Company Presentation October Amounts in Euro to to Sale of property Rents Other Real Estate revenues Other Non-Real Estate Revenues Sales Cost of sales ( ) ( ) Gross profit ( ) Operating leases ( ) ( ) Marketing expenses ( ) ( ) Administrative expenses ( ) ( ) Fair value gains/ (losses) of investment property Other operating income / (expenses) - net Operating profit Finance costs - net ( ) ( ) Profit before income tax ( ) Current tax ( ) ( ) Deferred tax ( ) Profit for the period Attributable to : Equity holders of the Company Minority interest
45 45 SHAREHOLDERS COMPOSITION (as of October 20, 2006) SHARE CAPITAL BREAKDOWN International Institutional Investors 5,7% Private Investors 9,9% Greek Institutional Investors 11,4% EFG Eurobank Ergasias Group S.A. 9,8% Consolidated Lamda Holdings S.A. 63,2% Total number of shares:
46 46 LAMDA Development S.A. 16, Laodikias Str Athens Greece Tel: Fax: Web site : C.F.O. : Mr. Odisseas Athanassiou athanasiou@lamda-development.net I.R. : Mr. Alexandros Kokkidis akokkidis@lamda-development.net
Consolidated Financial Results March YTD 2008 Conference Call
 Consolidated Financial Results March YTD 2008 Conference Call LAMDA Development CONSOLIDATED FINANCIAL RESULTS March YTD 2008 March YTD 2008 Consolidated Financial Results Conference Call 2 2 NAV PERFORMANCE
Consolidated Financial Results
 Consolidated Financial Results March YTD 2012 1 Solid shopping centers performance against adverse market conditions Average shopping centers occupancy approaching 99% NAV increased by 1% vs Dec2011 Liquidity
Consolidated Financial Results
 Consolidated Financial Results June YTD 2012 1 Solid shopping centers performance against adverse market conditions Average shopping centers occupancy approaching 99% Retail Recurring EBITDA down 9% to
Consolidated Financial Results
 Consolidated Financial Results MARCH YTD 2011 1 NAV increased by 3% vs Dec. 2010 (net profit & Eurobank Properties share price) Recurring EBITDA decreased by 5% to 13.2 million Solid shopping centers performance
LAMDA DEVELOPMENT. Consolidated Financial Results. YTD March 2017
 LAMDA DEVELOPMENT Consolidated Financial Results YTD March 2017 The Company s Highlights Financials Retail EBITDA increased by 4,5% to 11,6m. Increase incurred across all 3 Centers. Total EBITDA before
Eurobank Properties REIC. Company Presentation May 2014
 Eurobank Properties REIC Company Presentation May 2014 Disclaimer This presentation has been prepared by Eurobank Properties REIC (the Company ). The information contained in this presentation has not
Eurobank Properties. 6M 2008 results 31 July 2008
 Eurobank Properties 6M 2008 results 31 July 2008 AGENDA Recent Developments Portfolio Overview New Investments Financial Information 30.6.2008 2 Recent Developments New Organizational Structure Rem. Committee
Grivalia Properties REIC. Company Presentation December 2014
 Grivalia Properties REIC C Company Presentation December 2014 Disclaimer This presentation has been prepared by Grivalia Properties REIC (the Company ). The information contained in this presentation has
Eurobank Properties REIC. Company Presentation September 2013
 Eurobank Properties REIC Company Presentation September 2013 Company overview Largest Listed Investment Property Fund in Greece High quality property portfolio and remarkable tenant mix (Eurobank, Bancpost,
one more year targeting perfection
 A N N U A L R E P O R T 2 0 1 1 one more year targeting perfection 03 CONTENTS LETTER TO SHAREHOLDERS 04 2011 FINANCIAL PERFORMANCE Share Performance 08 13 INVESTMENT PORTFOLIO The Mall Athens Golden Hall
Eurobank Properties REIC. Company Presentation September 2012
 Eurobank Properties REIC Company Presentation September 2012 Company overview Largest Investment Property Fund in Greece High quality property portfolio and remarkable tenant mix (Eurobank, Bancpost, AB
Sonae Sierra recorded a Total Net Profit of 93 million in the first nine months of 2016
 Maia - Portugal, November 3 rd 2016 Sonae Sierra recorded a Total Net Profit of 93 million in the first nine months of 2016 Direct net profit at 40.2 million EBIT at 70.5 million Global occupancy up to
Contents. Letter to Shareholders Financial Performance 8 Share Performance 13
 Annual Report 2009 Contents Letter to Shareholders 4 2009 Financial Performance 8 Share Performance 13 Investment Portfolio 16 The Mall Athens 18 Mediterranean Cosmos 22 Golden Hall 26 Flisvos Marina 30
Sonae Sierra records a 31% growth in Net Profit to 16.6 million in the first quarter of 2016
 Maia - Portugal, May 10th 2016 Sonae Sierra records a 31% growth in Net Profit to 16.6 million in the first quarter of 2016 European tenant sales and rents maintain positive performances Direct profit
Sonae Sierra records a Net Profit of 181 million in 2016
 Maia, Portugal - March 9 th 2017 Sonae Sierra records a Net Profit of 181 million in 2016 Net Profit increases 28% y-o-y Direct Net Profit reaches 57 million Indirect Net Profit rises to 125 million Successful
Financial Results 1H August 1, 2018
 Financial Results 1H 2018 August 1, 2018 INDEX EPRA NNNAV 1H 2018 Financial Results 1H 2018 Business Plan Guidance Real Estate Portfolio 1H 2018 Business Updates Corporate Updates Investment Opportunities
6M 2007 IFRS FINANCIAL RESULTS. PRESENTED BY: CEO Mr. E. MYTILINEOS CFO Mr. I. DIMOU
 6M 2007 IFRS FINANCIAL RESULTS PRESENTED BY: CEO Mr. E. MYTILINEOS CFO Mr. I. DIMOU 1 Agenda Conference Call Highlights Group Financial & Operating Highlights Key Performance Indicators Summary Financial
6M 2007 IFRS FINANCIAL RESULTS. PRESENTED BY: CEO Mr. E. MYTILINEOS CFO Mr. I. DIMOU
 6M 2007 IFRS FINANCIAL RESULTS PRESENTED BY: CEO Mr. E. MYTILINEOS CFO Mr. I. DIMOU 1 Agenda Conference Call Highlights Group Financial & Operating Highlights Key Performance Indicators Summary Financial
1 st H 2006 IFRS FINANCIAL RESULTS. PRESENTED BY: CEO Mr. E. MYTILINEOS CFO Mr. I. DIMOU
 1 st H 2006 IFRS FINANCIAL RESULTS PRESENTED BY: CEO Mr. E. MYTILINEOS CFO Mr. I. DIMOU 03/08/2006 1 Agenda A. Group Financial & Operating Highlights B. Key Performance Indicators Appendices i. Group History
Company Presentation September 2016
 1 Company Presentation September 2016 Disclaimer This presentation has been prepared by Grivalia Properties REIC(the Company ). The information contained in this presentation has not been independently
This financial report has been translated from the original report that has been prepared in the Greek language. Reasonable care has been taken to
 Eurobank Properties REIC FINANCIAL REPORT for the six month period ended June 30 2012 This financial report has been translated from the original report that has been prepared in the Greek language. Reasonable
CAUTIONARY STATEMENT REGARDING FORWARD-LOOKING INFORMATION
 FY 2002 RESULTS 1 CAUTIONARY STATEMENT REGARDING FORWARD-LOOKING INFORMATION This presentation may contain projections or other forward looking statements related to EFG Eurobank Ergasias S.A. that involve
Q2 & H Results. 20 August 2013
 Q2 & H1 2013 Results 20 August 2013 AGENDA Sections 1. Q2 & H1 13 highlights 3 2. Portfolio overview 7 3. Key financial results 9 4. Update on ongoing projects 17 2 Q2 & H1 13 HIGHLIGHTS Q2 & H1 13 FINANCIAL
2005 FINANCIAL RESULTS. PRESENTED BY: CEO Mr. E. MYTILINEOS CFO Mr. I. DIMOU
 2005 FINANCIAL RESULTS PRESENTED BY: CEO Mr. E. MYTILINEOS CFO Mr. I. DIMOU 23/02/2006 1 Disclaimer This presentation contains an announcement of expected results (guidance) for 2006. The Company s Administration
Sonae Sierra recorded a Total Net Profit of 7.3 million in the first quarter of 2010
 Maia, Portugal - May 12 th 2010 An increase of 112% compared to the first quarter 2009 Sonae Sierra recorded a Total Net Profit of 7.3 million in the first quarter of 2010 Direct Income from Investments
Sonae Sierra recorded a Net Profit of 15.3 million in the first quarter of 2018
 Sonae Sierra recorded a Net Profit of 15.3 million in the first quarter of 2018 Maia Portugal, May 9th, 2018 Direct Result rises to 17 million EBIT reaches 27 million Tenant sales and rents performed positively
Sonae Sierra recorded a Net Profit of 77.7 million in the first nine months of 2018
 Sonae Sierra recorded a Net Profit of 77.7 million in the first nine months of 2018 Maia Portugal, November 14th, 2018 Direct Result rises 9,7% to 49.6 million EBIT reaches 77.5 million, a 2.3% increase
GEK - TERNA GROUP. Group presentation
 GEK - TERNA GROUP Group presentation GEK - TERNA Group: Overview GEK and TERNA group holds one of the leading positions in Construction, Energy, Real Estate and Concessions, in Greece GEK is the parent
STRONG GROWTH MOMENTUM 65M +10% 71M +220% 33M +14% 837M +8% 1,544m +17% 9M 2016 RESULTS NOI PROFIT BEFORE TAX FFO EPRA NAV TOTAL PROPERTY
 9M 2016 RESULTS STRONG GROWTH MOMENTUM NOI PROFIT BEFORE TAX FFO EPRA NAV TOTAL PROPERTY 65M +10% 71M +220% 33M +14% 837M +8% 1,544m +17% 9M 2016 HIGHLIGHTS NOI increased by 10% to 65m ( 59m in 9M 2015)
Bulgarian Real Estate Fund - Profile
 Page 1 Bulgarian Real Estate Fund - Profile Established in 2004 BREF is one of the first Bulgarian REITs (Real Estate Investment Trust) Listed on the Bulgarian Stock Exchange Sofia (Ticker symbol 5BU )
Annual financial report for the year ended on 31 December 2016 in accordance with International Financial Reporting Standards («IFRS»)
") PYLAIA S.A. Annual financial report for the year ended on 31 December 2016 in accordance with International Financial Reporting Standards («IFRS») PYLAIA S.A. Company`s General Electronic Commercial Registry
PYLAIA S.A. Annual financial report for the year ended on 31 December 2016 in accordance with International Financial Reporting Standards («IFRS») PYLAIA S.A. Company`s General Electronic Commercial Registry
Company Presentation June 2017
 1 Company Presentation June 2017 Disclaimer This presentation has been prepared by Grivalia Properties REIC(the Company ). The information contained in this presentation has not been independently verified
Corporate. Presentation September 2017
 Corporate www.larespana.com Presentation September 2017 Snapshot 2 First IPO of a Spanish REIT listed on the Spanish Stock Exchange Shareholder Structure Focused on creating both sustainable income and
STRONG OPERATING PERFOMANCE ALLOWS TO PROPOSE DIVIDEND OF PLN 0.27 PER SHARE 86M
 2016 RESULTS STRONG OPERATING PERFOMANCE ALLOWS TO PROPOSE DIVIDEND OF PLN 0.27 PER SHARE EPRA NAV/SHARE PLN 8.62 +20% TOTAL PROPERTY 1,624m +23% GROSS MARGIN FROM RENTAL ACTIVITY 86M +10% FFO I 43M +13%
CYPRUS PROPERTY MARKET ΚΥΠΡΙΑΚΗ ΑΓΟΡΑ ΑΚΙΝΗΤΩΝ 2nd. SEMESTER ο ΕΞΑΜΗΝΟ 2013
 1 CYPRUS PROPERTY MARKET ΚΥΠΡΙΑΚΗ ΑΓΟΡΑ ΑΚΙΝΗΤΩΝ 2nd. SEMESTER 2016 1ο ΕΞΑΜΗΝΟ 2013 Established in 1968, DANOS an Alliance member of BNP PARIBAS REAL ESTATE is the leading real estate services company
Sonae Sierra achieved 9% growth in the 1st half of 2017
 Sonae Sierra achieved 9% growth in the 1st half of 2017 Maia Portugal, August 9 th, 2017 Direct Result rises to 30.2 million EBIT reaches 50 million Tenant sales and rents perform positively Successful
Investor presentation 9M 2012 results
 Investor presentation 9M 2012 results Key results: stabilising in Q3 Direct result p/s: 3.05 (-17.6% yoy) Q3: + 0.01 vs Q2 Revaluation portfolio: -4.75% Q3: -0.25% NAV p/s: 63.72 (-12.9% yoy) Q3: +0.4%
Investor Presentation
 Investor Presentation Results 2011 March 2012 Unique investment gateway to emerging markets We initiate, develop and manage long term cash flow generating assets, mainly in Real Estate and Water Infrastructure
GEK TERNA GROUP. Group presentation
 GEK TERNA GROUP Group presentation GEK TERNA Group: Business Divisions Business Divisions Energy Concessions Construction Industrial Real Estate 2 GEK TERNA Group: Overview GEK TERNA is the parent company
LAMDA OLYMPIA VILLAGE S.A.
 LAMDA OLYMPIA VILLAGE S.A. Financial statements for the year ended in accordance with International Financial Reporting Standards («IFRS») These financial statements have been translated from the original
SONAE SIERRA 9M07 RESULTS
 ANNOUNCEMENT SONAE - SGPS, S. A. Head Office: Lugar do Espido, Via Norte, Maia Share Capital: 2,000,000,000.00 Maia Commercial Registry and Fiscal Number 500273170 Sociedade Aberta SONAE SIERRA RESULTS
European Real Estate Market H
 European Real Estate Market H1 2 18 The European Union MACROECONOMIC OVERVIEW 18. Contribution of some Member States to the EU-28 GDP (million euro) Globally, economic growth remains solid, but less synchronized
Sparkassen Immobilien
 Sparkassen Immobilien BUY (unchanged) Target: Euro 8. (unchanged) 3 Sept 21 Price (Euro) 5.2 52 weeks range 6.2 / 4.36 Key Data Country Austria Industry Real Estate Market Segment Prime Market ISIN AT65225
NOI MARGIN FFO EPRA NAV NET DEBT NET LTV 779M +27%
 2015 RESULTS GTC EXECUTES ITS GROWTH STRATEGY NOI MARGIN FFO EPRA NAV NET DEBT NET LTV 75% 38M 779M 522M 39% +100bps +38% +27% -25% -146bps EXECUTION OF THE GROWTH STRATEGY Restructuring and repositioning
IMMOFINANZ GROUP Q1 RESULTS 2012/13 25 September 2012
 IMMOFINANZ GROUP Q1 RESULTS 2012/13 25 September 2012 OVERVIEW: Q1 RESULTS 2011/12 VS. 2012/13 (*) FX effects: Revaluation of properties under construction resulting from foreign exchange effects (EUR
GTC AUGMENTS ACCOMPLISHMENTS THROUGH ACQUISITIONS, DEVELOPMENTS AND ACTIVE ASSET MANAGEMENT 797M
 Q1 2016 RESULTS GTC AUGMENTS ACCOMPLISHMENTS THROUGH ACQUISITIONS, DEVELOPMENTS AND ACTIVE ASSET MANAGEMENT NOI MARGIN FFO EPRA NAV NET DEBT NET LTV 76% 11M 797M 600M 43% +200bps +27% +2% +15% +380bps
GTC EXPANDS COMPANY S OPERATIONS AND DEVELOPMENT AND CONTINUE TO SECURE LONG TERM FINANCING THROUGH NEW BONDS, FINANCING AND REFINANCING ACTIVITY 0.
 H1 2017 RESULTS GTC EXPANDS COMPANY S OPERATIONS AND DEVELOPMENT AND CONTINUE TO SECURE LONG TERM FINANCING THROUGH NEW BONDS, FINANCING AND REFINANCING ACTIVITY EPRA NAV/SHARE FFO I/SHARE EARNINGS/ SHARE
Amer Group shows strong performance in 1Q-2016 with EGP 544 Million consolidated revenues, representing 18% YoY increase.
 Amer Group shows strong performance in 1Q-2016 with EGP 544 Million consolidated revenues, representing 18% YoY increase. AMER.CA On the Egyptian Exchange Amer Group Revenues (1Q-15 vs. 1Q- 16, EGP mn)
Financial Results Q Kari Inkinen, President and CEO Erik Hjelt, CFO Pia Arrhenius, SVP, IR
 Financial Results Q2 2009 Kari Inkinen, President and CEO Erik Hjelt, CFO Pia Arrhenius, SVP, IR Introduction Market review Business overview Financial overview Appendix 2 Overview of reporting segments
HIGHLIGHTS 46M 828M 41M 1,455 22M +310% +5% +10% +14% +6% TOTAL PROPERTY NOI PROFIT BEFORE TAX FFO EPRA NAV H HIGHLIGHTS PORTFOLIO UPDATE
 INTERIM RESULTS FOR THE SIX MONTHS PERIOD ENDED 30 JUNE 2016 HIGHLIGHTS NOI PROFIT BEFORE TAX FFO EPRA NAV TOTAL PROPERTY 41M 46M 22M 828M 1,455 +5% +310% +14% +6% +10% H1 2016 HIGHLIGHTS NOI increased
GEK TERNA GROUP. Group presentation
 GEK TERNA GROUP Group presentation GEK TERNA Group: Business Divisions Business Divisions Energy Concessions Construction Real Estate Supplementary activities (Industrial Products, Quarries) 2 GEK TERNA
Investor Presentation. October, 2016
 Investor Presentation October, 2016 DISCLAIMER This document has been prepared by AEDES SIIQ S.p.A. (the Company ) solely for the purposes of this presentation. This document may not be reproduced or distributed
Growth, performance and roll-out of the strategy
 Bezannes, 20 September 2018 8.00 am 2018 half-year results Growth, performance and roll-out of the strategy International development: acquisition of a prime asset in Spain Successful capital increase:
Corporate. Presentation March 2017
 Corporate www.larespana.com Presentation March 2017 Snapshot 2 First IPO of a Spanish REIT listed on the Spanish Stock Exchange Shareholder Structure Focused on creating both sustainable income and strong
Second quarter & half year results
 Second quarter & half year results 22 August 2011 Platinium Business Park, Warsaw, Poland Highlights Galleria Stara Zagora, Bulgaria 2 Main events 19 Avenue, Belgrade, Serbia Sale of Galeria Mokotów Sale
Q RESULTS BRUSSELS, 23 JULY 2015 WOLFGANG M. NEUMANN, PRESIDENT & CEO KNUT KLEIVEN, DEPUTY PRESIDENT & CFO
 Q2 2015 RESULTS BRUSSELS, 23 JULY 2015 WOLFGANG M. NEUMANN, PRESIDENT & CEO KNUT KLEIVEN, DEPUTY PRESIDENT & CFO Park Inn by Radisson Istanbul Ataturk Airport 1 I Q2-2015 Results Strengthening our position
Sarantis Group Investor & Analyst Conference Call Presentation. Presented by : Kostas Rozakeas CFO & Deputy CEO
 Sarantis Group Investor & Analyst Conference Call Presentation Presented by : Kostas Rozakeas CFO & Deputy CEO H1 2016 July 28 th 2016 Disclaimer This material contains certain forward-looking statements.
Conference Call 1Q 2005 Financial Results. Bologna May 12, 2005
 Conference Call 1Q Financial Results Bologna May 12, December 2004 Agenda KEY POINTS 1Q FINANCIALS APPENDIX 2 KEY POINTS [ xxx ] 3 IGD 1Q05 Key points KEY POINTS Preliminary Acquisition of Mondovicino
Q3&9M 2018 RESULTS FOR THE THREE AND NINE-MONTH PERIODS ENDED 30 SEPTEMBER 2018 HIGHLIGHTS
 GLOBE TRADE CENTRE SA (Incorporated and registered in Poland with KRS No. 61500) (Share code on the WSE: GTC) (Share code on the JSE: GTC ISIN: PLGTC0000037) ("GTC" or "the Company") Q3&9M 2018 RESULTS
2011 first-half earnings
 2011 first-half earnings Bernard Michel Non-executive chairman Christophe Clamageran Chief executive officer Gilles Bonnier Chief financial officer Paris, July 27, 2011 H1 2011 snapshot in mn June 30,
Q RESULTS FOR THE THREE-MONTH PERIOD ENDED 31 MARCH 2017
 Q1 2017 RESULTS FOR THE THREE-MONTH PERIOD ENDED 31 MARCH 2017 HIGHLIGHTS EPRA NAV/SHARE FFO I/SHARE EARNINGS/ SHARE 2.03 +4% Q1 2017 HIGHLIGHTS 0.026 +18% PORTFOLIO UPDATE 0.07 +96% Development profit
LAMDA Development S.A.
 LAMDA Development S.A. Condensed consolidated and company interim financial statements in accordance with International Financial Reporting Standards («IFRS») 1 January G.E.MI.: 3379701000 37 A Kifissias
2017 HALF YEAR 25 JULY 2017
 2017 HALF YEAR RESULTS 25 JULY 2017 Strong financial results and robust balance sheet Driving performance through operational excellence and disciplined capital allocation High quality pipeline of growth
annual financial report
 2016 annual financial report Company profile Our business Europe is a leading real estate development and investment company, operating throughout Central and Eastern Europe, and focusing on the development
European Investment Bulletin
 European Investment Bulletin Spring 2009 Prime yield decompression per sector (yoy) Rents in decline in line with business sentiment 200 CBD offices Warehouses Shopping Centres European average prime office
IMMOFINANZ GROUP Q1-Q3 Results 21 March 2013
 IMMOFINANZ GROUP Q1-Q3 Results 21 March 2013 1 OVERVIEW: Q1-Q3 RESULTS 410.7 352.6 +16.5% Income from Asset Management 62.9 41.6 +51.3% Income from property sales 8.6 52.1-83.6% Income from property development
GUNNEBO INTERIM REPORT JANUARY JUNE 2015
 GUNNEBO INTERIM REPORT JANUARY JUNE 2015 Gothenburg, July 17, 2015 The CEO s comments on the second quarter Order intake increased organically by 14% during the second quarter. Several major orders were
January December 2011 Results
 January December 2011 Results 27 February 2012 Highlights 2011 ASSETS VALUATION As of December 2011, the total asset valuation (GAV) amounted to 4,286 million euro (-4.3% below Dec. 2010), based on market
This financial report has been translated from the original report that has been prepared in the Greek language. Reasonable care has been taken to
 Eurobank Properties REIC SIX MONTH FINANCIAL INFORMATION FOR THE PERIOD ENDED 30 JUNE 2010 This financial report has been translated from the original report that has been prepared in the Greek language.
ASTALDI, NET PROFIT INCREASED BY 16.7% TO EURO 10.2 MLN ORDER BACKLOG OUTREACHES EURO 8.5 BLN
 ASTALDI, NET PROFIT INCREASED BY 16.7% TO EURO 10.2 MLN ORDER BACKLOG OUTREACHES EURO 8.5 BLN Main consolidated data as at March 31, 2008 Total revenues scored Euro 334.1 million, +26.4% on an annual basis
Q3 & 9M 2017 RESULTS FOR THE THREE AND NINE-MONTH PERIOD ENDED 30 SEPTEMBER 2017
 GLOBE TRADE CENTRE SA (Incorporated and registered in Poland with KRS No. 61500) (Share code on the WSE: GTC) (Share code on the JSE: GTC ISIN: PLGTC0000037) ("GTC" or "the Company") Q3 & 9M 2017 RESULTS
FULL YEAR 2006 RESULTS FEBRUARY 8, 2006
 FULL YEAR 26 RESULTS FEBRUARY 8, 26 Cautionary Statement Regarding Forward-Looking Information PAGE 2 This presentation may contain projections or other forward looking statements related to EFG Eurobank
CPI PROPERTY GROUP first-time investment grade rating by Moody s, issuance of Eurobonds and initiation of large-scale refinancing operation
 Press Release Luxembourg, 27 November 2017 CPI PROPERTY GROUP first-time investment grade rating by Moody s, issuance of Eurobonds and initiation of large-scale refinancing operation Capital markets and
IIQ FY 2019 Conference Call
 IIQ FY 2019 Conference Call March 6, 2019 Hosted by: Alejandro Elsztain, IIVP Daniel Elsztain, COO Matías Gaivironsky, CFO Main Events for 6M FY2019 Consolidated Basis Financial Statements Adjusted for
Half Year 2013 Earnings
 Half Year 2013 Earnings August 2, 2013 Presentation Table of contents Introduction & highlights Page A4 by Henri de Castries, Chairman and CEO financial performance by Denis Duverne, Deputy CEO & Gérald
Agenda. 1. Highlights FY 2012 Results. 2. Operational Performance Priorities for Financials. 5. Conclusion
 1MARCH 2013 Legal Disclaimer Information in this presentation may involve guidance, expectations, beliefs, plans, intentions or strategies regarding the future. These forward-looking statements involve
Amer Group shows strong performance in FY-2016 with EGP 2.4 Billion consolidated revenues, representing 32% YoY increase.
 Amer Group shows strong performance in FY-2016 with EGP 2.4 Billion consolidated revenues, representing 32% YoY increase. AMER.CA On the Egyptian Exchange Amer Group Revenues (FY15 - FY 16, EGP mn) 1,846.5
Dubai Real Estate Predictions 2016
 Real Estate Dubai Real Estate Predictions 2016 Following two years of significant capital and rental growth across much of Dubai s real estate market, 2015 marked a slowdown and a return to more stable
Selonda Acquaculture S.A. Consolidated Financial Results for Q1 2007
 Selonda Acquaculture S.A. Consolidated Financial Results for Q1 2007 1. Strong growth in sales and net earnings 2. Recent acquisitions give rise to fry sales and fish 3. Capacity utilization 40,000 tones
Investor Day. October 2016
 Investor Day www.larespana.com October 2016 3 Disclaimer This document has been prepared by Lar España Real Estate SOCIMI, S.A. (the Company ) for information purposes only and it is not a regulated information
CYPRUS PROPERTY MARKET 2 nd SEMESTER 2015
 1 CYPRUS PROPERTY MARKET 2 nd SEMESTER 2015 www.danos.com.cy 2 1. Economic outlook and Real Estate Sector During the year of 2015, Cyprus economy showed signs of stability, with the economy s performance
S IMMO. Target: Euro 6.50 (unchanged) 23 November Price (Euro) weeks range 5.03 / André Hüsemann, CREA Stefan Scharff, CREA
 23 November Price (Euro) weeks range 5.03 / André Hüsemann, CREA Stefan Scharff, CREA") S IMMO BUY (unchanged) Target: Euro 6.50 (unchanged) 23 November 2012 Price (Euro) 4.90 52 weeks range 5.03 / 3.88 Key Data Country Austria Industry Real Estate Market Segment Prime Market ISIN AT0000652250
S IMMO BUY (unchanged) Target: Euro 6.50 (unchanged) 23 November 2012 Price (Euro) 4.90 52 weeks range 5.03 / 3.88 Key Data Country Austria Industry Real Estate Market Segment Prime Market ISIN AT0000652250
GROSS MARGIN FROM RENTAL ACTIVITY 86M +10%
 ANNUAL RESULTS FOR THE YEAR ENDED 31 DECEMBER 2016 HIGHLIGHTS EPRA NAV/SHARE TOTAL PROPERTY GROSS MARGIN FROM RENTAL ACTIVITY FFO I PROFIT FOR THE PERIOD PLN 8.62 1,624m 86M 43M 160M +20% +23% +10% +13%
MANAGEMENT REPORT OF THE BOARD OF DIRECTORS OF AKTOR SA ON THE FINANCIAL STATEMENTS OF THE YEAR ENDED 31 DECEMBER 2014
 MANAGEMENT REPORT OF THE BOARD OF DIRECTORS OF AKTOR SA ON THE CONSOLIDATED AND SEPARATE FINANCIAL STATEMENTS FOR THE YEAR FROM 1 JANUARY TO 31 DECEMBER 2014 AKTOR SA CONSTRUCTION COMPANY 25 ERMOU STR.
Feasibility Study Template. For Real Estate developments
 Feasibility Study Template For Real Estate developments Mail: info@feasibility.pro Web: http://feasibility.pro/ What is a Feasibility Study? Feasibility analysis can mean different things to different
SONAE. INVESTOR PRESENTATION London, European Mid Cap Conference
 SONAE INVESTOR PRESENTATION London, European Mid Cap Conference December 2008 Index 1 2 3 4 Sonae profile Business Portfolio Latest Corporate Developments 9M 2008 Results 1. Sonae Profile \ In a Snap Shot
2016 Annual Results. March 8, la foncière parisienne
 2016 Annual Results March 8, 2017 Content I. Introduction II. Portfolio III. Rental business IV. Financial results V. Outlook 2 2016: key figures EPRA liquidation NAV Rental income Parisian Tertiary Revalued
2013 RESULTS INVESTORS PRESENTATION. 20 March 2014
 2013 RESULTS INVESTORS PRESENTATION 20 March 2014 AGENDA 1. 2013 highlights 3 2. Strategy 7 3. Market overview 9 4. Portfolio overview 12 5. Key financial results 17 6. Additional materials 29 2 2013 HIGHLIGHTS
GEK TERNA GROUP. Group presentation
 GEK TERNA GROUP Group presentation GEK TERNA Group: Business Divisions Business Divisions Energy Concessions Construction Real Estate Supplementary activities (Industrial Products, Quarries) 2 GEK TERNA
S IMMO Annual results for April 2018
 S IMMO Annual results for 2017 05 April 2018 We develop value Attractive properties & real values 1.2m m² space 6.1% Rental yield EUR 1,839,680,000 IFRS Property portfolio 94.8% 73% 27% Occupancy rate
Ascott Residence Trust
 Ascott Residence Trust The Proposed Acquisitions of Serviced Residence Properties in Australia and Japan and Rental Housing Properties in Japan From Interested Persons 1 Extraordinary General Meeting 24
Investor Day April 2010 INVESTMENT STRATEGY. Mr. DAVID DIAZ Corporate Development Director
 Investor Day April 2010 INVESTMENT STRATEGY Mr. DAVID DIAZ Corporate Development Director abertis: Investment strategy 1. An overview of the infrastructure market 2. abertis strategy 3. A robust methodology
9M 2014 Results Presentation November 13, 2014
 9M 2014 Results Presentation November 13, 2014 9M 2014 key facts Sales: Euro 668.4 million +8.1% (+8.8% constant FX) Directly Operated Stores Same Store Sales: +9.4% (vs -5.7% in 9M 13) EBITDA: Euro 46.3
Corporate Presentation
 Corporate Presentation Group Structure 100% 40/50/25% * 100% 100% 100% Construction Energy Production* Concessions Real Estate Mining * 40% participation in TE, 50% ownership in the first plant (HERON
Ministry Of Economy & Finance Special Secretariat of Privitisations. Privatisation Programme Effects in Greek Economy
 Ministry Of Economy & Finance Special Secretariat of Privitisations Privatisation Programme Effects in Greek Economy Introduction The decrease of Government participation in the free market and the better
1H06 Financial Results. Bologna September, 27 th 2006
 1H06 Financial Results Bologna September, 27 th December 2004 Agenda 1H06 SNAPSHOTS INVESTMENTS 1H06 FINANCIAL RESULTS APPENDICES 2 1H SNAPSHOTS [ xxx ] 1H Financial Highlights 1H06 FINANCIALS IGD s 1H06
Autumn Presentation. la foncière parisienne
 Autumn 2017 Presentation I. Background II. Portfolio centered on Paris Central Business District III. Key aspects of TERREÏS Model IV. H1 2017 Results 2 TERREÏS at a glance Property investment company
2018 HALF YEAR 26 JULY 2018
 2018 HALF YEAR RESULTS 26 JULY 2018 H1 2018 Another period of delivery Strong financial results and capital structure Disciplined capital allocation improving portfolio scale and quality, reducing risk
Amer Group shows strong performance in 1Q-2017 with EGP 603 Million consolidated revenues, representing 11% YoY increase.
 Amer Group shows strong performance in 1Q-2017 with EGP 603 Million consolidated revenues, representing 11% YoY increase. AMER.CA On the Egyptian Exchange Amer Group Revenues 1Q16 vs.1q17, EGP mn) 544.3
FY 2005 FINANCIAL RESULTS
 Athens, February 16, 2006 FY 2005 FINANCIAL RESULTS Strong increase in Net Profit by 47.4% to 501m. vs. initial target for 450m. Distribution of 0.90 Dividend Per Share and 2 for 10 bonus shares Rapid