Collective Strength Annual Report
|
|
|
- Winfred Parsons
- 5 years ago
- Views:
Transcription

1 Collective Strength 2013 Annual Report
2 Wajax is a leading Canadian distributor engaged in the sale and service support of mobile equipment, power systems and industrial components. Reflecting a diversified exposure to the Canadian economy, Wajax has three distinct business divisions, which operate through a network of 125 branches across Canada. Wajax s customer base covers core sectors of the Canadian economy, including: construction, industrial/ commercial, transportation, the oil sands, forestry, oil and gas, metal processing and mining. Contents Financial Highlights 1 Our Lines of Business 2 To Our Shareholders 4 Growth Initiatives 6 Wajax Team 14 Health and Safety 16 Message from the Chairman 18 Board of Directors 19 Management s Discussion and Analysis 21 Management s Responsibility for Financial Reporting 44 Independent Auditors Report 44 Consolidated Financial Statements 45 Notes to Consolidated Financial Statements 49 Additional Financial Information 66 Corporate Information 67 Operating Divisions and Branch Listings 68 Forward-Looking Statements and Information This Annual Report, including the accompanying Management s Discussion and Analysis, includes forward-looking statements and information that is based on Wajax s current beliefs, expectations, estimates and assumptions in light of information currently available. Actual results, performance and achievements may differ materially from those anticipated or implied in such forward-looking statements or information. Please see page 21 for a discussion of the risks and uncertainties related to such statements and information.
3 Financial Highlights 2013 REVENUE SOURCE DISTRIBUTION 53 % EQUIPMENT The largest multi-line distributor of mobile equipment in Canada. West 63% Central 18% East 19% 21 % 26 % POWER SYSTEMS One of the largest distributors of diesel engines and transmissions in Canada. West 46% Central 28% East 26% INDUSTRIAL COMPONENTS A leading distributor of industrial products in Canada. West 35% Central 20% East 45% REVENUE (2) ($ millions) BASIC EARNINGS PER SHARE (1)(2) ($) EARNINGS BEFORE INCOME TAXES (1)(2)(4) ($ millions) 1, , , , , For the years ended December 31 (in millions of Canadian dollars, except per share data) 2011 Revenue $ 1,428.5 $ 1,466.0 $ 1,377.1 Net earnings Current assets net of current liabilities, exclusive of funded net debt (3)(4) Funded net debt (3)(4) Shareholders equity Basic earnings per share Cash dividends declared Leverage ratio (4) Weighted average number of shares outstanding 16,737,086 16,699,874 16,629,444 (1) For years prior to 2011, Wajax was an income fund and effectively not subject to income tax. (2) Year 2009 reported under previous Canadian GAAP. (3) Funded net debt includes bank debt, senior notes, bank indebtedness and obligations under finance leases, net of cash. (4) Non-GAAP and Additional GAAP measures, see Management s Discussion and Analysis, page 37. Wajax Corporation 2013 Annual Report / 1

4 Our Lines of Business Equipment Wajax has three distinct business divisions, which operate through a network of 125 branches across Canada. Wajax is a multi-line distributor and each of its divisions represents a number of leading worldwide manufacturers. Our customer base is diversified, spanning construction, industrial/ commercial, transportation, the oil sands, forestry, oil and gas, metal processing and mining Revenue by Geographic Region 2013 Revenue by Market (2) n Western Canada 53% 54% n Eastern Canada* 27% 27% n Central Canada 20% 19% *Includes Quebec and the Atlantic provinces. n Construction 18% 17% n Industrial/Commercial 17% 15% n Transportation 12% 11% n Oil Sands 10% 10% n Forestry 9% 8% n Oil and Gas 8% 10% n Metal Processing 8% 8% n Mining 7% 11% n Government and Utilities 6% 6% n Other 5% 4% (1) Total revenue and total earnings before financial costs and income taxes exclude segment eliminations. (2) Certain 2012 revenues have been reclassified to conform with current year classifications. The largest multi-line distributor of mobile equipment in Canada. 35 branches. 983 employees. 53% of total revenue and 60% of total earnings before finance costs and income taxes. (1) BUSINESS Distribution, rental, modification and servicing of mobile equipment from leading manufacturers. PRODUCTS Excavators, articulated dump trucks, lift trucks, mining trucks and shovels, forest harvesting equipment, utility equipment, loader backhoes, container handlers, cranes (including crawler and rough terrain cranes), skid steer loaders and wheel loaders. MAJOR VENDORS Hitachi, Hyster, Tigercat, JCB, Telelect/Terex, Palfinger and Bell Revenue by Market (2) n Construction 31% 29% n Oil Sands 15% 15% n Industrial/Commercial 13% 10% n Forestry 11% 10% n Transportation 8% 7% n Mining, Oil and Gas (excluding Oil Sands) 7% 14% n Government and Utilities 5% 5% n Other 10% 10% 2 / Wajax Corporation 2013 Annual Report
 A leading distributor of industrial products in Canada. 63 branches. 810 employees.")
 BUSINESS Distribution, rental and servicing of engines, transmissions and generators for on-highway, offhighway and electric power generation applications.")

5 Power Systems Industrial Components One of the largest distributors of diesel engines and transmissions in Canada. 27 branches. 948 employees. 21% of total revenue and 21% of total earnings before finance costs and income taxes. (1) A leading distributor of industrial products in Canada. 63 branches. 810 employees. 26% of total revenue and 19% of total earnings before finance costs and income taxes. (1) BUSINESS Distribution, rental and servicing of engines, transmissions and generators for on-highway, offhighway and electric power generation applications. BUSINESS Distribution, servicing, custom design and assembly of industrial components for in-plant customers and original equipment manufacturers. PRODUCTS Diesel and natural gas engines, transmissions and power generators. PRODUCTS Bearings, power transmission parts, mill and safety supplies, hydraulic pumps, motors, actuators, controls and hoses, process pumps, filtration and instrumentation. MAJOR VENDORS MTU, DDC, Allison and Reliabuilt. MAJOR VENDORS Eaton, SKF, Schaeffler, Timken, ABB, Moyno and 3M Revenue by Market 2013 Revenue by Market n On-Highway Transportation 32% 27% n Industrial/Commercial 21% 18% n Oil and Gas 19% 26% n Oil Sands 8% 7% n Mining 6% 9% n Other 14% 13% n Industrial/Manufacturing 17% 16% n Forestry 14% 13% n Mining 13% 14% n Metal Processing 11% 12% n Oil and Gas 10% 13% n Construction 6% 6% n Food and Beverage 6% 5% n Transportation 5% 4% n Oil Sands 1% 1% n Other 17% 16% Wajax Corporation 2013 Annual Report / 3

6 Wajax s Senior Management Team: Mark Foote, President and CEO; Brian Dyck, Senior Vice President, Wajax Equipment; Richard Plain, Senior Vice President, Wajax Power Systems; Steve Deck, Senior Vice President, Wajax Industrial Components; John Hamilton, Senior Vice President, Finance and CFO; Katie Hunter, Senior Vice President, Human Resources. To Our Shareholders At Wajax, we are confident in our strategy. We have continued to invest in the strategic initiatives that are important to our growth despite the temporary interruption caused by weakness in the mining and oil and gas markets. We are pleased with the progress we have made across a wide range of objectives. In addition to moving forward in our growth initiatives, we improved our leading health and safety indicators; secured additional financing that will be valuable to our future growth and managed our assets and expenses prudently. Our net earnings in 2013 were $47.7 million. Compared to the record net earnings we achieved in 2012, we declined $18.2 million or 28%. While an initial increase in quoting activity led to some optimism during the first quarter, weakening in key end markets became apparent in the second. It was this trend that led to our decision in May to reduce our monthly dividend to $0.20 per share (a 26% reduction), a payout we maintained through the balance of the year. Approximately 80% of our decline in net earnings is attributable to lower sales to customers in the mining and oil and gas markets. Our sales to these markets have historically been very important to our results, representing roughly one third of our total business and affecting each of our business segments. In mining, customers lowered capital and maintenance spending in response to uncertain commodity markets. Our results in mining were further affected by the full year impact of the loss of Letourneau distribution rights (which were terminated in June 2012). In oil and gas, we continued to experience lower new equipment demand and utilization rates which affected equipment, parts and service sales. Wajax has long-standing credibility in mining, the oil sands and in the conventional oil and gas business. We are committed to building our capabilities and achieving growth in these important markets despite the current challenges. Together with our major manufacturing partners, we are bringing products to market that will help us gain market share and grow as market conditions improve. As importantly, we are working to increase our range of aftermarket services targeting these markets which will help us offset some of the effect of negative equipment demand cycles when they occur. Despite the weakness in some of our key end markets, we have continued to invest in the strategic initiatives that are important to our growth. We are pleased with the progress that we made in 2013: In our Equipment segment, we achieved gains in our core equipment product categories of construction (up 6%), forestry (up 22%) and material handling (up 6%) which partially offset lower mining equipment sales (down 57%). We also achieved strong gains in parts and service which increased 10%. Included in the total parts and service gain is a 16% increase in mining aftermarket sales which continued to grow due to higher Hitachi product support and continued growth in Rotating Products, our oil sands mining services business (where parts and service sales were up 75%). In our Power Systems segment, where the brunt of the oil and gas market softness was felt, our team took major steps forward by restructuring our leadership to improve our growth and operational performance. Included in these changes was the creation of the national Electrical Power Generation (EPG) team a business we continue to invest in and where we are committed to growth. Power 4 / Wajax Corporation 2013 Annual Report
7 Wajax has long-standing credibility in mining, the oil sands and in the conventional oil and gas business. We are committed to building our capabilities and achieving growth in these important markets despite the current challenges. Systems also achieved a 5% increase in our onhighway parts and service business under tough market conditions. In our Industrial Components segment, our team held their volumes essentially flat year-over-year (down 5% excluding acquisitions made in 2012). Approximately 80% of the decline in earnings in this segment was driven by lower product gross margins resulting from a higher proportion of sales in lower margin categories in a very competitive market. Higher margin categories such as hydraulics and process components have been negatively affected by weaker oil sands and oil and gas demand with sales volume shifting to lower margin, more commoditized products. In 2013, we initiated Sourcepoint Industrial, our alliance with Kaman Industrial Technologies, to jointly build our business with North American industrial components contract customers. As Sourcepoint ramps-up, it will be a valuable asset in protecting and growing our contract volume. With respect to 2014, our expectation is that market conditions will be similar to our experience of Our focus is on four areas: We will continue to invest in the base business and new opportunity strategic plan growth initiatives, which are more fully outlined in the pages that follow. We have identified expense reduction opportunities that help to offset our planned investment in growth initiatives. We are committed to cautious management of our total expenses. Our leverage remains above our target range and is an ongoing management focus. In addition to the balance between current earnings and investment in growth, our inventory and asset base is being carefully managed. We will continue to invest in improving the environment we create for our team of approximately 2,800 technicians, sales, support and leadership personnel. Our investment includes improvements in benefit programs, continued training and development of our sales and technician staff and most importantly, our health and safety program. This report includes additional information on our team environment and the advancements we are making in health and safety where we are dedicated to making sure everyone goes home safely at the end of every shift. Our senior leadership group receives strong support from our entire team and from our Board of Directors. We are enthusiastic about the growth opportunities we have and we are undeterred by current conditions. The strength of our team is evidenced by improved results from our second annual employee survey that was completed in December Our team has very significant pride in their work and dedication to the success of our company. We thank them for their hard work. On behalf of the Wajax senior leadership team, Mark Foote President and Chief Executive Officer Wajax Corporation 2013 Annual Report / 5

8 Growth 6 / Wajax Corporation 2013 Annual Report

9 At Wajax, our Collective Strength is based on our team of almost 2,800 sales professionals, technicians, support staff and leaders. We are very proud of the people on our team and the manufacturers we represent. Together, we are focused on profitable growth, driven by two things: Increasing our market share of the products we sell in our core end markets including construction, industrial/commercial, mining, the oil sands, oil and gas, forestry and transportation; and Continuing to grow our aftermarket services by increasing our parts and service revenue to support our current offerings and by creating new aftermarket opportunities through additional programs and vendor relationships On the pages that follow, we have identified important growth initiatives for Wajax. In addition to our core growth priority of increasing market share, these initiatives define our direction, focus and the environment we are creating for our team. Wajax Corporation 2013 Annual Report / 7


, providing us access to products that assist our customers in improving their operations.")
10 Rotating Products YEAR-OVER-YEAR REVENUE GROWTH ($ millions) % Rotating Products year-over-year growth of 82% in total revenue. Growth in this business was a major factor in offsetting a portion of 2013 s weakness in mining equipment sales. Our Rotating Products business in the Equipment segment provides an expanding range of products and maintenance services aimed at oil sands mine operators. Based on our estimates, the size of the applicable oil sands market is approximately $1.8 billion, composed of 71% plant and field services and 29% products, parts and service. We are the sole distributor in the oil sands for leading product manufacturers such as Townley (slurry pumps), ITT Gould (process pumps, systems and support) and AllightPrimax (mine lighting and de-watering systems), providing us access to products that assist our customers in improving their operations. Townley Patented Slurry Pumps: Solving serious wear problems in mining for more than ten years and more recently in oil sands tailings, this simple robust pump design features patented suction, impeller and matching casing, producing a non-turbulent slurry flow through the pump. Customers have enjoyed longer wear life at peak performance and on larger pumps significant energy saving efficiency. Our business grew 82% in 2013 to almost $38 million in total revenue. 79% of our sales were product support and field services related. Growth in this business was a major factor in offsetting a portion of 2013 s weakness in mining equipment sales. This business provides a high proportion of parts and service sales and what we believe is a more stable source of future mining related revenue. In addition to the significant growth opportunity that is available to us in the oil sands, we believe the product and service range we have implemented can be extended to other major mining markets across Canada and over time, to other end markets such as conventional oil and gas. 8 / Wajax Corporation 2013 Annual Report


11 Electrical Power Generation (EPG) Our EPG business in the Power Systems segment is focused on power generation products, services and rental, serving commercial, data center, health care, marine, defense and resource customers. Based on our estimates, the size of the applicable Canadian market is approximately $880 million composed of prime power and standby applications including diesel and natural gas systems. Based on our primary partnership with our manufacturing partner MTU On Site Energy, our strategy is to establish Wajax as one of Canada s leaders in commercial power generation systems. We offer a broad range of products, services and project engineering capabilities to satisfy customer requirements from small standby systems to large prime power projects and cogeneration. In 2013, we took major steps forward in reaching our goal, including building a strong national team of EPG professionals and ramping-up our 68,000 square foot EPG engineering and fabrication facility near Drummondville, Quebec. Our team now includes a broad spectrum of skills drawn from within and outside of Wajax to improve our capabilities in everything from rental to engineering to large project execution. Wajax Delivers One of Four Generators at the Duffin Creek Project: Wajax Power Systems was awarded the emergency standby power system for the Duffin Creek Water Pollution Control Plant in Pickering, Ontario. The scope of supply consisted of 4 x 3MW MTU On-Site generators in custom walk-in enclosures and transition switchgear. Our EPG business contributed $84 million in revenue in We expect solid growth from our EPG business in 2014, including continued expansion of our rental business. Wajax Corporation 2013 Annual Report / 9
 ($ millions) 210.0 2011 Equipment 233.")


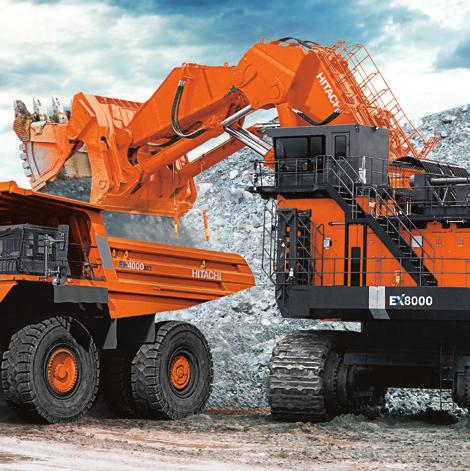
12 Mining Expansion The theme We dig, We haul. That s all. was developed to clearly communicate Hitachi s strength and focus on shovels and mining trucks. By focusing on haulers and shovels, Hitachi puts more design, engineering and expertise into building superior products. MINING REVENUE (1) ($ millions) Equipment (1) Wajax Equipment only Parts and Service Our Equipment segment s mining business is based on our strong relationship with Hitachi, one of the world s leaders in mining equipment. Our joint strategy is to continue to be a leader in the sales and service of hydraulic shovels and to become a new force in the truck market with a specific focus on the ton range using Hitachi s proprietary electric drive technology. In 2013, our mining equipment sales were down 57% due to weak equipment demand that affected the industry as a whole. Our mining aftermarket performance was excellent, up 16%. We added 4 new shovels to our installed base of mining equipment in In addition, we began an 18-month pilot of 4 new Hitachi EH5000 AC3 320 ton trucks in the oil sands in October. While we expect the mining equipment market to remain difficult in 2014, we are confident that we will continue to achieve strong market share in the hydraulic shovel market and progress with our strategy to grow in the mining truck market. Getting our units into the field creates a very important future aftermarket revenue stream given the high parts and service requirements of this equipment. Mining Parts and Service yearover-year growth of 16% in total revenue. While mining equipment demand shifts from year to year, mining parts and service provides a more consistent revenue base that can grow despite negative equipment cycles. 10 / Wajax Corporation 2013 Annual Report


13 Oil and Gas Wajax has a long history in the oil and gas industry. In Power Systems, our engines and transmissions power drilling rigs, mud pumps and well stimulation equipment. In Industrial Components, our hydraulic and process systems play an important role in the manufacturing and operation of a wide range of oil and gas equipment. We represent some of the world s leading manufacturers to the oil and gas industry including MTU, Detroit Diesel, Allison, Eaton, Parker and Moyno. In 2013, our revenue from oil and gas customers was negatively affected by lower equipment and service demand. Looking forward, we are confident we are well-positioned to grow this important part of our business through new product, and the introduction of an expanded range of maintenance and repair services that focus on the joint capabilities of our Power Systems and Industrial Components segments. The new MTU Series Built to Frac. The new Series 4000 Tier 4 Final. MTU has introduced the only frac engine that meets Tier 4 standards without after-treatment. Built specifically for tough fracking conditions and delivering 2,250-3,000 bhp, this powerful engine achieves lower emissions and up to 5% improved fuel efficiency (compared to the Tier 2 engine). Our ReNew program is an example of our expanded range of maintenance and repair services. This program offers customers full power unit refurbishment services for their existing equipment at a cost well below that of full replacement. This program and others under development provide excellent value to customers and help to improve our aftermarket revenue from the oil and gas industry, lowering our sensitivity to negative equipment demand cycles. Power Unit ReNew Program is a cost effective option to extend the life of existing equipment at a cost well below full replacement. We take the complete power unit and refurbish all components, returning it to a state that will provide years of dependable service, backed by Wajax s one year warranty. Wajax Corporation 2013 Annual Report / 11

, achieved an excellent 10% increase in 2013 in parts and service with significant gains")
14 Parts and Service 10 % growth Wajax Equipment parts and service year over year revenue growth. 5 % growth Wajax Power Systems onhighway parts and service year over year revenue growth. Our parts and service business is a key driver of our revenue and profitability and the opportunity to participate in aftermarket services is a key criteria when deciding whether to represent new products. Markets such as construction, mining, forestry and oil and gas give us the opportunity to convert our product market share into future high margin parts and service revenue. Our Equipment segment, where parts and service typically represents over 30% of total revenue (38% in 2013), achieved an excellent 10% increase in 2013 in parts and service with significant gains made in the core categories of construction, forestry, mining and crane/utility. These gains are reflective of significant efforts to increase the installed base of equipment and improve shop and field operations through investments in training, systems and operational productivity measures. Wajax Power Systems is a member of WheelTime, a truck service network providing bumper to bumper truck care consisting of more than 200 member locations across Canada and the United States. Our Power Systems segment, where parts and service typically represents over 60% of total revenue (65% in 2013), achieved strong gains in parts and service revenue in the competitive on-highway transportation market, increasing revenue by 5%. Wajax is the largest service network for Detroit Diesel and Allison Transmission equipped vehicles in Canada. We are also part of the Wheel Time North American distributor network that is working together to achieve higher sales through growing the range of parts and service offerings targeting independent operators, fleets and other operators of large on-highway commercial vehicles. We will continue to invest in training, systems and infrastructure to support our aftermarket business and the over 900 technicians and almost 700 parts and service support staff who are a critical part of the Wajax team. 12 / Wajax Corporation 2013 Annual Report


15 Engineering and Repair Services Our Industrial Components segment competes in a generally non-exclusive distribution business where differentiation is based on customer relationships, industry expertise and increasingly, on aftermarket services that provide engineering, design, fabrication, testing and repair services. These value-added services are important to our growth, provide improved margins and create a stronger relationship with our customers. We estimate the size of the applicable engineering and repair service market in Canada at approximately $1.4 billion. We see excellent growth potential by strengthening our position in hydraulics related services and introducing expanded engineering and repair services in bearings and power transmission, process pumps and instrumentation. Tuck-under acquisitions are expected to play a role in the expansion of our engineering and repair services strategy given the generally fragmented nature of the industry. Wajax Employees Providing Engineering and Repair Services to Refurbish Hydraulic Booms at Bombardier: The project was to refurbish six, sixty foot hydraulic booms used at Bombardier to accommodate the new C series aircraft. The project involved structural reinforcement of the base and boom, redesigning an improved operator basket and integrating new operator controls with additional safety features. Wajax Corporation 2013 Annual Report / 13


16 Wajax Team EVERY VOICE COUNTS Every Voice Counts is our tag line that supports our annual employee opinion survey and the employee communication meetings. At Wajax, the opinions and suggestions of our almost 2,800 team members count. That is evidenced by the results of our second annual employee opinion survey that captured the feedback of nearly 80% of our team in late The survey showed important improvement in the areas where our team wanted to see it: support for our front line leaders, improved benefits programs and our effectiveness in internal communications. What remains constant is the pride that our team has in Wajax, the quality of our products and services and our dedication to our customers. We are consistently proud of two important factors that our team overwhelmingly states that they will go above and beyond to help Wajax succeed and that we are collectively dedicated to the health and safety of everyone, every day. Wajax Employee Training and Development: Each of our businesses are constantly engaged in ongoing training and development of employees. The knowledge and expertise acquired by our people are fundamental value differentiators in the eyes of our customers. Our annual surveys serve to kick-off team meetings that occur throughout our company to discuss Wajax-wide, division and local issues. We are committed to creating the best and safest environment for our team in the industry, being excellent communicators and to providing strong development opportunities for our sales professionals, technicians, leaders and support teams. 14 / Wajax Corporation 2013 Annual Report


17 96 % of employees said they will go above and beyond to help Wajax. In major employee feedback meetings were held. 89 % of employees said they have the opportunity to demonstrate their skills and abilities to their job. 87 % of employees understand how their work goals are linked to the objectives and strategies of their division.


18 Improvement since the start of the Health and Safety program in 2007: Lost Time Injuries down 80 % Total number of recordable injuries from 2007 to 2013 down 75 % 90 % Average health and safety branch evaluation score in 2013 Number of days lost due to workplace injury from 2007 to 2013 down 68 %


19 Health and Safety The most important responsibility we have is to ensure that every member of our team goes home safely at the end of every shift. We have continued to refine and improve our safety processes in We revised the content of our branch evaluation audit, added higher thresholds for branch evaluation scores and strengthened the connection between health and safety metrics and leadership evaluation. In 2014, we are improving the program further by implementing new health and safety information systems and continuing to strengthen our branch evaluation audit program based on industry best practices. These changes have improved our results on almost all of our leading indicators of health and safety performance including a significant improvement in on-time rectification of safety issues and higher branch evaluation results. We are very confident that the measures we are taking and our continued focus on health and safety will get our lost time injury and incident numbers to where they need to be zero. ON-TIME COMPLETION OF BRANCH EVALUATION CORRECTIVE ACTIONS (%) (3 divisions combined average) ANNUAL BRANCH EVALUATION SCORE (%) (3 divisions combined average) Corrective Actions are treated as a priority and a key in accident prevention. Issues that could result in injury are assigned a timeframe within which they must be corrected. In 2013, 96% of issues identified were corrected on time Branch evaluations audit score increased to 90% in We annually increase the effectiveness of the audit process and the expectations of results. Branch evaluation audit scores are an important leading indicator of health and safety performance. Wajax Corporation 2013 Annual Report / 17

20 Message from the Chairman Market conditions proved challenging during 2013 but Wajax continued to build on its strengths and refine its strategic direction. During the year, Mark and his team continued to execute on Wajax s key strategic initiatives. Although difficult end market conditions, particularly in the mining and oil and gas sectors, have delayed the full realization of this hard work and effort, the Board of Directors remains confident that, as conditions improve, these initiatives will drive Wajax to higher growth, efficiency and sustained shareholder returns. As a Board, we continue to work with senior management to enhance and refine these strategies and to seek out new opportunities for our businesses. The recent implementation by management of a continuous strategic planning process with Board oversight at each of its meetings will further strengthen and advance this goal. In 2013, effective corporate governance continued to be of great concern to public company shareholders everywhere and the Board remained committed to improving its already robust governance practices. We held our first say-on-pay advisory vote with positive results. We also strengthened our ongoing director education program, instituting a regular speaker series featuring noted leaders from industry, banking and finance, and a formal individual director site visit program has been implemented for To ensure the necessary experience and industry knowledge remain on the Board, director J.D. Hole has agreed to the Board s request to stay beyond his planned retirement date and will stand for re-election at the corporation s upcoming Annual Meeting. In the coming year, the Board will increase its focus on proactive planning for director succession to ensure the appropriate mix of skills continues to be present over the long term. We will also continue to monitor the evolving governance landscape with the objective of maintaining a focus on value, accountability and transparency. Wajax s greatest strength of course, is the quality of its people. Throughout the year, senior management, supported by the Board, made great strides in improving employee communications, benefit plans and health and safety programs. We are proud of these efforts and look forward to additional progress in As indicated above and elsewhere in this Annual Report, it was a challenging year. Throughout it all, our dedicated management team and exceptional employees worked tirelessly to offset the effects of our weakened end markets and to ensure Wajax is in a position of strength as conditions improve. On behalf of the Board, I thank them for their commitment and skills. To our customers and vendors, thank you for your continued loyalty and support, and to my fellow directors, thank you for your valuable contributions to Wajax in Paul E. Gagné Chairman of the Board 18 / Wajax Corporation 2013 Annual Report


21 Wajax s Board of Directors: Edward M. Barrett, Robert P. Dexter, Ian A. Bourne, John C. Eby, Paul E. Gagné (Chairman), J.D. Hole, A. Mark Foote, Douglas A. Carty, Alexander S. Taylor. Board of Directors Edward M. Barrett Director since 2006 Mr. Barrett is Chairman and Co-Chief Executive Officer of Barrett Corporation. Ian A. Bourne Director since 2006 Mr. Bourne is a corporate director and the Chairman of SNC-Lavalin Group Inc. Douglas A. Carty Director since 2009 Mr. Carty is a corporate director and the Chairman and Co-Founder of Switzer-Carty Transportation Inc. John C. Eby Director since 2006 Mr. Eby is a corporate director and a Founder and the President of Developing Scholars. A. Mark Foote Director since 2012 Mr. Foote is President and Chief Executive Officer of the Corporation. Paul E. Gagné Director since 1996 Mr. Gagné is a corporate director and the Chairman of the Board of Directors of the Corporation. Robert P. Dexter Director since 1988 Mr. Dexter is Chairman and Chief Executive Officer of Maritime Travel Inc. J.D. Hole Director since 2006 Mr. Hole is a corporate director and the President of J.D. Hole Investments Inc. Audit Committee Human Resources and Compensation Committee Governance Committee Alexander S. Taylor Director since 2009 Mr. Taylor is President, Power Group of SNC-Lavalin Group Inc. Wajax Corporation 2013 Annual Report / 19


22
23 MANAGEMENT S DISCUSSION AND ANALYSIS Management s Discussion and Analysis The following management s discussion and analysis ( MD&A ) discusses the consolidated financial condition and results of operations of Wajax Corporation ( Wajax or the Corporation ) for the year ended December 31, This MD&A should be read in conjunction with the information contained in the Corporation s Consolidated Financial Statements and accompanying notes for the year ended December 31, Information contained in this MD&A is based on information available to management as of March 4, Unless otherwise indicated, all financial information within this MD&A is in millions of Canadian dollars, except share and per share data. Additional information, including Wajax s Annual Report and Annual Information Form, are available on SEDAR at RESPONSIBILITY OF MANAGEMENT AND THE BOARD OF DIRECTORS Management is responsible for the information disclosed in this MD&A and the Consolidated Financial Statements and accompanying notes, and has in place appropriate information systems, procedures and controls to ensure that information used internally by management and disclosed externally is materially complete and reliable. Wajax s Board of Directors has approved this MD&A and the Consolidated Financial Statements and accompanying notes. In addition, Wajax s Audit Committee, on behalf of the Board of Directors, provides an oversight role with respect to all public financial disclosures made by Wajax, and has reviewed this MD&A and the Consolidated Financial Statements and accompanying notes. DISCLOSURE CONTROLS AND PROCEDURES AND INTERNAL CONTROL OVER FINANCIAL REPORTING Wajax s management, under the supervision of its Chief Executive Officer ( CEO ) and Chief Financial Officer ( CFO ), is responsible for establishing and maintaining disclosure controls and procedures ( DC&P ) and internal control over financial reporting ( ICFR ). As at December 31, 2013, Wajax s management, under the supervision of its CEO and CFO, had designed DC&P to provide reasonable assurance that information required to be disclosed by Wajax in annual filings, interim filings or other reports filed or submitted under applicable securities legislation is recorded, processed, summarized and reported within the time periods specified in such securities legislation. DC&P are designed to ensure that information required to be disclosed by Wajax in annual filings, interim filings or other reports filed or submitted under applicable securities legislation is accumulated and communicated to Wajax s management, including its CEO and CFO, as appropriate, to allow timely decisions regarding required disclosure. As at December 31, 2013, Wajax s management, under the supervision of its CEO and CFO, had designed internal control over financial reporting ( ICFR ) to provide reasonable assurance regarding the reliability of financial reporting and the preparation of financial statements for external purposes in accordance with International Financial Reporting Standards ( IFRS ). In completing the design, management used the criteria set forth by the Committee of Sponsoring Organizations of the Treadway Commission ( COSO ) in its 1992 version of Internal Control Integrated Framework. With regard to general controls over information technology, management also used the set of practices of Control Objectives for Information and related Technology ( COBIT ) created by the IT Governance Institute. During the year, Wajax s management, under the supervision of its CEO and CFO, evaluated the effectiveness and operation of its DC&P and ICFR. This evaluation included a risk evaluation, documentation of key processes and tests of effectiveness conducted on a sample basis throughout the year. Due to the inherent limitations in all control systems, an evaluation of the DC&P and ICFR can only provide reasonable assurance over the effectiveness of the controls. As a result, DC&P and ICFR are not expected to prevent and detect all misstatements due to error or fraud. The CEO and CFO have concluded that Wajax s DC&P and ICFR were effective as at December 31, There was no change in Wajax s ICFR that occurred during the three months ended December 31, 2013 that has materially affected, or is reasonably likely to materially affect, Wajax s ICFR. CAUTIONARY STATEMENT REGARDING FORWARD-LOOKING INFORMATION This Annual Report and MD&A contains certain forward-looking statements and forward-looking information, as defined in applicable securities laws (collectively, forward-looking statements ). These forward-looking statements relate to future events or the Corporation s future performance. All statements other than statements of historical fact are forwardlooking statements. Often, but not always, forward Wajax Corporation 2013 Annual Report / 21
24 MANAGEMENT S DISCUSSION AND ANALYSIS looking statements can be identified by the use of words such as plans, anticipates, intends, predicts, expects, is expected, scheduled, believes, estimates, projects or forecasts, or variations of, or the negatives of, such words and phrases or state that certain actions, events or results may, could, would, should, might or will be taken, occur or be achieved. Forward looking statements involve known and unknown risks, uncertainties and other factors beyond the Corporation s ability to predict or control which may cause actual results, performance and achievements to differ materially from those anticipated or implied in such forward looking statements. There can be no assurance that any forward looking statement will materialize. Accordingly, readers should not place undue reliance on forward looking statements. The forward looking statements in this Annual Report and MD&A are made as of the date of this MD&A, reflect management s current beliefs and are based on information currently available to management. Although management believes that the expectations represented in such forward-looking statements are reasonable, there is no assurance that such expectations will prove to be correct. Specifically, this Annual Report and MD&A includes forward looking statements regarding, among other things, our plans for revenue and earnings growth, including planned business and strategic initiatives and their intended outcomes, our objective with respect to the future payment of dividends, our financing and capital requirements, as well as our capital structure, our 2014 outlook regarding market conditions, including the oil and gas and mining markets, some of the challenges to our growth in 2014 and our earnings outlook for the first quarter of 2014, our investment in our strategic and growth initiatives, including the expansion of our aftermarket business, and the management of our total costs, asset base and leverage. These statements are based on a number of assumptions which may prove to be incorrect, including, but not limited to, assumptions regarding general business and economic conditions, the supply and demand for, and the level and volatility of prices for, commodities, financial market conditions, including interest rates, the future financial performance of the Corporation, our costs, market competition, our ability to attract and retain skilled staff, our ability to procure quality products and inventory and our ongoing relations with suppliers, employees and customers. The foregoing list of assumptions is not exhaustive. Factors that may cause actual results to vary materially include, but are not limited to, a deterioration in general business and economic conditions, volatility in the supply and demand for, and the level of prices for, commodities, fluctuations in financial market conditions, including interest rates, the level of demand for, and prices 22 / Wajax Corporation 2013 Annual Report of, the products and services we offer, market acceptance of the products we offer, termination of distribution or original equipment manufacturer agreements, unanticipated operational difficulties (including failure of plant, equipment or processes to operate in accordance with specifications or expectations, cost escalation, unavailability of quality products or inventory, supply disruptions, job action and unanticipated events related to health, safety and environmental matters), our ability to attract and retain skilled staff and our ability to maintain our relationships with suppliers, employees and customers. The foregoing list of factors is not exhaustive. Further information concerning the risks and uncertainties associated with these forward looking statements and the Corporation s business may be found in this MD&A under the heading Risk Management and Uncertainties and in our Annual Information Form for the year ended December 31, 2013, filed on SEDAR. The forward-looking statements contained in this Annual Report and MD&A are expressly qualified in their entirety by this cautionary statement. The Corporation does not undertake any obligation to publicly update such forward-looking statements to reflect new information, subsequent events or otherwise unless so required by applicable securities laws. Readers are further cautioned that the preparation of financial statements in accordance with IFRS requires management to make certain judgments and estimates that affect the reported amounts of assets, liabilities, revenues and expenses. These estimates may change, having either a negative or positive effect on net earnings as further information becomes available, and as the economic environment changes. WAJAX CORPORATION OVERVIEW Wajax s core distribution businesses are engaged in the sale, rental and after-sale parts and service support of mobile equipment, power systems and industrial components through a network of 125 branches across Canada. Wajax is a multi-line distributor and represents a number of leading worldwide manufacturers in its core businesses. Its customer base is diversified, spanning natural resources, construction, transportation, manufacturing, industrial processing and utilities. Wajax s strategy is to grow earnings in all segments through organic growth and tuck-under acquisitions while maintaining a dividend payout ratio of at least 75% of current year net earnings. Planned organic growth initiatives include those that are achieved within the normal scope, resources and markets of each core business, and other growth opportunities that are seen as significant, requiring more effort, planning and resources to achieve. Wajax expects to ensure sufficient capital is available to meet its growth requirements within a conservative capital structure.
25 MANAGEMENT S DISCUSSION AND ANALYSIS ANNUAL CONSOLIDATED RESULTS For the year ended December 31 Revenue $ 1,428.5 $ 1,466.0 Gross profit $ $ Selling and administrative expenses $ $ Earnings before finance costs and income taxes (1) $ 73.7 $ 94.1 Finance costs $ 9.0 $ 4.4 Earnings before income taxes (1) $ 64.7 $ 89.7 Income tax expense $ 17.0 $ 23.8 Net earnings $ 47.7 $ 65.9 Basic earnings per share $ 2.85 $ 3.95 Diluted earnings per share $ 2.81 $ 3.89 Weakness in oil and gas sector activity in western Canada, which started in the third quarter of 2012, continued throughout 2013 as lower new equipment and service requirements resulted in a decline in customer spending. This decline primarily affected the Power Systems and Industrial Components segments in Mining activity, including the oil sands market, was softer than last year as lower commodity prices combined with a lack of financing for new mines influenced customers to take a more cautious approach in making commitments to buy equipment. This factor, coupled with the loss of the LeTourneau mining equipment distribution rights in mid-2012, resulted in lower annual mining equipment revenue Revenue by Geographic Region Western Canada 53% Eastern Canada* 27% Central Canada 20% Western Canada 54% Eastern Canada* 27% Central Canada 19% * Includes Quebec and the Atlantic provinces. Revenue by Segment Equipment 53% Power Systems 21% Industrial Components 26% Equipment 53% Power Systems 23% Industrial Components 24% EBIT (1) by Segment Equipment 60% Power Systems 21% Industrial Components 19% Equipment 54% Power Systems 25% Industrial Components 21% Revenue by Market (2) Construction 18% Industrial/Commercial 17% Transportation 12% Oil Sands 10% Forestry 9% Oil and Gas 8% Metal Processing 8% Mining 7% Government and Utilities 6% Other 5% Construction 17% Industrial/Commercial 15% Transportation 11% Oil Sands 10% Forestry 8% Oil and Gas 10% Metal Processing 8% Mining 11% Government and Utilities 6% Other 4% (1) See the Non-GAAP and Additional GAAP Measures section. (2) Certain 2012 revenues have been reclassified to conform with current year classifications. Wajax Corporation 2013 Annual Report / 23
26 MANAGEMENT S DISCUSSION AND ANALYSIS in the Equipment segment. In addition, mining sector related revenue was lower in the Power Systems and Industrial Components segments. Partially mitigating this was meaningful mining parts and service growth in the Equipment segment during the year, driven by its installed base of Hitachi hydraulic mining shovels and growth from its rotating products initiative in the oil sands market. Net earnings before finance costs and income taxes in 2013 declined $20.4 million compared to last year mainly as a result of an approximately $20.0 million reduction related to the oil and gas and mining markets. Approximately $8.5 million of the decline was attributable to the loss of the LeTourneau product distribution rights. See the Non-GAAP and Additional GAAP Measures section. Revenue Revenue in 2013 of $1,428.5 million decreased 3%, or $37.5 million, from $1,466.0 million in 2012 and included $21.1 million in revenue from ACE Hydraulic and Kaman Canada, two businesses acquired by the Industrial Components segment in the fourth quarter of Equipment segment revenue decreased 2%, or $15.0 million, as lower demand for mining equipment was somewhat offset by strength in the construction and forestry sectors and increased parts and service volumes in western Canada. Power Systems segment revenue decreased 9%, or $28.3 million, due primarily to lower volumes to off-highway oil and gas customers attributable to lower industry activity in western Canada. Segment revenue in Industrial Components increased 1%, or $4.9 million, as the additional revenue contributed by the two businesses acquired in late 2012 was offset somewhat by lower sales in the oil and gas sector in western Canada. Gross profit Lower volumes and gross profit margins were the primary contributors to the $16.4 million, or 5%, decline in gross profit. The gross profit margin percentage decrease to 20.0% from 20.6% last year was mainly attributable to lower parts and service margins partially offset by the positive sales mix impact from a lower proportion of equipment revenues compared to last year. Selling and administrative expenses Selling and administrative expenses increased $4.0 million in the year. Increases included higher costs in the Equipment segment s western Canada operations, operating costs in the Industrial Components segment related to the ACE Hydraulic and Kaman Canada acquisitions in the fourth quarter of 2012 and higher severance costs compared to last year. These increases were somewhat offset by lower annual and mid-term incentive accruals compared to last year. Selling and administrative expenses as a percentage of revenue increased to 14.8% in 2013 from 14.2% in Finance costs Finance costs of $9.0 million increased $4.6 million compared to 2012 due to the cost of higher funded debt levels outstanding and the higher cost of borrowing during the year. The higher cost of borrowing was due to the increased cost of borrowing under the bank credit facility and the Corporation s issuance of $125 million in seven year senior unsecured notes on October 23, See the Funded net debt section below. Income tax expense The Corporation s effective income tax rate of 26.3% in 2013 decreased slightly from 26.5% in Net earnings Net earnings for the year ended December 31, 2013 decreased $18.2 million to $47.7 million, or $2.85 per share, from $65.9 million, or $3.95 per share, in The decrease in net earnings resulted primarily from lower volumes, reduced gross profit margins and higher selling and administrative expenses and finance costs compared to last year. Comprehensive income Comprehensive income of $49.4 million for the year ended December 31, 2013 included net earnings of $47.7 million and other comprehensive income of $1.7 million. The other comprehensive income was mainly attributable to actuarial gains on pension plans of $1.5 million. For the year ended December 31, 2012, comprehensive income of $65.4 million included net earnings of $65.9 million, offset partially by an other comprehensive loss of $0.5 million. Funded net debt Funded net debt of $205.0 million at December 31, 2013 increased $31.3 million compared to $173.7 million at December 31, The increase during the year was mainly due to $24.1 million of cash generated from operating activities being less than dividends paid of $46.0 million, investing activities of $4.0 million and finance lease payments of $3.5 million. The cash generated from operating activities of $24.1 million was negatively impacted by $44.6 million of income taxes paid relating to 2011 and On October 23, 2013, the Corporation issued $125 million of senior unsecured notes (the senior notes ) bearing an annual interest rate of 6.125%, payable semi-annually, and maturing on October 23, The net proceeds of the senior notes were used to repay borrowings under the Corporation s senior secured 24 / Wajax Corporation 2013 Annual Report
27 MANAGEMENT S DISCUSSION AND ANALYSIS bank credit facility (the bank credit facility ) which in turn may be redrawn for general corporate purposes. Effective upon the closing of the senior note offering, the Corporation reduced the total available committed amount of the bank credit facility from $300 million to $250 million. The issuance of the senior notes introduces a longer term fixed rate layer of debt into Wajax s capital structure at a time when interest rates remain historically low. See the Liquidity and Capital Resources section. Dividends For the twelve months ended December 31, 2013 monthly dividends declared totaled $2.68 per share. For the twelve months ended December 31, 2012 monthly dividends declared totaled $3.10 per share. Backlog Consolidated backlog at December 31, 2013 of $155.1 million decreased $29.0 million, or 16%, from $184.1 million at December 31, 2012 on reductions in all segments. The decrease was driven by lower off-highway orders in the Power Systems segment, reduction in oil and gas related orders in the Industrial Components segment and reduced mining related orders in the Equipment segment. Backlog includes the total sales value of customer purchase commitments for future delivery or commissioning. See the Annual Results of Operations section below for further backlog detail by segment. ANNUAL RESULTS OF OPERATIONS Equipment For the year ended December 31 Equipment (1) $ $ Parts and service $ $ Segment revenue $ $ Segment earnings (2) $ 49.0 $ 56.1 Segment earnings margin 6.4% 7.2% (1) Includes rental and other revenue. (2) Earnings before finance costs and income taxes. Revenue by Product Type Market n Construction 38% 35% n Mining/Oil Sands 24% 30% n Material Handling 16% 16% n Forestry 15% 12% n Crane and Utility 7% 7% Revenue decreased 2%, or $15.0 million, to $763.5 million in 2013 from $778.5 million in Segment earnings decreased $7.1 million, to $49.0 million in 2013, compared to $56.1 million in The following factors contributed to the Equipment segment s 2013 results compared to 2012: Equipment revenue decreased $41.8 million with specific year-over-year variances as follows: Forestry equipment revenue increased $16.4 million as strength in the lumber market led to higher market demand for Tigercat and Hitachi forestry equipment in all regions. Construction equipment revenue increased $12.3 million mainly as a result of an increase in JCB equipment volumes in eastern Canada and higher Hitachi excavator and Bell articulated dump truck ( ADT ) volumes in western Canada. These increases were partially offset by decreases in Hitachi excavator sales in central Canada due to lower demand and competitive market pressures. Material handling equipment revenue increased $4.1 million mainly as a result of higher lift truck revenues in western and eastern Canada and the sale of higher dollar value reach stacker units in eastern Canada. Crane and utility equipment revenue decreased $3.6 million attributable to lower crane sales in eastern Canada offset somewhat by higher equipment sales to utility customers in central Canada. Mining equipment sales decreased $71.0 million. Excluding the impact of the loss of the LeTourneau product distribution rights, for which distribution rights were discontinued in mid-2012, mining sales decreased $45.2 million on fewer Hitachi hydraulic mining shovel deliveries. This decrease was offset somewhat by the sale of four Hitachi EH ton mining trucks in Parts and service volumes increased $26.8 million, or 10%, compared to last year. Excluding the effect of the discontinued LeTourneau product distribution rights, parts and service volumes for the year increased $39.3 million, or 15%. The increase was led by higher non-letourneau related mining sector volumes in western Canada, driven by the segment s installed base of Hitachi mining equipment and growth in rotating products, and additional construction and forestry sector volumes. Segment earnings decreased $7.1 million to $49.0 million compared to last year. This was due mainly to the negative impact of the discontinued LeTourneau product distribution rights, on both volumes and gross profit margins, and an increase in selling and administrative expenses. These declines were partially offset by the positive impact on earnings of increased non-letourneau parts and service volumes. For the year ended Wajax Corporation 2013 Annual Report / 25
28 MANAGEMENT S DISCUSSION AND ANALYSIS December 31, 2012, the LeTourneau product distribution rights contributed approximately $8.5 million to the segment s earnings. Selling and administrative expenses increased $3.2 million compared to last year as higher operating costs in western Canada, driven in part by growth in the segment s rotating products group, offset personnel cost reductions in eastern Canada. Backlog of $76.0 million at December 31, 2013 decreased $6.2 million compared to December 31, 2012, due mainly to decreases in mining and material handling backlog offset partially by an increase in crane and utility backlog. The Equipment segment s primary strategic initiatives continue to be centered around leveraging opportunities to grow its Rotating Products group and expanding its mining operations by building on its high quality Hitachi mining hydraulic shovel and truck product line. In addition, the segment will continue to focus on increasing the market share of existing key product lines, improving its aftermarket capabilities across all lines of business and growing its revenue through selected product line extensions, including the Bell ADT line introduced in In 2013, the segment realized an 82% increase in revenue over 2012 from its Rotating Products group in the oil sands. The segment continued to build the necessary infrastructure and organization to sell and service its expanding mining product offering, including the recently expanded Hitachi mining truck line. In 2013 it had initial success in selling four Hitachi 320 ton mining trucks for a commercial trial in the oil sands. In addition, the segment strengthened its sales organization to better support its market share growth objectives and service operations through the execution of targeted marketing plans and the provision of management training and sales execution tools. The focus going forward to further drive the segment s strategy will include the following key initiatives: The Rotating Products group in Fort McMurray will continue to develop its oil sands market and leverage opportunities where it can strengthen its market presence. The segment s main focus is on providing field service labour and marketing high quality and cost effective process, slurry and dewatering system products, parts and services through sole vendor relationships in order to assist and improve customers operations. As the rotating business provides a high proportion of parts and service sales, it is expected to be a more stable source of revenue for the segment in the future. While currently built around the oil sands market in Fort McMurray, the segment expects to establish combined efforts with the Industrial Components segment to begin to capture other opportunities in the mining, conventional oil and gas and municipal markets across Canada. The segment s mining strategy is to continue to be a leader in the sales and service of Hitachi hydraulic mining shovels and to expand its presence in the 170 to 320 ton range of mining trucks with Hitachi s electric drive trucks. The segment will continue to expand its mining operations through enhancement of its sales and service structure in Canada to support new opportunities and the existing installed base of Hitachi equipment. The Equipment segment will continue to focus on growing its aftermarket product support revenue and earnings by improving shop and field operations through investments in training, systems and operational productivity measures. The segment will also work towards increasing its market share in key product lines through the implementation of a structured sales process to identify additional opportunities with existing and new customers. Power Systems For the year ended December 31 Equipment (1) $ $ Parts and service $ $ Segment revenue $ $ Segment earnings (2) $ 17.1 $ 26.1 Segment earnings margin 5.6% 7.9% (1) Includes rental and other revenue. (2) Earnings before finance costs and income taxes. Revenue by Market Market n On-highway Transportation 32% 27% n Industrial/ Commercial 21% 18% n Oil and Gas 19% 26% n Oil Sands 8% 7% n Mining 6% 9% n Other 14% 13% Revenue decreased $28.3 million, or 9%, to $304.0 million in 2013 from $332.3 million in Segment earnings decreased $9.0 million to $17.1 million in 2013 from $26.1 million in The following factors impacted year-over-year revenue and earnings: Equipment revenue decreased $23.8 million, due mainly to lower off-highway sales to oil and gas customers as a result of reduced industry activity in western Canada. In eastern and central Canada, 26 / Wajax Corporation 2013 Annual Report
29 MANAGEMENT S DISCUSSION AND ANALYSIS reduced off-highway sales to mining customers and the military also contributed to the revenue decline. The decrease in revenue was somewhat offset by higher rental volumes in all regions. Parts and service volumes decreased $4.5 million compared to last year as a result of lower sales to off-highway customers on decreased activity in western and central Canada. These decreases were partially offset by increased sales to on-highway customers, primarily in western and central Canada. Segment earnings decreased $9.0 million compared to last year due to the impact of reduced sales activity and higher selling and administrative expenses. Selling and administrative expenses increased $0.7 million due principally to higher occupancy costs and professional fees. Backlog of $45.6 million as of December 31, 2013 decreased $14.8 million compared to December 31, 2012 due primarily to a reduction in off-highway related orders. The Power Systems segment segregates its business into three different categories; On-Highway, Electric Power Generation ( EPG ) and Off-Highway. The On- Highway category includes revenue from the repair and service of on-highway trucks, specialty vehicles and coach, school and transit buses. EPG includes revenue from the distribution, servicing, rental and custom assembly of diesel and gas generators used as standby and prime power in commercial and natural resource applications. The Off-Highway category accounts for the remainder of the business with the majority of revenue derived from the distribution and servicing of mechanical drive systems for oil & gas drilling, fracturing and well servicing and engine sales and service to OEMs and other end use customers. The segment s strategic initiatives are to establish Wajax Power Systems as one of Canada s leaders in commercial EPG and expansion of the segment s success in off-highway mechanical drive systems while maintaining its position in the on-highway parts and service market. Specifics of these initiatives going forward include the following: The primary growth focus of the Power Systems segment is to establish Wajax as one of Canada s leaders in commercial EPG systems through a broad range of available products, services and project engineering capabilities to meet customer requirements from small standby systems to large prime power projects and cogeneration. Customer markets include commercial, data center, health care, marine, defense and resource. During 2013, the segment built a strong national team of EPG professionals with a wide spectrum of skills that improve the segment s management and executional capabilities. In addition, a new 68,000 square foot EPG engineering and fabrication facility near Drummondville, Quebec provides a platform for national product integration. The segment s off-highway business will expand its aftermarket capabilities through new products and the introduction of an expanded range of maintenance and repair services that will focus on leveraging the joint capabilities of the Power Systems and Industrial Components segments in the oil and gas sector. The segment will begin to augment its on-highway engine and transmission business by leveraging its Canada-wide footprint and relationship with Wheel Time, an association of North American distributors. Wheel Time provides the segment with purchasing efficiencies and access to an expanded range of all makes parts for a wide range of on-highway vehicles, expanded marketing and training for additional vehicle services and fleet customer marketing. Industrial Components For the year ended December 31 Segment revenue $ $ Segment earnings (1) $ 15.0 $ 22.1 Segment earnings margin 4.1% 6.1% (1) Earnings before finance costs and income taxes. Revenue by Market Market n Industrial/ Manufacturing 17% 16% n Mining 14% 15% n Forestry 14% 13% n Metal Processing 11% 12% n Oil and Gas 10% 13% n Construction 6% 6% n Food and Beverage 6% 5% n Transportation 5% 4% n Other 17% 16% Revenue increased $4.9 million, or 1%, to $364.9 million in 2013 from $360.0 million in revenue included $21.1 million of revenue from the ACE Hydraulic and Kaman Canada businesses acquired in the fourth quarter of Segment earnings decreased $7.1 million, to $15.0 million, compared to $22.1 million in the previous year. The year-over-year changes in revenue and earnings were a result of the following factors: Wajax Corporation 2013 Annual Report / 27
30 MANAGEMENT S DISCUSSION AND ANALYSIS Bearings and power transmission parts sales increased $9.5 million, or 5%. This was more than accounted for by the Kaman Canada acquisition and increased sales to industrial sector customers in eastern Canada. This increase was offset somewhat by lower sales to mining and metal processing customers in eastern and central Canada and reduced oil and gas sector volumes in western Canada. Fluid power and process equipment products and service revenue decreased $4.6 million, or 3%. The decrease was due mainly to reduced oil and gas sector sales in western Canada offset somewhat by higher construction sector sales in western Canada, transportation sector sales in eastern Canada and revenue from the ACE Hydraulic business. Segment earnings decreased $7.1 million. The positive impact of higher volumes was offset by lower gross profit margins and a $2.8 million increase in selling and administrative expenses. The decline in gross profit margin resulted mainly from product mix and competitive market pressures, primarily in western Canada. The increase in selling and administrative expenses was attributed mainly to operating costs related to the ACE Hydraulic and Kaman Canada acquisitions and higher bad debt and occupancy expenses compared to last year. These increases were offset partially by lower annual incentive accruals compared to last year. Backlog of $33.5 million as of December 31, 2013 decreased $8.1 million compared to December 31, 2012, due mainly to lower fluid power and process equipment related orders in western Canada. Effective March 3, 2014, Steve Deck was appointed to the position of Senior Vice President, Wajax Industrial Components subsequent to the departure of Adrian Trotman. Prior to his appointment Mr. Deck spent the last seven years in senior positions at a mining drilling products and services company. He also has 21 years of experience in industrial distribution in Canada. The primary strategy in the Industrial Components segment is to further expand its engineering and repair services business, including the development of joint opportunities with the Power Systems segment in the oil and gas sector. In addition, the segment will continue to focus on operational efficiencies. Specific initiatives include: The segment will strengthen its position in hydraulics related services and introduce expanded engineering and repair services related to bearings and power transmission parts, process pumps and instrumentation. These value added services are expected to increase revenue, improve margins and create a stronger customer loyalty. Tuck-under acquisitions are expected to play a role given the generally fragmented nature of the industry. Wajax will introduce an expanded range of maintenance and repair services that focus on the oil and gas industry and leverage the joint capabilities of the Power Systems and Industrial Components segments. The Industrial Components segment provides hydraulic and process systems that play an important role in the manufacturing and operation of a wide range of oil and gas equipment. The Power Systems segment provides engines and transmissions that power drilling rigs, mud pumps and fracturing equipment. Increased aftermarket revenue from the oil and gas industry is expected to lower Wajax s sensitivity to new equipment cycles in the future. The segment will also continue to build on operational efficiencies achieved in 2013, including inventory management and supply chain improvements to reduce product procurement and freight costs and lower inventory levels. SELECTED ANNUAL INFORMATION The following selected annual information is audited and has been prepared on the same basis as the 2013 annual audited Consolidated Financial Statements Revenue $ 1,428.5 $ 1,466.0 $ 1,377.1 Net earnings $ 47.7 $ 65.9 $ 63.8 Basic earnings per share $ 2.85 $ 3.95 $ 3.84 Diluted earnings per share $ 2.81 $ 3.89 $ 3.77 Total assets $ $ $ Non-current liabilities $ $ $ 99.9 Dividends declared per share $ 2.68 $ 3.10 $ 2.14 Revenue in 2013 of $1,428.5 million decreased $37.5 million compared to Decreased equipment revenue in the Equipment and Power Systems segments more than offset an increase in parts and service revenue in the Equipment segment and $21.1 million of revenue from the ACE Hydraulic and Kaman Canada acquisitions in the Industrial Components segment. Revenue in 2012 of $1,466.0 million increased $88.9 million compared to 2011 and included $12.6 million of additional revenue from the Harper acquisition completed in May The remaining $76.3 million increase in 2012 over 28 / Wajax Corporation 2013 Annual Report
31 MANAGEMENT S DISCUSSION AND ANALYSIS 2011 was due to increased equipment and parts and service revenue in the Equipment and Industrial Components segments that more than offset declines in the Power Systems segment. Net earnings decreased $16.1 million, or $0.99 per share, from 2011 to The positive impact of higher revenues from 2011 to 2013 was more than offset by lower margins, due to product mix and heightened price competition, increased selling and administrative expenses and higher finance costs driven by higher debt levels and increased costs of borrowing. The $87.1 million increase in total assets between December 31, 2011 and December 31, 2013 included $12.5 million resulting from the acquisitions of ACE Hydraulic and Kaman Canada in The remaining increase is mainly attributable to higher working capital and rental fleet additions in the Equipment segment. The higher working capital investment was to support higher sales activity and inventory to better penetrate the mining and construction markets. Non-current liabilities at December 31, 2013 of $214.2 million increased $114.3 million from December 31, The primarily factor for the increase was a $139.4 million increase in long-term debt to fund working capital requirements, rental fleet additions and the ACE Hydraulic and Kaman Canada acquisitions. This increase was partially offset by an $18.8 million reduction in deferred taxes payable. SELECTED QUARTERLY INFORMATION The following table summarizes unaudited quarterly consolidated financial data for the eight most recently completed quarters. This quarterly information is unaudited but has been prepared on the same basis as the 2013 annual audited Consolidated Financial Statements. Q4 Q3 Q2 Q1 Q4 Q3 Q2 Q1 Revenue $ $ $ $ $ $ $ $ Net earnings $ 12.2 $ 11.6 $ 13.5 $ 10.4 $ 14.2 $ 16.2 $ 18.5 $ 17.1 Net earnings per share Basic $ 0.73 $ 0.69 $ 0.81 $ 0.62 $ 0.85 $ 0.97 $ 1.11 $ 1.03 Diluted $ 0.72 $ 0.68 $ 0.80 $ 0.61 $ 0.84 $ 0.95 $ 1.09 $ 1.01 Quarterly fluctuations in revenue and net earnings are difficult to predict. A normally weaker first quarter for the Equipment segment can be offset by seasonally stronger activity in the oil and gas sector, primarily affecting the Power Systems and Industrial Components segments. As well, large deliveries of mining trucks and shovels and power generation packages can shift the revenue and net earnings throughout the year. A discussion of Wajax s previous quarterly results can be found in Wajax s quarterly MD&A available on SEDAR at CONSOLIDATED FINANCIAL CONDITION Capital Structure and Key Financial Condition Measures December 31 ($millions, except ratio calculations) Shareholders equity $ $ Funded net debt (1) Total capital $ $ Funded net debt to total capital (1) 45.3% 41.8% Leverage ratio (1) (1) See the Non-GAAP and Additional GAAP Measures section. The Corporation s capital structure is managed such that it maintains a relatively low leverage ratio as the Corporation pays dividends to shareholders equal to a significant portion of its earnings. The Corporation s objective is to maintain a leverage ratio between 1.5 times and 2.0 times. However, there may be instances where the Corporation is willing to maintain a leverage ratio outside the range to either support key growth initiatives or fluctuations in working capital levels during changes in economic cycles. See the Funded Net Debt section below. In addition, the Corporation s tolerance to interest rate risk decreases/increases as the Corporation s leverage ratio increases/decreases. At December 31, 2013, $125 million of the Corporation s funded net debt, or 61%, was at a fixed interest rate which is within the Corporation s interest rate risk policy. See the Liquidity and Capital Resources section. Shareholders Equity The Corporation s shareholders equity at December 31, 2013 of $247.2 million increased $5.3 million from December 31, 2012 as earnings exceeded dividends declared during the year. Wajax Corporation 2013 Annual Report / 29
32 MANAGEMENT S DISCUSSION AND ANALYSIS The Corporation s share capital, included in shareholders equity on the balance sheet, consists of: Issued and fully paid common shares as at December 31, 2013 Number Amount Balance at the beginning of the year 16,736,447 $ Rights exercised 7, Balance at the end of the year 16,743,520 $ At the date of this MD&A, the Corporation had 16,743,520 common shares outstanding. Wajax has five share-based compensation plans; the Wajax Share Ownership Plan ( SOP ), the Deferred Share Program ( DSP ), the Directors Deferred Share Unit Plan ( DDSUP ), the Mid-Term Incentive Plan for Senior Executives ( MTIP ) and the Deferred Share Unit Plan ( DSUP ). SOP, DSP and DDSUP rights are issued to the participants and are settled by issuing Wajax Corporation shares on a one-for-one basis. As of December 31, 2013, there were 282,573 ( ,952) SOP, DSP and DDSUP rights outstanding. The cash-settled MTIP and DSUP consist of annual grants that vest over three years and are subject to time and performance vesting criteria. A portion of the MTIP and the full amount of the DSUP grants are determined by the price of the Corporation s shares. Compensation expense for the SOP, DSP and DDSUP is determined based upon the fair value of the rights at the date of grant and charged to earnings on a straight line basis over the vesting period, with an offsetting adjustment to contributed surplus. Compensation expense for the DSUP and the sharebased portion of the MTIP varies with the price of the Corporation s shares and is recognized over the vesting period. Wajax recorded compensation cost of $0.6 million for the year (2012 $3.4 million) in respect of these plans. Funded Net Debt December 31 ($millions) (Cash) bank indebtedness $ (4.2) $ 10.2 Obligations under finance leases Long-term debt Funded net debt $ $ Funded net debt of $205.0 million at December 31, 2013 increased $31.3 million compared to December 31, The increase during the year was due to $24.1 million of cash generated from operating activities being less than: dividends paid of $46.0 million, investing activities of $4.0 million, deferred financing costs of $3.2 million relating to the issuance of the $125 million in senior notes and finance lease payments of $3.5 million. The cash generated from operating activities of $24.1 million was negatively impacted by income taxes paid of $60.3 million comprised of $44.6 million relating to 2011 and 2012 and 2013 income tax installments of $15.7 million. The Corporation s ratio of funded net debt to capital increased to 45.3% at December 31, 2013 from 41.8% at December 31, 2012 driven by the higher funded net debt level. The Corporation s leverage ratio of 2.15 times at December 31, 2013 increased from the December 31, 2012 ratio of 1.55 times due to the combined impact of lower EBITDA for the year and higher funded net debt outstanding. See the Liquidity and Capital Resources and the Non- GAAP and Additional GAAP Measures sections. Financial Instruments Wajax uses derivative financial instruments in the management of its foreign currency and interest rate exposures. Wajax s policy restricts the use of derivative financial instruments for trading or speculative purposes. Significant derivative financial instruments outstanding at the end of the period were as follows: Wajax enters into short-term currency forward contracts to hedge the exchange risk associated with the cost of certain inbound inventory and certain foreign currency-denominated sales to customers along with the associated receivables as part of its normal course of business. As at December 31, 2013, Wajax had contracts outstanding to buy U.S. $31.1 million (December 31, 2012 to buy U.S. $26.5 million and to sell U.S. $11.1 million). The U.S. dollar contracts expire between January 2014 and February 2015, with a weighted average U.S./Canadian dollar rate of Wajax measures derivative instruments not accounted for as hedging items at fair value with subsequent changes in fair value being recorded in earnings. Derivatives designated as effective hedges are measured at fair value with subsequent changes in fair value being recorded in other comprehensive income until the related hedged item is recorded and affects income. The fair value of derivative instruments is estimated based upon market conditions using appropriate valuation models. The carrying values reported in the balance sheet for financial instruments are not significantly different from their fair values. The impact of a change in foreign currency relative 30 / Wajax Corporation 2013 Annual Report
33 MANAGEMENT S DISCUSSION AND ANALYSIS to the Canadian dollar on the Corporation s financial statements of unhedged foreign currency-denominated sales to customers along with the associated receivables and purchases from vendors along with associated payables is not expected to be material. Wajax is exposed to the risk of non-performance by counterparties to short-term currency forward contracts. These counterparties are large financial institutions with a Stable outlook and high shortterm and long-term credit ratings from Standard and Poor s. To date, no such counterparty has failed to meet its financial obligations to Wajax. Management does not believe there is a significant risk of nonperformance by these counterparties and will continue to monitor the credit risk of these counterparties. Contractual Obligations Contractual After Obligations Total < 1 year 1 5 years 5 years Bank debt $ 75.0 $ $ 75.0 $ Senior notes $ $ $ $ Operating leases $ $ 16.8 $ 59.5 $ 25.0 Obligations under finance leases $ 13.3 $ 4.1 $ 9.2 $ Total $ $ 20.9 $ $ The $75.0 million bank debt obligation relates to the long-term portion of the bank credit facility and excludes current bank indebtedness and letters of credit. The senior notes obligation relates to the Corporation s issuance on October 23, 2013 of $125.0 million in senior notes bearing an annual interest rate of 6.125% per annum, payable semi-annually, maturing on October 23, The operating leases relate primarily to contracts entered into for facilities and office equipment. See the Off Balance Sheet Financing section for additional information. The obligations under finance leases relate to certain leased vehicles that have a minimum one year term and are extended on a monthly basis thereafter until termination. Wajax also has contingent contractual obligations where Wajax has guaranteed the resale value of equipment sold ( guaranteed residual value contracts ) or has guaranteed a portion of customer lease payments ( recourse contracts ). These contracts are subject to certain conditions being met by the customer. As at December 31, 2013, Wajax had guaranteed $0.6 million of contracts (2012 $1.2 million) with commitments arising in The commitments made by Wajax in these contracts reflect the estimated future value of the equipment, based on the judgment and experience of management. Wajax has recorded a nominal provision in 2013 (2012 $0.1 million) as an estimate of the financial loss likely to result from such commitments. The above table does not include obligations to fund pension benefits. Wajax sponsors certain defined benefit plans that cover executive employees, a small group of inactive employees and certain employees on long-term disability benefits. The defined benefit plans are subject to actuarial valuations in 2014 and Management does not expect future cash contribution requirements to change materially from the 2013 contribution level of $0.4 million as a result of these valuations or any declines in the fair value of the defined benefit plans assets. Off Balance Sheet Financing Off balance sheet financing arrangements include operating lease contracts for facilities with various landlords and other equipment related mainly to office equipment. The total obligations for all operating leases are detailed in the Contractual Obligations section. At December 31, 2013, the non-discounted operating lease commitments for facilities totaled $100.6 million and for other equipment $0.7 million. Although Wajax s consolidated contractual annual lease commitments decline year-by-year, it is anticipated that existing leases will either be renewed or replaced, resulting in lease commitments being sustained at current levels. In the alternative, Wajax may incur capital expenditures to acquire equivalent capacity. The Equipment segment had $68.9 million (2012 $97.2 million) of consigned inventory on-hand from a major manufacturer at December 31, In the normal course of business, Wajax receives inventory on consignment from this manufacturer which is generally sold to customers or purchased by Wajax. This consigned inventory is not included in Wajax s inventory as the manufacturer retains title to the goods. In the event the inventory consignment program was terminated, Wajax would utilize interest free financing, if any, made available by the manufacturer and/or utilize capacity under its credit facilities. Although management currently believes Wajax has adequate debt capacity, Wajax would have to access the equity or debt markets, or reduce dividends to accommodate any shortfalls in Wajax s credit facilities. See the Liquidity and Capital Resources section. Wajax Corporation 2013 Annual Report / 31
34 MANAGEMENT S DISCUSSION AND ANALYSIS LIQUIDITY AND CAPITAL RESOURCES The Corporation s liquidity is maintained through various sources, including bank and non-bank credit facilities, the senior notes and cash generated from operations. Bank and Non-bank Credit Facilities and Senior Notes On October 23, 2013, the Corporation issued $125 million of senior notes bearing an interest rate of 6.125% per annum, payable semi-annually, maturing on October 23, The senior notes are unsecured and contain customary incurrence based covenants that, although different from those under the bank credit facility described below, are not expected to be any more restrictive than under the bank credit facility. All covenants were met as at December 31, The issuance of the senior notes introduced a longer term fixed rate layer of debt into Wajax s capital structure at a time when interest rates remain historically low. The cost of issuing the senior notes, approximately $3.2 million, is being amortized over the seven year term of the senior notes using the effective interest rate method. Upon the closing of the senior note offering, the Corporation reduced the total available committed amount of the bank credit facility from $300 million to $250 million. The terms of the $250 million bank credit facility include the following: The facility is fully secured, expiring August 12, 2016, and is made up of a $60 million non-revolving term portion and a $190 million revolving term portion. Borrowing capacity is dependent upon the level of inventories on-hand and the outstanding trade accounts receivable. The facility contains customary restrictive covenants including limitations on the payment of cash dividends and the maintenance of certain financial ratios all of which were met as at December 31, Wajax is restricted from the declaration of monthly dividends in the event the Corporation s leverage ratio, as defined in the bank credit facility agreement, exceeds three times. Borrowings bear floating rates of interest at margins over Canadian dollar bankers acceptance yields, U.S. dollar LIBOR rates or prime. Margins on the facility depend on Wajax s leverage ratio at the time of borrowing and range between 1.5% and 3.0% for Canadian dollar bankers acceptances and U.S. dollar LIBOR borrowings, and 0.5% and 2.0% for prime rate borrowings. At December 31, 2013, Wajax had borrowed $75.0 million and issued $6.7 million of letters of credit for a total utilization of $81.7 million of its $250 million bank credit facility. Borrowing capacity under the bank credit facility is dependent on the level of inventories on-hand and outstanding trade accounts receivables. At December 31, 2013, borrowing capacity under the bank credit facility was equal to $250 million. Under the terms of the bank credit facility, Wajax is permitted to have additional interest bearing debt of $15 million. As such, Wajax has up to $15 million of demand inventory equipment financing capacity with three non-bank lenders. At December 31, 2013 Wajax had no utilization of the interest bearing equipment financing facilities. As of March 4, 2014, Wajax s $250 million bank credit facility, along with the additional $15 million of capacity permitted under the bank credit facility should be sufficient to meet Wajax s short-term normal course working capital and maintenance capital requirements. However, Wajax may be required to access the equity or debt markets or reduce dividends in order to fund significant acquisitions and growth related working capital and capital expenditures. Cash Flow The following table highlights the major components of cash flow as reflected in the Consolidated Statements of Cash Flows for the years ended December 31, 2013 and December 31, For the year ended December 31 Change Net earnings $ 47.7 $ 65.9 $ (18.2) Items not affecting cash flow Net change in non-cash operating working capital 17.7 (114.3) Income taxes paid (60.3) (2.4) (57.9) Other cash items (1) (29.5) (33.0) 3.5 Cash generated from (used in) operating activities $ 24.1 $ (39.1) $ 63.2 Cash used in investing activities $ (4.0) $ (16.0) $ 12.0 Cash (used in) generated from financing activities $ (5.7) $ 39.3 $ (45.0) (1) Other cash items includes rental equipment additions, changes in other non-current liabilities and finance costs paid Cash Generated From (Used In) Operating Activities The $63.2 million year over year increase in cash flows generated from operating activities was mainly attributable to an increase in cash generated from changes in non-cash working capital of $17.7 million 32 / Wajax Corporation 2013 Annual Report
35 MANAGEMENT S DISCUSSION AND ANALYSIS in 2013 as compared to a use of working capital of $114.3 million in 2012, offset mostly by significantly higher income taxes paid of $57.9 million and reduced earnings of $18.2 million. (Income taxes paid during the year of $60.3 million were comprised of $44.6 million related to 2011 and 2012 income taxes and 2013 income tax installments of $15.7 million.) Significant components of non-cash operating working capital, along with changes for the years ended December 31, 2013 and December 31, 2012 include the following: Changes in Non-cash Operating Working Capital (1) For the year ended December 31 Trade and other receivables $ 6.6 $ (17.1) Inventories (2.8) (39.0) Prepaid expenses Accounts payable and accrued liabilities 13.3 (58.9) Provisions (0.5) (0.3) Total Changes in Non-cash Operating Working Capital $ 17.7 $ (114.3) (1) Increase (decrease) in cash flow. Significant components of the changes in noncash operating working capital for the year ended December 31, 2013 compared to the year ended December 31, 2012 are as follows: Trade and other receivables decreased $6.6 million in 2013 compared to an increase of $17.1 million in The decrease in 2013 was mainly attributable to the collection of a large mining equipment receivable in the Equipment segment partially offset by an increase in the Power Systems segment due principally to a large power generation receivable. The increase in 2012 was attributable to a significant increase in the Equipment segment, related to a large mining equipment delivery and increased sales activity. This increase was partially offset by reductions in the Power Systems and Industrial Components segments due to lower sales activity in the fourth quarter of Inventories increased $2.8 million in 2013 compared to an increase of $39.0 million in The increase in 2012 was due principally to a $35.4 million increase in mining equipment (trucks and shovels) in the Equipment segment. Accounts payable and accrued liabilities increased $13.3 million in 2013 compared to a decrease of $58.9 million in The increase in 2013 resulted primarily from higher trade payables in the Industrial Components segment. The decrease last year was due primarily to reductions in the Equipment segment, attributable to lower trade payables and customer deposits related to mining equipment, and lower deferred income and inventory related trade payables in the Power Systems segment. Reductions in annual and mid-term incentive accruals also contributed to the decrease in Investing Activities For the year ended December 31, 2013, Wajax invested $3.9 million in property, plant and equipment additions, net of disposals, and $0.1 million in intangible asset additions, compared to $5.7 million and $0.2 million for the year ended December 31, 2012, respectively. In addition, the Industrial Components segment invested a total of $10.1 million during 2012 for the acquisition of the shares of ACE Hydraulic on October 22, 2012 and the assets of Kaman Canada on December 31, Financing Activities The Corporation used $5.7 million of cash from financing activities in 2013 compared to $39.3 million of cash generated in Financing activities in the year included senior note proceeds of $125.0 million offset by bank credit facility repayments of $78.0 million, dividends paid to shareholders totaling $46.0 million, finance lease payments of $3.5 million and deferred financing costs of $3.2 million related to the issuance of the senior notes. The net proceeds of the senior notes were used to repay borrowings under the Corporation s senior secured bank credit facility. DIVIDENDS Dividends to shareholders for the periods January 1, 2013 to December 31, 2013 and January 1, 2012 to December 31, 2012 were declared as follows: Month (1) Per Share Amount Per Share Amount January $ 0.27 $ 4.5 $ 0.20 $ 3.3 February March April May June July August September October November December Total dividends for the years ended December 31 $ 2.68 $ 44.9 $ 3.10 $ 51.8 (1) The Corporation s monthly dividends were generally payable to shareholders of record on the last business day of each calendar month and were paid on or about the 20th day of the following month. Wajax Corporation 2013 Annual Report / 33
36 MANAGEMENT S DISCUSSION AND ANALYSIS For the year ending December 31, 2013, Wajax declared dividends to shareholders totaling $2.68 per share. For the year ending December 31, 2012, Wajax declared dividends to shareholders totaling $3.10 per share. Dividends declared in 2013 of $44.9 million exceeded cash generated from operating activities of $24.1 million due to $44.6 million of income taxes paid in 2013 relating to 2011 and The Corporation declared monthly dividends of $0.20 per share, or $3.3 million, for January, February, March and April of FOURTH QUARTER CONSOLIDATED RESULTS For three months ended December 31 Revenue $ $ Gross profit $ 73.2 $ 73.6 Selling and administrative expenses $ 53.6 $ 53.0 Earnings before finance costs and income taxes (1) $ 19.6 $ 20.6 Finance costs $ 3.1 $ 1.3 Earnings before income taxes (1) $ 16.6 $ 19.3 Income tax expense $ 4.4 $ 5.1 Net earnings $ 12.2 $ 14.2 Basic earnings per share $ 0.73 $ 0.85 Diluted earnings per share $ 0.72 $ 0.84 (1) See the Non-GAAP and Additional GAAP Measures section. The Equipment segment was positively impacted in the quarter by increased demand for forestry equipment, particularly in British Columbia, attributable to higher lumber prices. The Equipment segment also benefitted from a somewhat stronger construction market in the quarter compared to last year. Weakness in oil and gas sector activity in western Canada, which started in the third quarter of 2012, continued in the fourth quarter as declines in customer spending primarily affected the Power Systems and Industrial Components segments. Although mining activity including the oil sands market remained soft, mining sector sales were comparable to last year. Revenue Revenue in the fourth quarter of 2013 increased 7%, or $26.8 million, to $391.7 million, from $364.9 million in the fourth quarter of 2012 and included $4.5 million of revenue from the Kaman Canada business acquired by the Industrial Components segment on December 31, Segment revenue increased 4% in the Industrial Components segment and 8% in each of the Equipment and Power Systems segments on higher equipment volumes. Gross profit Gross profit in the fourth quarter of 2013 decreased $0.4 million as the positive impact of higher volumes was more than offset by a lower gross profit margin percentage compared to the fourth quarter last year. The gross profit margin percentage for the quarter of 18.7% declined from 20.2% in the fourth quarter of 2012 due mainly to lower parts and service margins and a negative sales mix impact from a higher proportion of equipment revenues compared to last year. Selling and administrative expenses Selling and administrative expenses increased $0.6 million in the fourth quarter of 2013 compared to the same quarter last year due mainly to increases in the Industrial Components segment related to the Kaman Canada operations. Selling and administrative expenses as a percentage of revenue decreased to 13.7% in the fourth quarter of 2013 from 14.5% compared to the same quarter of Finance costs Quarterly finance costs of $3.1 million increased $1.8 million compared to the same quarter last year due to the cost of higher funded debt levels outstanding and the higher cost of borrowing during the quarter. The higher cost of borrowing was due to the Corporation s issuance of the senior notes on October 23, 2013 and an increased cost of borrowing under the bank credit facilities. Income tax expense The Corporation s effective income tax rate of 26.3% for the quarter was essentially unchanged from the previous year. Net earnings Quarterly net earnings decreased $2.0 million to $12.2 million, or $0.73 per share, from $14.2 million, or $0.85 per share, in the same quarter of The positive impact of higher volumes was more than offset by higher finance costs, a lower gross profit margin percentage and higher selling and administrative expenses. Comprehensive income Total comprehensive income of $13.8 million in the fourth quarter of 2013 comprised of net earnings of $12.2 million and other comprehensive income of $1.6 million. The other comprehensive income was mainly attributable to actuarial gains on pension plans of $1.5 million. Funded net debt Funded net debt of $205.0 million at December 31, 2013 decreased $20.3 million compared to September 30, The decrease during the quarter was due 34 / Wajax Corporation 2013 Annual Report
37 MANAGEMENT S DISCUSSION AND ANALYSIS to $32.6 million of cash generated from operating activities exceeding dividends paid of $10.0 million, deferred financing costs of $3.0 million relating to the issuance of the senior notes and finance lease payments of $1.6 million. See the Fourth Quarter Cash Flows and Liquidity and Capital Resources sections. Dividends For the fourth quarter ended December 31, 2013 monthly dividends declared totaled $0.60 per share. For the fourth quarter ended December 31, 2012 monthly dividends declared were $0.81 per share. Backlog Consolidated backlog at December 31, 2013 of $155.1 million decreased $49.7 million, or 24%, compared to September 30, 2013 with reductions in all segments. Backlog includes the total retail value of customer purchase orders for future delivery or commissioning. See the Fourth Quarter Results of Operations section for further backlog detail by segment. FOURTH QUARTER RESULTS OF OPERATIONS Equipment For three months ended December 31 Equipment (1) $ $ Parts and service $ 72.4 $ 70.7 Segment revenue $ $ Segment earnings (2) $ 13.4 $ 14.0 Segment earnings margin 6.2% 6.9% (1) Includes rental and other revenue. (2) Earnings before finance costs and income taxes. Revenue in the fourth quarter of 2013 increased $16.4 million, or 8%, to $218.0 million, from $201.6 million in the fourth quarter of Segment earnings for the quarter decreased $0.6 million, to $13.4 million, compared to the fourth quarter of The following factors contributed to the Equipment segment s fourth quarter results compared to the fourth quarter of 2012: Equipment revenue for the fourth quarter increased $14.7 million or 11% with specific year-over-year variances as follows: Forestry equipment revenue increased $10.0 million driven by higher Tigercat equipment volumes in all regions. Construction equipment revenue increased $7.0 million mainly as a result of higher Hitachi excavator volumes, primarily in western Canada, and an increase in JCB equipment volumes in eastern Canada. Mining equipment sales increased $0.8 million. The sale of four Hitachi EH ton mining trucks and increased rotating equipment volumes in western Canada was mostly offset by a decline in Hitachi hydraulic mining shovel sales. Crane and utility equipment revenue increased $0.5 million. Material handling equipment revenue decreased $3.6 million due principally to declines in eastern and central Canada. Parts and service volumes increased $1.7 million or 2%. The increase was led by higher forestry sector volumes in all regions, higher mining sector volumes in western Canada and gains in crane and utility revenue. Segment earnings for the fourth quarter decreased $0.6 million to $13.4 million. The positive impact of higher volumes and a $0.7 million reduction in selling and administrative expenses was more than offset by a lower gross margin percentage due to product mix variances compared to last year. Backlog of $76.0 million at December 31, 2013 decreased $26.6 million compared to September 30, 2013 due primarily to reductions in mining equipment backlog as a result of the delivery of four mining trucks during the quarter. In addition, increases in crane and utility backlog were offset by reductions in construction and forestry backlog during the quarter. Power Systems For three months ended December 31 Equipment (1) $ 35.9 $ 31.5 Parts and service $ 49.5 $ 47.5 Segment revenue $ 85.4 $ 79.0 Segment earnings (2) $ 6.0 $ 5.0 Segment earnings margin 7.0% 6.3% (1) Includes rental and other revenue. (2) Earnings before finance costs and income taxes. Revenue in the fourth quarter of 2013 increased $6.4 million, or 8%, to $85.4 million, compared to $79.0 million in the fourth quarter of Segment earnings for the quarter increased $1.0 million to $6.0 million. The following factors impacted quarterly revenue and earnings compared to last year: Equipment revenue increased $4.4 million, due to higher power generation sales in all regions offset somewhat by lower off-highway sales to oil and gas customers in western Canada and mining customers in central Canada. Wajax Corporation 2013 Annual Report / 35
38 MANAGEMENT S DISCUSSION AND ANALYSIS Parts and service volumes increased $2.0 million compared to last year, mainly attributable to higher sales to on-highway customers in western and central Canada. Segment earnings in the fourth quarter of 2013 increased $1.0 million compared to the same quarter last year as the positive impact of higher volumes was partially offset by a $0.5 million increase in selling and administrative expenses. Backlog of $45.6 million as of December 31, 2013 decreased $17.3 million compared to September 30, 2013 due primarily to a decrease in power generation backlog. Industrial Components For three months ended December 31 Segment revenue $ 89.1 $ 85.3 Segment earnings (1) $ 2.1 $ 3.6 Segment earnings margin 2.4% 4.2% (1) Earnings before finance costs and income taxes. Revenue of $89.1 million in the fourth quarter of 2013 increased $3.8 million, or 4%, from $85.3 million in the fourth quarter of 2012 and included $4.5 million of revenue from the Kaman Canada business acquired on December 31, Segment earnings for the quarter decreased $1.5 million, to $2.1 million. The following factors contributed to the segment s fourth quarter year-over-year results: Bearings and power transmission parts sales increased $3.3 million or 7% which was more than accounted for by the Kaman Canada acquisition. This increase was somewhat offset by reduced volumes to construction customers. Fluid power and process equipment products and service revenue in the fourth quarter of 2013 increased $0.5 million. Segment earnings decreased $1.5 million as the positive impact of higher volumes was offset by lower gross profit margins and a $0.8 million increase in selling and administrative expenses. The decline in gross profit margin resulted mainly from an unfavorable product mix and competitive market pressures primarily in western Canada. The increase in selling and administrative expenses resulted primarily from operating costs related to the Kaman Canada acquisition. Backlog of $33.5 million as of December 31, 2013 decreased $5.8 million compared to September 30, 2013 with most of the reduction related to western and central Canada. FOURTH QUARTER CASH FLOWS Cash Flow The following table highlights the major components of cash flow as reflected in the Consolidated Statements of Cash Flows for the quarters ended December 31, 2013 and December 31, For the quarter ended December 31 Change Net earnings $ 12.2 $ 14.2 $ (2.0) Items not affecting cash flow Net change in non-cash operating working capital 16.8 (25.4) 42.2 Income taxes paid (2.7) (1.9) (0.8) Other cash items (1) (7.4) (5.5) (1.9) Cash generated from (used in) operating activities $ 32.6 $ (8.8) $ 41.4 Cash used in investing activities $ (0.2) $ (10.7) $ 10.5 Cash (used in) generated from financing activities $ (27.6) $ 15.3 $ 42.9 (1) Other cash items includes rental equipment additions, changes in other non-current liabilities and finance costs paid Cash Generated From (Used In) Operating Activities The $41.4 million increase in cash flows generated from operating activities was mainly attributable to an increase in cash generated from changes in non-cash working capital of $16.8 million in 2013 as compared to a use of cash of $25.4 million in Significant components of non-cash operating working capital, along with changes for the quarters ended December 31, 2013 and December 31, 2012 include the following: Changes in Non-cash Operating Working Capital (1) For the quarter ended December 31 Trade and other receivables $ (2.6) $ (6.9) Inventories Prepaid expenses 0.1 (0.7) Accounts payable and accrued liabilities 4.7 (29.6) Provisions Total Changes in Non-cash Operating Working Capital $ 16.8 $ (25.4) (1) Increase (decrease) in cash flow Significant components of the changes in non-cash operating working capital for the quarter ended December 31, 2013 compared to the quarter ended December 31, 2012 are as follows: 36 / Wajax Corporation 2013 Annual Report
39 MANAGEMENT S DISCUSSION AND ANALYSIS Trade and other receivables increased $2.6 million in 2013 compared to an increase of $6.9 million in The increase in 2012 was due to higher sales activity in the Equipment segment reduced somewhat by lower accounts receivable in the Industrial Components on lower sales activity. Inventories decreased $13.7 million in the current year, due to reductions in inventory in the Equipment segment. This compared to a decrease of $8.9 million in 2012 due mainly to decreases in the Equipment segment s inventory and lower stocking levels in Industrial Components. Accounts payable and accrued liabilities increased $4.7 million in 2013 compared to a decrease of $29.6 million in The increase in 2013 resulted primarily from higher inventory trade payables in the Industrial Components segment, offset somewhat by lower inventory trade payables in the Equipment segment. The decrease last year was attributable to lower mining inventory trade payables in the Equipment segment, offset somewhat by higher inventory related trade payables in the Industrial Components segment. Investing Activities During the fourth quarter of 2013, Wajax invested $0.1 million on property, plant and equipment additions, net of disposals, compared to $0.6 million in the fourth quarter of In addition, the Industrial Components segment invested a total of $10.1 million in the fourth quarter of 2012 for the acquisition of the shares of ACE Hydraulic on October 22, 2012 and the assets of Kaman Canada on December 31, Financing Activities The Corporation used $27.6 million of cash in financing activities in the fourth quarter of 2013 compared to $15.3 million of cash generated in the same quarter of Financing activities in the quarter included proceeds on the issuance of senior notes of $125.0 million, offset by bank credit facility repayments of $138.0 million, dividends paid to shareholders totaling $10.0 million, deferred financing costs of $3.0 million related to the issuance of the senior notes and finance lease payments of $1.6 million. The net proceeds of the senior notes were used to repay borrowings under the Corporation s senior secured bank credit facility. NON-GAAP AND ADDITIONAL GAAP MEASURES The MD&A contains certain non-gaap and additional GAAP measures that do not have a standardized meaning prescribed by GAAP. Therefore, these financial measures may not be comparable to similar measures presented by other issuers. Investors are cautioned that these measures should not be construed as an alternative to net earnings or to cash flow from operating, investing, and financing activities determined in accordance with GAAP as indicators of the Corporation s performance. The Corporation s management believes that: (i) these measures are commonly reported and widely used by investors, (ii) the non-gaap measures are commonly used as an indicator of a company s cash operating performance and ability to raise and service debt, and (iii) the additional GAAP measures are commonly used to assess a company s earnings performance excluding its capital and tax structures. Non-GAAP financial measures are identified and defined below: Funded net debt Funded net debt includes bank indebtedness, long-term debt and obligations under finance leases, net of cash. EBITDA Leverage ratio Funded net debt to total capital Net earnings before finance costs, income tax expense, depreciation and amortization. The leverage ratio is defined as funded net debt at the end of a particular quarter divided by trailing 12-month EBITDA. The Corporation s objective is to maintain this ratio between 1.5 times and 2.0 times. Defined as funded net debt divided by total capital. Total capital is the funded net debt plus shareholder s equity. Additional GAAP measures are identified and defined below: Earnings before finance costs and income taxes (EBIT) Earnings before income taxes (EBT) Earnings before finance costs and income taxes, as presented on the Consolidated Statements of Earnings Earnings before income taxes, as presented on the Consolidated Statements of Earnings. Reconciliation of the Corporation s net earnings to EBT, EBIT and EBITDA is as follows: For the twelve months ended December 31 September 30 December Net earnings $ 47.7 $ 49.7 $ 65.9 Income tax expense EBT Finance costs EBIT Depreciation and amortization EBITDA $ 95.3 $ 95.1 $ Wajax Corporation 2013 Annual Report / 37
40 MANAGEMENT S DISCUSSION AND ANALYSIS Calculation of the Corporations funded net debt and leverage ratio is as follows: December 31 September 30 December Bank indebtedness $ (4.2) $ 0.6 $ 10.2 Obligations under finance leases Long-term debt Funded net debt (1) $ $ $ Leverage ratio (1)(2) (1) See the Non-GAAP and Additional GAAP Measures section. (2) Calculation uses trailing four-quarter EBITDA and finance costs. CRITICAL ACCOUNTING ESTIMATES The preparation of the consolidated financial statements in conformity with IFRS requires management to make judgements, estimates and assumptions that affect the application of accounting policies and the reported amounts of assets, liabilities, revenue and expenses. Actual results could differ from those judgements, estimates and assumptions. Note 3 to the annual Consolidated Financial Statements describes the significant accounting policies and methods used in preparation of the annual Consolidated Financial Statements. The Corporation bases its estimates on historical experience and various other assumptions that are believed to be reasonable in the circumstances. The key assumptions concerning the future and other key sources of estimation uncertainty that have a significant risk of resulting in a material adjustment to the carrying amount of assets and liabilities within the next fiscal year are as follows: Allowance for doubtful accounts The Corporation is exposed to credit risk with respect to its trade and other receivables. However, this is somewhat minimized by the Corporation s large customer base which covers most business sectors across Canada. The Corporation follows a program of credit evaluations of customers and limits the amount of credit extended when deemed necessary. The Corporation maintains provisions for possible credit losses, and any such losses to date have been within management s expectations. The provision for doubtful accounts is determined on an account-by-account basis. The $1.7 million provision for doubtful accounts at December 31, 2013 decreased $0.8 million from $2.5 million in 2012 primarily due to a reduction in the Equipment segment. As conditions change, actual results could differ from those estimates. Inventory obsolescence The value of the Corporation s new and used equipment is evaluated by management throughout the year, on a unit-by-unit basis. When required, provisions are recorded to ensure that the book value of equipment is valued at the lower of cost or estimated net realizable value. The Corporation performs an aging analysis to identify slow moving or obsolete parts inventories and estimates appropriate obsolescence provisions related thereto. The Corporation takes advantage of supplier programs that allow for the return of eligible parts for credit within specified time periods. The inventory obsolescence charged to earnings for 2013 was $2.1 million compared to $1.9 million in Goodwill and intangible assets The value in use of goodwill and intangible assets has been estimated using the forecasts prepared by management for the next three years. The key assumptions for the estimate are those regarding revenue growth, gross margin and the level of working capital required to support the business. These estimates are based on past experience and management s expectations of future changes in the market and forecasted growth initiatives. To prepare the value in use calculations, the forecasts are extrapolated beyond the three year period at the estimated long-term inflation rate (2%) and discounted back to present value. The discount rate is based on the Corporation s pre-tax weighted average cost of capital of approximately 11% to reflect a market participant s view of the cash-generating unit. During the year, the Corporation performed impairment tests, based on value in use, of its goodwill and intangible assets with an indefinite life and concluded that no impairment existed in either the goodwill associated with any of Wajax s cashgenerating units ( CGUs ) or the intangible assets with an indefinite life. CHANGES IN ACCOUNTING POLICIES The following new standards have been adopted in the current year: On January 1, 2013, the Corporation adopted the amendments to IFRS 7 Offsetting Financial Assets and Liabilities, which contains new disclosure requirements for financial assets and liabilities that are offset in the statement of financial position or are subject to master netting arrangements or similar arrangements. The impact on the disclosures in the consolidated financial statements from adopting IFRS 7 was not material. 38 / Wajax Corporation 2013 Annual Report
41 MANAGEMENT S DISCUSSION AND ANALYSIS On January 1, 2013, the Corporation adopted IFRS 10 Consolidated Financial Statements, which establishes principles for the preparation and presentation of consolidated financial statements when an entity controls one or more other entities. There was no impact on the consolidated financial statements from adopting IFRS 10. On January 1, 2013, the Corporation adopted IFRS 13 Fair Value Measurement, which defines fair value and sets out a framework for measuring fair value when fair value measurements are required or permitted by other standards. It also requires disclosure of the valuation techniques and inputs for financial instruments measured at fair value. The impact on the disclosures in the consolidated financial statements from adopting IFRS 13 was not material. On January 1, 2013, the Corporation retrospectively adopted IAS 19R Employee Benefits, which requires recognition of actuarial gains and losses immediately in other comprehensive income, the full recognition of past service costs immediately in profit or loss, recognition of the expected return on plan assets in profit or loss to be calculated based on the rate used to discount the defined benefit obligation, and certain additional disclosures. No adjustment to prior years financial statements was necessary. The impact on the current year s consolidated financial statements from adopting IAS 19R was not material. Effective January 1, 2013, the Corporation early adopted Amendments to IAS 36 Impairment of Assets issued by the IASB in May The amendments impacted certain disclosure requirements only and did not have a material impact on the consolidated financial statements. New standards and interpretations not yet adopted The new standards or amendments to existing standards that may be significant to the Corporation set out below are not yet effective for the year ended December 31, 2013 and have not been applied in preparing these consolidated financial statements. As of January 1, 2014, the Corporation will be required to adopt the amendments to IAS 32 Offsetting Financial Assets and Liabilities, which clarifies when an entity has a right to set-off and when a settlement mechanism provides for net settlement or gross settlement. The extent of the impact of adoption of the amendment has not yet been determined. It is currently anticipated that the Corporation will be required to adopt IFRS 9 Financial Instruments, which is the result of the first phase of the IASB s project to replace IAS 39 Financial Instruments: Recognition and Measurement. The mandatory effective date has not been determined. The new standard replaces the current multiple classification and measurement models for financial assets and liabilities with a single model that has only two classification categories: amortized cost and fair value. The Corporation is currently assessing the impact of this standard on its consolidated financial statements. RISK MANAGEMENT AND UNCERTAINTIES As with most businesses, Wajax is subject to a number of marketplace and industry related risks and uncertainties which could have a material impact on operating results and Wajax s ability to pay cash dividends to shareholders. Wajax attempts to minimize many of these risks through diversification of core businesses and through the geographic diversity of its operations. In addition, Wajax has adopted an annual enterprise risk management assessment which is prepared by the Corporation s senior management and overseen by the Board of Directors and Committees of the Board. The enterprise risk management framework sets out principles and tools for identifying, evaluating, prioritizing and managing risk effectively and consistently across Wajax. The following are a number of risks that deserve particular comment: Manufacturer relationships and product access Wajax seeks to distribute leading product lines in each of its regional markets and its success is dependent upon continuing relations with the manufacturers it represents. Wajax endeavours to align itself in long-term relationships with manufacturers that are committed to achieving a competitive advantage and long-term market leadership in their targeted market segments. In the Equipment and Power Systems segments, and in certain cases in the hydraulics and process pumps portion of the Industrial Components segment, manufacturer relationships are governed through effectively exclusive distribution agreements. Distribution agreements are for the most part openended, but are cancellable within a relatively short notification period specified in each agreement. Although Wajax enjoys good relationships with its major manufacturers and seeks to develop additional strong long-term partnerships, a loss of a major product line without a comparable replacement would have a significantly adverse effect on Wajax s results of operations or cash flow. There is a continuing consolidation trend among industrial equipment and component manufacturers. Consolidation may impact the products distributed by Wajax, in either a favourable or unfavourable manner. Consolidation of manufacturers may have a negative impact on the results of operations or cash flow if product lines Wajax distributes become unavailable as a result of the consolidation. Wajax Corporation 2013 Annual Report / 39
42 MANAGEMENT S DISCUSSION AND ANALYSIS Suppliers generally have the ability to unilaterally change distribution terms and conditions or limit supply of product in times of intense market demand. Supplier changes in the area of product pricing and availability can have a negative or positive effect on Wajax s revenue and margins. As well, from time to time suppliers make changes to payment terms for distributors. This may affect Wajax s interest-free payment period or consignment terms, which may have a materially negative or positive impact on working capital balances such as cash, inventories, trade and other payables and bank debt. Economic conditions/business cyclicality Wajax s customer base consists of businesses operating in the natural resources, construction, transportation, manufacturing, industrial processing and utilities industries. These industries can be capital intensive and cyclical in nature, and as a result, customer demand for Wajax s products and services may be affected by economic conditions at both a global or local level. Changes in interest rates, consumer and business confidence, corporate profits, credit conditions, foreign exchange, commodity prices and the level of government infrastructure spending may influence Wajax s customers operating, maintenance and capital spending, and therefore Wajax s sales and results of operations. Although Wajax has attempted to address its exposure to business and industry cyclicality by diversifying its operations by geography, product offerings and customer base, there can be no assurance that Wajax s results of operations or cash flows will not be adversely affected by changes in economic conditions. Commodity prices Many of Wajax s customers are directly and indirectly affected by fluctuations in commodity prices in the forestry, metals and minerals and petroleum and natural gas industries, and as a result Wajax is also indirectly affected by fluctuations in these prices. In particular, each of Wajax s businesses is exposed to fluctuations in the price of oil and natural gas. A downward change in commodity prices, and particularly in the price of oil and natural gas, could therefore adversely affect Wajax s results of operations or cash flows. Growth initiatives, integration of acquisitions and project execution As part of its long-term strategy, Wajax intends to continue growing its business through a combination of organic growth and strategic acquisitions. Wajax s ability to successfully grow its business through organic growth will be dependent on the segments achieving their individual growth initiatives. Wajax s ability to successfully grow its business through acquisitions will be dependent on a number of factors including: identification of accretive new business or acquisition opportunities; negotiation of purchase agreements on satisfactory terms and prices; prior approval of acquisitions by third parties, including regulatory authorities; securing attractive financing arrangements; and integration of newly acquired operations into the existing business. All of these activities associated with growing the business, may be more difficult to implement or may take longer to execute than management anticipates. Further, any significant expansion of the business may increase the operating complexity of Wajax, and divert management away from regular business activities. Any failure of Wajax to manage its growth strategy, including acquisitions, successfully could have a material adverse impact on Wajax s business, results of operations or financial condition. Key personnel The success of Wajax is largely dependent on the abilities and experience of its senior management team and other key personnel. Its future performance will also depend on its ability to attract, develop and retain highly qualified employees in all areas of its business. Competition for skilled management, sales and technical personnel is intense, particularly in certain markets where Wajax competes. Wajax continuously reviews and makes adjustments to its hiring, training and compensation practices in an effort to attract and retain a highly competent workforce. However, there can be no assurance that Wajax will be successful in its efforts and a loss of key employees, or failure to attract and retain new talent as needed, may have an adverse impact on Wajax s current operations or future prospects. Leverage, credit availability and restrictive covenants Wajax has a $250 million bank credit facility which expires August 12, 2016 comprised of a $60 million non-revolving term portion and a $190 million revolving term portion. Wajax also has $125 million of senior notes outstanding bearing an annual interest rate of 6.125%, payable semi-annually, and maturing on October 23, The bank credit facility and senior notes contain restrictive covenants which place restrictions on, among other things, the ability of Wajax to encumber or dispose of its assets, the amount of interest cost incurred and dividends declared relative to earnings and certain reporting obligations. A failure to comply with the obligations of the facility or senior notes could result in an event of default which, if not cured or waived, could require an accelerated repayment of the facility or senior notes. There can be no assurance that Wajax s assets would be sufficient to repay the facility or senior notes in full. 40 / Wajax Corporation 2013 Annual Report
43 MANAGEMENT S DISCUSSION AND ANALYSIS Wajax s short-term normal course working capital requirements can swing widely quarter-to-quarter due to timing of large inventory purchases and/or sales and changes in market activity. In general, as Wajax experiences growth, there is a need for additional working capital as was the case in Conversely, as Wajax experiences economic slowdowns working capital reduces reflecting the lower activity levels as was the case in While management believes the bank credit facility will be adequate to meet the Corporation s normal course working capital requirements, there can be no assurance that additional credit will become available if required, or that an appropriate amount of credit with comparable terms and conditions will be available when the bank credit facility and senior notes mature. Wajax may be required to access the equity or debt markets or reduce dividends in order to fund significant acquisitions and growth related working capital and capital expenditures. The amount of debt service obligations under the bank credit facility will be dependent on the level of borrowings and fluctuations in interest rates to the extent the rate is unhedged. As a result, fluctuations in debt servicing costs may have a detrimental effect on future earnings or cash flow. Wajax also has credit lines available with other financial institutions for purposes of financing inventory. These facilities are not committed lines and their future availability cannot be assured, which may have a negative impact on cash available for dividends and future growth opportunities. Quality of products distributed The ability of Wajax to maintain and expand its customer base is dependent upon the ability of the manufacturers represented by Wajax to improve and sustain the quality of their products. The quality and reputation of such products are not within Wajax s control, and there can be no assurance that manufacturers will be successful in meeting these goals. The failure of these manufacturers to maintain a market presence could adversely affect Wajax s results of operations or cash flow. Government regulation Wajax s business is subject to evolving laws and government regulations, particularly in the areas of taxation, the environment, and health and safety. Changes to such laws and regulations may impose additional costs on Wajax and may adversely affect its business in other ways, including requiring additional compliance measures by Wajax. Insurance Wajax maintains a program of insurance coverage that is ordinarily maintained by similar businesses, including property insurance and general liability insurance. Although the limits and deductibles of such insurance have been established through risk analysis and the recommendation of professional advisors, there can be no assurance that such insurance will remain available to Wajax at commercially reasonable rates or that the amount of such coverage will be adequate to cover all liability incurred by Wajax. If Wajax is held liable for amounts exceeding the limits of its insurance coverage or for claims outside the scope of that coverage, its business, results of operations or financial condition could be adversely affected. Inventory obsolescence Wajax maintains substantial amounts of inventories in all three core businesses. While Wajax believes it has appropriate inventory management systems in place, variations in market demand for the products it sells can result in certain items of inventory becoming obsolete. This could result in a requirement for Wajax to take a material write down of its inventory balance resulting in Wajax not being able to realize expected revenue and cash flows from its inventory, which would negatively affect results from operations or cash flow. Information systems and technology Information systems are an integral part of Wajax s business processes, including marketing of equipment and support services, inventory and logistics, and finance. Some of these systems are integrated with certain suppliers core processes and systems. Any disruptions to these systems due, for example, to the upgrade or conversion thereof, or the failure of these systems to operate as expected could, depending on the magnitude of the problem, adversely affect Wajax s operating results by limiting the ability to effectively monitor and control Wajax s operations. Credit risk Wajax extends credit to its customers, generally on an unsecured basis. Although Wajax is not substantially dependent on any one customer and it has a system of credit management in place, the loss of a large receivable would have an adverse effect on Wajax s profitability. Labour relations Wajax has approximately 2,766 employees. Wajax is a party to thirteen collective agreements covering a total of approximately 339 employees. Of these, two collective agreements covering 56 employees have expired on or before December 31, 2013 and Wajax Corporation 2013 Annual Report / 41
44 MANAGEMENT S DISCUSSION AND ANALYSIS are currently being re-negotiated. Of the remaining eleven collective agreements, four expire in 2014, four expire in 2015, two expire in 2016, and one expires in Overall, Wajax believes its labour relations to be satisfactory and does not anticipate it will be unable to renew the collective agreements. If Wajax is unable to renew or negotiate collective agreements from time to time, it could result in work stoppages and other labour disturbances. The failure to renew collective agreements upon satisfactory terms could have a material adverse impact on Wajax s businesses, results of operations or financial condition. Foreign exchange exposure Wajax s operating results are reported in Canadian dollars. While the majority of Wajax s sales are in Canadian dollars, significant portions of its purchases are in U.S. dollars. Changes in the U.S. dollar exchange rate can have a negative or positive impact on Wajax s revenue, margins and working capital balances. Wajax mitigates certain exchange rate risks by entering into short-term foreign currency forward contracts to fix the cost of certain inbound inventory and to hedge certain foreign-currency denominated sales to customers. In addition, Wajax will periodically institute price increases to offset the negative impact of foreign exchange rate increases on imported goods. The inability of Wajax to mitigate exchange rate risks or increase prices to offset foreign exchange rate increases, including sudden and volatile changes in the U.S. dollar exchange rate, may have a material adverse effect on the results of operations or financial condition of Wajax. A declining U.S. dollar relative to the Canadian dollar can have a negative effect on Wajax s revenue and cash flows as a result of certain products being imported from the U.S. In some cases market conditions require Wajax to lower its selling prices as the U.S. dollar declines. As well, many of Wajax s customers export products to the U.S., and a strengthening Canadian dollar can negatively impact their overall competitiveness and demand for their products, which in turn may reduce product purchases from Wajax. A strengthening U.S. dollar relative to the Canadian dollar can have a positive effect on Wajax s revenue as a result of certain products being imported from the U.S. Wajax will periodically institute price increases to offset the negative impact of foreign exchange rate increases and volatility on imported goods to ensure margins are not eroded. Wajax maintains a hedging policy whereby significant transactional currency risks are identified and hedged. Competition The equipment, power systems and industrial components distribution industries in which Wajax competes are highly competitive. In the Equipment segment, Wajax primarily competes against regional equipment distributors that tend to handle a dedicated product line, such as those offered by John Deere, Komatsu and Caterpillar. There can be no assurance that Wajax will be able to continue to compete on the basis of product quality and price of product lines, distribution and servicing capabilities as well as proximity of its distribution sites to customers. The Power Systems business competes with other major diesel engine distributors representing such products as Cummins and Caterpillar. Competition is based primarily on product quality, pricing and the ability to service the product after the sale. In terms of the Industrial Components segment, the hydraulics and process equipment branches compete with other distributors of hydraulics components and process equipment on the basis of quality and price of the product lines, the capacity to provide customengineered solutions and high service standards. The bearings and power transmission product branches compete with a number of distributors representing the same or competing product lines and rely primarily on high service standards, price and value added services to gain market advantage. There can be no assurance that Wajax will be able to continue to effectively compete. Increased competitive pressures or the inability of Wajax to maintain the factors which have enhanced its competitive position could adversely affect its results of operations or cash flow. Litigation and product liability claims In the ordinary course of its business, Wajax may be party to various legal actions, the outcome of which cannot be predicted with certainty. One category of potential legal actions is product liability claims. Wajax carries product liability insurance, and management believes that this insurance is adequate to protect against potential product liability claims. Not all risks, however, are covered by insurance, and no assurance can be given that insurance will be consistently available, or will be consistently available on an economically feasible basis, or that the amounts of insurance will at all times be sufficient to cover each and every loss or claim that may occur involving Wajax s assets or operations. Guaranteed residual value, recourse and buy-back contracts In some circumstances Wajax makes certain guarantees to finance providers on behalf of its customers. These guarantees can take the form of 42 / Wajax Corporation 2013 Annual Report
45 MANAGEMENT S DISCUSSION AND ANALYSIS assuring the resale value of equipment, guaranteeing a portion of customer lease payments, or agreeing to buy back the equipment at a specified price. These contracts are subject to certain conditions being met by the customer, such as maintaining the equipment in good working condition. Historically, Wajax has not incurred substantial losses on these types of contracts, however, there can be no assurance that losses will not be incurred in the future. See the Contractual Obligations section. Future warranty claims Wajax provides manufacturers and/or dealer warranties for most of the product it sells. In some cases, the product warranty claim risk is shared jointly with the manufacturer. In addition, Wajax provides limited warranties for workmanship on services provided. Accordingly, Wajax has some liability for warranty claims. There is a risk that a possible product quality erosion or a lack of a skilled workforce could increase warranty claims in the future, or may be greater than management anticipates. If Wajax s liability in respect of such claims is greater than anticipated, it may have a material adverse impact on Wajax s business, results of operations or financial condition. Maintenance and repair contracts Wajax frequently enters into long-term maintenance and repair contracts with its customers, whereby Wajax is obligated to maintain certain fleets of equipment at various negotiated performance levels. The length of these contracts varies significantly, often ranging up to five or more years. The contracts are generally fixed price, although many contracts have additional provisions for inflationary adjustments. Due to the long-term nature of these contracts, there is a risk that significant cost overruns may be incurred. If Wajax has miscalculated the extent of maintenance work required, or if actual parts and service costs increase beyond the contracted inflationary adjustments, the contract profitability will be adversely affected. In order to mitigate this risk, Wajax closely monitors the contracts for early warning signs of cost overruns. In addition, the manufacturer may, in certain circumstances, share in the cost overruns if profitability falls below a certain threshold. Any failure by Wajax to effectively price and manage these contracts could have a material adverse impact on Wajax s business, results of operations or financial condition. Environmental factors From time to time, Wajax experiences environmental incidents, emissions or spills in the course of its normal business activities. With the assistance of environmental consultants, Wajax has established environmental compliance and monitoring programs which management believes are appropriate for its operations. To date, these environmental incidents, emissions and spills have not resulted in any material liabilities to the Corporation, however, there can be no assurance that any future incidents, emissions or spills will not result in a material adverse effect on Wajax s results of operations or cash flows. STRATEGIC DIRECTION AND OUTLOOK Revenue associated with the oil and gas sector in western Canada began to decline in the second half of 2012 and continued to be soft throughout This primarily affected the Power Systems and Industrial Components segments as customers continued to limit capital and maintenance spending for exploration and well servicing equipment. Mining activity, including the oil sands, was weak for all three segments as customers reduced spending in the face of generally weaker commodity prices. The Equipment segment partially mitigated lower mining related volumes, which included the impact of the loss of LeTourneau equipment distribution rights in 2012, with a strong performance in parts and service, which increased 10% from the prior year. A major factor in this was a 16% increase in mining related parts and service volume in the segment during 2013, driven by gains in Hitachi product support and rotating products. Most other end markets showed relative stability year-over-year compared to oil and gas and mining. Consequently, the $20.4 million decline in consolidated 2013 earnings before finance costs and income taxes is approximately equal to the year-overyear reduction related to softness in the important oil and gas and mining sectors. Year-end 2013 backlog of $155.1 million was reduced from the prior year and the prior quarter primarily due to the delivery of four Hitachi mining trucks and a number of power generation packages in the fourth quarter. In the current economic environment customers continue to take a cautious approach in making commitments to buy equipment. Looking forward to 2014, management s expectation is that market conditions in 2014 will be similar to those encountered in 2013 and the continuing weakness in the oil and gas and mining markets is expected to create challenges for growth in In particular, management anticipates earnings in the first quarter to be lower than last year. Despite these market conditions, the focus is to continue to invest in strategic initiatives that focus on organic growth and continued expansion of the Corporation s aftermarket business. At the same time, management is cautiously managing total costs, the asset base and leverage. Additional information, including Wajax s Annual Report and Annual Information Form, are available on SEDAR at Wajax Corporation 2013 Annual Report / 43
46 Management s Responsibility for Financial Reporting The consolidated financial statements of Wajax Corporation are the responsibility of management and have been prepared in accordance with International Financial Reporting Standards. Where appropriate, the information reflects management s judgement and estimates based on the available information. Management is also responsible for all other information in the Annual Report and for ensuring that this information is consistent with the consolidated financial statements. Wajax maintains a system of internal control designed to provide financial information and the safeguarding of its assets. Wajax also maintains an internal audit function, which reviews the system of internal control and its application. The Audit Committee of the Board, consisting solely of outside directors, meets regularly during the year with management, internal auditors and the external auditors, to review their respective activities and the discharge of their responsibilities. Both the external and internal auditors have free and independent access to the Audit Committee to discuss the scope of their audits, the adequacy of the system of internal control and the adequacy of financial reporting. The Audit Committee reports its findings to the Board, which reviews and approves the consolidated financial statements. Wajax s external auditors, KPMG LLP, are responsible for auditing the consolidated financial statements and expressing an opinion thereon. Mark Foote President and Chief Executive Officer Mississauga, Canada, March 4, 2014 John J. Hamilton Senior Vice President and Chief Financial Officer Independent Auditors Report TO THE SHAREHOLDERS OF WAJAX CORPORATION We have audited the accompanying consolidated financial statements of Wajax Corporation, which comprise the consolidated statements of financial position as at December 31, 2013 and December 31, 2012, the consolidated statements of earnings, comprehensive income, changes in shareholder equity and cash flows for the years ended December 31, 2013 and December 31, 2012, and notes, comprising a summary of significant accounting policies and other explanatory information. Management s Responsibility for the Consolidated Financial Statements Management is responsible for the preparation and fair presentation of these consolidated financial statements in accordance with International Financial Reporting Standards, and for such internal control as management determines is necessary to enable the preparation of consolidated financial statements that are free from material misstatement, whether due to fraud or error. Auditors Responsibility Our responsibility is to express an opinion on these consolidated financial statements based on our audits. We conducted our audits in accordance with Canadian generally accepted auditing standards. Those standards require that we comply with ethical requirements and plan and perform the audit to obtain reasonable assurance about whether the consolidated financial statements are free from material misstatement. An audit involves performing procedures to obtain audit evidence about the amounts and disclosures in the consolidated financial statements. The procedures selected depend on our judgment, including the assessment of the risks of material misstatement of the consolidated financial statements, whether due to fraud or error. In making those risk assessments, we consider internal control relevant to the entity s preparation and fair presentation of the consolidated financial statements in order to design audit procedures that are appropriate in the circumstances, but not for the purpose of expressing an opinion on the effectiveness of the entity s internal control. An audit also includes evaluating the appropriateness of accounting policies used and the reasonableness of accounting estimates made by management, as well as evaluating the overall presentation of the consolidated financial statements. We believe that the audit evidence we have obtained in our audits is sufficient and appropriate to provide a basis for our audit opinion. Opinion In our opinion, the consolidated financial statements present fairly, in all material respects, the consolidated financial position of Wajax Corporation as at December 31, 2013 and December 31, 2012, and its consolidated financial performance and its consolidated cash flows for the years ended December 31, 2013 and December 31, 2012 in accordance with International Financial Reporting Standards. Chartered Accountants, Licensed Public Accountants Toronto, Canada, March 4, / Wajax Corporation 2013 Annual Report
47 CONSOLIDATED FINANCIAL STATEMENTS Consolidated Statements of Financial Position As at December 31 (in thousands of Canadian dollars) ASSETS Current Cash $ 4,153 $ Trade and other receivables (note 5) 187, ,567 Inventories (note 6) 289, ,185 Income taxes receivable 203 Prepaid expenses 5,980 7,089 Derivative instruments 323 Non-Current 487, ,841 Rental equipment (note 7) 52,285 43,731 Property, plant and equipment (note 8) 49,716 50,700 Intangible assets (note 10) 85,944 87,668 Deferred taxes (note 22) 1,076 2, , ,021 $ 676,953 $ 671,862 LIABILITIES AND SHAREHOLDERS EQUITY Current Bank indebtedness $ $ 10,195 Accounts payable and accrued liabilities (note 13) 201, ,395 Provisions (note 11) 7,011 7,535 Dividends payable 3,349 4,519 Income taxes payable 44,349 Obligations under finance leases (note 9) 4,053 3,611 Derivative instruments 149 Non-Current 215, ,753 Provisions (note 11) 2,939 4,088 Employee benefits (note 12) 5,549 7,160 Other liabilities 624 2,083 Obligations under finance leases (note 9) 9,208 8,192 Long-term debt (note 14) 195, ,701 Shareholders Equity 214, ,224 Share capital (note 17) 106, ,651 Contributed surplus (note 20) 5,058 4,346 Retained earnings 135, ,944 Accumulated other comprehensive income (loss) 113 (56) Total shareholders equity 247, ,885 $ 676,953 $ 671,862 On behalf of the Board: Paul E. Gagné Chairman Douglas A. Carty Director Wajax Corporation 2013 Annual Report / 45
48 CONSOLIDATED FINANCIAL STATEMENTS Consolidated Statements of Earnings For the years ended December 31 (in thousands of Canadian dollars, except per share data) Revenue (note 18) $ 1,428,477 $ 1,466,014 Cost of sales 1,143,082 1,164,199 Gross profit 285, ,815 Selling and administrative expenses 211, ,672 Earnings before finance costs and income taxes 73,663 94,143 Finance costs (note 19) 8,951 4,442 Earnings before income taxes 64,712 89,701 Income tax expense (note 22) 17,027 23,762 Net earnings $ 47,685 $ 65,939 Basic earnings per share (note 23) $ 2.85 $ 3.95 Diluted earnings per share (note 23) $ 2.81 $ 3.89 Consolidated Statements of Comprehensive Income For the years ended December 31 (in thousands of Canadian dollars, except per share data) Net earnings $ 47,685 $ 65,939 Items that will not be reclassified to income Actuarial gains (losses) on pension plans, net of tax expense of $543 (2012 tax recovery of $251) (note 12) 1,545 (683) Items that may subsequently be reclassified to income (Gains) losses on derivative instruments designated as cash flow hedges in prior periods reclassified to cost of inventory or finance costs during the period, net of tax expense of $88 (2012 tax recovery of $187) (247) 517 Gains (losses) on derivative instruments outstanding at the end of the period designated as cash flow hedges, net of tax expense of $148 (2012 tax recovery of $149) 416 (423) Other comprehensive income (loss), net of tax 1,714 (589) Total comprehensive income $ 49,399 $ 65, / Wajax Corporation 2013 Annual Report
49 CONSOLIDATED FINANCIAL STATEMENTS Consolidated Statements of Changes in Shareholders Equity Accumulated other comprehensive (loss) income AOCI For the year ended December 31, 2013 Share Contributed Retained Cash flow (in thousands of Canadian dollars) capital surplus earnings hedges Total January 1, 2013 $ 106,651 4, ,944 (56) $ 241,885 Net earnings 47,685 47,685 Other comprehensive income 1, ,714 Total comprehensive income for the year 49, ,399 Shares issued to settle share-based compensation plans (note 20) 53 (53) Dividends (note 16) (44,857) (44,857) Share-based compensation expense (note 20) December 31, 2013 $ 106,704 5, , $ 247,192 AOCL For the year ended December 31, 2012 Share Contributed Retained Cash flow (in thousands of Canadian dollars) capital surplus earnings hedges Total January 1, 2012 $ 105,371 4, ,477 (150) $ 227,586 Net earnings 65,939 65,939 Other comprehensive loss (683) 94 (589) Total comprehensive income for the year 65, ,350 Shares issued to settle share-based compensation plans (note 20) 1,280 (1,280) Dividends (note 16) (51,789) (51,789) Share-based compensation expense (note 20) December 31, 2012 $ 106,651 4, ,944 (56) $ 241,885 Wajax Corporation 2013 Annual Report / 47
50 CONSOLIDATED FINANCIAL STATEMENTS Consolidated Statements of Cash Flows For the years ended December 31 (in thousands of Canadian dollars) OPERATING ACTIVITIES Net earnings $ 47,685 $ 65,939 Items not affecting cash flow: Depreciation and amortization: Rental equipment (note 7) 10,117 7,883 Property, plant and equipment (note 8) 9,661 8,467 Intangible assets (note 10) 1,839 1,466 Loss on disposal of property, plant and equipment Share-based compensation expense (note 20) Non-cash rental expense (149) (1,687) Employee benefits expense, net of payments 477 (618) Unrealized (gain) loss on derivative instruments (243) 72 Finance costs 8,951 4,442 Income tax expense (note 22) 17,027 23,762 96, ,603 Changes in non-cash operating working capital (note 24) 17,657 (114,347) Rental equipment additions (note 7) (20,008) (25,076) Other non-current liabilities (2,608) (3,784) Finance costs paid (6,873) (4,118) Income taxes paid (60,333) (2,387) Cash generated from (used in) operating activities 24,094 (39,109) INVESTING ACTIVITIES Property, plant and equipment additions (4,353) (6,234) Proceeds on disposal of property, plant and equipment Intangible assets additions (note 10) (115) (237) Acquisition of businesses (10,078) Cash used in investing activities (4,000) (16,026) FINANCING ACTIVITIES Net (decrease) increase in bank debt (77,998) 92,998 Issuance of senior notes (note 14) 125,000 Deferred financing costs (note 14) (3,244) (568) Finance lease payments (3,477) (2,553) Dividends paid (46,027) (50,596) Cash (used in) generated from financing activities (5,746) 39,281 Change in cash (bank indebtedness) 14,348 (15,854) (Bank indebtedness) cash beginning of period (10,195) 5,659 Cash (bank indebtedness) end of period $ 4,153 $ (10,195) 48 / Wajax Corporation 2013 Annual Report
51 NOTES TO CONSOLIDATED FINANCIAL STATEMENTS Notes to Consolidated Financial Statements December 31, 2013 (amounts in thousands of Canadian dollars, except share and per share data) 1. CORPORATION PROFILE Wajax Corporation (the Corporation ) is incorporated in Canada. The address of the Corporation s registered office is 3280 Wharton Way, Mississauga, Ontario, Canada. The Corporation s core distribution businesses are engaged in the sale, rental and aftersale parts and service support of mobile equipment, power systems and industrial components, through a network of 125 branches across Canada. The Corporation is a multi-line distributor and represents a number of leading worldwide manufacturers across its core businesses. Its customer base is diversified, spanning natural resources, construction, transportation, manufacturing, industrial processing and utilities. 2. BASIS OF PREPARATION Statement of compliance These consolidated financial statements have been prepared in accordance with International Financial Reporting Standards ( IFRS ) as published by the International Accounting Standards Board ( IASB ). The consolidated financial statements were authorized for issue by the Board of Directors on March 4, Basis of measurement The consolidated financial statements have been prepared under the historical cost basis except for derivative financial instruments and liabilities for cash-settled share-based payment arrangements that have been measured at fair value. The defined benefit liability is recognized as the net total of the fair value of the plan assets and the present value of the defined benefit obligation. Functional and presentation currency These consolidated financial statements are presented in Canadian dollars, which is the Corporation s functional currency. All financial information presented in Canadian dollars has been rounded to the nearest thousand, unless otherwise stated and except share and per share data. Judgements and estimation uncertainty The preparation of the consolidated financial statements in conformity with IFRS requires management to make judgements, estimates and assumptions that affect the application of accounting policies and the reported amounts of assets, liabilities, revenue and expenses. Actual results could differ from those judgements, estimates and assumptions. The Corporation bases its estimates on historical experience and various other assumptions that are believed to be reasonable in the circumstances. The key assumptions concerning the future and other key sources of estimation uncertainty that have a significant risk of resulting in a material adjustment to the carrying amount of assets and liabilities within the next fiscal year are as follows: Allowance for doubtful accounts The Corporation is exposed to credit risk with respect to its trade and other receivables. However, this is somewhat minimized by the Corporation s large customer base which covers most business sectors across Canada. The Corporation follows a program of credit evaluations of customers and limits the amount of credit extended when deemed necessary. The Corporation maintains provisions for possible credit losses, and any such losses to date have been within management s expectations. The provision for doubtful accounts is determined on an account-byaccount basis. Inventory obsolescence The value of the Corporation s new and used equipment is evaluated by management throughout the year, on a unit-by-unit basis. When required, provisions are recorded to ensure that the book value of equipment is valued at the lower of cost or estimated net realizable value. The Corporation performs an aging analysis to identify slow moving or obsolete parts inventories and estimates appropriate obsolescence provisions related thereto. The Corporation takes advantage of supplier programs that allow for the return of eligible parts for credit within specified time periods. Goodwill and intangible assets The value in use of goodwill and intangible assets has been estimated using the forecasts prepared by management for the next three years. The key assumptions for the estimate are those regarding revenue growth, gross margin and the level of working capital required to support the business. These estimates are based on past experience and management s expectations of future changes in the market and forecasted growth initiatives. See Note 10 for details of the value in use calculations. Wajax Corporation 2013 Annual Report / 49
52 NOTES TO CONSOLIDATED FINANCIAL STATEMENTS 3. SIGNIFICANT ACCOUNTING POLICIES Principles of consolidation These consolidated financial statements include the accounts of Wajax Corporation and its subsidiary entities, which are all wholly-owned. Intercompany balances and transactions are eliminated on consolidation. Revenue recognition Revenue is measured at the fair value of consideration received or receivable and is recognized as it is earned in accordance with the following: Revenue from the sale of equipment, parts and internally-manufactured or assembled products is generally recorded at the time goods are shipped to customers or when all contracted-upon conditions have been fulfilled. In certain cases, the sale of equipment involves the design, installation, and assembly of power and energy equipment systems. In these cases, revenue is recognized based on the percentage of contract costs incurred in relation to total estimated contract costs. Revenue from the rental of equipment is recognized on a straight-line basis over the term of the lease. Revenue from the provision of engineering and technical services to customers is recognized upon performance of contracted upon services with the customer. Revenue for separately priced extended warranty or product maintenance contracts is recognized over the contract period in proportion to the costs expected to be incurred in performing the services under the contract. If insufficient historical evidence exists to support this pattern, then revenue is recognized on a straight-line basis over the term of the contract. Provision is made for expected returns, collection losses and warranty costs based on past performance, and for estimated costs to fulfill contractual obligations and other sales-related contingencies depending on the terms of each individual contract. Derivative financial instruments The Corporation uses derivative financial instruments in the management of its foreign currency exposures related to certain inventory purchase and customer sales commitments. The Corporation s policy is not to utilize derivative financial instruments for trading or speculative purposes. Where the Corporation intends to apply hedge accounting it formally documents the relationship between the derivative and the risk being hedged, as well as the risk management objective and strategy for undertaking the hedge transaction. The documentation links the derivative to a specific asset or liability or to specific firm commitments or forecasted transactions. The Corporation also assesses, at the hedge s inception as well as on an ongoing basis, whether the hedge is effective in offsetting changes in fair values or cash flows of the risk being hedged. Should a hedge become ineffective, hedge accounting will be discontinued prospectively. All derivative instruments are recorded in the consolidated statements of financial position at fair value unless exempted from derivative treatment as a normal purchase and sale. All changes in fair value are recorded in earnings unless cash flow hedge accounting is applied, in which case changes in fair value are recorded in other comprehensive income. If the cash flow hedge of a firm commitment or forecast transaction results in the recognition of a non-financial asset or liability, then, at the time the asset or liability is recognized, the associated gains or losses on the derivative that had previously been recognized in other comprehensive income are included in the initial measurement of the asset or liability. Inventories Inventories are valued at the lower of cost and net realizable value. Cost is determined using the weighted average method except where the items are not ordinarily interchangeable, in which case the specific identification method is used. Cost of equipment and parts includes purchase cost, conversion cost if applicable and cost incurred in bringing inventory to its present location and condition. Cost of work-in-progress and cost of conversion includes cost of direct labour, direct materials and a portion of direct and indirect overheads, allocated based on normal capacity. Net realizable value is the estimated selling price in the ordinary course of business, less the estimated costs to sell. Rental equipment Rental equipment assets are recorded at cost less accumulated depreciation. Cost includes all expenditures directly attributable to the acquisition of the asset. Assets are depreciated over their estimated useful lives using the declining balance method at a rate of 20% per year for material handling equipment and a units of production method for power generation equipment. 50 / Wajax Corporation 2013 Annual Report
53 NOTES TO CONSOLIDATED FINANCIAL STATEMENTS Property, plant and equipment Property, plant and equipment are recorded at cost less accumulated depreciation. Cost includes all expenditures directly attributable to the acquisition of the asset. Assets are depreciated over their estimated useful lives based on the following methods and annual rates: Asset Method Rate Buildings declining balance 5% Equipment and vehicles declining balance 20% 30% Computer hardware straight-line 3 5 years Furniture and fixtures declining balance 20% Leasehold improvements straight-line over the remaining terms of the leases Assets under finance leases are depreciated over the shorter of the lease term and their useful life. Leases As lessor: The Corporation s equipment rentals and leases are classified as operating leases with amounts received included in revenue on a straight-line basis over the term of the lease. As lessee: Leases are classified as finance leases when the terms of the lease transfer substantially all the risks and rewards of ownership to the Corporation. Under finance leases the asset is recorded at the lower of its fair value and the present value of the minimum lease payments at the inception of the lease. A liability is recorded and is classified as current and non-current liabilities. The interest component of the lease is charged to earnings over the period of the lease using the effective interest rate method. All other leases are classified as operating leases. The cost of operating leases is charged to earnings on a straight-line basis over the periods of the leases. Intangible assets Product distribution rights represent the fair value attributed to these rights pursuant to an acquisition and are classified as indefinite life intangibles assets because the Corporation is generally able to renew these rights with minimal cost of renewal. Goodwill and indefinite life intangible assets are not amortized but are tested for impairment at least annually, or more frequently if certain indicators arise that indicate the assets might be impaired. Goodwill and indefinite life intangible assets are allocated to cash-generating units ( CGUs ) that are expected to benefit from the synergies of the acquisition. Customer lists and non-competition agreements are amortized on a straight-line basis over their useful lives which range from 2 to 7 years. Computer application software is classified as an intangible asset and is amortized on a straight-line basis over the useful life ranging from 1 to 3 years. Impairment Property, plant and equipment, rental equipment and definite life intangible assets are reviewed at the end of each year to determine if any indicators of impairment exist. If an indicator of impairment is identified, an impairment loss would be recognized equal to the amount by which the asset s carrying amount exceeds its recoverable amount. Where the asset does not generate cash flows that are independent of other assets, impairment is considered for the CGU to which the asset belongs. Goodwill and indefinite life intangible assets are tested at least annually for impairment. To test for impairment, the Corporation compares each CGU s carrying value to its recoverable amount. Recoverable amount is the higher of value in use or fair value less costs to sell, if the fair value can be readily determined. The value in use is the present value of future cash flows using a pre-tax discount rate that reflects the time value of money and the risk specific to the assets. Any impairment of goodwill or indefinite life intangible assets would be recorded as a charge against earnings. Cash and bank indebtedness Cash and bank indebtedness includes cash on hand, demand deposits, bank overdrafts and outstanding cheques. The Corporation considers bank indebtedness to be an integral part of the Corporation s cash management. Cash and bank indebtedness are offset and the net amount presented in the consolidated statements of financial position to the extent that there is a right to set off and a practice of net settlement. Cash was designated as loans and receivables upon initial recognition. Financing costs Transaction costs directly attributable to the acquisition or amendment of bank debt and issuance of senior unsecured notes ( senior notes ) are deferred and amortized to finance costs over the term of the long-term debt using the effective interest rate method. Deferred financing costs are included in the carrying amount of the related long-term debt. Provisions The Corporation provides for customer warranty claims that may not be covered by the manufacturer s standard warranty. Warranties relate to products sold Wajax Corporation 2013 Annual Report / 51
54 NOTES TO CONSOLIDATED FINANCIAL STATEMENTS and generally cover a period of 6 months to 5 years. The reserve is determined by applying a claim rate to the value of each machine sold. The rate is developed using management s best estimate of actual warranty expense, generally based on recent claims experience, and is adjusted as required. The provision is not discounted to reflect the time value of money because the impact is not material. The Corporation has guaranteed the resale value of certain equipment sold and guaranteed a portion of certain customers lease payments. These contracts are subject to certain conditions being met by the customers. Financial instruments The Corporation measures loans and receivables and other financial liabilities at amortized cost. Long-term debt instruments are initially measured at fair value, which is the consideration received, net of transaction costs incurred. Derivative instruments are measured at fair value. All changes in the fair value of derivative instruments are recorded in earnings unless cash flow hedge accounting is used, in which case changes in fair value are recorded in other comprehensive income with any ineffectiveness charged to earnings. Share-based compensation plans The fair value of share-based compensation plan rights is based on the trading price of a Wajax Corporation common share on the Toronto Stock Exchange ( TSX ). Compensation expense for sharesettled plans is based upon the fair value of the rights at the date of grant and is charged to selling and administrative expenses on a straight-line basis over the vesting period, with an offsetting adjustment to contributed surplus. Compensation expense for cashsettled plans varies with the price of the Corporation s shares and is recognized over the vesting period with an offset to accounts payable and accrued liabilities. Employee benefits The Corporation has defined contribution pension plans for most of its employees. The cost of the defined contribution plans is recognized in earnings based on the contributions required to be made each year. The Corporation also has defined benefit plans covering some of its employees. The benefits are based on years of service and the employees earnings. Defined benefit plan obligations are accrued as the employees render the services necessary to earn the pension benefits. The Corporation has adopted the following policies: The cost of pension benefits earned by employees is actuarially determined using the projected unit credit method for defined benefit plans and management s best estimate of salary escalation, and retirement ages of employees. For purposes of calculating expected return on plan assets, those assets are valued at fair value. The charge to earnings for the defined benefit plans is split between an operating cost and a finance charge. The finance charge represents the net interest cost on the defined benefit obligation net of the expected return on plan assets and is included in selling and administrative expenses. Actuarial gains and losses are recognized in full in the statement of other comprehensive income in the year in which they occur. Income taxes Income tax expense comprises current and deferred tax. Current tax and deferred tax are recognized in earnings except to the extent that they relate to a business combination or to items recognized directly in equity or in other comprehensive income. Current tax is the expected tax payable or receivable on the taxable income or loss for the year, using tax rates enacted or substantively enacted at the reporting date, and any adjustment to income taxes payable in respect of previous years. Deferred tax is recognized in respect of temporary differences between the carrying amounts of assets and liabilities for financial reporting purposes and the amounts used for taxation purposes. Deferred tax is measured at the tax rates that are expected to be applied to temporary differences when they reverse, based on the laws that have been enacted or substantively enacted by the reporting date. A deferred tax asset is recognized for unused tax losses and deductible temporary differences to the extent that it is probable that future taxable profits will be available against which they can be utilized. Deferred tax assets are reviewed at each reporting date and are reduced to the extent that it is no longer probable that the related tax benefit will be realized. 4. CHANGES IN ACCOUNTING POLICIES The following new standards have been adopted in the current year: On January 1, 2013, the Corporation adopted the amendments to IFRS 7 Offsetting Financial Assets and Liabilities, which contains new disclosure requirements for financial assets and liabilities that are offset in the statement of financial position or are subject to master netting arrangements or similar arrangements. The impact on the disclosures in the consolidated financial statements from adopting IFRS 7 was not material. 52 / Wajax Corporation 2013 Annual Report
55 NOTES TO CONSOLIDATED FINANCIAL STATEMENTS On January 1, 2013, the Corporation adopted IFRS 10 Consolidated Financial Statements, which establishes principles for the preparation and presentation of consolidated financial statements when an entity controls one or more other entities. There was no impact on the consolidated financial statements from adopting IFRS 10. On January 1, 2013, the Corporation adopted IFRS 13 Fair Value Measurement, which defines fair value and sets out a framework for measuring fair value when fair value measurements are required or permitted by other standards. It also requires disclosure of the valuation techniques and inputs for financial instruments measured at fair value. The impact on the disclosures in the consolidated financial statements from adopting IFRS 13 was not material. On January 1, 2013, the Corporation retrospectively adopted IAS 19R Employee Benefits, which requires recognition of actuarial gains and losses immediately in other comprehensive income, the full recognition of past service costs immediately in profit or loss, recognition of the expected return on plan assets in profit or loss to be calculated based on the rate used to discount the defined benefit obligation, and certain additional disclosures. No adjustment to prior years financial statements was necessary. The impact on the current year s consolidated financial statements from adopting IAS 19R was not material. Effective January 1, 2013, the Corporation early adopted Amendments to IAS 36 Impairment of Assets issued by the IASB in May The amendments impacted certain disclosure requirements only and did not have a material impact on the consolidated financial statements. New standards and interpretations not yet adopted The new standards or amendments to existing standards that may be significant to the Corporation set out below are not yet effective for the year ended December 31, 2013 and have not been applied in preparing these consolidated financial statements. As of January 1, 2014, the Corporation will be required to adopt the amendments to IAS 32 Offsetting Financial Assets and Liabilities, which clarifies when an entity has a right to set-off and when a settlement mechanism provides for net settlement or gross settlement. The extent of the impact of adoption of the amendment has not yet been determined. It is currently anticipated that the Corporation will be required to adopt IFRS 9 Financial Instruments, which is the result of the first phase of the IASB s project to replace IAS 39 Financial Instruments: Recognition and Measurement. The mandatory effective date has not been determined. The new standard replaces the current multiple classification and measurement models for financial assets and liabilities with a single model that has only two classification categories: amortized cost and fair value. The Corporation is currently assessing the impact of this standard on its consolidated financial statements. 5. TRADE AND OTHER RECEIVABLES Trade accounts receivable $ 167,014 $ 177,068 Less: allowance for credit losses (1,684) (2,458) Net trade accounts receivable 165, ,610 Other receivables 22,644 19,957 Total trade and other receivables $ 187,974 $ 194,567 The Corporation s exposure to credit and currency risks related to trade and other receivables is disclosed in Note INVENTORIES Equipment $ 154,362 $ 157,480 Parts 116, ,779 Work-in-process 18,879 16,926 Total inventories $ 289,299 $ 285,185 All amounts shown are net of obsolescence reserves of $11,852 (2012 $11,314). During the year ended December 31, 2013, $2,068 (2012 $1,857) was recorded in cost of sales for the write-down of inventories to estimated net realizable value. The Corporation recognized $906,839 (2012 $950,721) of inventories as an expense which is included in cost of sales. Substantially all of the Corporation s inventories are pledged as security for the bank credit facility (Note 14). 7. RENTAL EQUIPMENT Accumulated Cost Depreciation Net Book Value January 1, 2013 $ 63,973 $ 20,242 $ 43,731 Additions 20,008 10,117 9,891 Net transfers to inventories (4,947) (3,610) (1,337) December 31, 2013 $ 79,034 $ 26,749 $ 52,285 January 1, 2012 $ 43,448 $ 15,388 $ 28,060 Additions 25,076 7,883 17,193 Net transfers to inventories (4,551) (3,029) (1,522) December 31, 2012 $ 63,973 $ 20,242 $ 43,731 Wajax Corporation 2013 Annual Report / 53
56 NOTES TO CONSOLIDATED FINANCIAL STATEMENTS 8. PROPERTY, PLANT AND EQUIPMENT Land and Equipment Computer Furniture Leasehold buildings and vehicles hardware and fixtures improvements Total Cost January 1, 2013 $ 36,445 66,119 4,942 10,722 10,791 $ 129,019 Additions 132 7, , ,448 Disposals (4,613) (85) (861) (3,366) (8,925) December 31, 2013 $ 36,577 68,589 5,601 11,060 7,715 $ 129,542 Accumulated depreciation January 1, 2013 $ 14,663 42,911 4,068 8,008 8,669 $ 78,319 Charge for the year 1,005 6, ,661 Disposals (3,846) (85) (858) (3,365) (8,154) December 31, 2013 $ 15,668 45,996 4,444 7,804 5,914 $ 79,826 Carrying amount December 31, 2013 $ 20,909 22,593 1,157 3,256 1,801 $ 49,716 Cost January 1, 2012 $ 34,724 63,905 4,720 10,016 10,783 $ 124,148 Additions 589 9, ,468 Acquisition of businesses 1, ,853 Disposals (334) (7,596) (133) (46) (341) (8,450) December 31, 2012 $ 36,445 66,119 4,942 10,722 10,791 $ 129,019 Accumulated depreciation January 1, 2012 $ 13,870 42,793 3,761 7,597 8,203 $ 76,224 Charge for the year 794 6, ,467 Disposals (1) (5,950) (133) (61) (227) (6,372) December 31, 2012 $ 14,663 42,911 4,068 8,008 8,669 $ 78,319 Carrying amount December 31, 2012 $ 21,782 23, ,714 2,122 $ 50,700 Included in property, plant and equipment are vehicles held under finance leases as follows: Cost, beginning of year $ 21,303 $ 24,091 Additions 5,095 5,234 Acquisition of businesses 238 Disposals (335) (6,977) Purchased at end of lease (5,432) (1,283) Cost, end of year $ 20,631 $ 21,303 Accumulated depreciation, beginning of year $ 10,002 $ 13,009 Charge for the year 3,901 3,498 Disposals (161) (5,588) Purchased at end of lease (4,420) (917) Accumulated depreciation, end of year $ 9,322 $ 10,002 Carrying amount $ 11,309 $ 11,301 All property, plant and equipment except land and buildings and vehicles held under finance leases have been pledged as security for bank debt. 9. OPERATING AND FINANCE LEASES Operating leases as lessor The Corporation rents equipment to customers under rental agreements with terms of up to 5 years. The rentals have been classified as operating leases. The rentals may be cancelled subject to a cancellation fee. The future minimum lease payments receivable under the agreements are as follows: Less than one year $ 5,288 $ 3,884 Between one and five years 8,693 5,261 Operating leases as lessee $ 13,981 $ 9,145 The Corporation leases certain land and buildings, rental equipment and office equipment. Some of the lease terms can be extended at the option of the Corporation. 54 / Wajax Corporation 2013 Annual Report
57 NOTES TO CONSOLIDATED FINANCIAL STATEMENTS The future minimum non-cancelable payments due under the agreements are as follows: Less than one year $ 16,801 $ 16,699 Between one and five years 59,492 47,012 More than five years 24,968 33,244 $ 101,261 $ 96,955 Finance leases as lessee The Corporation finances certain vehicles under finance lease arrangements. The leases have a minimum one year term and are extended on a monthly basis thereafter until terminated. On termination, the Corporation has an option to purchase the vehicles at its residual value or the difference between the lessor s proceeds of disposal and the residual value is charged or refunded to the Corporation as a rental adjustment. Obligations under finance leases are as follows: Present Present value of value of minimum minimum Finance lease Finance lease Payment costs payments Payment costs payments Current $ 4, ,053 $ 4, ,611 Non-current (between one and five years) 11,474 2,266 9,208 9,311 1,119 8,192 Total minimum lease payments $ 15,756 2,495 13,261 $ 13,482 1,679 11, INTANGIBLE ASSETS Customer Product lists/nondistribution competition Goodwill rights agreements Software Total Cost January 1, 2013 $ 72,148 8,600 8,402 11,564 $ 100,714 Additions Disposals (6,898) (6,898) December 31, 2013 $ 72,148 8,600 8,402 4,781 $ 93,931 Accumulated amortization January 1, 2013 $ 3,652 9,394 $ 13,046 Amortization for the year 1, ,839 Disposals (6,898) (6,898) December 31, 2013 $ 4,659 3,328 $ 7,987 Carrying amount December 31, 2013 $ 72,148 8,600 3,743 1,453 $ 85,944 Cost January 1, 2012 $ 70,644 8,600 5,502 11,357 $ 96,103 Acquisition of businesses 1,504 2,900 4,404 Additions Disposals (30) (30) December 31, 2012 $ 72,148 8,600 8,402 11,564 $ 100,714 Accumulated amortization January 1, 2012 $ 3,095 8,515 $ 11,610 Amortization for the year ,466 Disposals (30) (30) December 31, 2012 $ 3,652 9,394 $ 13,046 Carrying amount December 31, 2012 $ 72,148 8,600 4,750 2,170 $ 87,668 Wajax Corporation 2013 Annual Report / 55
58 NOTES TO CONSOLIDATED FINANCIAL STATEMENTS Amortization of intangible assets is charged to selling and administrative expenses. The Corporation has allocated goodwill to the respective CGUs or groups of CGUs that represent the smallest identifiable group of assets that generate cash inflows and at which the goodwill is monitored internally. Each CGU has identifiable accounts receivable, inventory, capital assets, and intangible assets. In 2013, the Corporation has restructured the Power Systems business and as a result goodwill previously allocated to three CGUs - Power Systems West, Power Systems Central and Power Systems East was combined at the Power Systems business level for impairment testing, since that is the lowest level at which management monitors goodwill. Goodwill and indefinite life intangible assets have been allocated to the Corporation s CGUs that are expected to benefit from the acquisition that gave rise to the goodwill or indefinite life intangible assets as follows: Product Product distribution distribution Cash-generating units Goodwill rights Goodwill rights Equipment $ 21,341 $ 21,341 Power Systems 8,253 5,400 8,253 5,400 Industrial Components 42,554 3,200 42,554 3,200 $ 72,148 8,600 $ 72,148 8,600 In 2013, the Corporation performed annual impairment tests of its goodwill and intangible assets with indefinite lives. The recoverable amount of the CGUs was estimated based on the present value of the future cash flows expected to be derived from the CGUs (value in use). To prepare the value in use calculations, the forecasts are extrapolated beyond the three year period at the estimated long-term inflation rate of 2% (2012 2%) and a discount rate of 11.3% ( %) which is based on the Corporation s pre-tax weighted average cost of capital. The Corporation concluded that no impairment existed in either the goodwill or the intangible assets with an indefinite life. 11. PROVISIONS, COMMITMENTS AND CONTINGENCIES Warranties Other Total Provisions, January 1, 2013 $ 8,626 $ 2,997 $ 11,623 Charge for the year 5,951 1,481 7,432 Utilized in the year (7,498) (1,607) (9,105) Provisions, December 31, 2013 $ 7,079 $ 2,871 $ 9,950 Current 4,140 2,871 7,011 Non-current 2,939 2,939 Total $ 7,079 $ 2,871 $ 9,950 The Corporation also has contingent contractual obligations where the Corporation has guaranteed the resale value of equipment sold ( guaranteed residual value contracts ) or has guaranteed a portion of customer lease payments ( recourse contracts ). These contracts are subject to certain conditions being met by the customer. As at December 31, 2013, the Corporation had guaranteed residual values of $600 (2012 $1,177) with commitments arising in The commitments made by the Corporation in these contracts reflect the estimated future value of the equipment, based on the judgment and experience of management. The Corporation has recorded a $27 provision (2012 $67) as an estimate of the financial loss likely to result from such commitments. Litigation In the ordinary course of business, the Corporation is contingently liable for litigation in varying amounts. These liabilities could arise from litigation, environmental matters or other sources. It is not possible to determine the amounts that may ultimately be assessed against the Corporation, but management believes that any such amounts would not have a material impact on the business or financial position of the Corporation as they generally are fully covered by insurance. Provisions have been made in these consolidated financial statements when the liability is expected to result in an outflow of economic resources, and where the obligation can be reliably measured. 12. EMPLOYEE BENEFITS The Corporation sponsors three pension plans: the Wajax Limited Pension Plan (the Employees Plan ) which, except for a small group of employees, is a defined contribution plan ( DC ) and two defined benefit plans ( DB ): the Pension Plan for Executive Employees of Wajax Limited (the Executive Plan ) and the Wajax Limited Supplemental Executive Retirement Plan (the SERP ). 56 / Wajax Corporation 2013 Annual Report
59 NOTES TO CONSOLIDATED FINANCIAL STATEMENTS The Corporation also contributes to several union sponsored multi-employer plans for a small number of employees. Two of these are target benefit plans but they are all accounted for as DC plans as the Corporation has no involvement in the management of these plans and does not have sufficient information to account for the plans as DB plans. The Corporation uses actuarial reports prepared by independent actuaries for funding and accounting purposes and measures its defined benefit obligations and the fair value of plan assets for accounting purposes as at December 31 of each year. These actuarial assumptions include discount rates, interest income on plan assets, compensation increases and service life. While management believes that the actuarial assumptions are appropriate, any significant changes to those used would affect the statement of financial position and statement of earnings. The schedule for actuarial valuations of the pension plans for funding purposes is as follows: Plan Previous valuation Next valuation Employees Plan January 1, 2011 January 1, 2014 Executive Plan January 1, 2012 January 1, 2015 SERP January 1, 2012 January 1, 2015 The following significant actuarial assumptions were employed to determine the periodic pension income and the defined benefit obligations: Discount rate at beginning of year (to determine plan expenses) 3.8% 4.0% Discount rate at end of year (to determine defined benefit obligation) 4.5% 3.8% Rate of compensation increase 3.0% 3.0% The history of adjustments on the defined benefit plans for the current and prior year: Actuarial (gain) loss on defined benefit obligation arising from: Experience adjustment $ $ 466 Demographic assumption changes 903 Economic assumption changes (1,644) 567 (741) 1,033 Actuarial gain on plan assets, excluding interest income $ 1,347 $ 69 Total cash payments Total cash payments for employee future benefits for 2013, consisting of cash contributed by the Corporation to its funded pension plans, cash payments directly to beneficiaries for its unfunded pension plans, and cash contributed to its DC plans was $7,988 (2012 $8,918). The Corporation expects to contribute $501 to the defined benefit pension plans in the year ended December 31, The plan expenses recognized in earnings are as follows: Defined contribution plans Current service cost $ 7,787 $ 7,823 Defined benefit plans Current service cost Administration expenses Finance cost on defined benefit obligation Expected return on plan assets (432) (663) Total plan expense recognized in the statement of earnings $ 8,769 $ 8,380 Effective December 31, 2013, the Corporation adjusted its mortality assumptions to reflect the recommendations of a draft report on Canadian Pensioners Mortality released by the Canadian Institute of Actuaries in July Plan assets for the DC plans are invested according to the directions of the plan members. Plan assets for defined benefit plans are invested in the following major categories of plan assets as a percentage of total plan assets: December 31 Cash 3.8% 4.3% Fixed Income 33.4% 32.1% Canadian Equities 34.6% 29.7% Foreign Equities 28.2% 33.9% 100.0% 100.0% Of the amounts recognized in earnings, $3,481 (2012 $3,836) is included in cost of sales and $5,288 (2012 $4,544) is included in selling and administrative expenses. The amounts recognized in other comprehensive income are as follows: Net actuarial (gains) losses $ (2,088) $ 934 Deferred tax 543 (251) Amount recognized in other comprehensive income $ (1,545) $ 683 Cumulative actuarial losses $ 2,310 $ 3,855 Wajax Corporation 2013 Annual Report / 57
60 NOTES TO CONSOLIDATED FINANCIAL STATEMENTS Information about the Corporation s defined benefit pension plans, in aggregate, is as follows: Present value of benefit obligation Present value of benefit obligation, beginning of year $ 19,328 $ 18,599 Current service cost Participant contributions Finance cost on defined benefit obligation Actuarial (gain) loss (741) 1,033 Benefits paid (943) (1,509) Present value of benefit obligation, end of year $ 19,025 $ 19,328 Plan assets Fair value of plan assets, beginning of year $ 11,752 $ 11,269 Actual return 1, Participant contributions Employer contributions 420 1,275 Benefits paid (943) (1,509) Administration expenses (100) (75) Fair value of plan assets, end of year $ 12,975 $ 11,752 Funded Status Fair value of plan assets, end of year $ 12,975 $ 11,752 Present value of benefit obligation, end of year (19,025) (19,328) Plan deficit $ (6,050) $ (7,576) The accrued benefit liability is included in the Corporation s statement of financial position as follows: Accounts payable and accrued liabilities $ (501) $ (416) Employee benefits (5,549) (7,160) Plan deficit $ (6,050) $ (7,576) Present value of benefit obligation includes a benefit obligation of $4,542 (2012 $4,589) related to the SERP that is not funded. This obligation is secured by a letter of credit of $5,336 (2012 $4,893). 13. ACCOUNTS PAYABLE AND ACCRUED LIABILITIES Trade payables $ 116,300 $ 98,004 Deferred income 9,058 18,460 Other payables and accrued liabilities 75,764 69,931 Accounts payable and accrued liabilities $ 201,122 $ 186, LONG-TERM DEBT On October 23, 2013 the Corporation issued $125,000 of senior notes bearing an annual interest rate of 6.125%, payable semi-annually, and maturing on October 23, The $3,244 cost of issuing the senior notes has been capitalized and will be amortized over the remaining term of the notes using the interest rate method. Effective upon the closing of the note offering, the Corporation reduced the total available committed amount of the bank credit facility from $300,000 to $250,000. The fully secured bank credit facility of $250,000, due August 12, 2016, is now comprised of a $60,000 non-revolving term portion and a $190,000 revolving term portion. Borrowing capacity under the bank credit facility is dependent upon the level of the Corporation s inventories on hand and the outstanding trade accounts receivable. In addition, the bank credit facility contains customary restrictive covenants including limitations on the declaration of cash dividends and the maintenance of certain financial ratios, all of which were met as at December 31, Borrowings under the facility bear floating rates of interest at margins over Canadian dollar bankers acceptance yields, U.S. dollar LIBOR rates or prime. Margins on the facility depend on the Corporation s leverage ratio at the time of borrowing and range between 1.5% and 3.0% for Canadian dollar bankers acceptances and U.S. dollar LIBOR borrowings, and 0.5% and 2.0% for prime rate borrowings. Bank credit facility Non-revolving term portion $ 60,000 $ 80,000 Revolving term portion 15,000 73,000 75, ,000 Senior notes 125,000 Deferred financing costs, net of accumulated amortization of $779 (2012 $330) (4,094) (1,299) Total long-term debt $ 195,906 $ 151,701 The Corporation had $6,694 (2012 $5,917) letters of credit outstanding at the end of the year. Finance costs on long-term debt amounted to $8,315 (2012 $3,782). 58 / Wajax Corporation 2013 Annual Report
61 NOTES TO CONSOLIDATED FINANCIAL STATEMENTS 15. FINANCIAL INSTRUMENTS The Corporation categorizes its financial assets and financial liabilities as follows: Loans and receivables: Cash (bank indebtedness) $ 4,153 $ (10,195) Trade and other receivables 187, ,567 Other financial liabilities: Accounts payable and accrued liabilities $ (201,122) $ (186,395) Dividends payable (3,349) (4,519) Other liabilities (624) (2,083) Long-term debt (195,906) (151,701) Derivative instruments cash flow hedges: Foreign exchange forward contracts $ 323 $ (149) The Corporation measures loans and receivables and other financial liabilities at amortized cost. Derivatives designated as effective hedges are measured at fair value with subsequent changes in fair value being charged to other comprehensive income. Bank indebtedness and cash were designated as loans and receivables upon initial recognition. The fair values of loans and receivables and other financial liabilities, excluding the senior notes, approximate their recorded values due to the short-term maturities of these instruments. The fair value of the senior notes is estimated based on the trading price of the notes, which takes into account the Corporation s own credit risk. At December 31, 2013, the Corporation has estimated the fair value of its senior notes to be approximately $128,750. The following method and assumptions were used in 2013 and 2012 to determine the fair value of each class of assets and liabilities recorded at fair value on the consolidated statement of financial position: Derivative instruments The fair value of foreign exchange forward contracts is determined by discounting contracted future cash flows using a discount rate derived from forward rate curves for comparable assets and liabilities adjusted for changes in credit risk of the counterparties. Credit risk The Corporation is exposed to credit risk with respect to its trade and other receivables. This risk is somewhat minimized by the Corporation s large customer base which covers many business sectors across Canada. The Corporation follows a program of credit evaluations of customers and limits the amount of credit extended when deemed necessary. The Corporation s trade and other receivables consist of trade accounts receivable from customers and other accounts receivable, generally from suppliers for warranty and rebates. The aging of the trade accounts receivable is as follows: Current $ 97,411 $ 108,914 Less than 60 days overdue 63,325 63,588 More than 60 days overdue 6,278 4,566 Total trade accounts receivable $ 167,014 $ 177,068 The carrying amounts of accounts receivable represent the maximum credit exposure. The Corporation maintains provisions for possible credit losses by performing an analysis of specific accounts. Any such losses to date have been within management s expectations. Movement of the allowance for credit losses is as follows: Opening balance $ 2,458 $ 3,514 Additions Utilization (1,657) (1,358) Closing balance $ 1,684 $ 2,458 The Corporation is also exposed to non-performance by counterparties to short-term currency forward contracts. These counterparties are large financial institutions with Stable outlook and high shortterm and long-term credit ratings. To date, no such counterparty has failed to meet its financial obligations to the Corporation. Management does not believe there is a significant risk of non-performance by these counterparties and will continue to monitor the credit risk of these counterparties. Liquidity risk Liquidity risk is the risk that the Corporation will encounter difficulty in meeting obligations associated with its financial liabilities as they become due. The contractual maturities of the bank credit facility and senior notes are August 12, 2016 and October 23, 2020, respectively. At December 31, 2013 the Corporation had borrowed $75,000 (2012 $154,822) from the bank credit facility and $125,000 (2012 nil) from the issuance of senior notes. The Corporation issued $6,694 (2012 $5,917) of letters of credit for a total utilization of $81,694 (2012 $160,739) of its $250,000 (2012 $300,000) bank credit facility and had not utilized any (2012 nil) of its $15,000 (2012 $15,000) equipment financing facility. The Corporation s $250,000 bank credit facility along with $15,000 of capacity permitted in addition to the credit facility should be sufficient to meet the Corporation s short-term normal course working capital, maintenance capital and growth capital requirements. Wajax Corporation 2013 Annual Report / 59
62 NOTES TO CONSOLIDATED FINANCIAL STATEMENTS In the long-term the Corporation may be required to access the equity or debt markets, or reduce dividends, in order to fund significant acquisitions and growth related working capital and capital expenditures. Financial risk management policy The Corporation has in place a financial risk management policy that addresses the Corporation s financial exposure to currency risk and interest rate risk. The Corporation s tolerance to interest rate risk decreases as the Corporation s leverage ratio increases and interest coverage ratio decreases. To manage this risk prudently, guideline percentages of floating interest rate debt decrease as the Corporation s leverage ratio increases. The policy also defines acceptable levels of exposure to transactional currency risk. The exposure to currency and interest rate risk is managed through the use of various derivative instruments. Currency risk The Corporation enters into short-term currency forward contracts to hedge the exchange risk associated with the cost of certain inbound inventory and certain foreign currency-denominated sales to customers along with the associated receivables as part of its normal course of business. The impact of a change in foreign currency relative to the Canadian dollar on the Corporation s financial statements of unhedged foreign currency-denominated sales to customers along with the associated receivables and purchases from vendors along with the associated payables would be insignificant. The Corporation s contracts to buy and sell foreign currencies are summarized as follows: Average Notional Fair Exchange Amount Value Rate Maturity December 31, 2013 Purchase contracts USD $ 31,113 $ January 2014 to February 2015 December 31, 2012 Purchase contracts USD $ 26,453 $ (59) January 2013 to April 2014 Sales contracts USD $ 11,135 $ (90) January 2013 The Corporation maintains a hedging policy whereby significant transactional currency risks are usually identified and hedged. Interest rate risk The Corporation s borrowing costs are impacted by changes in interest rates. The impact of changes in interest rates is reduced by the fixed interest rate of the senior notes. As at December 31, 2013 and 2012 the Corporation had not entered into any interest rate swaps with its lenders. Sensitivity analysis A 1.00 percentage point change in interest rates on the average amount outstanding under the bank credit facility for 2013 would result in a change to earnings before income taxes of approximately $1,832 for the year. 16. DIVIDENDS DECLARED During 2013 the Corporation declared cash dividends of $2.68 per share, or $44,857 (2012, $3.10 per share or $51,789). The Corporation has declared dividends of $0.20 per share or $3,349 for each of January, February, March and April SHARE CAPITAL The Corporation is authorized to issue an unlimited number of no par value common shares and an unlimited number of no par value preferred shares. Each common share entitles the holder of record to one vote at all meetings of shareholders. All issued common shares are fully paid. There were no preferred shares outstanding as at December 31, 2013 (2012 nil). Each common share represents an equal beneficial interest in any distributions of the Corporation and in the net assets of the Corporation in the event of its termination or winding-up. Number of Common Shares Amount Balance, December 31, ,629,444 $ 105,371 Common shares issued to settle share-based compensation plans 107,003 1,280 Balance, December 31, ,736, ,651 Common shares issued to settle share-based compensation plans 7, Balance, December 31, ,743,520 $ 106, / Wajax Corporation 2013 Annual Report
63 NOTES TO CONSOLIDATED FINANCIAL STATEMENTS 18. REVENUE Equipment $ 523,817 $ 598,912 Parts 658, ,227 Service 196, ,537 Rental and other 49,669 39,338 Total revenues $ 1,428,477 $ 1,466, FINANCE COSTS Interest on long-term debt $ 8,315 $ 3,782 Interest on finance leases Finance costs $ 8,951 $ 4, SHARE-BASED COMPENSATION PLANS The Corporation has five share-based compensation plans: the Wajax Share Ownership Plan ( SOP ), the Deferred Share Program ( DSP ), the Directors Deferred Share Unit Plan ( DDSUP ), the Mid-Term Incentive Plan for Senior Executives ( MTIP ) and the Deferred Share Unit Plan ( DSUP ). a) Share rights plans Under the SOP, DSP and the DDSUP, rights are issued to the participants which, upon satisfaction of certain time and performance vesting conditions, are settled by issuing Wajax Corporation shares for no cash consideration. Vested rights are settled when the participant is no longer employed by the Corporation or one of its subsidiary entities or no longer sits on its board. Whenever dividends are paid on the Corporation s shares, additional rights (dividend equivalents) with a value equal to the dividends are credited to the participants accounts. The Corporation recorded compensation cost of $765 (2012 $738) in respect of these plans. December 31, 2013 December 31, 2012 Number Fair value at of Rights time of grant Number Fair value at of Rights time of grant Outstanding at beginning of year 254,952 $ 4, ,595 $ 4,908 Granted in the year new grants 14, ,231 1,304 dividend equivalents 19,973 18,129 Settled in the year (7,073) (53) (107,003) (1,280) Outstanding at end of year 282,573 $ 5, ,952 $ 4,932 At December 31, 2013, 266,579 share rights were vested ( ,102). The outstanding aggregate number of shares issuable to satisfy entitlements under these plans is as follows: Number of Shares Number of Shares Approved by shareholders 1,050,000 1,050,000 Exercised to date (160,990) (153,917) Rights outstanding (282,573) (254,952) Available for future grants 606, ,131 b) Cash-settled rights plans The MTIP and DSUP, which are settled in cash, consist of an annual grant that vests over three years and is based upon time and performance vesting criteria, a portion of which is determined by the price of the Corporation s shares. Compensation expense varies with the price of the Corporation s shares and is recognized over the vesting period. Vested DSUP rights are settled when the participant is no longer employed by the Corporation or one of its subsidiary entities. The Corporation recorded compensation recovery of $124 (2012 cost of $2,653) in respect of these plans. The carrying amount of the share-based portion of these liabilities was $855 (2012 $2,444). 21. EMPLOYEE COSTS Employee costs for the Corporation during the year amounted to: Wages and salaries, including bonuses $ 219,805 $ 214,841 Other benefits 33,712 30,953 Pension costs defined contribution plans 7,787 7,823 Pension costs defined benefit plans Share-based payments expense 641 3,391 $ 262,927 $ 257,565 Wajax Corporation 2013 Annual Report / 61
64 NOTES TO CONSOLIDATED FINANCIAL STATEMENTS 22. INCOME TAXES Income tax expense comprises current and deferred tax as follows: Current $ 15,784 $ 44,353 Deferred Origination and reversal of temporary difference 1,243 (20,621) Change in tax law and rate 30 Income tax expense $ 17,027 $ 23,762 The calculation of current tax is based on a combined federal and provincial statutory income tax rate of 26.1% ( %). Deferred tax assets and liabilities are measured at tax rates that are expected to apply to the period when the asset is realized or the liability is settled. Deferred tax assets and liabilities have been measured using an expected average combined statutory income tax rate of 26.1% based on the tax rates in years when the temporary differences are expected to reverse. The reconciliation of effective income tax is as follows: Combined statutory income tax rate 26.1% 26.2% Expected income tax expense at statutory rates $ 16,890 $ 23,502 Non-deductible expenses Deferred tax related to changes in tax law and rates 30 Other (436) (318) Income tax expense $ 17,027 $ 23,762 Recognized deferred tax assets and liabilities Recognized deferred tax assets and liabilities and the movement in temporary differences during the year are as follows: Recognized Recognized in other Recognized December 31 in profit comprehensive on acquisition December or loss income of businesses 2013 Property, plant and equipment $ (2,099) (552) $ (2,651) Finance leases Intangible assets (2,973) (147) (3,120) Accrued liabilities 5,241 (1,887) 3,354 Provisions 2, ,597 Derivative instruments 18 (60) (42) Employee benefits 1, (543) 1,485 Deferred financing costs 81 (147) (66) Partnership income not currently taxable (1,893) 831 (1,062) Tax loss carryforwards 304 (220) 84 Net deferred tax assets $ 2,922 (1,243) (603) $ 1,076 Recognized Recognized in other Recognized December 31 in profit comprehensive on acquisition December or loss income of businesses 2012 Property, plant and equipment $ (1,773) (326) $ (2,099) Finance leases (195) Intangible assets (2,355) (430) (188) (2,973) Accrued liabilities 5,249 (8) 5,241 Provisions 2,504 (239) 2,265 Derivative instruments 56 (38) 18 Employee benefits 1,752 (142) 251 1,861 Deferred financing costs (29) Partnership income not currently taxable (23,236) 21,343 (1,893) Tax loss carryforwards 333 (29) 304 Net deferred tax assets $ (17,694) 20, (188) $ 2, / Wajax Corporation 2013 Annual Report
65 NOTES TO CONSOLIDATED FINANCIAL STATEMENTS 23. EARNINGS PER SHARE The following table sets forth the computation of basic and diluted earnings per share: Numerator for basic and diluted earnings per share: net earnings $ 47,685 $ 65,939 Denominator for basic earnings per share: weighted average shares 16,737,086 16,699,874 Denominator for diluted earnings per share: weighted average shares 16,737,086 16,699,874 effect of dilutive share rights 260, ,236 Denominator for diluted earnings per share 16,997,476 16,954,110 Basic earnings per share $ 2.85 $ 3.95 Diluted earnings per share $ 2.81 $ 3.89 No share rights were excluded from the above calculations as none were anti-dilutive. 24. CHANGES IN NON-CASH OPERATING WORKING CAPITAL Trade and other receivables $ 6,593 $ (17,139) Inventories (2,777) (39,035) Prepaid expenses 1, Accounts payable and accrued liabilities 13,256 (58,856) Provisions (524) (316) Total $ 17,657 $ (114,347) 25. CAPITAL MANAGEMENT Objective The Corporation defines its capital as the total of its shareholders equity and long-term debt and obligations under finance leases ( interest bearing debt ). The Corporation s objective when managing capital is to have a capital structure and capacity to support the Corporation s operations and strategic objectives set by the Board of Directors. Management of capital The Corporation s capital structure is managed such that it maintains a relatively low leverage ratio, defined below, as the Corporation pays dividends to shareholders equal to a significant portion of its earnings. In addition, the Corporation s tolerance to interest rate risk decreases/increases as the Corporation s leverage ratio increases/decreases. The Corporation s objective is to maintain a leverage ratio between 1.5 times and 2.0 times. However, there may be instances where the Corporation is willing to maintain a leverage ratio outside the range to either support key growth initiatives or fluctuations in working capital levels during changes in economic cycles. The leverage ratio at the end of a particular quarter is defined as funded net debt divided by trailing 12-month EBITDA. Funded net debt includes longterm debt, bank indebtedness and obligations under finance leases, net of cash. EBITDA is calculated as earnings before finance costs, income tax expense, depreciation and amortization. Although management currently believes the Corporation has adequate debt capacity, the Corporation may have to access the equity or debt markets, or temporarily reduce dividends to accommodate any shortfalls in the Corporation s credit facilities or significant growth capital requirements. There were no significant changes in the Corporation s approach to capital management during the year. Restrictions on capital The interest bearing debt includes a $250,000 bank credit facility which expires August 12, The bank credit facility contains the following covenants: Borrowing capacity is dependent upon the level of the Corporation s inventories on-hand and the outstanding trade accounts receivable ( borrowing base ). The Corporation s borrowing base was in excess of $250,000 at December 31, 2013 and, as a result, did not restrict the borrowing capacity under the bank credit facility. The Corporation will be restricted from the declaration of monthly cash dividends in the event the Corporation s leverage ratio, as defined under the bank credit facility, exceeds three times. The $125,000 senior notes which expire October 23, 2020 are unsecured and contain customary incurrence based covenants that, although different from those under the bank credit facility described above, are not expected to be any more restrictive than under the bank credit facility. At December 31, 2013, the Corporation was in compliance with all covenants and there were no restrictions on the declaration of monthly cash dividends. Wajax Corporation 2013 Annual Report / 63
66 NOTES TO CONSOLIDATED FINANCIAL STATEMENTS Under the terms of the $250,000 bank credit facility, the Corporation is permitted to have additional interest bearing debt of $15,000. As a result, the Corporation has up to $15,000 of demand inventory equipment financing capacity with three-non bank lenders. The equipment notes payable under the facilities bear floating rates of interest at margins over Canadian dollar bankers acceptance yields and U.S. LIBOR rates. Principal repayments are generally due the earlier of 12 months from the date of financing and the date the equipment is sold. At December 31, 2013, the Corporation had no utilization of its interest bearing equipment financing facilities. 26. RELATED PARTY TRANSACTIONS The Corporation s related party transactions consist of the compensation of directors and key management personnel which is set out in the following table: Salaries, bonus and other short-term employee benefits $ 2,633 $ 4,528 Defined benefit pension Share-based compensation expense 680 2,819 Total compensation $ 4,110 $ 7, OPERATING SEGMENTS The Corporation operates through a network of 125 branches in Canada in three core businesses which reflect the internal organization and management structure according to the nature of the products and services provided. The Corporation s three core businesses are: i) the distribution, modification and servicing of equipment; ii) the distribution, servicing and assembly of power systems; and iii) the distribution, servicing and assembly of industrial components. Performance is measured based on segment earnings before finance costs and income taxes, as included in the internal management reports that are reviewed by the Corporation s chief operating decision maker. Information regarding the results of each reportable segment is shown below. Power Industrial Segment 2013 Equipment Systems Components Eliminations Total Equipment $ 426,141 $ 97,676 $ $ $ 523,817 Parts 182, , , ,557 Service 108,584 65,434 22, ,434 Rental and other 46,139 7,485 (3,955) 49,669 Revenue $ 763,525 $ 304,014 $ 364,893 $ (3,955) $ 1,428,477 Earnings before finance costs and income taxes $ 49,031 $ 17,119 $ 14,990 $ (7,477) $ 73,663 Finance costs 8,951 Income tax expense 17,027 Net earnings $ 47,685 Segment assets excluding intangible assets $ 317,294 $ 150,019 $ 117,107 $ $ 584,420 Intangible assets 21,664 14,221 49, ,944 Corporate and other assets 6,589 6,589 Total assets $ 338,958 $ 164,240 $ 167,077 $ 6,678 $ 676,953 Segment liabilities $ 115,581 $ 44,581 $ 59,472 $ $ 219,634 Corporate and other liabilities 210, ,127 Total liabilities $ 115,581 $ 44,581 $ 59,472 $ 210,127 $ 429,761 Asset additions Rental equipment $ 16,876 $ 3,132 $ $ $ 20,008 Property, plant and equipment 6,127 2, ,448 Intangible assets $ 23,033 $ 5,211 $ 578 $ 749 $ 29,571 Asset depreciation Rental equipment $ 8,670 $ 1,447 $ $ $ 10,117 Property, plant and equipment 5,200 3,030 1, ,661 Intangible assets , ,839 $ 14,081 $ 4,738 $ 2,694 $ 104 $ 21, / Wajax Corporation 2013 Annual Report
67 NOTES TO CONSOLIDATED FINANCIAL STATEMENTS Power Industrial Segment 2012 Equipment Systems Components Eliminations Total Equipment $ 475,888 $ 123,024 $ $ $ 598,912 Parts 165, , , ,227 Service 98,874 67,724 18, ,536 Rental and other 38,199 5,951 (4,811) 39,339 Revenue $ 778,482 $ 332,294 $ 360,049 $ (4,811) $ 1,466,014 Earnings before finance costs and income taxes $ 56,130 $ 26,130 $ 22,130 $ (10,247) $ 94,143 Finance costs 4,442 Income tax expense 23,762 Net earnings $ 65,939 Segment assets excluding intangible assets $ 315,499 $ 145,444 $ 121,045 $ $ 581,988 Intangible assets 21,845 14,488 51, ,668 Corporate and other assets 2,206 2,206 Total assets $ 337,344 $ 159,932 $ 172,378 $ 2,208 $ 671,862 Segment liabilities $ 110,546 $ 47,663 $ 48,887 $ $ 207,096 Corporate and other liabilities 222, ,881 Total liabilities $ 110,546 $ 47,663 $ 48,887 $ 222,881 $ 429,977 Asset additions Rental equipment $ 19,177 $ 5,899 $ $ $ 25,076 Property, plant and equipment 5,629 4,750 1, ,468 Intangible assets $ 24,853 $ 10,665 $ 1,207 $ 56 $ 36,781 Asset depreciation Rental equipment $ 6,529 $ 1,354 $ $ $ 7,883 Property, plant and equipment 4,163 2,931 1, ,467 Intangible assets ,466 $ 10,977 $ 4,573 $ 2,124 $ 142 $ 17,816 Segment assets do not include assets associated with the corporate office, financing costs or income taxes. Additions to corporate assets, and depreciation of these assets, are included in segment eliminations. 28. COMPARATIVE FIGURES Certain comparative figures have been reclassified to conform to the current year s presentation. Wajax Corporation 2013 Annual Report / 65
68 ADDITIONAL FINANCIAL INFORMATION SUMMARY OF QUARTERLY DATA UNAUDITED (in millions of dollars, except per share data) Q1 Q2 Q3 Q4 Q1 Q2 Q3 Q4 Revenue $ $ $ $ $ $ $ $ Net earnings Earnings per share Basic $ 0.62 $ 0.81 $ 0.69 $ 0.73 $ 1.03 $ 1.11 $ 0.97 $ 0.85 Earnings per share Diluted ELEVEN YEAR SUMMARY UNAUDITED For the years ended December 31 (in millions of dollars, except per share data) ( reported under previous Canadian GAAP) Operating Results Revenue* $1,428.5 $1,466.0 $1,377.1 $1,110.9 $1,007.2 $1,213.5 $1,192.3 $1,206.5 $1,049.4 $ $ Net earnings* Interest expense Property, plant and equipment net (1) Rental equipment additions Depreciation and amortization Per Share Net earnings Basic* $ 2.85 $ 3.95 $ 3.84 $ 3.39 $ 2.06 $ 4.57 $ 4.34 $ 4.31 $ 2.19 $ 1.12 $ 0.61 Dividends declared Distributions declared Equity Financial Position Working capital (2) * $ $ $ $ 77.9 $ $ $ $ $ $ $ Rental equipment Property, plant and equipment net Long-term debt excluding current portion Shareholders equity Total assets* Other Information Number of employees 2,766 2,833 2,738 2,382 2,291 2,662 2,551 2,566 2,387 2,357 2,279 Shares outstanding (000 s) 16,744 16,736 16,629 16,629 16,603 16,585 16,585 16,585 16,582 15,739 15,697 Price range of shares High $ $ $ $ $ $ $ $ $ $ $ 8.25 Low * 2006, 2005 and 2004 exclude discontinued operations (1) Property, plant and equipment additions, less proceeds on disposal of property, plant and equipment. (2) Current assets less current liabilities. 66 / Wajax Corporation 2013 Annual Report
69 Corporate Information DIRECTORS Paul E. Gagné Chairman, Wajax Corporation Corporate Director Edward M. Barrett Chairman and Co-Chief Executive Officer, Barrett Corporation Ian A. Bourne Corporate Director Douglas A. Carty Corporate Director Robert P. Dexter, q.c. Chairman and Chief Executive Officer, Maritime Travel Inc. John C. Eby Corporate Director A. Mark Foote President and Chief Executive Officer, Wajax Corporation J.D. Hole Corporate Director Alexander S. Taylor President, Power Group of SNC-Lavalin Group Inc. HONOURARY DIRECTOR H. Gordon MacNeill OFFICERS A. Mark Foote President and Chief Executive Officer John J. Hamilton Senior Vice President, Finance and Chief Financial Officer Brian M. Dyck Senior Vice President, Wajax Equipment Richard M. G. Plain Senior Vice President, Wajax Power Systems Steven C. Deck Senior Vice President, Wajax Industrial Components Katie Hunter Senior Vice President, Human Resources Linda J. Corbett Treasurer Andrew W. H. Tam General Counsel and Secretary 3280 Wharton Way Mississauga, ON L4X 2C5 Telephone: (905) Fax: (905) SHAREHOLDER INFORMATION Transfer Agent and Registrar For information relating to shareholdings, dividends, lost certificates, changes of address or estate transfers, please contact our transfer agent: Computershare Investor Services Inc. 100 University Avenue, 8th Floor Toronto, ON M5J 2Y1 Telephone: (514) or Fax: (514) or Web: investorcentre.com/service Auditors KPMG LLP Exchange Listing Toronto Stock Exchange Symbol: WJX Wajax Corporation Share Trading Information (January 1 December 31, 2013) Volume of Shares Open High Low Close Traded $41.97 $46.24 $29.38 $ ,008,748 Quarterly Earnings Reports Quarterly earnings for the balance of 2014 are anticipated to be announced on May 6, August 6 and November Dividend Dates Monthly dividends are payable to shareholders of record on the last business day of each month and are generally paid on the 20th day of the following month or the next following business day. Investor Information John Hamilton Senior Vice President, Finance and Chief Financial Officer Telephone: (905) Fax: (905) ir@wajax.com To obtain a delayed share quote, read news releases, listen to the latest analysts conference call, and stay abreast of other Corporation news, visit our website at Annual Meeting Shareholders are invited to attend the Annual Meeting of Wajax Corporation, to be held at the Sheraton Gateway Hotel, Toronto International Airport, Toronto, Ontario, on Tuesday, May 6, 2014, at 11:00 a.m. Vous pouvez obtenir la version française de ce rapport en écrivant à la Secrétaire, Corporation Wajax 3280 Wharton Way Mississauga (ON) L4X 2C5 Wajax Corporation 2013 Annual Report / 67
70 Operating Divisions and Branch Listings OPERATING DIVISIONS Wajax Equipment Township Road 531A Edmonton, Alberta T7X 5A3 Brian Dyck, Senior Vice President, Wajax Equipment Wajax Power Systems st Avenue Edmonton, Alberta T6E 0A8 Richard Plain, Senior Vice President, Wajax Power Systems Wajax Industrial Components nd Avenue Lachine, Québec H8T 2Y3 Steve Deck, Senior Vice President, Wajax Industrial Components BRANCH LISTINGS Wajax Equipment Wajax Power Systems Wajax Industrial Components West Genelle, BC Kamloops, BC Langley, BC Nanaimo, BC Prince George, BC Sparwood, BC Tumbler Ridge, BC Blackfalds, AB Calgary, AB Clairmont, AB Edmonton, AB (2) Fort McKay, AB Fort McMurray, AB (2) Saskatoon, SK Winnipeg, MB Central Hamilton, ON Kitchener, ON London, ON Mississauga, ON Ottawa, ON Sudbury, ON Thunder Bay, ON Timmins, ON Windsor, ON East Chambly, QC Laval, QC Québec City, QC St-Félicien, QC Moncton, NB Dartmouth, NS Mount Pearl, NL Pasadena, NL Wabush, NL West Fort St. John, BC Calgary, AB Edmonton, AB Fort McMurray, AB Grande Prairie, AB Red Deer, AB Redcliff, AB Regina, SK Saskatoon, SK Central Winnipeg, MB Cornwall, ON Hamilton, ON London, ON Niagara Falls, ON Ottawa, ON Pembroke, ON Sudbury, ON Thunder Bay, ON Timmins, ON Toronto, ON East Dorval, QC Drummondville, QC Québec City, QC Val d Or, QC Moncton, NB Dartmouth, NS Mount Pearl, NL West Cranbrook, BC Delta, BC Fort St. John, BC Prince George, BC (2) Sparwood, BC Surrey, BC (2) Terrace, BC Calgary, AB Edmonton, AB Nisku, AB Redcliff, AB Regina, SK Saskatoon, SK Flin Flon, MB Thompson, MB Winnipeg, MB Yellowknife, NW Central Belleville, ON Concord, ON Espanola, ON Guelph, ON Kapuskasing, ON London, ON Mississauga, ON (2) Sault Ste. Marie, ON Stoney Creek, ON Sudbury, ON Thunder Bay, ON (2) Timmins, ON Windsor, ON Temiscaming, QC East Ottawa, ON Chicoutimi, QC Drummondville, QC Granby, QC Lachine, QC LaSalle, QC Laval, QC Longueuil, QC Noranda, QC Québec City, QC Rimouski, QC Sept-Iles, QC Sherbrooke, QC Thetford Mines, QC Tracy, QC Trois-Rivières, QC Val d Or, QC Valleyfield, QC Ville d Anjou, QC Bathurst, NB Edmundston, NB Charlottetown, PEI Dartmouth, NS Port Hawkesbury, NS Stellarton, NS Corner Brook, NL Mount Pearl, NL Wabush, NL 68 / Wajax Corporation 2013 Annual Report tenmay.com

71

")
72 3280 Wharton Way Mississauga, ON L4X 2C5 Telephone: (905) Fax: (905)
FOURTH QUARTER REPORT TO SHAREHOLDERS FOR THE TWELVE MONTHS ENDED DECEMBER 31, 2012
 FOURTH QUARTER REPORT TO SHAREHOLDERS FOR THE TWELVE MONTHS ENDED DECEMBER 31, 2012 W A J A X C O R P O R A T I O N 2012 WAJAX CORPORATION News Release WAJAX ANNOUNCES 2012 FOURTH QUARTER EARNINGS TSX
THIRD QUARTER REPORT TO SHAREHOLDERS FOR THE NINE MONTHS ENDED SEPTEMBER 30, 2012
 THIRD QUARTER REPORT TO SHAREHOLDERS FOR THE NINE MONTHS ENDED SEPTEMBER 30, 2012 W A J A X C O R P O R A T I O N 2012 WAJAX CORPORATION News Release TSX Symbol: WJX WAJAX ANNOUNCES 2012 THIRD QUARTER
WAJAX ANNOUNCES 2015 FOURTH QUARTER RESULTS, INCLUDING A GOODWILL IMPAIRMENT AND PLANS FOR STRATEGIC REORGANIZATION
 WAJAX CORPORATION News Release TSX Symbol: WJX WAJAX ANNOUNCES 2015 FOURTH QUARTER RESULTS, INCLUDING A GOODWILL IMPAIRMENT AND PLANS FOR STRATEGIC REORGANIZATION (Dollars in millions, except per share
THIRD QUARTER REPORT TO UNITHOLDERS FOR THE NINE MONTHS ENDED SEPTEMBER 30, 2010
 THIRD QUARTER REPORT TO UNITHOLDERS FOR THE NINE MONTHS ENDED SEPTEMBER 30, 2010 W A J A X I N C O M E F U N D 2010 WAJAX INCOME FUND News Release TSX Symbol: WJX.UN WAJAX REPORTS SIGNIFICANTLY IMPROVED
FIRST QUARTER REPORT TO UNITHOLDERS FOR THE THREE MONTHS ENDED MARCH 31, 2010
 FIRST QUARTER REPORT TO UNITHOLDERS FOR THE THREE MONTHS ENDED MARCH 31, 2010 W A J A X I N C O M E F U N D 2 0 1 0 WAJAX INCOME FUND TSX Symbol: WJX.UN WAJAX ANNOUNCES 2010 FIRST QUARTER EARNINGS (Dollars
FIRST QUARTER REPORT TO SHAREHOLDERS FOR THE THREE MONTHS ENDED MARCH 31, 2011
 FIRST QUARTER REPORT TO SHAREHOLDERS FOR THE THREE MONTHS ENDED MARCH 31, 2011 W A J A X C O R P O R A T I O N 2011 WAJAX CORPORATION News Release TSX Symbol: WJX WAJAX ANNOUNCES INCREASE IN 2011 FIRST
TOROMONT ANNOUNCES 2017 RESULTS AND INCREASE IN QUARTERLY DIVIDEND
 For immediate release TOROMONT ANNOUNCES 2017 RESULTS AND INCREASE IN QUARTERLY DIVIDEND Toronto, Ontario (February 22, 2018) - Toromont Industries Ltd. (TSX: TIH) today reported financial results for
Third Quarter 2015 November 2, 2015 TOROMONT ANNOUNCES RESULTS FOR THE THIRD QUARTER OF 2015 AND REGULAR QUARTERLY DIVIDEND
 Third Quarter 2015 November 2, 2015 TOROMONT ANNOUNCES RESULTS FOR THE THIRD QUARTER OF 2015 AND REGULAR QUARTERLY DIVIDEND Toromont Industries Ltd. (TSX: TIH) reported its financial results for the third
MANAGEMENT S DISCUSSION AND ANALYSIS For the Year ended September 30, 2017 Dated: December 28, 2017
 MANAGEMENT S DISCUSSION AND ANALYSIS For the Year ended, 2017 Dated: December 28, 2017 MANAGEMENT S DISCUSSION & ANALYSIS This Management s Discussion and Analysis ( MD&A ) presents management s view of
This MD&A has been prepared taking into consideration information available to May 11, 2017.
 Management s Discussion and Analysis The following Management s Discussion and Analysis (MD&A) should be read in conjunction with the unaudited interim consolidated financial statements of Badger Daylighting
First Quarter 2018 April 25, 2018 TOROMONT ANNOUNCES RESULTS FOR THE FIRST QUARTER OF 2018 AND QUARTERLY DIVIDEND
 First Quarter 2018 April 25, 2018 TOROMONT ANNOUNCES RESULTS FOR THE FIRST QUARTER OF 2018 AND QUARTERLY DIVIDEND Toromont Industries Ltd. (TSX: TIH) reported financial results for the first quarter ended
CIRCA ENTERPRISES INC ANNUAL REPORT
 CIRCA ENTERPRISES INC. 2014 ANNUAL REPORT MD&A 1 Corporate Profile Circa s operations consist of two distinct business lines the first being telecommunications surge protection and related products, sold
Management s Discussion and Analysis
 Management s Discussion and Analysis The following Management s Discussion and Analysis (MD&A) should be read in conjunction with the attached unaudited interim consolidated financial statements of Badger
Badger Daylighting Ltd. MD&A September 30, 2017
 Management s Discussion and Analysis The following Management s Discussion and Analysis ( MD&A ) should be read in conjunction with the unaudited interim consolidated financial statements of Badger Daylighting
Second Quarter 2018 July 24, 2018 TOROMONT ANNOUNCES RESULTS FOR THE SECOND QUARTER OF 2018 AND QUARTERLY DIVIDEND
 Second Quarter 2018 July 24, 2018 TOROMONT ANNOUNCES RESULTS FOR THE SECOND QUARTER OF 2018 AND QUARTERLY DIVIDEND Toromont Industries Ltd. (TSX: TIH) reported financial results for the second quarter
FINANCIAL OVERVIEW Three months ended March 31,
 QUARTERLY REPORT FOR THE THREE MONTHS ENDED MARCH 31, 2018 MANAGEMENT S DISCUSSION AND ANALYSIS May 3, 2018 The Management s Discussion and Analysis ( MD&A ) for Enerflex Ltd. ( Enerflex or the Company
CANADA S INTERMEDIATE GOLD PRODUCER
 CANADA S INTERMEDIATE GOLD PRODUCER 2019 Guidance Conference Call & Webcast January 23, 2019 1 Cautionary Statement on Forward Looking Information This presentation contains certain forward-looking information
Interim Financial Report First quarter ended September 30, 2018
 Interim Financial Report First quarter ended September 30, 2018 www.h2oinnovation.com investor@h2oinnovation.com Trading symbols: TSX Venture: HEO Alternext: MNEMO: ALHEO OTCQX: HEOFF MANAGEMENT S DISCUSSION
MD&A. Management s Discussion And Analysis. First Quarter March 31, 2018 CANADA S PREMIER NON-BANK LENDER
 MD&A Management s Discussion And Analysis First Quarter March 31, 2018 CANADA S PREMIER NON-BANK LENDER MANAGEMENT S DISCUSSION AND ANALYSIS Q1 2018 ATRIUM MORTGAGE INVESTMENT CORPORATION 7 Management
Detour Gold Reports Third Quarter 2018 Results
 NEWS RELEASE Detour Gold Reports Third Quarter 2018 Results October 24, 2018 Detour Gold Corporation (TSX: DGC) ( Detour Gold or the Company ) reports its operational and financial results for the third
Toromont Announces Results for the Third Quarter of 2018 and Quarterly Dividend
 Toromont Announces Results for the Third Quarter of 2018 and Quarterly Dividend November 5, 2018 TORONTO, Nov. 05, 2018 (GLOBE NEWSWIRE) -- Toromont Industries Ltd. (TSX: TIH) reported its financial results
Press Release For immediate release
 Press Release For immediate release Uni-Select reports double-digit increases for sales, EBITDA (1) and EPS (compared to the same quarter last year), driven by The Parts Alliance contribution: Sales up
Management s Discussion and Analysis For the three and nine months ended September 30, 2017
 Management s Discussion and Analysis For the three and nine months ended September 30, 2017 November 9, 2017 MANAGEMENT S DISCUSSION AND ANALYSIS OF RESULTS OF OPERATIONS AND FINANCIAL CONDITION BASIS
ENBRIDGE INCOME FUND HOLDINGS INC. MANAGEMENT S DISCUSSION AND ANALYSIS. December 31, 2017
 ENBRIDGE INCOME FUND HOLDINGS INC. MANAGEMENT S DISCUSSION AND ANALYSIS December 31, 2017 GLOSSARY ECT EIPLP Enbridge ENF or the Company Fund Units IFRS MD&A the Fund the Fund Group the Manager or EMSI
Press Release For immediate release
 Uni-Select reports growth in sales and EBITDA (1) for its Q4 and full year 2017: Press Release For immediate release Sales up 42.6% to $415.0 million in Q4 and up 21.0% to $1,448.3 million for 2017 due
THE POWER OF FIRST QUARTER REPOR T S ENDED AUGU
 THE POWER OF FIRST QUARTER REPOR T S ENDED AUGU QUARTERLY REPORT TO SHAREHOLDERS Empire Company Limited ( Empire or the Company ) is a Canadian company headquartered in Stellarton, Nova Scotia. Empire
Strongco Corporation Management s Discussion and Analysis
 Strongco Corporation Management s Discussion and Analysis The following management s discussion and analysis ( MD&A ) provides a review of the consolidated financial condition and results of operations
Detour Gold Achieves Production and Cost Guidance for 2017 and Provides 2018 Guidance
 January 16, 2018 NEWS RELEASE Detour Gold Achieves Production and Cost Guidance for 2017 and Provides 2018 Guidance Detour Gold Corporation (TSX: DGC) ( Detour Gold or the Company ) today announces fourth
AECON GROUP INC. We ARE Aecon. Second Quarter Report A We ARE Aecon 2016 Annual Report
 AECON GROUP INC. We ARE Aecon Second Quarter Report 2017 A We ARE Aecon 2016 Annual Report Dear Fellow Shareholders, Aecon s solid second quarter results demonstrate the strength of our diverse business
Aecon Group Inc. Management s Discussion and Analysis of Operating Results and Financial Condition. March 31, 2017
 Aecon Group Inc. Management s Discussion and Analysis of Operating Results and Financial Condition March 31, 2017 1 Management s Discussion And Analysis Of Operating Results And Financial Condition ( MD&A
Press Release For immediate release
 Press Release For immediate release Uni-Select reports its first quarter of 2018 driven by The Parts Alliance contribution: Sales up 42.0% to $422.1 million of which The Parts Alliance contribution represented
CANADA S INTERMEDIATE GOLD PRODUCER
 CANADA S INTERMEDIATE GOLD PRODUCER Third Quarter 2018 Results Conference Call & Webcast October 25, 2018 1 Cautionary Statement on Forward Looking Information This presentation contains certain forward-looking
SNC-Lavalin completes transformative acquisition of WS Atkins
 Press Release FOR IMMEDIATE RELEASE SNC-Lavalin completes transformative acquisition of WS Atkins To watch Neil Bruce and Heath Drewett discuss the acquisition, click here. MONTREAL: JULY 3, 2017 - SNC-Lavalin
Management Discussion and Analysis Second Quarter 2018 June 30, 2018
 Management Discussion and Analysis Second Quarter 2018 June 30, 2018 Management s Discussion and Analysis Basis of Presentation This Management s Discussion and Analysis ( MD&A ) has been prepared and
Sales $379.8 million Earnings Per Share $0.16. Net Income $5.0 million EBITDA $14.3 million
 Quarterly Report Ending June 30, 2017 TAIGA BUILDING PRODUCTS LTD Q1 Financial Highlights Sales $379.8 million Earnings Per Share $0.16 Net Income $5.0 million EBITDA $14.3 million Management's Discussion
Canadian Oil Sands Trust announces 2009 second quarter results
 Canadian Oil Sands Trust announces 2009 second quarter results All financial figures are unaudited and in Canadian dollars unless otherwise noted. TSX - COS.UN Calgary, Alberta (July 27, 2009) Canadian
CANADA S INTERMEDIATE GOLD PRODUCER
 CANADA S INTERMEDIATE GOLD PRODUCER Fourth Quarter and Year-End 2017 Results Conference Call & Webcast March 9, 2018 1 Forward Looking Information This presentation contains certain forward-looking information
CEMATRIX CORPORATION Management s Discussion and Analysis Three and Nine Months Ended September 30, Date Completed: November 15, 2017
 CEMATRIX CORPORATION Management s Discussion and Analysis Three and Nine Months Ended September 30, 2017 Date Completed: November 15, 2017 CEMATRIX CORPORATION www.cematrix.com Form 51-102F1 - Management
Management s Discussion and Analysis
 ) Management s Discussion and Analysis MD&A commentary is as of November 27, 2007. Unless otherwise indicated, all amounts are in Canadian dollars and have been derived from financial statements prepared
Electrical Products Group Conference
 Electrical Products Group Conference Craig Arnold Chairman and Chief Executive Officer May 22, 2017 Forward Looking Statements and Non-GAAP Financial Information This presentation or the comments we make
Third Quarter 2017 Earnings Teleconference. October 31, 2017
 Third Quarter 2017 Earnings Teleconference October 31, 2017 1 Participants Tom Linebarger Rich Freeland Pat Ward Mark Smith Chairman and Chief Executive Officer President and Chief Operating Officer Vice
contents Page Part 1 Introduction 2 Part 2 Performance Review 3 Part 3 Analysis of Consolidated Financial Statements 29
 Brookfield Asset Management SUPPLEMENTAL INFORMATION FOR THE QUARTER ENDED MARCH 31, contents Page Part 1 Introduction 2 Part 2 Performance Review 3 Part 3 Analysis of Consolidated Financial Statements
Third Quarter 2018 Management s Discussion and Analysis November 6, 2018
 Third Quarter 2018 Management s Discussion and Analysis November 6, 2018 TABLE OF CONTENTS About Stuart Olson Inc.... 2 Third Quarter 2018 Overview... 4 Strategy... 6 2018 Outlook... 8 Results of Operations...
Management s Discussion & Analysis Twelve months ended December 31, 2013
 Hyduke Energy Services Inc. 609-21 Avenue Nisku, Alberta, Canada, T9E 7X9 Telephone: (780) 955-0355 Facsimile: (780) 955-0368 TSX Symbol: HYD Website: www.hyduke.com Management s Discussion & Analysis
Not for distribution to U.S. News Wire Services or dissemination in the United States
 Choice Properties Real Estate Investment Trust Reports Solid Results for the Fourth Quarter Ended December 31, 2013 Closed the year on strong footing and well positioned to benefit from future potential
3Q 18 Earnings Call Presentation NOVEMBER 1, 2018
 3Q 18 Earnings Call Presentation NOVEMBER 1, 2018 1 Important Disclaimer This presentation contains certain statements and information that may constitute forward-looking statements within the meaning
Fourth Quarter 2017 Earnings Release
 Fourth Quarter 2017 Earnings Release BMO Financial Group Reports Net Income of $5.35 Billion, up 16%, for Fiscal 2017 Financial Results Highlights: Fourth Quarter 2017 Compared with Fourth Quarter 2016:
Press Release For immediate release
 Uni-Select Inc. Reports Third Quarter 2018 Financial Results: Sales up 13.4% to $448.8 million, driven by the contribution of TPA and organic growth; Consolidated organic growth (1) of 3.4% with positive
NEW WEST ENERGY SERVICES INC.
 The following MD&A dated September 29 th, 2010 focuses on key statistics from the consolidated financial statements and pertains to known risks and uncertainties related to the oilfield service industry
2017 FIRST QUARTER INTERIM REPORT
 2017 FIRST QUARTER INTERIM REPORT INTERIM MANAGEMENT S DISCUSSION AND ANALYSIS March 31, 2017 Quarterly highlights 3 Preliminary comments to Management s discussion and analysis 4 Profile and description
CANADA S INTERMEDIATE GOLD PRODUCER
 CANADA S INTERMEDIATE GOLD PRODUCER Second Quarter 2018 Results Conference Call & Webcast July 26, 2018 1 Cautionary Statement on Forward Looking Information This presentation contains certain forward-looking
INTERIM MANAGEMENT S DISCUSSION AND ANALYSIS QUARTERLY HIGHLIGHTS THREE MONTHS ENDED MARCH 31, 2016 (EXPRESSED IN CANADIAN DOLLARS)
") PROBE METALS INC. INTERIM MANAGEMENT S DISCUSSION AND ANALYSIS QUARTERLY HIGHLIGHTS THREE MONTHS ENDED MARCH 31, 2016 (EXPRESSED IN CANADIAN DOLLARS) The following interim Management s Discussion and Analysis
PROBE METALS INC. INTERIM MANAGEMENT S DISCUSSION AND ANALYSIS QUARTERLY HIGHLIGHTS THREE MONTHS ENDED MARCH 31, 2016 (EXPRESSED IN CANADIAN DOLLARS) The following interim Management s Discussion and Analysis
Corporate Presentation September 2017
 Corporate Presentation September 2017 Disclaimers General Advisory The information contained in this presentation does not purport to be all-inclusive or contain all information that readers may require.
TD Bank Group Reports First Quarter 2014 Results
 TD BANK GROUP FIRST QUARTER 2014 EARNINGS NEWS RELEASE Page 1 1 st Quarter 2014 Earnings News Release Three months ended January 31, 2014 TD Bank Group Reports First Quarter 2014 Results This quarterly
NEW WEST ENERGY SERVICES INC.
 The following MD&A dated December 23 rd, 2010 focuses on key statistics from the consolidated financial statements and pertains to known risks and uncertainties related to the oilfield service industry
Achieving our goals and. Annual Meeting of Shareholders. poised for growth
 Achieving our goals and poised for growth Conference call for the year and quarter ended December 31, 2016 Forward-Looking Statements (For definitions of capitalized terms, please refer to the Glossary
Third QUARTER 2018 For the three and nine months ended September 30, 2018
 Third QUARTER For the three and nine months ended September 30, This Management s Discussion and Analysis (MD&A) for ENTREC Corporation ( ENTREC, the Company, we, us or our ) was prepared as of November
September 15, 2016 News Release SILVER STANDARD PROVIDES MARIGOLD FIVE-YEAR OUTLOOK
 September 15, 2016 News Release 16 22 SILVER STANDARD PROVIDES MARIGOLD FIVE-YEAR OUTLOOK VANCOUVER, B.C. -- Silver Standard Resources Inc. (NASDAQ: SSRI) (TSX: SSO) ( Silver Standard ) is pleased to report
ECOLAB FOURTH QUARTER REPORTED DILUTED EPS $1.35 ADJUSTED DILUTED EPS $1.54, +12% 2019 ADJUSTED DILUTED EPS FORECAST $5.80 TO $6.
 News Release Ecolab Inc. 1 Ecolab Place, St. Paul, Minnesota 55102 FOR IMMEDIATE RELEASE Michael J. Monahan (651) 250-2809 Andrew C. Hedberg (651) 250-2185 ECOLAB FOURTH QUARTER REPORTED DILUTED EPS $1.35
Detour Gold Announces 2016 Operating Results and 2017 Guidance
 January 30, 2017 NEWS RELEASE Detour Gold Announces 2016 Operating Results and 2017 Guidance Detour Gold Corporation (TSX: DGC) ( Detour Gold or the Company ) today announces fourth quarter and full year
MANAGEMENT S DISCUSSION AND ANALYSIS OF FINANCIAL CONDITION AND RESULTS OF OPERATIONS
 MANAGEMENT S DISCUSSION AND ANALYSIS OF FINANCIAL CONDITION AND RESULTS OF OPERATIONS Table of Contents Forward Looking Statements... 1 Liquidity and Capital Resources... 12 Overview of the Business...
Q3 QUARTERLY REPORT. Richards Packaging Income Fund. Quarter ended September 30, Report Contents
 Q3 QUARTERLY REPORT Richards Packaging Income Fund Quarter ended September 30, 2017 Report Contents CEO s report to Unitholders... 1 Management s discussion and analysis... 2 Financial statements... 11
Management s Discussion and Analysis
 Management s Discussion and Analysis For the Period Ended: June 30, 2017 Date of Report: August 10, 2017 This management s discussion and analysis of the financial condition and results of operation (
Quarterly Report Ending June 30, 2016 TAIGA BUILDING PRODUCTS LTD. Q1 Financial Highlights. Sales $325.5 million. Earnings Per Share (loss) $0.
 $0.") Quarterly Report Ending June 30, 2016 TAIGA BUILDING PRODUCTS LTD Q1 Financial Highlights Sales $325.5 million Earnings Per Share (loss) $0.15 Net Income (loss) $4.8 million EBITDA $13.5 million Management's
Quarterly Report Ending June 30, 2016 TAIGA BUILDING PRODUCTS LTD Q1 Financial Highlights Sales $325.5 million Earnings Per Share (loss) $0.15 Net Income (loss) $4.8 million EBITDA $13.5 million Management's
FOR IMMEDIATE DISTRIBUTION June 27, 2017
 BADGER DAYLIGHTING LTD. UPDATES INVESTOR PRESENTATION PROVEN BUSINESS MODEL AND STRONG COMPETITIVE POSITION OFFERS A UNIQUE SERVICE TO ATTRACTIVE MARKETS EXECUTING ON A FOCUSED STRATEGY PRESS RELEASE TSX-BAD
The Second Cup Ltd. Management s Discussion and Analysis
 CAUTION REGARDING FORWARD-LOOKING STATEMENTS Certain statements in this ( MD&A ) may constitute forward-looking statements within the meaning of applicable securities legislation. The terms the Company,
TD Bank Group Reports Third Quarter 2012 Results
 TD BANK GROUP THIRD QUARTER 0 REPORT TO SHAREHOLDERS Page 3 rd Quarter 0 Report to Shareholders Three and Nine months ended July 3, 0 TD Bank Group Reports Third Quarter 0 Results The financial information
BADGER DAYLIGHTING LTD. ANNOUNCES RECORD SECOND QUARTER FINANCIAL RESULTS
 BADGER DAYLIGHTING LTD. ANNOUNCES RECORD SECOND QUARTER FINANCIAL RESULTS Calgary, AB, August 13, 2018 - Badger Daylighting Ltd. (the Company or Badger ) (TSX:BAD) announced today financial and operating
Management s Discussion and Analysis
 Management s Discussion and Analysis First Quarter of 2017 versus First Quarter of 2016 May 3, 2017 All financial information in Canadian dollars, unless otherwise indicated. Table of Contents 1 Our Business
LETTER TO THE SHAREOWNERS
 Q1 AKITA 2018 Q1 REPORT LETTER TO THE SHAREOWNERS Drilling Ltd. s net loss for the three months ended March 31, 2018 was $1,912,000 (net loss of $0.11 per share basic and diluted) on revenue of $27,089,000,
Réal Raymond. Chairman of the Board
 Réal Raymond Chairman of the Board 2 Agenda 1. Opening of the Meeting 2. Chairman and Secretary 3. Report of Scrutineers 4. Notice of Meeting 5. Minutes of the Annual Meeting of Shareholders Held on August
KRAKEN SONAR INC. MANAGEMENT DISCUSSION AND ANALYSIS FOR THE THREE AND NINE MONTH PERIOD ENDED SEPTEMBER 30, 2015
 KRAKEN SONAR INC. MANAGEMENT DISCUSSION AND ANALYSIS FOR THE THREE AND NINE MONTH PERIOD ENDED SEPTEMBER 30, 2015 This Management Discussion and Analysis ( MD&A ) of Kraken Sonar Inc. (the Company or Kraken
Quarterly Report Ending December 31, 2016 TAIGA BUILDING PRODUCTS LTD. Q3 Financial Highlights. Sales $277.4 million. Earnings Per Share $0.
 Quarterly Report Ending 2016 TAIGA BUILDING PRODUCTS LTD Q3 Financial Highlights Sales $277.4 million Earnings Per Share $0.00 Net Income/(Loss) ($0.2) million EBITDA $7.4 million Management's Discussion
Further information about the Company and its operations can be obtained from the offices of the Company or from
 Introduction This ( MD&A ) is dated February 28, 2018 unless otherwise indicated and should be read in conjunction with the unaudited consolidated condensed interim financial statements of GreenPower Motor
Second Quarter Three Months Ended June 30, 2018 CANADA S PREMIER NON-BANK LENDER
 Second Quarter 2018 Three Months Ended June 30, 2018 CANADA S PREMIER NON-BANK LENDER Table of Contents 1 Earnings Press Release 5 Management s Discussion and Analysis Interim Consolidated Financial Statements
BMO Financial Group Reports Fourth Quarter and Fiscal 2018 Results
 BMO Financial Group Reports Fourth Quarter and Fiscal 2018 Results Fourth Quarter 2018 Earnings Release Financial Results Highlights Fourth Quarter 2018 Compared with Fourth Quarter 2017: Net income of
LETTER TO SHAREHOLDERS
 LETTER TO SHAREHOLDERS The Company continued to deliver strong financial and operating results in the third quarter of 2011. Both of our business segments experienced increased revenues compared to the
MANAGEMENT S DISCUSSION AND ANALYSIS FOR THE 13 AND 26 WEEKS ENDED NOVEMBER 4, 2017
 MANAGEMENT S DISCUSSION AND ANALYSIS FOR THE 13 AND 26 WEEKS ENDED NOVEMBER 4, 2017 Forward-Looking Information... 1 Overview of the Business... 3 Food Retailing... 3 Summary Results Second Quarter...
ECOLAB SECOND QUARTER REPORTED DILUTED EPS $1.20 ADJUSTED DILUTED EPS $1.27, +13% FULL YEAR 2018 ADJUSTED DILUTED EPS FORECAST $5.
 News Release Ecolab Inc. 1 Ecolab Place, St. Paul, Minnesota 55102 FOR IMMEDIATE RELEASE Michael J. Monahan (651) 250-2809 Andrew C. Hedberg (651) 250-2185 ECOLAB SECOND QUARTER REPORTED DILUTED EPS $1.20
PRESIDENT S MESSAGE Page 1
 PRESIDENT S MESSAGE McCoy experienced a solid first quarter and continued to make progress on our strategic growth plan. We achieved record quarterly revenue from continuing operations during the first
Quarterly Report Ending June 30, Sales $335.8 million. Earnings Per Share $0.05 Net Income $1.5 million. EBITDA $9.6 million
 Quarterly Report Ending June 30, 2013 TAIGA BUILDING PRODUCTS LTD. Q1 Financial Highlights Sales $335.8 million Earnings Per Share $0.05 Net Income $1.5 million EBITDA $9.6 million Management's Discussion
MANAGEMENT S DISCUSSION AND ANALYSIS
 QUARTERLY REPORT FOR THE THREE MONTHS ENDED MARCH 31, 2018 MANAGEMENT S DISCUSSION AND ANALYSIS May 3, 20 The Management s Discussion and Analysis ( MD&A ) for Enerflex Ltd. ( Enerflex or the Company )
Press Release For immediate release
 Press Release For immediate release Uni-Select Inc. reports Q4 and full year 2018 results: Sales up 1.1% to $419.5 million in Q4 and up 21.0% to $1,752.0 million for 2018, driven by the full-year contribution
Financial and Operational Summary
 Choice Properties Real Estate Investment Trust Reports Results for the First Quarter Ended March 31, 2014 Continues to deliver solid, secure and predictable operating and financial performance Not for
MANAGEMENT S DISCUSSION & ANALYSIS (MD&A) Q1, 2013
 Q1, 2013") 2013 Q1 REPORT MANAGEMENT S DISCUSSION & ANALYSIS (MD&A) Q1, 2013 The following discussion of Gemini Corporation s financial and operating results is based upon information available to May 16, 2013 and
2013 Q1 REPORT MANAGEMENT S DISCUSSION & ANALYSIS (MD&A) Q1, 2013 The following discussion of Gemini Corporation s financial and operating results is based upon information available to May 16, 2013 and
Financial and Operational Summary
 Choice Properties Real Estate Investment Trust Reports Solid Third Quarter 2013 Results Executing on Growth Strategy with Financial and Operating Performance In Line with Expectations Not for distribution
Q2 Financial Highlights
 Q2 Financial Highlights Sales $383.6 million Earnings Per Share $0.17 Net Income $5.7 million EBITDA $13.7 million Quarterly Report Ending 2014 Management's Discussion and Analysis For the three and six
Shoal Point Energy Ltd.
 Shoal Point Energy Ltd. Suite 1060 1090 West Georgia Street Vancouver, B.C. V6E 3V7 Management Discussion and Analysis For The Three Months Ended July 31, 2013 The following Management Discussion and Analysis
Second Quarter 2018 Earnings Teleconference. July 31, 2018
 Second Quarter 2018 Earnings Teleconference July 31, 2018 CONTENTS Q2 2018 Summary 2018 Guidance Q2 2018 Supplemental Information Appendix 2 Disclosure Regarding Forward-Looking Statements Information
2018 SECOND QUARTER INTERIM REPORT
 2018 SECOND QUARTER INTERIM REPORT INTERIM MANAGEMENT S DISCUSSION AND ANALYSIS June 30, 2018 Quarterly highlights 3 Preliminary comments to Management s discussion and analysis 4 Profile and description
AECON GROUP INC. We ARE Aecon. Third Quarter Report C We ARE Aecon 2016 Annual Report
 AECON GROUP INC. We ARE Aecon Third Quarter Report C We ARE Aecon Annual Report Dear Fellow Shareholders, As announced on October 26,, Aecon has entered into a definitive agreement with CCCC International
WESDOME GOLD MINES LTD. MANAGEMENT S DISCUSSION AND ANALYSIS FOR THE NINE MONTHS ENDED
 WESDOME GOLD MINES LTD. MANAGEMENT S DISCUSSION AND ANALYSIS FOR THE NINE MONTHS ENDED SEPTEMBER 30, 2014 MANAGEMENT S DISCUSSION AND ANALYSIS Third Quarter Report September 30, 2014 The following Management
Mullen Group Ltd. Reports 2017 Financial Results including Record Trucking/Logistics Segment Financial Results
 NEWS RELEASE Head Office: Mullen Group Ltd. Reports 2017 Financial Results including Record Trucking/Logistics Segment Financial Results 121A - 31 Southridge Drive Okotoks, Alberta, Canada T1S 2N3 Tel:
Second Quarter 2016 Report to Shareholders
 Second Quarter 2016 Report to Shareholders BMO Financial Group Reports Net Income of $973 Million for the Second Quarter of 2016 Financial Results Highlights: Second Quarter 2016 Compared with Second Quarter
Second Quarter 2017 Report to Shareholders
 Second Quarter 2017 Report to Shareholders BMO Financial Group Reports Net Income of $1.25 Billion for Second Quarter of 2017 Financial Results Highlights: Second Quarter 2017 Compared with Second Quarter
MANAGEMENT S DISCUSSION AND ANALYSIS
 MANAGEMENT S DISCUSSION AND ANALYSIS For the quarter ended March 31, 2016 and 2015 The following Management s Discussion and Analysis ( MD&A ) is prepared as at May 12, 2016 and is based on the consolidated
Canadian Oil Sands Trust announces 2009 third quarter results
 Canadian Oil Sands Trust announces 2009 third quarter results All financial figures are unaudited and in Canadian dollars unless otherwise noted. TSX - COS.UN Calgary, Alberta (October 28, 2009) Canadian
INTERIM MANAGEMENT DISCUSSION AND ANALYSIS FIRST QUARTER 2013
 Q1 INTERIM MANAGEMENT DISCUSSION AND ANALYSIS FIRST QUARTER 2013 SUMMARY - Uni-Select posted sales of $421.8 million during the quarter, a negative organic growth of 1.1%. Our operations were affected
Jefferies Global Industrial and A&D Conference. Jay Craig, Senior VP & CFO Mary Lehmann, Senior VP, Treasury & Tax. August 9, 2011
 Jefferies Global Industrial and A&D Conference Jay Craig, Senior VP & CFO Mary Lehmann, Senior VP, Treasury & Tax August 9, 2011 1 Forward-Looking Statements This release contains statements relating to
Petrowest Corporation MANAGEMENT PRESENTATION
 Petrowest Corporation MANAGEMENT PRESENTATION Year Ended December 31, 2014 forward-looking statements FORWARD-LOOKING INFORMATION This presentation included forward-looking information within the meaning