Safe Harbor Statement
|
|
|
- Bernard Carter
- 5 years ago
- Views:
Transcription


1 April 2019


2 Safe Harbor Statement All statements in this presentation that are not historical are forward-looking statements within the meaning of Section 21E of the Securities Exchange Act of Such forward-looking statements may be identified by words such as believe, intend, expect, may, could, would, will, should, plan, project, contemplate, anticipate, or similar statements. Because these statements reflect the current views of Argan, Inc. ( Argan or the Company ) concerning future events, these forward-looking statements are subject to risks and uncertainties. Argan s actual results could differ materially from those anticipated in these forward-looking statements as a result of many factors, which are described under the caption Risk Factors in Argan s most recent Form 10-K filed with the Securities and Exchange Commission. Argan undertakes no obligation to update publicly any forward-looking statements contained in this presentation. 2

3 Company Overview 3 NYSE: AGX Holding company for four 100% controlled subsidiaries Market capitalization (4/8/19) $0.8 billion Strong annual rate of return 5/3/1yr = 16%/18%/21%* Quarterly dividend $0.25 per share January 31, 2019 (in millions) Quarter Ended Year Ended Revenues $ 88 $ 482 Net Income** (2) 52 EBITDA** (1) 52 Strong balance sheet at 1/31/19 No leverage Cash & short-term investments - $297 million Net liquidity - $335 million Project backlog (1/31/19) $1.1 billion * As of 4/8/2019 ** Attributable to the Stockholders of AGX
4 Business Overview Holding Company 4 Gemma Power Systems ( GPS ) provides engineering, procurement and construction ( EPC ) services to power generation and renewable energy markets The Roberts Company ( TRC ) is principally an industrial steel fabricator and field services provider serving both light and heavy industrial organizations Atlantic Projects Company ( APC ) provides turbine, boiler, large rotating equipment installation, commissioning and outage services to the global power industry SMC Infrastructure Solutions ( SMC ) provides telecommunications data infrastructure services 2019 Revenues by Subsidiary 21.1% 23.4% 2.6% 52.9%
5 $ Millions Revenues* $900 $893 $800 $700 $600 $675 $500 $400 $413 $482 $300 $383 $200 $279 $227 $100 $142 $ With several major projects completed in the year ended January 31, 2019, we expect our revenues and several other financial metrics to be lower in the first half of Fiscal 2020 compared to prior years.


6 $ Millions Net Income* $80 $70 $70.3 $72.0 $60 $50 $52.0 $40 $30 $40.1 $30.4 $36.3 $20 $23.3 $10 $- $ * Attributable to the Stockholders of AGX
7 $ Millions EBITDA* $120 $100 $110.6 $116.1 CAGR 22% $80 $60 $66.3 $62.9 $52.2 $52.5 $40 $37.7 $20 $12.9 $ * Attributable to the Stockholders of AGX

8 Book Value $30.00 Tangible Book Value* & Cumulative Dividends Per Share $25.00 $6.25 $5.25 $20.00 $4.25 $15.00 $10.00 $1.85 $2.55 $3.25 $20.34 $22.83 $5.00 $0.50 $5.87 $1.10 $7.16 $9.50 $11.29 $11.58 $16.08 $ Tangible Book Value Cumulative Dividends *Tangible Book Value = Total Stockholders Equity Goodwill Other Intangible Assets
9 Annual Financial Results (in thousands, except per share data) January 31, Change % Change For the Fiscal Year Ended: Revenues $ 482,153 $ 892,815 $ (410,662) (46.0)% Gross profit 82, ,325 (66,887) (44.8) Gross margins 17.1% 16.7% 0.4% 2.2 Net Income attributable to stockholders of the Company $ 52,036 $ 72,011 $ (19,975) (27.7) Diluted per share (1.24) (27.2) EBITDA attributable to stockholders of the Company 52, ,101 (63,623) (54.8) Diluted per share (4.02) (54.6) As of: Cash, cash equivalents and short-term investments $ 296,531 $ 434,015 $ (137,484) (31.7)% Net Liquidity (1) 334, ,817 32, Project backlog 1,094, , , (1) We define Net Liquidity, or working capital, as our total current assets less our total current liabilities.
10 Annual Financial Drivers As construction activity on four large natural gas-fired power plant would down during the current year, consolidated revenues for Fiscal 2019 declined to $482.2 from $892.8 million for Fiscal 2018 when the construction activity on all of these projects were at peak or near-peak levels. However, we are encouraged by the growth in the revenues of our other operating units (TRC, APC, and SMC) which more than doubled during the current fiscal year compared to the prior fiscal year. Gross profits decreased reflecting primarily the reduction in consolidated revenues between periods. Our gross margin percentage increased year over year, reflecting favorable project close-out adjustments to the gross profits of certain projects that have reached final completion. We completed a yearlong detailed review of the activities performed by its engineering staff on major EPC services projects in order to identify and quantify the amounts of research and development credits ( R&D ). Based on this review, we booked a $16.6 million tax benefit in the current year. The Tax Cuts and Jobs Act had a favorable impact on our tax rate, resulting in an annual effective income tax rate of 30% for the current year (before R&D), compared to 36% for the prior year. Our balance sheet remains strong. As of January 31, 2019, our cash, cash equivalents and short-term investments totaled $297 million and adjusted net liquidity was $334 million; plus, we had no bank debt. Our project backlog strengthened to $1.1 billion as of January 31, 2019 from $379 million at the end of the prior year, as we entered three EPC services contracts (two reflected in backlog) to construct state-of-the-art natural gas-fired power plants. 10
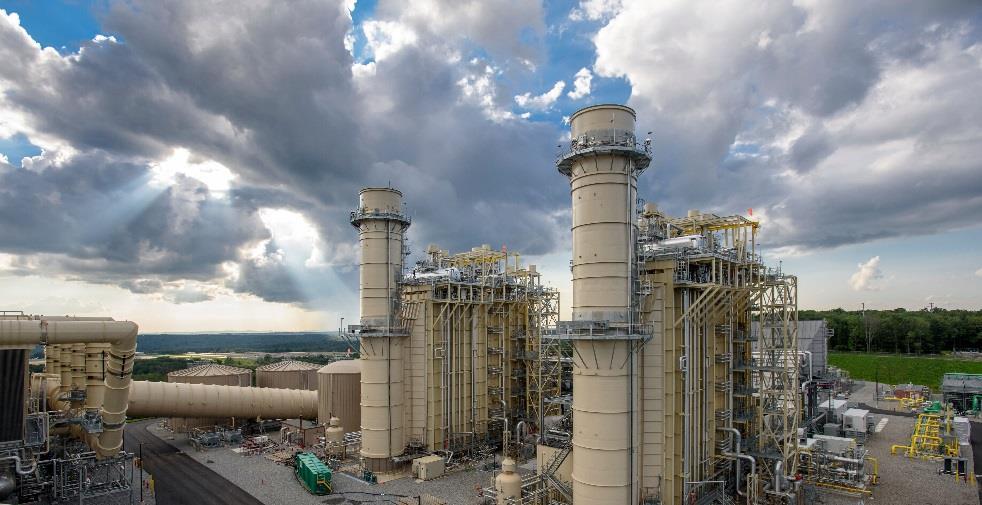
11 Overview of Gemma Power Systems 11 History acquired by Argan in December 2006 for $33 million and has generated cumulative EBITDA since acquisition of over $630 million, or ~19x cash on cash and an IRR in excess of 74% Business engineering, procurement and construction of natural gasfired and alternative power energy facilities throughout the United States Track Record Installed and under-contract capacity for 15 gigawatts of mostly domestic power-generating capacity including 65 gas turbines comprising 40 projects Safety Record 10 million safe hours achieved over the past seven years. Gemma s OSHA recordable injury rate is significantly below the national average Employees Over 20% of staff employees are veterans Customers Independent power producers and utilities
12 Extensive Project Portfolio 12 Power facilities combined cycle solution Caithness Moxie Freedom Generating Plant CPV Towantic Energy Center NTE Kings Mountain Energy Center NTE Middletown Energy Center Panda Liberty Energy Project Panda Patriot Energy Project Colusa Generating Station Roseville Energy Park Hines PB-2 Power Project Rowan County Power Project Effingham County Power Project Richmond County Phase II Power Project Dighton Power Project Pollution solutions Brayton Point Power Station La Rosita SCR Project Biomass power facilities - Woodville, Texas Solar facilities - Canton, MA - Carver, MA - Beaumont Solar Power facilities simple cycle solution Exelon West Medway II Facility CPV Sentinel Energy Project A.L. Pierce Re-powering Project Vandolah Power Project DeSoto County Power Project Indigo Energy Facility Larkspur Energy Facility Richmond County Phase I Power Monroe Power Project Richland Peaking Project Rocky Road Unit 4 Project Broad River Energy Center Middletown, CT Project Process facilities biodiesel Renewable BioFuels Port Neches Galena Park Green Earth Fuels Houston LLC Process facilities ethanol Carleton Ethanol Facility Wind Facilities - LaSalle County, Illinois - Vantage, Washington - Henry County, Illinois - Ebensburg, Pennsylvania
13 Construction Services Peer Group Stock 12 Month LTM LTM Return Price Total Market Debt/ LTM Gross EBITDA on Avg. Ticker Company Name 3 /15 / Return Cap Equity Revenue Margin Margin Equity AGX Argan, Inc. $49.34 % 24.9 % $ X $ % 10.2 % 16.4% FLR Fluor Corporation $ $5, $19, GVA Granite Construction Incorporated $ $2, $3, JEC Jacobs Engineering Group Inc. $ $10, $16, KBR KBR, Inc. $ $2, $4, MDR McDermott International Inc. $ $1, $6, NEG ORN Orion Group Holdings, Inc. $ $ $ TPC Tutor Perini Corporation $ $ $4, PRIM Primoris Services Corporation $ $1, $2, TSX-SNC SNC-Lavalin Group Inc. $ $6, $10, NEG STRL Sterling Construction Co. Inc. $ $ $1, Mean -14.5% 0.8x 10.8% 6.1% 9.0% NEG: Negative 13 Source: Stifel - Engineering, Construction and Infrastructure Newsletter (3/19/2019)


14 Investment Summary Consistent strong operational performance Excellent safety record Large bidding pipeline Strong balance sheet - substantial liquidity and no leverage Strong annual rate of return 5yr/3yr/1yr = 16%/18%/21%* Quarterly dividend of $0.25 per share in fiscal year 2019, for an annual total of $1.00 per share Experienced management team 14 *As of 4/8/2019
15 Corporate Data Investor Relations Investor Relations Corporate Headquarters Argan, Inc. One Church Street, Suite 201 Rockville, Maryland NYSE Listing Common: AGX Websites Argan, Inc. Gemma Power Systems The Roberts Company Atlantic Projects Company SMC Infrastructure Solutions 15
16 Appendix Consolidated Income Statements - Year (in thousands except per share amounts) Years Ended Janaury 31, Revenues $ 482,153 $ 892,815 $ 675,047 Cost of revenues 399, , ,336 Gross Profit 82, , ,711 Gross Profit % 17.1% 16.7% 21.7% Impairment loss 1, ,979 Selling, general and administrative expenses 40,710 41,763 32,478 Income from operations 40, , ,254 Other income, net 6,981 5,648 2,278 Income before income taxes 47, , ,532 Income tax (benefit) expense (4,651) 40,280 37,106 Net Income 51,869 72,346 77,426 Net (loss) income attributable to noncontrolling interests (167) 335 7,098 Net income attributable to the stockholders of AGX $ 52,036 $ 72,011 $ 70,328 EPS attributable to the stockholders of Argan, Inc. Basic $ 3.34 $ 4.64 $ 4.67 Diluted $ 3.32 $ 4.56 $ Weighted average number of shares outstanding Basic Diluted 15,569 15,522 15,066 15,693 15,780 15,625 Cash dividends per share $ 1.00 $ 1.00 $ 1.00
17 Appendix Consolidated Income Statements - Quarter (in thousands except per share amounts) Three Months Ended 31-Jan Oct Jul Apr Jan-18 Revenues $ 87,658 $ 116,459 $ 136,670 $ 141,366 $ 169,578 Cost of revenues 80,912 86, , , ,474 Gross Profit 6,746 29,532 30,708 15,452 20,104 Gross Profit % 7.7% 25.4% 22.5% 10.9% 11.9% Impairment loss 1, Selling, general and administrative expenses 9,548 11,147 10,378 9,637 11,356 (Loss) Income from operations (4,293) 18,385 20,330 5,815 8,164 Other income, net 1,860 1,429 2, ,427 (Loss) Income before income taxes (2,433) 19,814 23,258 6,579 9,591 Income tax (benefit) expense (142) (12,560) 6,314 1,737 2,541 Net (Loss) Income (2,291) 32,374 16,944 4,842 7,050 Net (loss) income attributable to noncontrolling interests (84) (60) (28) 5 32 Net (loss) income attributable to the stockholders of AGX $ (2,207) $ 32,434 $ 16,972 $ 4,837 $ 7,018 EPS attributable to the stockholders of Argan, Inc. Basic $ (0.14) $ 2.08 $ 1.09 $ 0.31 $ 0.45 Diluted $ (0.14) $ 2.07 $ 1.08 $ 0.31 $ 0.45 Weighted average number of shares outstanding Basic 15,573 15,569 15,568 15,568 15,559 Diluted 15,573 15,702 15,673 15,656 15,743 Cash dividends per share $ 0.25 $ 0.25 $ 0.25 $ 0.25 $ 17
18 Appendix Reconciliations to EBITDA Consolidated (in thousands except per share amounts) Three Months Ended 31-Jan Oct Jul Apr Jan-18 Net (loss) income $ (2,291) $ 32,374 $ 16,944 $ 4,842 $ 7,050 Less EBITDA attributable to noncontrolling interests (5) (32) Interest expense Income tax (benefit) expense (142) (12,560) 6,314 1,737 2,541 Depreciation Amortization of purchased intangible assets EBITDA attributable to the stockholders of Argan, Inc. $ (1,139) $ 21,025 $ 24,445 $ 8,147 $ 10,658 EBITDA per diluted share $ (0.07) $ 1.34 $ 1.56 $ 0.52 $ 0.68 Years Ended Janaury 31, Net income $ 51,869 $ 72,346 $ 77,426 Less EBITDA attributable to noncontrolling interests 167 (335) (7,098) Interest expense 659 Income tax (benefit) expense (4,651) 40,280 37,106 Depreciation 3,422 2,779 2,043 Amortization of purchased intangible assets 1,012 1,031 1,163 EBITDA attributable to the stockholders of Argan, Inc. $ 52,478 $ 116,101 $ 110,640 EBITDA per diluted share $ 3.34 $ 7.36 $ 7.08
19 Appendix Consolidated Balance Sheets - Assets (dollars in thousands) ASSETS January 31, 2019 January 31, 2018 CURRENT ASSETS Cash and cash equivalents $ 164,318 $ 122,107 Short-term investments 132, ,908 Accounts receivable, net 36,174 26,287 Contract assets 58,357 13,847 Other current assets 25,286 10,878 TOTAL CURRENT ASSETS 416, ,027 Property, plant and equipment, net 19,778 15,299 Goodwill 32,838 34,329 Other purchased intangible assets, net 6,137 7,149 Deferred taxes 1, Other assets TOTAL ASSETS $ 476,648 $ 542,669 19
20 Appendix Consolidated Balance Sheets Liabilities and Equity (dollars in thousands) LIABILITIES AND EQUITY January 31, 2019 January 31, 2018 CURRENT LIABILITIES Accounts payable $ 44,427 $ 100,238 Accrued expenses 29,500 35,360 Contract liabilities 8,349 47,664 TOTAL CURRENT LIABILITIES 82, ,262 Deferred taxes 1,279 TOTAL LIABILITIES 82, , STOCKHOLDERS EQUITY Common stock 2,337 2,336 Additional paid-in capital 144, ,215 Retained earnings 247, ,112 Accumulated other comprehensive (loss) income (346) 1,422 TOTAL STOCKHOLDERS EQUITY 394, ,085 Non-controlling interests (196) 43 TOTAL EQUITY 394, ,128 TOTAL LIABILITIES AND EQUITY $ 476,648 $ 542,669
AGAN, INC. June June 2011
 AGAN, INC. June 2010 June 2011 December 2018 Safe Harbor Statement All statements in this presentation that are not historical are forwardlooking statements within the meaning of Section 21E of the Securities
AGAN, INC. June June 2011
 AGAN, INC. June 2010 June 2011 September 2018 Safe Harbor Statement All statements in this presentation that are not historical are forwardlooking statements within the meaning of Section 21E of the Securities
AGAN, INC. June June 2011
 AGAN, INC. June 2010 June 2011 September 2017 Disclaimer All statements in this presentation that are not historical are forwardlooking statements within the meaning of Section 21E of the Securities Exchange
AGAN, INC. June June 2011
 AGAN, INC. June 2010 June 2011 April 2018 Disclaimer All statements in this presentation that are not historical are forwardlooking statements within the meaning of Section 21E of the Securities Exchange
Argan, Inc. Reports Year-End and Fourth Quarter Results
 Argan, Inc. Reports Year-End and Fourth Quarter Results Declares Quarterly Dividend of $0.25 Per Share April 10, 2019 ROCKVILLE, MD Argan, Inc. (NYSE: AGX) ( Argan or the Company ) today announced financial
Argan, Inc. Reports Second Quarter Results
 Argan, Inc. Reports Second Quarter Results September 7, 2017 ROCKVILLE, MD Argan, Inc. (NYSE: AGX) ( Argan or the Company ) today announced financial results for its second quarter ended July 31, 2017.
Argan, Inc. Reports First Quarter Results
 Argan, Inc. Reports First Quarter Results June 11, 2018 ROCKVILLE, MD Argan, Inc. (NYSE: AGX) ( Argan or the Company ) today announced financial results for its first quarter ended April 30, 2018. For
Argan, Inc. Reports Fourth Quarter and Year End Results
 Argan, Inc. Reports Fourth Quarter and Year End Results April 10, ROCKVILLE, MD Argan, Inc. (NYSE: AGX) today announced financial results for the three months and fiscal year ended. For the year ended,
ARGAN, INC. REPORTS THIRD QUARTER EARNINGS
 ARGAN, INC. REPORTS THIRD QUARTER EARNINGS December 8, 2014 ROCKVILLE, MD Argan, Inc. (NYSE: AGX) today announced financial results for the three and nine months ended October 31, 2014. For the quarter
Argan, Inc. Reports Year-End and Fourth Quarter Results
 Argan, Inc. Reports Year-End and Fourth Quarter Results Declares 1 st Quarterly Dividend of $0.25 Per Share April 11, 2018 ROCKVILLE, MD Argan, Inc. (NYSE: AGX) ( Argan or the Company ) today announced
Argan, Inc. Reports First Quarter Results
 Argan, Inc. Reports First Quarter Results June 8, 2015 ROCKVILLE, MD Argan, Inc. (NYSE: AGX) today announced financial results for its first quarter ended April 30, 2015. First Quarter Highlights: Revenues
UNITED STATES SECURITIES AND EXCHANGE COMMISSION Washington, D.C FORM 10 Q
 10 Q 1 a17 13089_110q.htm 10 Q (Mark One) UNITED STATES SECURITIES AND EXCHANGE COMMISSION Washington, D.C. 20549 FORM 10 Q QUARTERLY REPORT PURSUANT TO SECTION 13 OR 15(D) OF THE SECURITIES EXCHANGE ACT
Argan Inc. (NYSE: AGX) $29.97
 $29.97") Argan Inc. (NYSE: AGX) $29.97 Table of Contents Recommendation Business Overview Safe Valuation Catalysts Negatives Questions Recommendation Purchase Argan Inc. s equity at $30.00 This would provide a
Argan Inc. (NYSE: AGX) $29.97 Table of Contents Recommendation Business Overview Safe Valuation Catalysts Negatives Questions Recommendation Purchase Argan Inc. s equity at $30.00 This would provide a
Reconciliation of Non-GAAP Measures
 Earnings Before Interest, Taxes, Depreciation, Amortization and Goodwill & Intangible Asset Impairment Q4-2015 Q4-2016 Net income applicable to TRC Companies, Inc.'s common shareholders $6.8 $5.9 Interest
Coverage Andres Emmett Diz Senior Analyst
 Argan Inc. Construction & Engineering Industry March 16 th, 2015 Argan Inc. Exchange: NYSE Coverage Andres Emmett Diz Senior Analyst Emmett.Diz@orangevaluefund.com Security Ticker: AGX Business Description
Reconciliation of Non-GAAP Measures
 Earnings Before Interest, Taxes, Depreciation, Amortization and Acquisition & Integration Expenses Net income applicable to TRC Companies, Inc.'s common shareholders $ 3,998 $ 3,937 Interest expense 841
MIC. Fourth Quarter 2017 Earnings Conference Call Support Slides. February 2018
 MIC Fourth Quarter 2017 Earnings Conference Call Support Slides February 2018 Disclaimer This presentation by Macquarie Infrastructure Corporation (MIC) is proprietary and all rights are reserved. Any
PRIM Q Earnings Call May 8th, 2018
 PRIM Q1 2018 Earnings Call May 8th, 2018 Disclosure Regarding Forward-Looking Statements This presentation contains certain forward-looking statements within the meaning of the Private Securities Litigation
Three Months Ended Twelve Months Ended 12/31/ /31/ /31/ /31/
 Consolidated Statements of Operations (In thousands, except share and per share data) TABLE 1 Software licenses $11,336 $8,901 $37,859 $30,709 Support and maintenance 12,631 12,194 49,163 45,591 Professional
Primoris Services Corporation Announces 2018 Third Quarter Financial Results
 Primoris Services Corporation Announces 2018 Third Quarter Financial Results November 6, 2018 Board of Directors Declares $0.06 Per Share Cash Dividend Financial Highlights 2018 Q3 revenues of $908.9 million,
Third Quarter 2016 Supplementary Slides
 Third Quarter 2016 Supplementary Slides November 9, 2016 2016 SunPower Corporation 2016 SunPower Corporation 1 Safe Harbor Statement This presentation contains forward-looking statements within the meaning
First Quarter Fiscal Year 2018 Conference Call. February 2, 2018
 First Quarter Fiscal Year 2018 Conference Call February 2, 2018 Agenda First Quarter Fiscal Year 2018 Review Bill Johnson, President and Chief Executive Officer Review of Financial Performance John Thomas,
Corporate Presentation. March 5, 2016 NYSE: MTZ
 Corporate Presentation March 5, 2016 NYSE: MTZ Safe Harbor Statement This presentation contains forward-looking statements within the meaning of the Private Securities Litigation Reform Act. When used
Investor Presentation May Alaskan Way Viaduct (SR 99) Replacement Project, Seattle
 Replacement Project, Seattle") Investor Presentation May 2018 Alaskan Way Viaduct (SR 99) Replacement Project, Seattle Forward-Looking Statements Statements contained in this presentation that are not purely historical are forward-looking
Investor Presentation May 2018 Alaskan Way Viaduct (SR 99) Replacement Project, Seattle Forward-Looking Statements Statements contained in this presentation that are not purely historical are forward-looking
PSEG ANNOUNCES 2018 RESULTS NET INCOME OF $2.83 PER SHARE NON-GAAP OPERATING EARNINGS OF $3.12 PER SHARE
 For further information, contact: Investor News NYSE: PEG Carlotta Chan, Senior Director Investor Relations Phone: 973-430-6565 Brian Reighn, Manager Investor Relations Phone: 973-430-6596 PSEG ANNOUNCES
ACQUISITION AND INTEGRATION EXPENSES - 19,
 Unaudited Investors Report 2015 2016 2017 2018 ($ in Thousands, Except Per Share Data) Total Total 1st Qtr 2nd Qtr 6 mos 3rd Qtr 9 mos 4th Qtr Total 1st Qtr 2nd Qtr 6 mos 3rd Qtr 9 mos 4th Qtr Total REVENUE
SELLING, GENERAL AND ADMINISTRATIVE EXPENSES 170, ,985 41,506 45,195 86,702 44, ,068 46, ,219 45,556 46,792 92,348 50, ,820
 Unaudited Investors Report 2015 2016 2017 2018 ($ in Thousands, Except Per Share Data) Total Total 1st Qtr 2nd Qtr 6 mos 3rd Qtr 9 mos 4th Qtr Total 1st Qtr 2nd Qtr 6 mos 3rd Qtr 9 mos REVENUE 2,299,321
4 th Quarter 2018 Earnings Release Conference Call
 4 th Quarter 2018 Earnings Release Conference Call February 20, 2019 1 2019 Belden Inc. belden.com @beldeninc Safe Harbor Statement Our commentary and responses to your questions may contain forward-looking
3 rd Quarter 2018 Earnings Release Conference Call
 3 rd Quarter 2018 Earnings Release Conference Call October 31, 2018 1 2018 Belden Inc. belden.com @beldeninc Safe Harbor Statement Our commentary and responses to your questions may contain forward-looking
Investor Presentation December Alaskan Way Viaduct (SR-99) Replacement Project, Seattle
 Replacement Project, Seattle") Investor Presentation December 2017 Alaskan Way Viaduct (SR-99) Replacement Project, Seattle Forward-Looking Statements Statements contained in this presentation that are not purely historical are forward-looking
Investor Presentation December 2017 Alaskan Way Viaduct (SR-99) Replacement Project, Seattle Forward-Looking Statements Statements contained in this presentation that are not purely historical are forward-looking
D.A. Davidson & Co. Engineering & Construction Conference September 20, 2017 Chicago, IL
 D.A. Davidson & Co. Engineering & Construction Conference September 20, 2017 Chicago, IL Alaskan Way Viaduct (SR-99) Replacement Project, Seattle Forward-Looking Statements Statements contained in this
Primoris Services Corporation Announces 2017 Fourth Quarter and Full Year Financial Results
 Primoris Services Corporation Announces 2017 Fourth Quarter and Full Year Financial Results February 26, 2018 Board of Directors Declares $0.06 Per Share Cash Dividend Financial Highlights 2017 net income
Reconciliation of key non-gaap consolidated financial metrics to Legacy Cypress metrics. Three months ended March 29, 2015 Impact of the merger and
 Reconciliation of key non-gaap consolidated financial metrics to Legacy Cypress metrics Three months ended March 29, 2015 Impact of the merger and Spansion Legacy Consolidated operations Cypress Revenue
Contact: Marybeth Flater FOR IMMEDIATE RELEASE Exelon Investor Relations
 Contact: Marybeth Flater FOR IMMEDIATE RELEASE Exelon Investor Relations 312-394-8354 Jennifer Medley Exelon Corporate Communications 312-394-7189 Exelon Announces Strong Operating Results; Records $1.2
CPSI Announces Third Quarter 2018 Results
 CPSI Announces Third Quarter 2018 Results November 1, 2018 Company Announces Quarterly Cash Dividend of $0.10 Per Share MOBILE, Ala.--(BUSINESS WIRE)--Nov. 1, 2018-- CPSI (NASDAQ: CPSI): Highlights for
CIRCOR Reports Fourth-Quarter and Year-End 2013 Financial Results
 30 CORPORATE DRIVE, SUITE 200 BURLINGTON, MA 01803 781-270-1200 WWW.CIRCOR.COM Press Release CIRCOR Reports Fourth-Quarter and Year-End Financial Results Burlington, MA February 27, 2014 CIRCOR International,
NYSE: WES, WGP
 NYSE: WES, WGP Western Gas Cautionary Language Re: Forward-Looking Statements This presentation contains forward-looking statements. Western Gas Partners, LP and Western Gas Equity Partners, LP believe
Digital River, Inc. Second Quarter Results (Unaudited, in thousands) Subject to reclassification
 Subject to reclassification") (Unaudited, in thousands) Condensed Consolidated Balance Sheets As of December 31, 2008 2007 Assets: Current assets Cash and cash equivalents $ 276,927 $ 381,788 Short-term investments 201,297 315,636
(Unaudited, in thousands) Condensed Consolidated Balance Sheets As of December 31, 2008 2007 Assets: Current assets Cash and cash equivalents $ 276,927 $ 381,788 Short-term investments 201,297 315,636
Media Contact: Meghan Dotter Investor Contact: Ahmed Pasha
 Media Contact: Meghan Dotter 703 682 6670 Investor Contact: Ahmed Pasha 703 682 6451 AES Meets Full Year 2009 Adjusted Earnings Per Share and Proportional Free Cash Flow Guidance Full year Proportional
Investor Presentation February Alaskan Way Viaduct (SR 99) Replacement Project, Seattle
 Replacement Project, Seattle") Investor Presentation February 2019 Alaskan Way Viaduct (SR 99) Replacement Project, Seattle Forward-Looking Statements Statements contained in this presentation that are not purely historical are forward-looking
Investor Presentation February 2019 Alaskan Way Viaduct (SR 99) Replacement Project, Seattle Forward-Looking Statements Statements contained in this presentation that are not purely historical are forward-looking
Industry Update Heavy Construction Q4 2017
 Industry Update Heavy Construction Q4 2017 New York Boston Chicago Orlando Philadelphia Princeton www.mpival.com Table of Contents * Industry Overview... 2 Key Indicators... 4 M&A Overview 1... 5 Public
Building America's Infrastructure
 Investor Presentation September 2017 Building America's Infrastructure Disclosure Regarding Forward-Looking Statements This presentation contains certain forward-looking statements within the meaning of
WELLS FARGO PIPELINE, MLP & UTILITY SYMPOSIUM
 W E S T E R N G A S I N V E S T O R R E L A T I O N S JON VANDENBRAND Director, Investor Relations (832) 636-1007 WELLS FARGO PIPELINE, MLP & UTILITY SYMPOSIUM December 6, 2016 Benjamin M. Fink Senior
FOURTH-QUARTER AND FULL-YEAR 2015 EARNINGS. Feb. 22, 2016
 FOURTH-QUARTER AND FULL-YEAR 2015 EARNINGS Feb. 22, 2016 FORWARD-LOOKING STATEMENTS Statements contained in this presentation that include company expectations or predictions should be considered forward-looking
2018 SECOND QUARTER FINANCIAL RESULTS
 2018 SECOND QUARTER FINANCIAL RESULTS July 30, 2018 0 SAFE HARBOR STATEMENT The 2018 second quarter news release, conference call webcast, and the following slides contain forward-looking statements. The
JABIL CIRCUIT, INC. AND SUBSIDIARIES CONDENSED CONSOLIDATED BALANCE SHEETS
 CONDENSED CONSOLIDATED BALANCE SHEETS (In thousands) 2011 2010 ASSETS Current assets: Cash and cash equivalents $ 888,611 $ 744,329 Trade accounts receivable, net 1,100,926 1,408,319 Inventories 2,227,339
NCI Building Systems Reports Strong Second Fiscal Quarter 2016 Results
 NEWS RELEASE NCI Building Systems Reports Strong Second Fiscal Quarter 2016 Results HOUSTON, May 31, 2016 NCI Building Systems, Inc. (NYSE: NCS) ( NCI or the Company ) today reported financial results
Valero Energy Reports Third Quarter 2018 Results
 Valero Energy Reports Third Quarter 2018 Results Reported net income attributable to Valero stockholders of $856 million, or $2.01 per share. Invested $604 million of capital in the third quarter. Approved
Jacobs Engineering Group Inc. (Exact name of Registrant as specified in its charter)
") UNITED STATES SECURITIES AND EXCHANGE COMMISSION Washington, DC 20549 Form 8-K Current Report Pursuant to Section 13 or 15(d) of The Securities Exchange Act of 1934 Date of Report (date of earliest event
UNITED STATES SECURITIES AND EXCHANGE COMMISSION Washington, DC 20549 Form 8-K Current Report Pursuant to Section 13 or 15(d) of The Securities Exchange Act of 1934 Date of Report (date of earliest event
PITNEY BOWES ANNOUNCES SECOND QUARTER 2013 RESULTS
 Editorial Sheryl Y. Battles VP, Corp. Communications 203/351-6808 Financial Charles F. McBride VP, Investor Relations 203/351-6349 Website www.pitneybowes.com PITNEY BOWES ANNOUNCES SECOND QUARTER 2013
Williams and Williams Partners 2 nd Quarter Earnings Call August 2, 2018
 WE MAKE ENERGY HAPPEN NYSE: WMB NYSE: WPZ williams.com Williams and Williams Partners 2 nd Quarter Earnings Call August 2, 2018 ATLANTIC SUNRISE CONSTRUCTION Transco Pipeline, Pennsylvania ATLANTIC SUNRISE
Comfort Systems USA (NYSE: FIX) November 13, 2012
 November 13, 2012") Comfort Systems USA (NYSE: FIX) November 13, 2012 Disclosures Safe Harbor Certain statements and information in this presentation may constitute forward-looking statements within the meaning of the Private
Comfort Systems USA (NYSE: FIX) November 13, 2012 Disclosures Safe Harbor Certain statements and information in this presentation may constitute forward-looking statements within the meaning of the Private
Salesforce.com delivered the following results for its fourth quarter and full fiscal year 2010:
 David Havlek salesforce.com Investor Relations 415-536-2171 dhavlek@salesforce.com Jane Hynes salesforce.com Public Relations 415-901-5079 jhynes@salesforce.com Salesforce.com Announces Fiscal Fourth Quarter
SJW GROUP ANNOUNCES 2017 SECOND QUARTER FINANCIAL RESULTS
 SJW GROUP ANNOUNCES 2017 SECOND QUARTER FINANCIAL RESULTS SAN JOSE, CA, July 26, 2017 SJW Group (NYSE: SJW) today reported financial results for the second quarter ended June 30, 2017. SJW Group net income
CLARCOR REPORTS FOURTH QUARTER FINANCIAL RESULTS
 FURTHER INFORMATION CONTACT: David J. Fallon Chief Financial Officer Franklin, Tennessee 615-771-3100 FOR IMMEDIATE RELEASE WEDNESDAY, JANUARY 13, 2016 CLARCOR REPORTS FOURTH QUARTER FINANCIAL RESULTS
2017 Fourth Quarter and Full Year Results. Maracay Homes Pardee Homes Quadrant Homes Trendmaker Homes TRI Pointe Homes Winchester Homes
 217 Fourth Quarter and Full Year Results Maracay Homes Pardee Homes Quadrant Homes Trendmaker Homes TRI Pointe Homes Winchester Homes Forward Looking Statement Various statements contained in this presentation,
2016 Second Quarter Results. Maracay Homes Pardee Homes Quadrant Homes Trendmaker Homes TRI Pointe Homes Winchester Homes
 2016 Second Quarter Results Maracay Homes Pardee Homes Quadrant Homes Trendmaker Homes TRI Pointe Homes Winchester Homes Forward Looking Statement Various statements contained in this presentation, including
Investor Presentation February Alaskan Way Viaduct (SR 99) Replacement Project, Seattle
 Replacement Project, Seattle") Investor Presentation February 2018 Alaskan Way Viaduct (SR 99) Replacement Project, Seattle Forward-Looking Statements Statements contained in this presentation that are not purely historical are forward-looking
Investor Presentation February 2018 Alaskan Way Viaduct (SR 99) Replacement Project, Seattle Forward-Looking Statements Statements contained in this presentation that are not purely historical are forward-looking
MASCO CORP /DE/ FORM 8-K. (Current report filing) Filed 02/09/15 for the Period Ending 02/09/15
 Filed 02/09/15 for the Period Ending 02/09/15") MASCO CORP /DE/ FORM 8-K (Current report filing) Filed 02/09/15 for the Period Ending 02/09/15 Address 21001 VAN BORN RD TAYLOR, MI 48180 Telephone 3132747400 CIK 0000062996 Symbol MAS SIC Code 2430 -
MASCO CORP /DE/ FORM 8-K (Current report filing) Filed 02/09/15 for the Period Ending 02/09/15 Address 21001 VAN BORN RD TAYLOR, MI 48180 Telephone 3132747400 CIK 0000062996 Symbol MAS SIC Code 2430 -
Itron, Inc. Comparison of Key 2015 Financial Metrics to Preliminary Results Announced February 17, Total operating expenses 486, ,839
 Itron, Inc. Comparison of Key 2015 Financial Metrics to Preliminary Results Announced February 17, 2016 (Unaudited, in thousands, except per share data) (announced Feb. 17, 2016) Preliminary FY 2015 Final
EXELON ANNOUNCES FIRST QUARTER 2014 RESULTS
 Contact: Ravi Ganti Investor Relations 312-394-2348 FOR IMMEDIATE RELEASE Paul Adams Corporate Communications 410-470-4167 EXELON ANNOUNCES FIRST QUARTER 2014 RESULTS CHICAGO (Apr. 30, 2014) Exelon Corporation
Non-GAAP Financial Measures
 Non-GAAP Financial Measures We provide non-gaap gross margin, non-gaap operating income (loss), non-gaap net income (loss), non- GAAP earnings per share, and other non-gaap measures like Adjusted EBITDA
Brooks Automation, Inc. Financial Results Conference Call
 Brooks Automation, Inc. 1st Quarter Fiscal2014 Financial Results Conference Call February 6, 2014 Safe Harbor Statement Safe Harbor Statement under the U.S. Private Securities Litigation Reform Act of
Digital River, Inc. Fourth Quarter Results (In thousands, except share data) Subject to reclassification
 Subject to reclassification") (In thousands, except share data) Consolidated Balance Sheets (Unaudited) 2012 2011 Assets Current assets Cash and cash equivalents $ 542,851 $ 497,193 Short-term investments 162,794 223,349 Accounts receivable,
(In thousands, except share data) Consolidated Balance Sheets (Unaudited) 2012 2011 Assets Current assets Cash and cash equivalents $ 542,851 $ 497,193 Short-term investments 162,794 223,349 Accounts receivable,
Granite Point Mortgage Trust Inc. Reports Fourth Quarter 2017 Financial Results and Post-Quarter End Business Update
 Granite Point Mortgage Trust Inc. Reports Fourth Quarter 2017 Financial Results and Post-Quarter End Business Update NEW YORK, February 7, 2018 Granite Point Mortgage Trust Inc. (NYSE: GPMT), a commercial
The Chemours Company. Quarterly Financial Information. May 4, 2018
 The Chemours Company Quarterly Financial Information May 4, 2018 1 Safe Harbor Statement This presentation contains forward-looking statements, within the meaning of the safe harbor provisions of the U.S.
Salesforce.com Announces Fiscal 2013 Fourth Quarter and Full Year Results
 David Havlek salesforce.com Investor Relations 415-536-2171 dhavlek@salesforce.com Jane Hynes salesforce.com Public Relations 415-901-5079 jhynes@salesforce.com Salesforce.com Announces Fiscal 2013 Fourth
Digital River, Inc. First Quarter Results (In thousands, except share data) Subject to reclassification
 Subject to reclassification") (In thousands, except share data) Consolidated Balance Sheets (Unaudited) December 31, Assets Current assets Cash and cash equivalents $ 500,742 $ 542,851 Short-term investments 144,615 162,794 Accounts
(In thousands, except share data) Consolidated Balance Sheets (Unaudited) December 31, Assets Current assets Cash and cash equivalents $ 500,742 $ 542,851 Short-term investments 144,615 162,794 Accounts
Cash Interest. Adjusted EBITDA Reconciliations
 Non-GAAP Financial Measures Cash Interest Cash Interest is a supplemental non-gaap financial measure that is used by management and external users of the Company s financial statements, such as industry
2
 News Release 1 2 3 4 5 6 Ashland Global Holdings Inc. and Consolidated Subsidiaries Table 1 STATEMENTS OF CONSOLIDATED INCOME (LOSS) (In millions except per share data - preliminary and unaudited) Three
EXELON ANNOUNCES FIRST QUARTER 2015 RESULTS
 Contact: Francis Idehen Investor Relations 312-394-3967 Paul Adams Corporate Communications 410-470-4167 EXELON ANNOUNCES FIRST QUARTER 2015 RESULTS CHICAGO (Apr. 29, 2015) Exelon Corporation (NYSE: EXC)
3Q Presentation. November 7, 2017
 3Q Presentation November 7, 2017 SAFE HARBOR Statements contained in this presentation that are not historical and reflect our views about future periods and events, including our future performance, constitute
Valmont Industries, Inc. Investor Presentation INVESTOR PRESENTATION
 INVESTOR PRESENTATION Forward-looking Statement Disclosure These slides contain (and the accompanying oral discussion will contain) forwardlooking statements within the meaning of the Private Securities
2017 Third Quarter Results. Maracay Homes Pardee Homes Quadrant Homes Trendmaker Homes TRI Pointe Homes Winchester Homes
 2017 Third Quarter Results Maracay Homes Pardee Homes Quadrant Homes Trendmaker Homes TRI Pointe Homes Winchester Homes Forward Looking Statement Various statements contained in this presentation, including
DANA HOLDING CORPORATION Quarterly Financial Information and Reconciliations of Non-GAAP Financial Measures
 Quarterly Financial Information and Reconciliations of Non-GAAP Financial Measures Non-GAAP Financial Measures Adjusted EBITDA is a non-gaap financial measure which we have defined as earnings from continuing
Jefferies 6th Global Clean Technology Conference
 Jefferies 6th Global Clean Technology Conference London, 22 October, 2008 BURDETTE GEOTHERMAL POWER PLANT NEVADA, USA GREEN ENERGY you can F56 OTec Q2/08- Sp 080608 0 Disclaimer Statements in this presentation
Reconciliation of Non-GAAP Financial Measures. Adjusted Operating Income Reconciliation
 Reconciliation of Non-GAAP Financial Measures Adjusted Operating Income Reconciliation Adjusted operating income is not a measure of financial performance under generally accepted accounting principles
CB&I Investor Presentation KeyBanc Capital Markets Industrial, Automotive & Transportation Conference June 2016
 CB&I Investor Presentation KeyBanc Capital Markets Industrial, Automotive & Transportation Conference June 2016 A Leading Provider of Technology and Infrastructure for the Energy Industry A World of Solutions
MIC. Third Quarter 2017 Earnings Conference Call Support Slides. November 2017
 MIC Third Quarter 2017 Earnings Conference Call Support Slides November 2017 Disclaimer This presentation by Macquarie Infrastructure Corporation (MIC) is proprietary and all rights are reserved. Any reproduction,
Second Quarter Financial Results 2018
 Second Quarter Financial Results 2018 July 26, 2018 Safe Harbor / Forward Looking Statements Certain statements made in this presentation are forward-looking statements within the meaning of the federal
Stifel 2017 Industrials Conference
 Stifel 2017 Industrials Conference NYSE: CVA JUNE 2017 Cautionary Statements All information included in this earnings presentation is based on continuing operations, unless otherwise noted. Forward-Looking
Mar. 31, Jun. 30, 2017
 Consolidated GAAP Statements of Operations ($ in thousands, except EPS) March 31, ended Net Revenues $921,580 $1,059,429 $1,134,224 $191,972 $209,032 $195,443 $593,755 $1,190,202 $199,725 Consumer 870,959
2017 First Quarter Results. Maracay Homes Pardee Homes Quadrant Homes Trendmaker Homes TRI Pointe Homes Winchester Homes
 217 First Quarter Results Maracay Homes Pardee Homes Quadrant Homes Trendmaker Homes TRI Pointe Homes Winchester Homes Forward Looking Statement Various statements contained in this presentation, including
UNITED STATES SECURITIES AND EXCHANGE COMMISSION WASHINGTON, DC FORM 8-K. Masco Corporation (Exact name of Registrant as Specified in Charter)
") UNITED STATES SECURITIES AND EXCHANGE COMMISSION WASHINGTON, DC 20549 FORM 8-K CURRENT REPORT Pursuant to Section 13 or 15(d) of the Securities Exchange Act of 1934 Date of report (Date of earliest event
UNITED STATES SECURITIES AND EXCHANGE COMMISSION WASHINGTON, DC 20549 FORM 8-K CURRENT REPORT Pursuant to Section 13 or 15(d) of the Securities Exchange Act of 1934 Date of report (Date of earliest event
2015 Fourth Quarter and Full Year Results. Maracay Homes Pardee Homes Quadrant Homes Trendmaker Homes TRI Pointe Homes Winchester Homes
 215 Fourth Quarter and Full Year Results Maracay Homes Pardee Homes Quadrant Homes Trendmaker Homes TRI Pointe Homes Winchester Homes Forward Looking Statement Various statements contained in this presentation,
Investor Presentation. May 2010
 Investor Presentation May 2010 Cautionary Note Regarding Forward- Looking Statements This presentation contains forward-looking statements within the meaning of the safe harbor provisions of Section 27A
MIC First Quarter 2017 Earnings Conference Call Support Slides. May 2017
 MIC First Quarter 2017 Earnings Conference Call Support Slides May 2017 Disclaimer This presentation by Macquarie Infrastructure Corporation (MIC) is proprietary and all rights are reserved. Any reproduction,
The LGL Group, Inc. Reports Q Financial Results
 The LGL Group, Inc. Reports Q1 2017 Financial Results ORLANDO, FL, May 11, 2017 The LGL Group, Inc. (NYSE MKT: LGL) (the Company or LGL ), announced results for the quarter ended 2017. Summary of Q1 2017
2
 1 2 3 4 5 6 Ashland Global Holdings Inc. and Consolidated Subsidiaries Table 1 STATEMENTS OF CONSOLIDATED INCOME (LOSS) (In millions except per share data - preliminary and unaudited) Three months ended
Telephone Facsimile Internet:
 125 West 55 th Street New York, NY10019 United States FOR IMMEDIATE RELEASE Telephone Facsimile Internet: +1 212 231 1825 +1 212 231 1828 www.macquarie.com/mic REPORTS 2017 FINANCIAL RESULTS, INCREASE
A leading provider of post acute services
 A leading provider of post acute services November 2018 2018 by Genesis Healthcare, Inc. All Rights Reserved. Safe Harbor Statement Certain statements in this presentation regarding the expected benefits
2018 Evercore ISI Utility CEO Conference January 11, 2018
 2018 Evercore ISI Utility CEO Conference January 11, 2018 Safe Harbor Forward Looking Statements This presentation contains forward-looking statements about the business, financial performance, contracts,
CFO Commentary on Third-Quarter 2014 Results
 CFO Commentary on Third-Quarter 2014 Results Summary The third quarter 2014 results compared to last year s third quarter were as follows: Revenue of $361.6 million up 14.0% from $317.2 million Gross margin
The AES Corporation Acquisition of DPL Inc. April 20, 2011
 The AES Corporation Acquisition of DPL Inc. April 20, 2011 Safe Harbor Disclosure Additional Information and Where to Find it This document does not constitute an offer to sell or the solicitation of an
TD AMERITRADE HOLDING CORPORATION CONSOLIDATED STATEMENTS OF INCOME In thousands, except per share amounts (Unaudited)
") CONSOLIDATED STATEMENTS OF INCOME In thousands, except per share amounts Revenues: Transaction-based revenues: Commissions and transaction fees $ 301,272 $ 309,388 $ 265,442 $ 610,660 $ 552,555 Asset-based
CONSOLIDATED STATEMENTS OF INCOME In thousands, except per share amounts Revenues: Transaction-based revenues: Commissions and transaction fees $ 301,272 $ 309,388 $ 265,442 $ 610,660 $ 552,555 Asset-based
EXELON REPORTS THIRD QUARTER 2017 RESULTS
 Exhibit 99.1 News Release Contact: Dan Eggers Investor Relations 312-394-2345 Paul Adams Corporate Communications 410-470-4167 EXELON REPORTS THIRD QUARTER 2017 RESULTS Earnings Release Highlights GAAP
News. CB&I Reports Strong 2013 Third Quarter Results
 News CB&I Reports Strong 2013 Third Quarter Results THE WOODLANDS, Texas, Oct. 29, 2013 /PRNewswire/ -- CB&I (NYSE: CBI) today reported net income for the third quarter $117.7 million, or $1.08 per diluted
Clean Energy Reports 75.2 Million Gallons Delivered and Revenue of $85.8 Million for First Quarter of 2015
 May 11, 2015 Clean Energy Reports 75.2 Million Gallons Delivered and Revenue of $85.8 Million for First Quarter of 2015 NEWPORT BEACH, Calif.--(BUSINESS WIRE)-- Clean Energy Fuels Corp. (NASDAQ: CLNE)
CB&I Reports 2015 Third Quarter Results
 NEWS RELEASE For Immediate Release: November 5, 2015 For Further Information Contact: Media: www.cbi.com Investors: Christi Thoms-Knox +1 832 513 1200 CB&I Reports 2015 Third Quarter Results THE WOODLANDS,
Consolidated Communications Reports Third Quarter 2017 Results
 November 2, 2017 Consolidated Communications Reports Third Quarter 2017 Results Declared the 50 th consecutive quarterly dividend Closed on acquisition of FairPoint July 3, focused on integration activities