November 7, 2017 NYSE:HL. Third Quarter Earnings Conference Call
|
|
|
- Dwayne Mills
- 5 years ago
- Views:
Transcription

1 November 7, 2017 Third Quarter 2017 Earnings Conference Call
2 Cautionary Statements Cautionary Statement Regarding Forward Looking Statements, This presentation contains forward-looking statements within the meaning of Section 27A of the Securities Act of 1933, as amended, and Section 21E of the Securities Exchange Act of 1934, as amended, which are intended to be covered by the safe harbor created by such sections and other applicable laws, including Canadian Securities laws. Such forward-looking statements may include, without limitation: (i) estimates of future production and sales; (ii) estimates of future costs and cash cost, after by-product credits per ounce of silver/gold; (iii) guidance for 2017, including the impact of the Lucky Friday strike, on silver and gold production, silver equivalent production, cash cost and AISC, after by-product credits, capital expenditures and pre-development and exploration expenditures (which assumes metal prices of gold at $1,225/oz., silver at $17.25/oz., zinc at $1.30/lb. and lead at $1.05/lb. and USD/CAD assumed to be $0.78, USD/MXN assumed to be $0.06); (iv) expectations regarding the development, growth and exploration potential of the Company s projects; (v) expectations of adding reserves and resources; (vi) the possibility of increasing production due to accessing higher grade material and surface pits at Casa Berardi; (vii) possible strike extensions of veins at San Sebastian, potential for new discoveries, ability to begin underground mining by early 2018 and ability to extend mine life through 2020; and (viii) expectations of grade increases at depth at Lucky Friday. Estimates or expectations of future events or results are based upon certain assumptions, which may prove to be incorrect. Such assumptions, include, but are not limited to: (i) there being no significant change to current geotechnical, metallurgical, hydrological and other physical conditions; (ii) permitting, development, operations and expansion of the Company s projects being consistent with current expectations and mine plans; (iii) political/regulatory developments in any jurisdiction in which the Company operates being consistent with its current expectations; (iv) the exchange rate for the Canadian dollar to the U.S. dollar and Mexican Peso to the U.S. Dollar, being approximately consistent with current levels; (v) certain price assumptions for gold, silver, lead and zinc; (vi) prices for key supplies being approximately consistent with current levels; (vii) the accuracy of our current mineral reserve and mineral resource estimates; and (viii) the Company s plans for development and production will proceed as expected and will not require revision as a result of risks or uncertainties, whether known, unknown or unanticipated. Where the Company expresses or implies an expectation or belief as to future events or results, such expectation or belief is expressed in good faith and believed to have a reasonable basis. However, such statements are subject to risks, uncertainties and other factors, which could cause actual results to differ materially from future results expressed, projected or implied by the forward-looking statements. Such risks include, but are not limited to gold, silver and other metals price volatility, operating risks, currency fluctuations, increased production costs and variances in ore grade or recovery rates from those assumed in mining plans, community relations, conflict resolution and outcome of projects or oppositions, litigation, political, regulatory, labor and environmental risks, and exploration risks and results, including that mineral resources are not mineral reserves, they do not have demonstrated economic viability and there is no certainty that they can be upgraded to mineral reserves through continued exploration. For a more detailed discussion of such risks and other factors, see the Company s 2016 Form 10-K, filed on February 23, 2017 with the Securities and Exchange Commission (SEC), as well as the Company s other SEC filings. The Company does not undertake any obligation to release publicly revisions to any forward-looking statement, including, without limitation, outlook, to reflect events or circumstances after the date of this presentation, or to reflect the occurrence of unanticipated events, except as may be required under applicable securities laws. Investors should not assume that any lack of update to a previously issued forward-looking statement constitutes a reaffirmation of that statement. Continued reliance on forward-looking statements is at investors own risk. Cautionary Note Regarding Estimates of Measured, Indicated and Inferred Resources The SEC permits mining companies, in their filings with the SEC, to disclose only those mineral deposits that a company can economically and legally extract or produce. We use certain terms in this presentation, such as resource, measured resources, indicated resources, and inferred resources that are recognized by Canadian regulations, but that SEC guidelines generally prohibit U.S. registered companies from including in their filings with the SEC, except in certain circumstances. U.S. investors are urged to consider closely the disclosure in our most recent Form 10-K and Form 10-Q. You can review and obtain copies of these filings from the SEC s website at Qualified Person (QP) Pursuant to Canadian National Instrument Dean McDonald, PhD. P.Geo., Senior Vice President - Exploration of Hecla Mining Company, who serves as a Qualified Person under National Instrument ("NI "), supervised the preparation of the scientific and technical information concerning Hecla s mineral projects in this presentation. Information regarding data verification, surveys and investigations, quality assurance program and quality control measures and a summary of analytical or testing procedures for the Greens Creek Mine are contained in a technical report titled Technical Report for the Greens Creek Mine effective date March 28, 2013, and for the Lucky Friday Mine are contained in a technical report titled Technical Report for the Lucky Friday Mine Shoshone County, Idaho, USA effective date April 2, 2014, for Casa Berardi are contained in a technical report titled "Technical Report on the mineral resource and mineral reserve estimate for Casa Berardi Mine, Northwestern Quebec, Canada" effective date March 31, 2014 (the "Casa Berardi Technical Report"), and for the San Sebastian Mine, Mexico, are contained in a technical report prepared for Hecla titled Technical Report for the San Sebastian Ag-Au Property, Durango, Mexico effective date September 8, Also included in these four technical reports is a description of the key assumptions, parameters and methods used to estimate mineral reserves and resources and a general discussion of the extent to which the estimates may be affected by any known environmental, permitting, legal, title, taxation, socio-political, marketing or other relevant factors. Copies of these technical reports are available under Hecla's and Aurizon's profiles on SEDAR at The Casa Berardi Technical Report was reviewed by Dr. McDonald on behalf of Hecla. To the best of Hecla's knowledge, information and belief, there is no new material scientific or technical information that would make the disclosure of the mineral resources and mineral reserves for Casa Berardi in this document inaccurate or misleading. Cautionary Note Regarding Non-GAAP measures Cash cost per ounce of silver and gold, net of by-product credits, EBITDA, adjusted EBITDA, all in sustaining capital ( AISC ), after by-product credits, and free cash flow represent non-u.s. Generally Accepted Accounting Principles (GAAP) measurements. A reconciliation of these non-gaap measures to the most comparable GAAP measurements can be found in the Appendix. 2
3 Strong Financial Performance Driven by mine throughput and base metal prices Strong mine performance Good silver and gold production Record gold revenue Adding cash to the balance sheet Cash Cost per Silver Ounce 1 (After By-Product Credits) $3.68/oz AISC per Silver Ounce 2 (After By-Product Credits) $12.58/oz $6.65/oz 47% Lowering annual cash cost and AISC per ounce estimates $(0.63)/oz 117% Q Q Q Q Outperformed Peer Share Prices* +152% +53% Progress in Productivity and Exploration Control center at Casa Berardi Automation at Greens Creek Continuous mining at Lucky Friday Sulfide discoveries at San Sebastian Continued exploration expansion at Casa Berardi *Peers include: Pan American Silver, Tahoe, Coeur Mining, First Majestic, SSR Mining Source: Bloomberg, January 4, 2016 October 27,
4 Revised 2017 Estimates Lowering cash cost and AISC, after by-product credits, per silver ounce Production Outlook Silver Production (Moz) Gold Production (Koz) Silver Equivalent (Moz) 3 Gold Equivalent (koz) 3 Greens Creek Lucky Friday San Sebastian Casa Berardi Total Cost Outlook Cash cost, after by-product AISC, after by-product credits, Costs of Sales (million) credits, per silver/gold ounce 1 per produced silver/gold ounce 2 Greens Creek $201 (silver) $1.00 (silver) $7.00 (silver) Lucky Friday $15 (silver) $7.50 (silver) $13.00 (silver) San Sebastian $24 (silver) $(2.00) (silver) $1.00 (silver) Total Silver $240 $1.00 $9.00 Casa Berardi $181 (gold) $ (gold) $1,150 (gold) Total Gold $181 (gold) $ (gold) $1,150 (gold) Capital and Exploration Outlook 2017E capital expenditures E exploration expenditures 4 (includes corporate development) 2017E pre-development expenditures 4 $105-$110 million $20-25 million $5 Million 4
5 Lucky Friday Strike Update The current bid system needs to be changed with the demands of mining at greater depths. The changes we proposed will help ensure the long-term future of the mine. In order to increase the financial return the mine currently generates, we need to increase productivity and efficiency. We continue to invest in the future of Lucky Friday, with technologies such as the Remote Vein Miner that should benefit the economics of the mine and improve safety. Improving the mine s productivity and safety will benefit it over the short and long term. -5-
6 Financial Review 6
7 Financial Performance Reduction in cash cost, after by-product credits per gold and silver ounce Q Q Revenue $140.8 M $179.4 M Cost of sales and other direct production costs and depreciation, depletion and amortization* - Silver $48.6 M $84.4 M Cost of sales and other direct production costs and depreciation, depletion and amortization* Gold $48.6 M $36.3 M Cash provided by operating activities before working capital changes $46 M $49.6 M Cash and cash equivalents and short-term investments $205.9 M $192.4 M Cash cost, after by-product credits, per silver oz 1 $(0.63)/oz $3.68/oz Cash cost, after by-product credits, per gold oz 1 $750/oz $915/oz All in sustaining cost (AISC), after by-product credits, per silver oz 2 $6.65/oz $12.58/oz All in sustaining cost (AISC), after by-product credits, per gold oz 2 $1,091 $1,442 *Referred to herein as Cost of Sales 7
8 Strong Silver and Gold Margins 104% silver cash margin is one of the industry s highest Silver Margins Gold Margins $19.53 $17.16 $17.90 $17.14 $17.01 $1,341 $1,202 $1,221 $1,260 $1,283 $15.85 $426 $335 32% $402 33% 27% $288 23% 42% $533 $ % 82% $ % $ % $ % $915 $800 $886 $972 $750 $3.68 $3.10 $0.84 $0.26 $(0.63) Q Q Q Q Q Cash Margin Cash Cost, after by-product credits, per silver ounce Realized Silver Price 1 Q Q Q Q Q Cash Margin 1 Cash Cost, after by-product credits, per gold ounce Realized Gold Price -8-


9 Diversified Revenue Stream Q3/2017 Mitigates risk and enhances economics #1 Silver and #3 Lead and Zinc Producer in the U.S. #4 Gold Producer in Quebec, Canada Zinc Production: 14.5 ktons Realized Price: $1.44/lb Silver Production: 3.3 Moz Cash Costs, after by-product credits: $(0.63)/oz 1 Realized Price: $17.01/oz Greens Creek 43% of Total Revenue Lead Production: 5.4 ktons Realized Price: $1.09/lb Casa Berardi 38% of Total Revenue 100% Gold Production: 63 koz Cash Costs, after by-product credits: $750/oz 1 Realized Price: $1,283/oz Lucky Friday 0% of Total Revenue Union workers currently on strike. Q3/2017 Margins Silver Margin: $17.64/oz* Gold Margin: $533/oz** San Sebastian 18% of Total Revenue See Slide 33 in the Appendix for Cash Cost Reconciliation to GAAP per silver ounce. **See Slide 40 in the Appendix for Cash Cost Reconciliation to GAAP per gold ounce. 9
10 Operations Review 10
 54 12 12.6 51 53 Cost of Sales $191.3 M $58.4 M $41.9 M $201 M Cash cost, after by-product credits, per silver oz 1 $3.84/oz $4.80/oz $(0.")

11 Greens Creek Consistent low-cost production in a wilderness area / National Monument 2016 Q Q E Silver Production (Moz) Gold Production (koz) Cost of Sales $191.3 M $58.4 M $41.9 M $201 M Cash cost, after by-product credits, per silver oz 1 $3.84/oz $4.80/oz $(0.15)/oz $1.00/oz AISC, after by-product credits 2 $9.42/oz $11.02/oz $4.47/oz $7.00/oz 2017E Sustaining Capital FCF FCF 2017 YTD 6 FCF To Date 6 $38 M $85 million (operating activities of $132.0 million less capital expenditures of $47.0 million) $64.5 million ~$1 billion (operating activities of $1.9 billion less capital expenditures of $788 million) 11


12 Teleremote LHD at Greens Creek Jumbo Drill at Casa Berardi Increase Productivity 12


13 Casa Berardi: Record Gold Production Improving performance with higher grades and throughput 2016 Q Q E Gold Production (koz) Cost of Sales $155.7 M $36.3 M $48.6 M $181 M Cash cost, after byproduct credits, per gold $764/oz $915/oz $750/oz $800/oz oz 1 AISC, after by-product credits 2 $1,244/oz $1,442/oz $1,091/oz $1,150/oz 2017E Sustaining Capital 2P Reserves M+I Resources $48 M 1.3 Moz 0.13 oz/t gold 1.5 Moz 0.11 oz/t gold Q Underground Open Pit Tons Milled 206, ,936 Gold Grade (oz/t) Gold Production 35,192 oz 8,949 oz 13
14 Casa Berardi Increased throughput more than 100% since acquisition Trendline -14-


15 985 Drift Haulage Under Construction First automated truck now on site: Should result in cost savings Optical scanner & camera Surface control room 40 tonne Sandvik truck -15-
 4.3.976.881 3.0 3.4 Gold Production (koz) 34 8.2 6.3 24 25 Cost of Sales $31.2 M $6.5 M $6.")
/oz AISC, after by-product credits 2 $(1.99)/oz $(2.39)/oz $(0.83)/oz $1.")
16 San Sebastian Just-in-time mining features very low cash costs, after by-product credits 2016 Q Q E Silver Production (Moz) Gold Production (koz) Cost of Sales $31.2 M $6.5 M $6.7 M $24 M Cash cost, after by-product credits, per silver oz 1 $(3.35)/oz $(4.03)/oz $(3.12)/oz $(2.00)/oz AISC, after by-product credits 2 $(1.99)/oz $(2.39)/oz $(0.83)/oz $1.00/oz 2017E Sustaining Capital 2P Reserves M+I Resources $3 M 5.6 Moz 17.2 oz/t Ag 8.3 Moz 5.4 oz/t Ag 16


17 Current Underground Design Layout San Sebastian North Ramp -17-


18 Lucky Friday Positioning for growth and longevity 2016 Q Q E Silver Production (Moz) Cost of Sales $76.2 M $19.5 M - - $15 M Cash cost, after by-product credits, per silver oz 1 $8.89/oz $9.07/oz $11.60/oz $7.50/oz AISC, after by-product credits 2 $20.66/oz $20.22/oz $13.37/oz $13.00/oz 2017E Sustaining Capital 2P Reserves M+I Resources $5 M 77.8 Moz 16.1 oz/t Ag 133 Moz 6.2 oz/t Ag Union workers currently on strike. 18
19 Exploration 19

 East Francine & East Middle Vein Exploration/Infill Drilling")
20 San Sebastian: Strong Exploration Potential Several discoveries near mine infrastructure N Middle Vein Exploration Drilling Trace of Programmed New UG Ramp LEGEND 2017 Drilling Area Vein or Vein Projection Programmed Pit Outlines Mine Infrastructure West Francine Vein West Hugh Zone Extension Professor Vein Middle Vein Definition Drilling (Reserve) East Francine & East Middle Vein Exploration/Infill Drilling 20

 Newly defined Polymetallic")


21 Hugh Zone Expanding to the West New zones of polymetallic mineralization adjacent to original Hugh Zone FRANCINE VEIN LONGITUDINAL SECTION (Looking NE) Newly defined Polymetallic Mineralization Limit of Current Hugh Zone Resource $NSR VALUE PER TON (6.6 FT DILUTED) Existing Mine Workings Hugh Zone 0.01 oz/ton gold and 28.5 oz/ton silver 6% Cu, 9% Pb, 14% Zn over 3.6 feet 0.01 oz/ton gold and 7.2 oz/ton silver 2% Cu, 3% Pb, 3% Zn over 7.5 feet 0.01 oz/ton gold and 19.7 oz/ton silver 3% Cu, 12% Pb, 13% Zn over 3.5 feet PROGRAMMED DRILL HOLE DRILL HOLE ASSAYS PENDING DRILL HOLE INTERCEPT $140 NSR + CUTOFF FOR UG MINING FAULT 21

 $NSR VALUE PER TON (6.")


22 New Polymetallic Mineralization Discovered 2,500 feet west of current Hugh Zone Resources FRANCINE VEIN LONGITUDINAL SECTION (Looking NE) $NSR VALUE PER TON (6.6 FT DILUTED) Newly defined Polymetallic Mineralization Limit of Current Hugh Zone Resource Existing Mine Workings Hugh Zone 0.01 oz/ton gold and 6.2 oz/ton silver 2% Cu, 3% Pb, 4% Zn over 6.2 feet 0.01 oz/ton gold and 28.5 oz/ton silver 6% Cu, 9% Pb, 14% Zn over 3.6 feet 0.01 oz/ton gold and 7.2 oz/ton silver 2% Cu, 3% Pb, 3% Zn over 7.5 feet 0.01 oz/ton gold and 19.7 oz/ton silver 3% Cu, 12% Pb, 13% Zn over 3.5 feet PROGRAMMED DRILL HOLE DRILL HOLE ASSAYS PENDING DRILL HOLE INTERCEPT $140 NSR + CUTOFF FOR UG MINING FAULT 22

 0.02 oz/ton gold and 9.")

 0.")

23 New Middle Vein Polymetallic Zone High-grade polymetallic intercepts near the Middle Vein ramp MIDDLE VEIN POLYMETALLIC ZONE LONGITUDINAL SECTION (Looking NE) 0.02 oz/ton gold and 9.5 oz/ton silver 3% Cu, 2% Pb, 5% Zn over 4.0 feet 0.07 oz/ton gold and 12.0 oz/ton silver 4% Cu, 6% Pb, 9% Zn over 5.4 feet $NSR VALUE PER TON (4.9 FT DILUTED) 0.21 oz/ton gold and 20.5 oz/ton silver 0.5% Cu, 1% Pb, 1% Zn over 1.7 feet PROGRAMMED DRILL HOLE DRILL HOLE INTERCEPT $140 NSR + CUTOFF FOR UG MINING 23

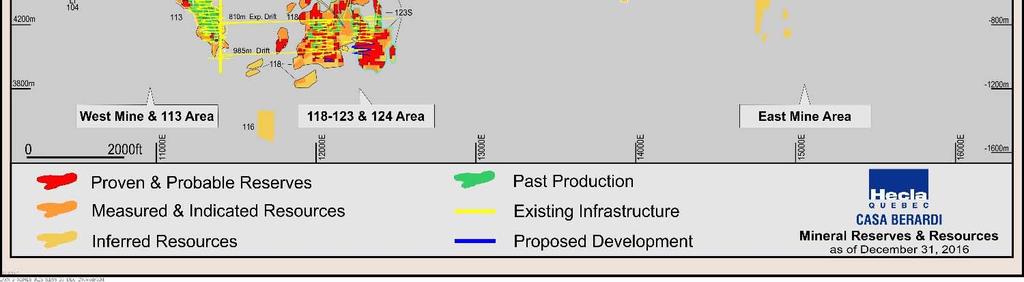


24 Casa Berardi: Great Exploration Potential Resources and mineralized trends defined from surface and UG drilling NW/SW 124 U 124 S 134 S 146/148 S 160 S 124 U Lower Inter 123 U 123 U Mineralization trends Surface Drilling Underground Drilling -24-


25 Casa Berardi: Additional Open Pit Potential Surface view showing potential series of open pits Surface Drilling -25-


26 Greens Creek: Adding Shallow Mineralization to Enhance Economics Trends of Mineralization -26-
27 Conclusion 27

28 Appendix 28
29 Endnotes 1. Cash cost, after by-product credits, per silver and gold ounce represents a non-gaap measurement, a reconciliation of which to cost of sales and other direct production costs and depreciation, depletion and amortization (sometimes referred to as "cost of sales" in this release), can be found at the end of the release. It is an important operating statistic that management utilizes to measure each mine's operating performance. It also allows the benchmarking of performance of each mines versus those of our competitors. As a primary silver mining company, management also uses the statistic on an aggregate basis - aggregating the Greens Creek, Lucky Friday and San Sebastian mines - to compare performance with that of other primary silver mining companies. With regard to Casa Berardi, management uses cash cost, after by- product credits, per gold ounce to compare its performance with other gold mines. Similarly, the statistic is useful in identifying acquisition and investment opportunities as it provides a common tool for measuring the financial performance of other mines with varying geologic, metallurgical and operating characteristics. In addition, the Company may use it when formulating performance goals and targets under its incentive program. 2. All in sustaining cost (AISC), after by-product credits, is a non-gaap measurement, a reconciliation of which to cost of sales and other direct production costs and depreciation, depletion and amortization, the closest GAAP measurement, can be found in the appendix. AISC, after by-product credits, includes cost of sales and other direct production costs, expenses for reclamation and exploration, and sustaining capital costs at the mines sites. AISC, after by-product credits for our consolidated silver properties also includes corporate costs for all general and administrative expenses, exploration and sustaining capital which support the operating properties. AISC, after by-product credits, is calculated net of depreciation, depletion, and amortization and by-product credits. 2017E refers to Hecla s estimates for Current GAAP measures used in the mining industry, such as cost of goods sold, do not capture all the expenditures incurred to discover, develop and sustain silver and gold production. Management believes that all in sustaining costs is a non-gaap measure that provides additional information to management, investors and analysts to help in the understanding of the economics of our operations and performance compared to other producers and in the investor's visibility by better defining the total costs associated with production. Similarly, the statistic is useful in identifying acquisition and investment opportunities as it provides a common tool for measuring the financial performance of other mines with varying geologic, metallurgical and operating characteristics. In addition, the Company may use it when formulating performance goals and targets under its incentive program. 3. Silver and gold equivalent is calculated using the average market prices for the time period noted E refers to Hecla s estimates for Expectations for 2017 includes silver, gold, lead and zinc production from Lucky Friday, Greens Creek, San Sebastian and Casa Berardi converted using Au $1,225/oz, Ag $17.25/oz, Zn $1.30/lb, Pb $1.05/lb. 6. Free Cash Flow is a non-gaap measure calculated as Operating Cash Flow (GAAP) less Capex (GAAP). Cash flow conversion calculated as Free Cash Flow from mines divided by Operating Cash Flow. 7. This presentation refers to a non-gaap measure of adjusted earnings before interest, taxes, depreciation and amortization ("Adjusted EBITDA"), which is a measure of our operating performance. Adjusted EBITDA is calculated as net income (loss) before the following items: interest expense, income tax provision, depreciation, depletion, and amortization expense, exploration expense, pre-development expense, acquisition costs, interest and other income (expense), foreign exchange gains and losses, gains and losses on derivative contracts, unrealized gains on investments, provisions for environmental matters, stock-based compensation, and provisional price gains and losses. Management believes that, when presented in conjunction with comparable GAAP measures, adjusted EBITDA is useful to investors in evaluating our operating performance. 8. Net debt to adjusted EBITDA is a non-gaap measurement, a reconciliation of net debt to adjusted EBITDA to the closest GAAP measurements of net income (loss) and debt can be found at the end of the presentation. It is an important measure for management to measure relative indebtedness and the ability to service the debt relative to its peers. It is calculated as total debt outstanding less total cash on hand divided by adjusted EBITDA on a last 12-month basis. -29-
30 Improving Debt Metrics Q LTM* Adjusted EBITDA 7 Net Debt/LTM Adjusted EBITDA 8 $236 M $265 M $272 M $242 M $226 M 1.4x 1.2x 1.1x 1.3x 1.4x LTM Q LTM Q LTM Q LTM Q LTM Q LTM Q LTM Q LTM Q LTM Q LTM Q Total liquidity ~$306 M $506 M high yield notes due 2021 Net debt is total debt minus cash, cash equivalents and shortterm investments * LTM = Last twelve months 30
31 Cash Provided By Operating Activities Reconciliation to GAAP Reconciliation of Cash Provided by Operating Activities (GAAP) to Cash Provided by Operating Activities Before Working Capital Changes (Non-GAAP) In thousands Q Q Cash provided by operating activities (GAAP) $ 28,294 $ 86,976 Changes in assets and liabilities, net 17,961 (37,350) Cash provided by operating activities before working capital changes (Non-GAAP) $ 46,255 $ 49,626 31
32 Cash Cost Reconciliation to GAAP Silver Operations Reconciliation of Cost of Sales and Other Direct Production Costs and Depreciation, Depletion and Amortization, the most comparable GAAP measurement, Before By-product Credits and Cash Cost, After By-product Credits (non-gaap) and All-In Sustaining Cost (AISC), Before Byproduct Credits and All-In Sustaining Cost, After By-product Credits (non-gaap) In thousands (except per ounce amounts) Cost of sales and other direct production costs and depreciation, depletion and amortization (GAAP) Three Month Ended September 30, Q Q $ 84,413 $ 48,607 Depreciation, depletion and amortization (19,714) (13,248) Treatment costs 20,673 12,929 Change in product inventory (9,523) 9,008 Reclamation and other costs 1,962 (870) Cash Cost, Before By-product Credits (1) 77,811 56,426 Reclamation and other costs Exploration 1,821 3,914 Sustaining capital 24,469 9,836 General and administrative expense 11,155 9,529 All-In Sustaining Costs, Before By-product Credits (1,2) 116,145 80,526 By-products credits (61,943) (58,503) Cash Cost, After By-product Credits $ 15,868 $ (2,077) All-In Sustaining Costs, After By-product Credits $ 54,202 $ 22,023 Divided by Ounces Produced 4,308 3,312 Cash Cost, Before By-product Credits, per Ounce $ $ By-products credits per Silver Ounce (14.38) (17.66) Cash Cost, After By-product Credits, per Ounce $ 3.68 $ (0.63) All-In Sustaining Costs, Before By-product Credits, per Silver Ounce $ $ By-products credits per Silver Ounce (14.38) (17.66) All-In Sustaining Costs, After By-product Credits, per Silver Ounce $ $ Includes all direct and indirect operating cash costs related directly to the physical activities of producing metals, including mining, processing and other plant costs, third-party refining and marketing expense, on-site general and administrative costs, royalties and mining production taxes, before by-product revenues earned from all metals other than the primary metal produced at each unit. 2. All-in sustaining costs, before by-product credits for our consolidated silver properties includes corporate costs for all general and administrative expenses and exploration and sustaining capital which support the operating properties. 32
33 Cash Cost Reconciliation to GAAP Silver Operations Reconciliation of Cost of Sales and Other Direct Production Costs and Depreciation, Depletion and Amortization, the most comparable GAAP measurement, After By-product Credits, per Silver Ounce for Greens Creek, Lucky Friday and San Sebastian In thousands (except per ounce amounts) Q Q Q Q Q Costs of sales and other direct production costs and depreciation, depletion and amortization $ 48,607 $ 59,392 $ 65,162 $ 71,623 $ 84,413 Depreciation, depletion and amortization (13,248) (14,225) (16,438) (18,301) (19,714) Treatment costs 12,929 11,682 18,173 21,950 20,673 Change in product inventory 9,008 (4,727) 2,736 4,013 (9,523) Reclamation and other costs (870) (699) (1,158) (1,439) 1,962 Cash costs, before by-product credits (1) 56,426 51,423 68,475 77,846 77,811 By-product credits (58,503) (50,698) (65,626) (71,322) (61,943) Cash cost, after by-product credits $ (2,077) $ 725 $ 2,849 $ 6,524 $ 15,868 Divided by silver ounces produced 3,312 2,799 3,361 3,967 4,308 Cash cost, before by-product credits, per silver ounce $ $ $ $ $ By-product credits per silver ounce $ (17.66) $ (18.11) $ (19.53) $ (17.98) $ (14.38) Cash cost, after by-product credits, per silver ounce $ (0.63) $ 0.26 $ 0.84 $ 1.64 $ Includes all direct and indirect operating cash costs related directly to the physical activities of producing metals, including mining, processing and other plant costs, third-party refining and marketing expense, on-site general and administrative costs, royalties and mining production taxes, before by-product revenues earned from all metals other than the primary metal produced at each unit. 33
34 Cash Cost Reconciliation to GAAP Greens Creek Reconciliation of Cost of Sales and Other Direct Production Costs and Depreciation, Depletion and Amortization (GAAP) to All- In Sustaining Costs, Before By-product Credits, per Ounce and All-In Sustaining Costs, After By-product Credits, per Ounce (non-gaap) In thousands (except per ounce amounts) Greens Creek Estimate for 2016 Q Q Cost of sales and other direct production costs and depreciation, depletion and amortization (GAAP) $ 191,297 $ 58,397 $ 41,927 $ 201,000 Depreciation, depletion and amortization (52,564) (16,091) (12,607) (56,000) Treatment costs 62,754 15,114 12,067 48,000 Change in product inventory (1,866) (10,407) 7,675 (1,000) Reclamation and other costs (2,327) 2,273 (394) (2,000) Cash Cost, Before By-product Credits (1) 197,294 49,286 48, ,000 By-products credits (161,782) (37,536) (49,020) (183,000) Cash cost, After By-product Credits $ 35,512 $ 11,750 $ (352) $ 7,000 Divided by Ounces Produced 9,254 2,445 2,344 7,800 Cash Cost, Before By-product Credits, per Silver Ounce $ $ $ $ By-products credits per Silver Ounce (17.48) (15.35) (20.90) (23.46) Cash Cost, After By-product Credits, per Silver Ounce $ 3.84 $ 4.80 $ (0.15) $ Includes all direct and indirect operating cash costs related directly to the physical activities of producing metals, including mining, processing and other plant costs, third-party refining and marketing expense, on-site general and administrative costs, royalties and mining production taxes, before by-product revenues earned from all metals other than the primary metal produced at each unit. 34
35 AISC Reconciliation to GAAP Greens Creek Reconciliation of Cost of Sales and Other Direct Production Costs and Depreciation, Depletion and Amortization (GAAP) to All- In Sustaining Costs, Before By-product Credits, per Ounce and All-In Sustaining Costs, After By-product Credits, per Ounce (non-gaap) In thousands (except per ounce amounts) Greens Creek Estimate for 2016 Q Q Cost of sales and other direct production costs and depreciation, depletion and amortization (GAAP) $ 191,297 $ 58,397 $ 41,927 $ 201,000 Depreciation, depletion and amortization (52,564) (16,091) (12,607) (56,000) Treatment costs 62,754 15,114 12,067 48,000 Change in product inventory (1,866) (10,407) 7,675 (1,000) Other costs 392 2, Exploration 1, ,944 4,000 Sustaining capital 47,046 14,162 8,210 39,000 All-In Sustaining Costs, Before By-product Credits (1,2) 248,951 64,479 59, ,000 By-products credits (161,782) (37,536) (49,020) (183,000) All-In Sustaining Costs, After By-product Credits $ 87,169 $ 26,943 $ 10,468 $ 52,000 Divided by Ounces Produced 9,254 2,445 2,344 7,800 All-In Sustaining Costs, Before By-product Credits, per Silver Ounce $ $ $ $ By-products credits per Silver Ounce (17.48) (15.35) (20.90) (23.46) All-In Sustaining Costs, After By-product Credits, per Silver Ounce $ 9.42 $ $ 4.47 $ Includes all direct and indirect operating cash costs related directly to the physical activities of producing metals, including mining, processing and other plant costs, third-party refining and marketing expense, on-site general and administrative costs, royalties and mining production taxes, before by-product revenues earned from all metals other than the primary metal produced at each unit. In addition, on-site exploration, reclamation, and sustaining capital costs are also included. 2. All-in sustaining costs, before by-product credits for our consolidated silver properties includes corporate costs for all general and administrative expenses and exploration and sustaining capital which support the operating properties. 35
36 Cash Cost Reconciliation to GAAP Lucky Friday Reconciliation of Cost of Sales and Other Direct Production Costs and Depreciation, Depletion and Amortization (GAAP) to All- In Sustaining Costs, Before By-product Credits, per Ounce and All-In Sustaining Costs, After By-product Credits, per Ounce (non-gaap) In thousands (except per ounce amounts) Lucky Friday Estimate 2016 Q Q Cost of sales and other direct production costs and depreciation, depletion and amortization (GAAP) $ 76,210 $ 19,484 $ - $ 15,000 Depreciation, depletion and amortization (11,810) (2,946) - (3,000) Treatment costs 20,277 5, ,000 Change in product inventory (1,162) (46) 1,960 3,000 Reclamation and other costs (822) (171) 18 1,000 Cash Cost, Before By-product Credits (1) 82,693 21,532 2,418 21,000 By-products credits (50,722) (13,485) (1,395) (15,000) Cash cost, After By-product Credits $ 31,971 $ 8,047 $ 1,023 $ 6,000 Divided by Ounces Produced 3, Cash Cost, Before By-product Credits, per Silver Ounce $ $ $ $ By-products credits per Silver Ounce (14.11) (15.19) (15.84) (18.75) Cash Cost, After By-product Credits, per Silver Ounce $ 8.89 $ 9.07 $ $ Includes all direct and indirect operating cash costs related directly to the physical activities of producing metals, including mining, processing and other plant costs, third-party refining and marketing expense, on-site general and administrative costs, royalties and mining production taxes, before by-product revenues earned from all metals other than the primary metal produced at each unit. 36
37 AISC Reconciliation to GAAP Lucky Friday Reconciliation of Cost of Sales and Other Direct Production Costs and Depreciation, Depletion and Amortization (GAAP) to All- In Sustaining Costs, Before By-product Credits, per Ounce and All-In Sustaining Costs, After By-product Credits, per Ounce (non-gaap) In thousands (except per ounce amounts) Lucky Friday Estimate 2016 Q Q Cost of sales and other direct production costs and depreciation, depletion and amortization (GAAP) $ 76,210 $ 19,484 $ - $ 15,000 Depreciation, depletion and amortization (11,810) (2,946) - (3,000) Treatment costs 20,277 5, ,000 Change in product inventory (1,162) (46) 1,960 3,000 Other costs (101) (6) 56 1,000 Exploration 76 - (2) - Sustaining capital 41,536 9, ,400 All-In Sustaining Costs, Before By-product Credits (1,2) 125,026 31,422 2,573 25,400 By-products credits (50,722) (13,485) (1,395) (15,000) All-In Sustaining Costs, After By-product Credits $ 74,304 $ 17,937 $ 1,178 $ 10,400 Divided by Ounces Produced 3, All-In Sustaining Costs, Before By-product Credits, per Silver Ounce $ $ $ $ By-products credits per Silver Ounce (14.11) (15.19) (15.84) (18.75) All-In Sustaining Costs, After By-product Credits, per Silver Ounce $ $ $ $ Includes all direct and indirect operating cash costs related directly to the physical activities of producing metals, including mining, processing and other plant costs, third-party refining and marketing expense, on-site general and administrative costs, royalties and mining production taxes, before by-product revenues earned from all metals other than the primary metal produced at each unit. In addition, on-site exploration, reclamation, and sustaining capital costs are also included. 2. All-in sustaining costs, before by-product credits for our consolidated silver properties includes corporate costs for all general and administrative expenses and exploration and sustaining capital which support the operating properties. 37
38 Cash Cost Reconciliation to GAAP San Sebastian Reconciliation of Cost of Sales and Other Direct Production Costs and Depreciation, Depletion and Amortization (GAAP) to All- In Sustaining Costs, Before By-product Credits, per Ounce and All-In Sustaining Costs, After By-product Credits, per Ounce (non-gaap) In thousands (except per ounce amounts) San Sebastian Estimate for 2016 Q Q Cost of sales and other direct production costs and depreciation, depletion and amortization (GAAP) $ 31,233 $ 6,532 $ 6,680 $ 24,000 Depreciation, depletion and amortization (3,782) (677) (641) (3,000) Treatment costs 1, ,000 Change in product inventory 1, (627) 2,000 Reclamation and other costs (2,257) (140) (494) 1,000 Cash Cost, Before By-product Credits (1) 28,297 6,993 5,340 25,000 By-products credits (42,667) (10,922) (8,088) (31,000) Cash cost, After By-product Credits $ (14,370) $ (3,929) $ (2,748) $ (6,000) Divided by Ounces Produced 4, ,000 Cash Cost, Before By-product Credits, per Silver Ounce $ 6.59 $ 7.16 $ 6.07 $ 8.33 By-products credits per Silver Ounce (9.94) (11.19) (9.19) (10.33) Cash Cost, After By-product Credits, per Silver Ounce $ (3.35) $ (4.03) $ (3.12) $ (2.00) 1. Includes all direct and indirect operating cash costs related directly to the physical activities of producing metals, including mining, processing and other plant costs, third-party refining and marketing expense, on-site general and administrative costs, royalties and mining production taxes, before by-product revenues earned from all metals other than the primary metal produced at each unit. 38
39 AISC Reconciliation to GAAP San Sebastian Reconciliation of Cost of Sales and Other Direct Production Costs and Depreciation, Depletion and Amortization (GAAP) to All- In Sustaining Costs, Before By-product Credits, per Ounce and All-In Sustaining Costs, After By-product Credits, per Ounce (non-gaap) San Sebastian In thousands (except per ounce amounts) Estimate for 2016 Q Q Cost of sales and other direct production costs and depreciation, depletion and amortization (GAAP) $ 31,233 $ 6,532 $ 6,680 $ 24,000 Depreciation, depletion and amortization (3,782) (677) (641) (3,000) Treatment costs 1, ,000 Change in product inventory 1, (627) 2,000 Other costs (2,013) (98) (377) 2,000 Exploration 4,043 1,051 1,495 5,000 Sustaining capital 1, ,000 All-In Sustaining Costs, Before By-product Credits (1,2) 34,124 8,592 7,354 34,000 By-products credits (42,667) (10,922) (8,088) (31,000) All-In Sustaining Costs, After By-product Credits $ (8,543) $ (2,330) $ (734) $ 3,000 Divided by Ounces Produced 4, ,000 All-In Sustaining Costs, Before By-product Credits, per Silver Ounce $ 7.95 $ 8.80 $ 8.36 $ By-products credits per Silver Ounce (9.94) (11.19) (9.19) (10.33) All-In Sustaining Costs, After By-product Credits, per Silver Ounce $ (1.99) $ (2.39) $ (0.83) $ Includes all direct and indirect operating cash costs related directly to the physical activities of producing metals, including mining, processing and other plant costs, third-party refining and marketing expense, on-site general and administrative costs, royalties and mining production taxes, before by-product revenues earned from all metals other than the primary metal produced at each unit. In addition, on-site exploration, reclamation, and sustaining capital costs are also included. 2. All-in sustaining costs, before by-product credits for our consolidated silver properties includes corporate costs for all general and administrative expenses and exploration and sustaining capital which support the operating properties. 39
40 Cash Cost Reconciliation to GAAP Casa Berardi Reconciliation of Cost of Sales and Other Direct Production Costs and Depreciation, Depletion and Amortization (GAAP) to All- In Sustaining Costs, Before By-product Credits, per Ounce and All-In Sustaining Costs, After By-product Credits, per Ounce (non-gaap) In thousands (except per ounce amounts) Casa Berardi Estimate for 2016 Q Q Q Q Q Cost of sales and other direct production costs and depreciation, depletion and amortization $ 155,711 $ 36,295 $ 49,074 $ 42,466 $ 43,680 $ 48,595 $ 181,000 Depreciation, depletion and amortization (47,312) (10,465) (14,748) (12,514) (11,344) (15,596) (55,000) Treatment costs 1, ,000 Change in product inventory 2,890 3,460 (1,323) 1,381 (212) (288) (1,000) Reclamation and other costs (459) (115) (117) (17) (212) (124) (1,000) Cash Cost, Before By-product Credits (1) 112,094 29,393 33,523 31,887 32,466 33, ,000 By-products credits (572) (162) (163) (147) (142) (161) (1,000) Cash cost, After By-product Credits $ 111,522 $ 29,231 $ 33,360 $ 31,740 $ 32,324 $ 33,108 $ 124,000 Divided by Gold Ounces Produced Cash Cost, Before By-product Credits, per Gold Ounce $ $ $ $ $ $ $ By-products credits per Gold Ounce $ 3.92 $ (5.07) $ (3.91) $ (4.11) $ (4.25) $ (3.65) $ (6.00) Cash Cost, After By-product Credits, per Gold Ounce $ $ $ $ $ $ $ Includes all direct and indirect operating cash costs related directly to the physical activities of producing metals, including mining, processing and other plant costs, third-party refining and marketing expense, on-site general and administrative costs, royalties and mining production taxes, before by-product revenues earned from all metals other than the primary metal produced at each unit. 40
41 AISC Reconciliation to GAAP Casa Berardi Reconciliation of Cost of Sales and Other Direct Production Costs and Depreciation, Depletion and Amortization (GAAP) to All- In Sustaining Costs, Before By-product Credits, per Ounce and All-In Sustaining Costs, After By-product Credits, per Ounce (non-gaap) Casa Berardi In thousands (except per ounce amounts) Cost of sales and other direct production costs and depreciation, depletion and amortization (GAAP) Estimate for 2016 Q Q $ 155,711 $ 36,295 $ 48,596 $ 181,000 Depreciation, depletion and amortization (47,312) (10,465) (15,596) (55,000) Treatment costs 1, ,000 Change in product inventory 2, (288) (1,000) Other costs (270) 2 (1) - Exploration 3, ,161 4,000 Sustaining capital 66,326 16,078 13,775 48,000 All-In Sustaining Costs, Before By-product Credits (1,2) 181,940 46,243 48, ,000 By-products credits (572) (162) (161) (1,000) All-In Sustaining Costs, After By-product Credits $ 181,368 $ 46,081 $ 48,168 $ 177,000 Divided by Ounces Produced All-In Sustaining Costs, Before By-product Credits, per Gold Ounce $ 1, $ 1, $ 1, $ 1, By-products credits per Gold Ounce (3.91) (5.07) (3.65) (6.00) All-In Sustaining Costs, After By-product Credits, per Gold Ounce $ 1, $ 1, $ 1, $ 1, Includes all direct and indirect operating cash costs related directly to the physical activities of producing metals, including mining, processing and other plant costs, third-party refining and marketing expense, on-site general and administrative costs, royalties and mining production taxes, before by-product revenues earned from all metals other than the primary metal produced at each unit. In addition, on-site exploration, reclamation, and sustaining capital costs are also included. 2. All-in sustaining costs, before by-product credits for our consolidated silver properties includes corporate costs for all general and administrative expenses and exploration and sustaining capital which support the operating properties. 41
42 Adjusted EBITDA Reconciliation and Net Debt Reconciliation to GAAP Dollars are in thousands Three Months Ended Nine Months Ended Twelve Months Ended Sept 30, 2017 Sept 30, 2016 Sept 30, 2017 Sept 30, 2016 Sept 30, 2017 Sept 30, 2016 Net income (loss) $ 1,412 $ 25,789 $ 4,230 $ 49,285 $ 24,492 $ (13,678) Plus: Interest expense, net of amount capitalized 9,358 5,574 28,423 16,655 33,564 22,694 Plus/(Less): Income taxes (5,401) 9,453 (18,377) 22,603 (13,552) 83,106 Plus: Depreciation, depletion and amortization 28,844 30,179 83,365 84, , ,432 Plus: Exploration expense 7,255 3,859 17,622 10,171 22,171 13,168 Plus: Pre-development expense 1, ,061 1,475 5,723 1,854 Plus: Acquisition costs 1,765 2, ,167 Plus: Lucky Friday suspension-related costs 4,780 14,385 14,385 Less: Gain on disposition of properties, plants, equipment and mineral interests (4,830) (8) (4,924) (319) (4,752) (90) Plus: Stock-based compensation 2,120 1,347 4,951 4,561 6,322 5,950 Plus: Provision for closed operations and environmental matters 1,132 1,680 3,379 3,685 4,507 4,693 Plus/(Less): Foreign exchange loss (gain) 4,764 (2,375) 10,909 7,713 6,122 2,680 Plus/(Less): Loss (gain) on derivative contracts 11,226 (7) 16,548 12,125 (Less)/Plus: Provisional price loss/(gain) (1,244) 1,141 (564) (376) 730 (449) (Less)/Plus: Other (417) (194) (945) (834) (441) (1,426) Adjusted EBITDA $ 60,756 $ 78,753 $ 163,063 $ 201,378 $ 226,165 $ 236,101 Total debt $ 515,205 $ 515,757 Less: Cash, cash equivalents and short-term investments $ (205,896) $ (192,378) Net debt $ 309,309 $ 323,379 Net debt/ltm adjusted EBITDA (non-gaap)
43 Adjusted EBITDA Reconciliation and Net Debt Reconciliation to GAAP Reconciliation of Net Income (Loss) (GAAP) to Adjusted EBITDA (non-gaap) Dollars in thousands (USD) For the Twelve Months Ended 30-Sep Jun Mar Dec Sep-16 Net income (loss) $ 24,492 $ 48,867 $ 96,999 $ 69,547 $ (13,678) Plus: Interest expense, net of amount capitalized 33,564 29,780 24,607 21,796 22,694 Plus/(Less): Income taxes (13,552) 1,302 (3,297) 27,428 83,106 Plus: Depreciation, depletion and amortization 114, , , , ,432 Plus: Exploration expense 22,171 18,775 16,284 14,720 13,168 Plus: Pre-development expense 5,723 4,516 3,985 3,137 1,854 Plus: Acquisition costs 528 2,318 2,695 2,695 2,167 Plus: Lucky Friday suspension costs 14,385 9,605 1, Less: Gain on dispostion of properties, plants, equipment and mineral (4,752) (90) Plus: Stock-based compensation 6,322 5,549 6,109 5,932 5,950 Plus: Provision for closed operations 4,507 3,115 4,813 4,813 4,693 Plus/(Less): Foreign exchange (gain) loss 6,122 (1,017) (3,015) 2,926 2,680 Plus/(Less): Loss (gain) on derivative contracts 12, ,386 (4,423) - Plus/(Less): Provisional price (loss) gain 730 5, (449) Plus: Unrealized (gain)/loss on investments (861) Other (441) (1,116) (523) (507) (1,426) Adjusted EBITDA $ 226,165 $ 242,424 $ 272,105 $ 264,627 $ 236,101 Total debt $ 515,205 $ 514,702 $ 513,027 $ 512,940 $ 515,757 Less: Cash, cash equivalents, and short-term investments (205,896) (201,929) (213,291) (198,900) (192,378) Net debt $ 309,309 $ 312,773 $ 299,736 $ 314,040 $ 323,379 Net debt/ltm adjusted EBITDA 1.4x 1.3x 1.1x 1.2x 1.4x 43
44 Proven & Probable Mineral Reserves (on Dec. 31, 2016 unless otherwise noted) Proven Reserves Silver Gold Lead Zinc Silver Gold Lead Zinc Copper Asset Tons (000) (oz/ton) (oz/ton) % % (000 oz) (000 oz) Tons Tons Tons Greens Creek (a) Lucky Friday (a) 3, , , ,400 - Casa Berardi (1) 2, San Sebastian (a) , Total 5,935 59, , ,000 - Probable Reserves Silver Gold Lead Zinc Silver Gold Lead Zinc Copper Asset Tons (000) (oz/ton) (oz/ton) % % (000 oz) (000 oz) (Tons) (Tons) Tons Greens Creek (a) 7, , , ,530 - Lucky Friday (a) 1, , ,640 43,410 - Casa Berardi (1) 7, , San Sebastian (a) , Total 17, ,233 1, , ,940 - Proven and Probable Reserves Silver Gold Lead Zinc Silver Gold Lead Zinc Copper Asset Tons (000) (oz/ton) (oz/ton) % % (000 oz) (000 oz) (Tons) (Tons) Tons Greens Creek (a) 7, , , ,130 - Lucky Friday (a) 4, , , ,810 - Casa Berardi (1) 10, , San Sebastian (a) , Total 23, ,306 2, , ,940 - (a) Mineral reserves are based on $1200 gold, $14.50 silver, $0.90 lead, $1.05 zinc, unless otherwise stated. (1) Mineral reserves are based on $1200 gold and a US$/CAN$ exchange rate of 1:1.4 Reserve diluted to an average of 34.7% to minimum width of 9.8 feet (3 m) Open pit mineral reserves of the Principal Mine were estimated in February 2011 by BBA Inc. based on $950 gold and a US$/CAN$ exchange rate of 1:1. Reserve diluted to 10% Technical Report on the Pre-Feasibility Study for the Casa Berardi Principal Zone Open-Pit Project, La Sarre, Quebec, February 2011 Prepared by: Patrice Live, Eng. - BBA Inc.; Amanda Fitch, Jr. Eng. - BBA Inc.; Andre Allaire, Eng., M. Eng., Ph.D. - BBA -44-
45 Measured and Indicated Mineral Resources (on Dec. 31, 2016 unless otherwise noted) Measured Resources Silver Gold Lead Zinc Silver Gold Lead Zinc Copper Asset Tons (000) (oz/ton) (oz/ton) % % (000 oz) (000 oz) (Tons) (Tons) Tons Greens Creek (b) Lucky Friday (2)(b) 14, , , ,890 - Casa Berardi (3) 2, San Sebastian (4)(b) Heva (5) 5, Hosco (5) 33, , Rio Grande Silver (6)(b) Star (7)(a) Total 55,355 92,178 1, , ,890 - Indicated Resources Silver Gold Lead Zinc Silver Gold Lead Zinc Copper Asset Tons (000) (oz/ton) (oz/ton) % % (000 oz) (000 oz) (Tons) (Tons) Tons Greens Creek (b) 1, , , ,660 - Lucky Friday (2)(b) 6, , , ,550 - Casa Berardi (3) 11, , San Sebastian (4)(b) 1, , ,620 19,050 8,420 Heva (5) 5, Hosco (5) 31, , Rio Grande Silver (6) ,620-10,760 5,820 - Star (7)(b) 1, ,301-69,900 83,410 - Total 60,167 79,379 2, , ,490 8,420 Measured & Indicated Resources Silver Gold Lead Zinc Silver Gold Lead Zinc Copper Asset Tons (000) (oz/ton) (oz/ton) % % (000 oz) (000 oz) (Tons) (Tons) Tons Greens Creek (b) 1, , , ,660 - Lucky Friday (2)(b) 21, , , ,440 - Casa Berardi (3) 13, , San Sebastian (4)(b) 1, , ,620 19,050 8,420 Heva (5) 11, Hosco (5) 64, , Rio Grande Silver (6) ,620-10,760 5,820 - Star (7)(b) 1, ,301-69,900 83,410 - Total 115, ,557 4,856 1,044, ,380 8,
Silver and Gold (and Base Metals Too!)
") January 2018 Silver and Gold (and Base Metals Too!) Creating Short and Long Term Value Cautionary Statements Cautionary Statement Regarding Forward Looking Statements, This presentation contains forward-looking
January 2018 Silver and Gold (and Base Metals Too!) Creating Short and Long Term Value Cautionary Statements Cautionary Statement Regarding Forward Looking Statements, This presentation contains forward-looking
Third Quarter 2014 Earnings Conference Call
 SECOND THIRD QUARTER OVERVIEW FINANCIAL REVIEW OPERATIONS REVIEW EXPLORATION & PRE-DEVELOPMENT REVIEW Third Quarter 2014 Earnings Conference Call November 5, 2014 Cautionary Statements Cautionary Statement
Fourth Quarter & 2017
 February 15, 2018 Fourth Quarter & 2017 Earnings Conference Call Cautionary Statements Cautionary Statement Regarding Forward Looking Statements, This presentation contains forward-looking statements within
NYSE:HL PDAC 2017 Our Strategy Works For Shareholders
 March 2017 PDAC 2017 Our Strategy Works For Shareholders Cautionary Statements Cautionary Statement Regarding Forward Looking Statements, This presentation contains forward-looking statements within the
Second Quarter 2013 Earnings Conference Call
 SECOND QUARTER OVERVIEW FINANCIAL REVIEW OPERATIONS REVIEW EXPLORATION & PRE-DEVELOPMENT UPDATE Second Quarter 2013 Earnings Conference Call August 8, 2013 Cautionary Statements Cautionary Note Regarding
BMO Global Metals & Mining Conference
 February 2017 BMO Global Metals & Mining Conference Our Strategy Works For Shareholders Cautionary Statements Cautionary Statement Regarding Forward Looking Statements, This presentation contains forward-looking
GOLD FORUM EUROPE KEY VALUE DRIVERS. April 2019 RESPONSIBLE. SAFE. INNOVATIVE. Hecla Mining Company. NYSE: HL RESPONSIBLE. SAFE. INNOVATIVE.
 GOLD FORUM EUROPE KEY VALUE DRIVERS April 2019 Hecla Mining Company RESPONSIBLE. SAFE. INNOVATIVE. NYSE: HL RESPONSIBLE. SAFE. INNOVATIVE. l 1 CAUTIONARY STATEMENTS Cautionary Statement Regarding Forward
Hecla Reports First Quarter 2018 Results Company Release - 5/10/2018 3:05 AM ET
 Press Release Home / Press Release Hecla Reports First Quarter 2018 Results Company Release - 5/10/2018 3:05 AM ET Lower silver and gold cash costs and all in sustaining costs, after by-product credits,
Bank of America Merrill Lynch Annual Canada Mining Conference Toronto
 Bank of America Merrill Lynch Annual Canada Mining Conference Toronto September 10, 2015 Cautionary Statements Cautionary Statement Regarding Forward Looking Statements, This presentation contains forward-looking
Triple Gold Conference New York
 Triple Gold Conference New York July 22, 2015 Cautionary Statements Cautionary Statement Regarding Forward Looking Statements, This presentation contains forward-looking statements within the meaning of
Hecla Reports Third Quarter 2018 Results Company Release - 11/8/2018 3:05 AM ET
 Press Release Home / Press Release Hecla Reports Third Quarter Results Company Release - 11/8/ 3:05 AM ET Casa Berardi has record low costs COEUR D'ALENE, Idaho--(BUSINESS WIRE)-- Hecla Mining Company
Morgan Stanley Leveraged Finance Conference New Orleans
 Morgan Stanley Leveraged Finance Conference New Orleans June 3, 2015 Cautionary Statements Cautionary Statement Regarding Forward Looking Statements, This presentation contains forward-looking statements
Gold Stock Analyst Investor Day. February 22, 2015
 QUALITY ASSETS UPSIDE POTENTIAL FINANCIAL STRENGTH UNDERVALUED Gold Stock Analyst Investor Day February 22, 2015 Cautionary Statements Cautionary Statement Regarding Forward Looking Statements, Including
Building a Leading Diversified Precious Metals Company: Hecla s Agreement to Acquire Aurizon Mines. March 4, 2013
 DEAL HIGHLIGHTS AURIZON OVERVIEW INVESTMENT RATIONALE NEXT STEPS Building a Leading Diversified Precious Metals Company: Hecla s Agreement to Acquire Aurizon Mines March 4, 2013 Cautionary Statements Cautionary
Roth Capital Partners 27th Annual Growth Stock Conference
 Q U A L I T Y A S S E T S U P S I D E P O T E N T I A L F I N A N C I A L S T R E N G T H U N D E R V A L U E D Roth Capital Partners 27th Annual Growth Stock Conference March 9, 2015 Cautionary Statements
Africa Projects February 2016
 Africa Projects Cautionary statement Cautionary statement regarding forward looking statements: This presentation contains forward-looking statements within the meaning of Section 27A of the Securities
European Gold Forum. April 15, 2015
 QUALITY ASSETS UPSIDE POTENTIAL FINANCIAL STRENGTH UNDERVALUED European Gold Forum April 15, 2015 Cautionary Statements Cautionary Statement Regarding Forward Looking Statements, Including 2015 Outlook
Coeur Files Technical Report for Kensington Mine
 Coeur Files Technical Report for Kensington Mine Chicago, Illinois April 25, 2018 Coeur Mining, Inc. ( Coeur or the Company ) (NYSE: CDE) today filed a NI 43-101 Technical Report ( technical report ) for
NEWS RELEASE. Coeur Reports Second Quarter 2014 Results
 NEWS RELEASE Coeur Reports Second Quarter 2014 Results Cash flow from operating activities increased by $40 million; Rochester cash flow and production growth accelerates; Full-year cost guidance reduced
Coeur Announces Initial Reserve Estimate and Reserve-Based Mine Plan for Silvertip Mine
 Coeur Announces Initial Reserve Estimate and Reserve-Based Mine Plan for Silvertip Mine Chicago, Illinois December 27, 2018 Coeur Mining, Inc. ( Coeur or the Company ) (NYSE: CDE) today announced initial
HECLA REPORTS SECOND QUARTER RESULTS; INCREASES SILVER PRODUCTION 60% For the Period Ended June 30, 2008 For Release: August 4, 2008
 NEWS RELEASE 2008-18 HECLA REPORTS SECOND QUARTER RESULTS; INCREASES SILVER PRODUCTION 60% For the Period Ended June 30, 2008 For Release: August 4, 2008 COEUR D ALENE, IDAHO -- Hecla Mining Company (HL:NYSE)
SCOTIABANK MINING CONFERENCE
 T S X K D X N Y S E A M E R I C A N K L D X SCOTIABANK MINING CONFERENCE D E C E M B E R 2 0 1 7 CAUTIONARY NOTES Cautionary Note Regarding Forward-Looking Information This presentation contains certain
ANNUAL GENERAL MEETING APRIL 28, 2017
 ANNUAL GENERAL MEETING APRIL 28, 2017 Forward Looking Statements The information in this presentation has been prepared as at April 28, 2017. Certain statements contained in this presentation constitute
Coeur Provides Updated Palmarejo Mine Plan
 NEWS RELEASE Coeur Provides Updated Palmarejo Mine Plan Chicago, Illinois - July 20, 2014 - Coeur Mining, Inc. ( Coeur or the Company ) (NYSE: CDE) announced an updated and re-scoped mine plan and preliminary
Coeur Reports 89% Increase in Silver Reserves and 76% Increase in Gold Reserves at Palmarejo Post-Paramount Acquisition
 NEWS RELEASE Coeur Reports 89% Increase in Silver Reserves and 76% Increase in Gold Reserves at Palmarejo Post-Paramount Acquisition Contains 31% Higher Average Silver Grade Chicago, Illinois April 27,
Detour Gold Reports Fourth Quarter and Full-Year 2014 Results and Year-end 2014 Mineral Reserve and Resource Estimates
 March 6, 2015 NEWS RELEASE Detour Gold Reports Fourth Quarter and Full-Year 2014 Results and Year-end 2014 Mineral Reserve and Resource Estimates Detour Gold Corporation (TSX: DGC) ( Detour Gold or the
First Quarter 2012 Results
 AGNICO-EAGLE MINES LIMITED First Quarter 2012 Results April 2012 Forward Looking Statements The information in this document has been prepared as at April 27, 2012. Certain statements contained in this
AGNICO-EAGLE MINES LIMITED. Corporate Update. May 2012
 AGNICO-EAGLE MINES LIMITED Corporate Update May 2012 Forward Looking Statements The information in this document has been prepared as at May 16, 2012. Certain statements contained in this document constitute
Exploration Projects September 30, 2014
 Exploration Projects September 30, 2014 Agnico Eagle Forward-Looking Statements The information in this presentation has been prepared as at September 30, 2014. Certain statements contained in this document
Allied Nevada Announces Improved Mine Plan and Economics for Hycroft Mill Expansion With 77% IRR and $2.7 Billion NPV
 Allied Nevada Gold Corp. 9790 Gateway Drive Suite 200 Reno, NV 89521 USA NEWS RELEASE Allied Nevada Announces Improved Mine Plan and Economics for Hycroft Mill Expansion With 77% IRR and $2.7 Billion NPV
Stock Symbol: AEM (NYSE and TSX) For further information: Investor Relations (416)
 For further information: Investor Relations (416)") Stock Symbol: AEM (NYSE and TSX) For further information: Investor Relations (416) 947-1212 (All amounts expressed in U.S. dollars unless otherwise noted) AGNICO-EAGLE FILES NEW TECHNICAL REPORT ON GOLDEX
Stock Symbol: AEM (NYSE and TSX) For further information: Investor Relations (416) 947-1212 (All amounts expressed in U.S. dollars unless otherwise noted) AGNICO-EAGLE FILES NEW TECHNICAL REPORT ON GOLDEX
Coeur Reports Year-End 2014 Mineral Reserves and Resources
 NEWS RELEASE Coeur Reports Year-End 2014 Mineral Reserves and Resources Chicago, Illinois - February 18, 2015 - Coeur Mining, Inc. ( Coeur or the Company ) (NYSE: CDE) announced year-end contained proven
CORPORATE PRESENTATION
 CORPORATE PRESENTATION NEW YORK/BOSTON MARKETING TRIP A P RIL 11 & 1 2, 2 017 CAUTIONARY NOTES Cautionary Note Regarding Forward-Looking Information This presentation contains certain information that
Hecla Mining Company BMO Capital Markets Global Metals and Mining Conference
 Hecla Mining Company 2010 BMO Capital Markets Global Metals and Mining Conference 1 Cautionary Statements Cautionary Note Regarding Forward Looking Statements Statements made which are not historical facts,
AVINO SILVER & GOLD MINES LTD.
 AVINO SILVER & GOLD MINES LTD. T 604.682.3701 Suite 900, 570 Granville Street ir@avino.com F 604.682.3600 Vancouver, BC V6C 3P1 www.avino.com November 8, 2017 NYSE American: ASM TSX-V: ASM FSE: GV6 Avino
Scotiabank Mining Conference. December 3, 2014
 Scotiabank Mining Conference December 3, 2014 Cautionary Notes NON-GAAP MEASURE CASH COSTS PER OUNCE, NET OF BY-PRODUCT CREDITS THIS PRESENTATION PRESENTS INFORMATION ABOUT OUR CASH COSTS OF PRODUCTION
C R E A T I N G V A L U E H E C L A P R O P E R T I E S O R G A N I C G R O W T H K E Y M I L E S T O N E S
 CREATING VALUE HECLA PROPERTIES ORGANIC GROWTH KEY MILESTONES Vancouver Resource Investment Conference January 22-23, 2012 Cautionary Statements Cautionary Note Regarding Forward Looking Statements Statements
STRATEGY. DISCIPLINE. EXECUTION. FEBRUARY 15, 2013 FOURTH QUARTER CONFERENCE CALL
 STRATEGY. DISCIPLINE. EXECUTION. FEBRUARY 15, 2013 FOURTH QUARTER CONFERENCE CALL MANAGEMENT PARTICIPANTS Chuck Jeannes President and Chief Executive Officer Lindsay Hall EVP & Chief Financial Officer
BMO CAPITAL MARKETS 27 TH GLOBAL METALS AND MINING CONFERENCE
 T S X K D X N Y S E A M E R I C A N K L D X BMO CAPITAL MARKETS 27 TH GLOBAL METALS AND MINING CONFERENCE PAUL HUET, PRESIDENT AND CEO F E B R U A R Y 2 8, 2 0 1 8 T S X K D X N Y S E A m e r i c a n :
NOW IN COMMERCIAL PRODUCTION
 NYSE American USAS TSX USA NOW IN COMMERCIAL PRODUCTION Corporate Presentation March 2018 PDAC FORWARD-LOOKING STATEMENTS Safe Harbour and Other Disclosures Certain information in this presentation may
N E W S R E L E A S E
 ASM: TSX/NYSE American Avino Silver & Gold Mines Ltd. T (604) 682 3701 Suite 900-570 Granville Street F (604) 682 3600 Vancouver, BC V6C 3P1 www.avino.com February 27, 2019 N E W S R E L E A S E Avino
Trevali reports Q financial results
 Trevali Mining Corporation 1400-1199 West Hastings Street Vancouver, British Columbia, CANADA V6E 3T5 Telephone: (604) 488-1661 www.trevali.com NEWS RELEASE Trevali reports Q3-2017 financial results EBITDA
SAS REPORTS STRONG 2015 FIRST QUARTER RESULTS
 NEWS RELEASE All dollar amounts are stated in Canadian dollars, unless otherwise indicated SAS REPORTS STRONG 2015 FIRST QUARTER RESULTS Toronto, Canada May 12, 2015 St Andrew Goldfields Ltd. (T-SAS),
FNV. Forward-Looking Statements
 1 Forward-Looking Statements This presentation contains certain forward looking information and forward looking statements within the meaning of applicable Canadian securities laws and the United States
BMO CAPITAL MARKETS 27 TH GLOBAL METALS AND MINING CONFERENCE
 T S X K D X N Y S E A M E R I C A N K L D X BMO CAPITAL MARKETS 27 TH GLOBAL METALS AND MINING CONFERENCE F E B R U A R Y 2 0 1 8 T S X K D X N Y S E A m e r i c a n : K L D X CAUTIONARY NOTES Cautionary
Annual Meeting of Shareholders
 EXPECTED PRODUCTION GROWTH LUCKY FRIDAY IMPROVEMENTS RESERVES & RESOURCES GROWTH GREENS CREEK LONG LIFE Annual Meeting of Shareholders May 24, 2012 Investor Inquiries 6500 N. Mineral Drive, Suite 200 Coeur
NEWS RELEASE GREAT PANTHER SILVER REPORTS FISCAL YEAR 2014 FINANCIAL RESULTS
 March 4, 2015 For Immediate Release TSX: GPR NYSE MKT: GPL NEWS RELEASE GREAT PANTHER SILVER REPORTS FISCAL YEAR 2014 FINANCIAL RESULTS GREAT PANTHER SILVER LIMITED (TSX: GPR; NYSE MKT: GPL; Great Panther
N E W S R E L E A S E
 ASM: TSX/NYSE American Avino Silver & Gold Mines Ltd. T (604) 682 3701 Suite 900-570 Granville Street F (604) 682 3600 Vancouver, BC V6C 3P1 www.avino.com N E W S R E L E A S E November 7, AVINO REPORTS
Alio Gold Reports Second Quarter 2018 Results
 Alio Gold Reports Second Quarter 2018 Results VANCOUVER, British Columbia, g. 10, 2018 -- Alio Gold Inc. (TSX, NYSE AMERICAN: ALO) ( Alio Gold or the Company ) today reported its second quarter 2018 financial
Trevali Reports 2017 Annual Financial Results
 Trevali Mining Corporation 1400-1199 West Hastings Street Vancouver, British Columbia, CANADA V6E 3T5 Telephone: (604) 488-1661 www.trevali.com NEWS RELEASE Trevali Reports 2017 Annual Financial Results
Corporate Update. June 2013
 Corporate Update June 2013 FORWARD LOOKING STATEMENTS The information in this document has been prepared as at June 5, 2013. Certain statements contained in this document constitute forwardlooking statements
NEWS RELEASE Lundin Mining Second Quarter Results
 Corporate Office 150 King Street West, Suite 2200 P.O. Box 38 Toronto, ON M5H 1J9 Phone: +1 416 342 5560 Fax: +1 416 348 0303 NEWS RELEASE Lundin Mining Second Quarter Results Toronto, July 25, 2018 (TSX:
CANADA S INTERMEDIATE GOLD PRODUCER
 CANADA S INTERMEDIATE GOLD PRODUCER Second Quarter 2018 Results Conference Call & Webcast July 26, 2018 1 Cautionary Statement on Forward Looking Information This presentation contains certain forward-looking
NEWS RELEASE. FOR IMMEDIATE RELEASE March 19, 2018
 NEWS RELEASE HECLA TO ACQUIRE THREE HIGH-GRADE NEVADA GOLD MINES WITH THE ACQUISITION OF KLONDEX MINES LTD. Adds 27% more high-grade production to its strong North American silver and gold mines FOR IMMEDIATE
Akyem Site Visit February 2016
 Akyem Site Visit Cautionary statement Cautionary statement regarding forward looking statements: This presentation contains forward-looking statements within the meaning of Section 27A of the Securities
YEAR END 2015 CONFERENCE CALL
 YEAR END 2015 CONFERENCE CALL February 26, 2015 SSRI:NDAQ SSO: TSX 1 Cautionary Notes Cautionary Note Regarding Forward-Looking Statements This presentation contains forward-looking information within
HBM. Creating Sustainable Value through High Quality Long Life Deposits
 HBM Creating Sustainable Value through High Quality Long Life Deposits Q1 2012 Conference Call, May 10, 2012 Forward Looking Information This presentation contains contains forward-looking statements and
TSX:AR CORPORATE PRESENTATION
 TSX:AR CORPORATE PRESENTATION Second Quarter 2018 Conference Call August 10, 2018 FORWARD LOOKING INFORMATION This presentation contains certain forward-looking statements and forward-looking information
SILVER PRODUCER STRENGTH UPSIDE PRIMARY SILVER PRODUCER. Primary Silver Producer 57% Ag, 33% Au, 10% Pb-Zn
 PRIMARY SILVER PRODUCER SILVER Primary Silver Producer 57% Ag, 33% Au, 10% Pb-Zn PRODUCER Two 100% owned mines in Mexico Unhedged Ag & Au; No Royalties STRENGTH Strong balance sheet; no LTD $21.3 M cash,
Royal Gold Reports Record Operating Cash Flow in its Third Quarter 2017
 Royal Gold Reports Record Operating Cash Flow in its Third Quarter 2017 DENVER, COLORADO. MAY 10, 2017: ROYAL GOLD, INC. (NASDAQ: RGLD) (together with its subsidiaries, Royal Gold or the Company, we or
October 25, Third Quarter Conference Call
 October 25, 2018 Third Quarter 2018 - Conference Call Forward-Looking Statements This presentation contains forward-looking statements within the meaning of Section 27A of the United States Securities
Corporate Presentation December 5, 2017
 Corporate Presentation December 5, 2017 Cautionary Statements Cautionary Note Regarding Forward Looking Statements: Statements made regarding matters which are not historical facts, such as statements
Detour Gold Achieves Production and Cost Guidance for 2017 and Provides 2018 Guidance
 January 16, 2018 NEWS RELEASE Detour Gold Achieves Production and Cost Guidance for 2017 and Provides 2018 Guidance Detour Gold Corporation (TSX: DGC) ( Detour Gold or the Company ) today announces fourth
Coeur Reports Year-End 2015 Mineral Reserves and Resources
 NEWS RELEASE Coeur Reports Year-End 2015 Mineral Reserves and Resources Chicago, Illinois - February 10, 2016 - Coeur Mining, Inc. ( Coeur or the Company ) (NYSE: CDE) announced year-end contained proven
Tom Palmer, Senior Vice President APAC. Diggers and Dealers 2 August 2015
 Tom Palmer, Senior Vice President APAC Diggers and Dealers 2 August 2015 Cautionary statement Cautionary statement regarding forward looking statements: This presentation contains forward-looking statements
Global Hunter Securities Chicago Metals & Mining Day. August 16, 2012
 CREATING VALUE HECLA PROPERTIES ORGANIC GROWTH KEY MILESTONES Global Hunter Securities Chicago Metals & Mining Day August 16, 2012 Cautionary Statements Cautionary Statements Statements made which are
Bank of America Merrill Lynch 19th Annual Canada Mining Conference
 NEW HECLA FINANCIAL STRENGTH HECLA PROPERTIES STRONG SILVER FUNDAMENTALS Bank of America Merrill Lynch 19th Annual Canada Mining Conference September 12, 2013 Cautionary Statements Cautionary Note Regarding
Coeur Reports Second Quarter 2018 Results
 NEWS RELEASE Coeur Reports Second Quarter 2018 Results Chicago, Illinois - July 25, 2018 - Coeur Mining, Inc. ( Coeur or the Company ) (NYSE: CDE) today reported second quarter 2018 financial results,
Royal Gold Reports Record Annual Revenue, Earnings and Cash Flow
 Royal Gold Reports Record Annual Revenue, Earnings and Cash Flow DENVER, COLORADO. AUGUST 9, 2017: ROYAL GOLD, INC. (NASDAQ: RGLD) (together with its subsidiaries, Royal Gold or the Company, we or our
Coeur Reports 39% Increase in Wharf s Gold Reserves. Adds Three Years of Expected Mine Life
 NEWS RELEASE Coeur Reports 39% Increase in Wharf s Gold Reserves Adds Three Years of Expected Mine Life Chicago, Illinois - June 24, 2015 - Coeur Mining, Inc. ( Coeur or the Company ) (NYSE: CDE) announced
Q4 and Full Year 2017 Results & 2018 Outlook. February 16, 2018
 Q4 and Full Year 2017 Results & 2018 Outlook February 16, 2018 Cautionary Note Regarding Forward-Looking Statements CAUTIONARY NOTE REGARDING FORWARD-LOOKING STATEMENTS: This presentation contains or incorporates
GOLD RESOURCE CORPORATION REPORTS 2017 NET INCOME OF $4.2 MILLION, OR $0.07 PER SHARE; PROVIDES 2018 PRODUCTION OUTLOOK
 FOR IMMEDIATE RELEASE March 8, 2018 NEWS NYSE American: GORO GOLD RESOURCE CORPORATION REPORTS 2017 NET INCOME OF $4.2 MILLION, OR $0.07 PER SHARE; PROVIDES 2018 PRODUCTION OUTLOOK COLORADO SPRINGS March
Coeur Reports Year-End 2016 Mineral Reserves and Resources
 NEWS RELEASE Coeur Reports Year-End 2016 Mineral Reserves and Resources Chicago, Illinois - February 8, 2017 - Coeur Mining, Inc. ( Coeur or the Company ) (NYSE: CDE) today announced year-end 2016 contained
First Quarter 2018 Results April 26, 2018
 TSX: LUN Nasdaq Stockholm: LUMI First Quarter 2018 Results April 26, 2018 1 Candelaria, Atacama Region, Chile Cautionary Statements Caution Regarding Forward-Looking Information and Non-GAAP Performance
Pretivm Reports Third Quarter 2018 Results
 November 8, News Release 18-18 Pretivm Reports Third Quarter Results Brucejack Mine delivers profitability; significant cash build Vancouver, British Columbia, November 8, ; Pretium Resources Inc. (TSX/NYSE:PVG)
CANADA S INTERMEDIATE GOLD PRODUCER
 CANADA S INTERMEDIATE GOLD PRODUCER Third Quarter 2018 Results Conference Call & Webcast October 25, 2018 1 Cautionary Statement on Forward Looking Information This presentation contains certain forward-looking
Capstone Mining 2017 Production Results and 2018 Operating and Capital Guidance
 Suite 2100 510 West Georgia Street Vancouver, BC, V6B 0M3, Canada Tel: 604-684-8894 Fax: 604-688-2180 www.capstonemining.com January 10, 2018 Capstone Mining 2017 Production Results and 2018 Operating
Q Earnings. October 25, 2018
 Q3 2018 Earnings Cautionary statement Cautionary statement regarding forward looking statements: This presentation contains forward-looking statements within the meaning of Section 27A of the Securities
Turquoise Hill files 2016 Oyu Tolgoi Technical Report
 October 21, 2016 Press release Turquoise Hill files 2016 Oyu Tolgoi Technical Report VANCOUVER, CANADA Turquoise Hill Resources today filed an updated compliant independently-prepared technical report
Coeur Reports Year-End 2018 Mineral Reserves and Resources
 Coeur Reports Year-End 2018 Mineral Reserves and Resources Results reflect the fourth consecutive year of growth Initial reserve declaration at Silvertip drives higher Companywide silver reserve grades
19 th Annual Canada Mining Conference. September 12-13, 2013
 19 th Annual Canada Mining Conference September 12-13, 2013 Cautionary statement Cautionary Statement Regarding Forward Looking Statements, Including Outlook: This presentation contains forward-looking
N E W S R E L E A S E
 ASM: TSX/NYSE American Avino Silver & Gold Mines Ltd. T (604) 682 3701 Suite 900-570 Granville Street F (604) 682 3600 Vancouver, BC V6C 3P1 www.avino.com N E W S R E L E A S E April 2, 2018 Avino Silver
Rambler Updates Reserves at its Producing Canadian Copper & Gold Mine Demonstrating a Profitable 20 Year Mine Life
 5 March 2018 Rambler Updates Reserves at its Producing Canadian Copper & Gold Mine Demonstrating a Profitable 20 Year Mine Life London, England & Baie Verte, Newfoundland and Labrador, Canada Rambler Metals
True Value Proposition. Bank of America Merrill Lynch: 21st Annual Canada Mining Conference September 10-11, 2015 TSX: YRI NYSE: AUY
 True Value Proposition Bank of America Merrill Lynch: 21st Annual Canada Mining Conference September 10-11, 2015 TSX: YRI NYSE: AUY Cautionary Note Regarding Forward-looking Statement CAUTIONARY NOTE REGARDING
SILVER PRODUCER PROFITABLE GROWTH PROFITABLE PRIMARY SILVER PRODUCER. Primary Silver Producer 63% Ag, 27% Au, 10% Pb-Zn
 PROFITABLE PRIMARY SILVER PRODUCER SILVER Primary Silver Producer 63% Ag, 27% Au, 10% Pb-Zn PRODUCER Two 100% owned mines in Mexico Unhedged Ag & Au; No Royalties PROFITABLE FY 2012 Net Income of $5.5
New Drilling Results and Mineral Resource Update for Certej Deposit Gold Resources Increase by 1,570,000 ounces
 NEWS RELEASE ELD No. 12-25 TSX: ELD NYSE: EGO October 25, 2012 New Drilling Results and Mineral Resource Update for Certej Deposit Gold Resources Increase by 1,570,000 ounces Vancouver, British Columbia
February 15, Fourth Quarter Conference Call
 February 15, 2018 Fourth Quarter 2017 - Conference Call Forward-Looking Statements This presentation contains forward-looking statements, within the meaning of Section 27A of the United States Securities
Gold Hawk Resources Inc.
 Gold Hawk Resources Inc. Gold Hawk updates mineral resources and reserve estimates for the Coricancha Mine Vancouver, British Columbia, March 31, 2009 - Gold Hawk Resources Inc. ( Gold Hawk or the Company
All-in Sustaining Costs ($/oz)
") Tahoe Resources 2018 Gold Guidance and Long-Term Outlook Tahoe Resources gold guidance for 2018 and multi-year gold outlook is provided below. While Tahoe expects the Guatemalan Constitutional Court to
Tahoe Resources 2018 Gold Guidance and Long-Term Outlook Tahoe Resources gold guidance for 2018 and multi-year gold outlook is provided below. While Tahoe expects the Guatemalan Constitutional Court to
Q4 and FY 2018 Earnings Review
 Q4 and FY 2018 Earnings Review 1 Cautionary Note Non-GAAP Measures This presentation of Pan American Silver Corp. and its subsidiaries (collectively, Pan American, Pan American Silver, the Company, we
Q Conference Call November 2, 2012 HBM
 Creating sustainable value through high quality, long-life deposits Q3 2012 Conference Call November 2, 2012 HBM Forward-looking Information This presentation contains forward-looking statements and forward-looking
M A R C H 1 5, T S X K D X N Y S E A m e r i c a n : K L D X
 T S X K D X N Y S E A M E R I C A N K L D X 2017 FOURTH QUARTER & FULL-YEAR RESULTS M A R C H 1 5, 2 0 1 8 T S X K D X N Y S E A m e r i c a n : K L D X CAUTIONARY NOTES Cautionary Note Regarding Forward-Looking
EXCELLON REPORTS SECOND QUARTER 2014 FINANCIAL RESULTS
 www.excellonresources.com EXCELLON REPORTS SECOND QUARTER 2014 FINANCIAL RESULTS Toronto, Ontario July 30, 2014 Excellon Resources Inc. (TSX:EXN; OTC:EXLLF) ("Excellon" or the Company"), Mexico s highest
SILVER PRODUCER PROFITABLE GROWTH PROFITABLE PRIMARY SILVER PRODUCER. Primary Silver Producer 63% Ag, 31% Au, 6% Pb-Zn
 PROFITABLE PRIMARY SILVER PRODUCER SILVER Primary Silver Producer 63% Ag, 31% Au, 6% Pb-Zn PRODUCER Two 100% owned mines in Mexico Unhedged Ag & Au; No Royalties PROFITABLE 9 months ended Sep 2012 Net
NEWS RELEASE LUNDIN MINING THIRD QUARTER RESULTS
 Corporate Office 150 King Street West, Suite 1500 P.O. Box 38 Toronto, ON M5H 1J9 Phone: +1 416 342 5560 Fax: +1 416 348 0303 UK Office Hayworthe House, Market Place Haywards Heath, West Sussex RH16 1DB
EXCELLON REPORTS SECOND QUARTER 2018 FINANCIAL RESULTS
 www.excellonresources.com EXCELLON REPORTS SECOND QUARTER 2018 FINANCIAL RESULTS Toronto, Ontario July 30, 2018 Excellon Resources Inc. (TSX:EXN, EXN.WT.A and OTC:EXLLF) ("Excellon" or the Company") is
CANADA S INTERMEDIATE GOLD PRODUCER
 CANADA S INTERMEDIATE GOLD PRODUCER European Gold Forum Zurich April 4-6, 2017 1 Forward Looking Information This presentation contains certain forward-looking information and forward-looking statements,
FNV. Forward-Looking Statements. Non-IFRS Measures
 1 Forward-Looking Statements This presentation contains certain forward looking information and forward looking statements within the meaning of applicable Canadian securities laws and the United States
RBC Capital Markets Underground Mining Technical Session Ernest Mast President & COO October 22, 2015
 RBC Capital Markets Underground Mining Technical Session Ernest Mast President & COO October 22, 2015 Cautionary Statement This presentation may contain forward-looking statements within the meaning of
SILVER PRODUCER PROFITABLE GROWTH PROFITABLE PRIMARY SILVER PRODUCER. Primary Silver Producer 66% Ag, 28% Au, 6% Pb-Zn
 PROFITABLE PRIMARY SILVER PRODUCER SILVER Primary Silver Producer 66% Ag, 28% Au, 6% Pb-Zn PRODUCER Two 100% owned mines in Mexico Unhedged Ag & Au; No Royalties PROFITABLE FY 2012 Net Income of $5.5 million