Record year 2010 Ströer Out-of-Home Media AG Investor and Analyst Conference Call 12 April 2011
|
|
|
- Martin Foster
- 5 years ago
- Views:
Transcription


1 Record year 2010 Ströer Out-of-Home Media AG Investor and Analyst Conference Call 12 April

2 Ströer highlights of 2010 > Best year in the Company s history: record revenue and profitability > Best-in-class operating margin and ROCE > Successful IPO, SDAX listing, index outperformed > Promises kept: M&A debt reduction goals > City contract portfolio expanded > Revolutionary products: out-of-home channel, premium billboard 2 2
3 Financial data: record revenue and profit MM FY 2009 FY 2010 Change (%) Revenues incl. 100% Ströer Turkey (1) Organic Growth (2) incl. 100% Ströer Turkey (1) Operational EBITDA incl. 100% Ströer Turkey (1) Net Adjusted Income (3) Free Cash Flow (4) Net Debt (5) 469,8 503,3 531,3 561,8 +13,1 +11,6-2,5% 7,5% -2,1% 9,4% 100,0 127,3 +27,2 108,7 134,0 +23,4 16,8 33,2 +97,0 16,6-68,2 n/a 495,4 320,1-35,4 Notes: (1) Figure shows full consolidation of Ströer Turkey assuming the stake in Ströer Turkey had been increased from 50% to 90% at 1 Jan 2009; (2) Organic growth = excluding exchange rate effects and effects from the (de)consolidation and discontinuation of operations; (3) Operational EBIT net of the financial result adjusted for exceptional items, amortization of acquired intangible advertising concessions and the normalized tax expense (31.7% tax rate); (4) Free cash flow = cash flows from operating activities less cash flows from investing activities; (5) Net debt = financial liabilities less cash (excl. hedge liabilities) 3


4 Promises kept! Product Guidance Guidance M&A Innovation Deliverables Going Public Prime Standard Listing Issue price 20 Volume: 371m Deleveraging Loan repayment 151 million M&A Increase in stake of Ströer Turkey to 90% Purchase price 55m Q3 organic growth guidance achieved: 11.4% Acquisition of 100% of News Outdoor Poland Purchase price 26 million Product launch Out-of-Home Channel FY organic growth guidance achieved: 9.4% 15 July July 1 September 30 September October December 31 December 4
5 Continual expansion of the city contract portfolio in Germany Municipal portfolio strategy > Securing and expansion in terms of quality of municipal contract portfolio > Increased utilization and quality of contracted spaces > Annual tender performance indicator (TPI) at least 100* Results achieved > 7 of 8 tenders won in 2010** > TPI 2010: around 400 (4 times additional revenue potential gained) Future tenders > Currently 1 tender in Lübeck (tier 3) for BB and SF > No new insights regarding tier 1-2 cities in 2011/2012 * Definition of TPI: net revenue from additional city contract tenders won (target figures after full establishment) over net revenue from unsuccessful city contract tenders (actual figures) on an annual basis x 100 ** Bielefeld/street furniture and billboard (2 tenders), Jena/billboard, Cottbus/billboard, Karlsruhe/street furniture, Bergisch-Gladbach/street furniture and billboard, Bochum/street furniture and billboard 5


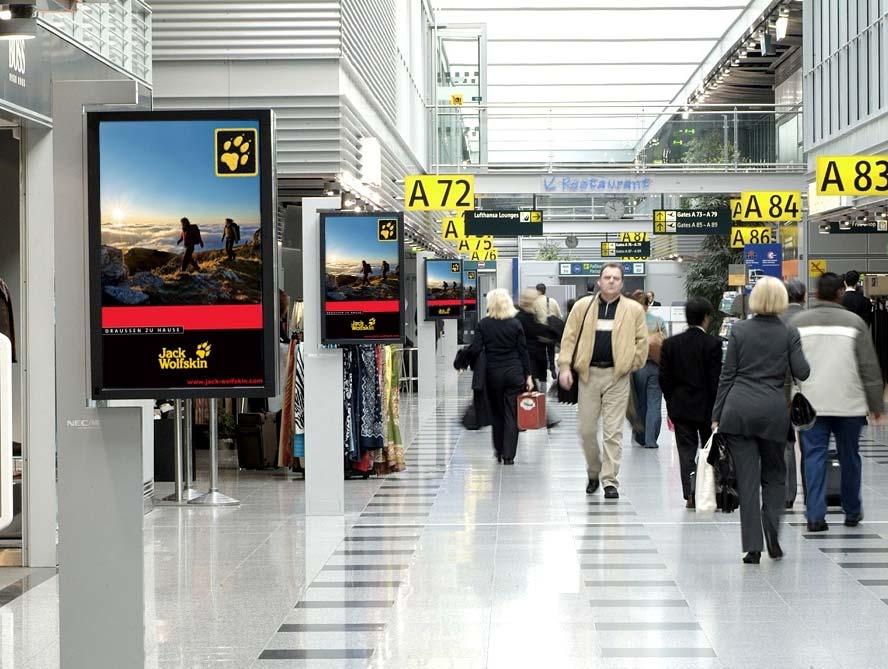
6 Megatrends driving out-of-home advertising Digitalization Mobility Urbanization 6 6
7 Digitalization: two-fold advantage for Ströer > Technical competitive advantages on the level of advertising media - Price of new technology falls more quickly than expected - Real-time bookings - Moving images - New creative opportunities 7 7
8 Digitalization: two-fold advantage for Ströer > Competitive advantage over other media - Digitalization impairs the advertising visibility of traditional content media due to fragmentation - This puts out-of-home advertising in a better position than other advertising media 8 8


9 We create Visibility! 9 9
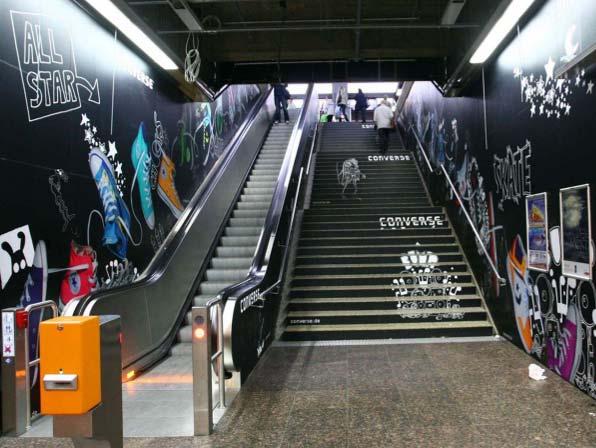
10 Out-of-home advertising unobtrusively effective On billboards On buses/trains On digital screens in the underground/at train stations In the daily newspaper In journals/magazines On the radio In the internet On TV In promotional mailings In s/newsletters 67% 58% 51% 50% 45% 92% 90% 89% 88% 85% 0% 50% 100% Source: tnsemnid, online bus survey, March 2011, n=1001 respondents, top two boxes 10
11 Poster media perform better in all categories than the market as a whole Poster media Openness to advertising Memorability of advertising High quality More advertising wanted in the future Inspired by advertising 12% 22% 31% 25% 28% 23% 19% 23% 17% 34% 0% 20% 40% Average of all other media Posters Source: tnsemnid, online bus survey, March 2011, n=1001 respondents, top two boxes 11


12 Consumer interaction with 360 out-of-home touchpoints 12

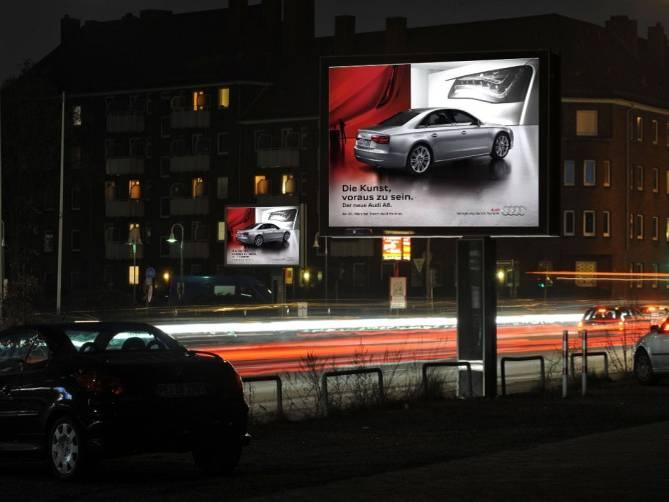


13 Public roads 13 13


14 Public buildings 14 14


15 Public vehicles 15 15


16 Development of the top 200 > 18.9% market growth in 2010 vs (gross) > The top 200 accounts increased their poster share by 0.2 percentage points on average to 3.4% > Contracts on hand for the top 200 are currently well up on the prior year > High growth in the finance and electronics industries 16

17 Growth project Germany: out-of-home channel 17

18 Out-of-home channel: Large moving quick > World s first digital network with national reach > More than 20% weekly reach for the attractive 14 to 49 year-old target group > Booking by time slots 18 18

19 Out-of-home channel: set-up on track Number of installed screens 1, Mar 11 Actual Jul 11 Target Dec 11 Target 19 19

20 Growth project Germany: premium billboard 20
 > Current customers (a selection) > E-Plus > Philip Morris > Volkswagen > Unilever > Shell")
21 Premium quality three times the capacity > 5,000 scrolling displays in the 9m² format to be set up by 2015 > Top locations with high frequency > Individual selection facilitates geo-targeting at the point of interest (POI) > Current customers (a selection) > E-Plus > Philip Morris > Volkswagen > Unilever > Shell 21

22 Premium billboards: set-up on track Number of sites currently available 900-1, Q1 11 Actual Q2 11 Target Q3 11 Target Q4 11 Target 22

23 Vooh! The app for virtual out-of-home media > Applications for mobile devices are the no. 1 trend > Vooh! is Ströer s new app for linking up traditional poster campaigns with attractive online content 1. Start the app 2. Take a picture of the image 3. Select additional content > Exclusive start-up package with telecoms provider E-Plus 23 23


24 International: growth - professionalization - consolidation 24 24

25 Growth market Turkey > One of the leading countries globally in terms of GDP growth in 2010 (up 8%*) > Out-of-home market expected to grow 35% in 2010 according to MagnaGlobal > Organic revenue growth for Ströer Turkey of 36% on the back of utilization, capacity and price increases > Significant expansion of digital business to a 5.8% revenue share with over 70 screens * Source: OECD 25

26 Ströer Turkey s competitive advantages > Introduction of shorter marketing intervals and new pricing systems for blowup and Mega- Lights > Additional capacity, in particular for CLP, billboard and digital products > Efficiency gain from outsourcing postering and maintenance to subcontractors > Preparation for benchmarking of performance by POSTAR, first survey in mid-2011, first results to be presented in H

27 Poland a promising market > Mid-single-digit growth in GDP in 2010 (up 4%*) > 2010 year of transition with stagnating to marginally declining OoH revenues > Professionalization of the out-ofhome market (incl. sales cycles and price mechanisms) is a catalyst for growth 27 * Source: Polish Office of Statistics 27
 > Bus shelter tender in Warsaw (bidding consortium with AMS) > Performance measurement POSTAR, first survey in H2 2011,")
28 Ströer Poland setting the pace > Acquisition of News Outdoor (cost synergies of approx. EUR 2.5m achieved) > Bus shelter tender in Warsaw (bidding consortium with AMS) > Performance measurement POSTAR, first survey in H2 2011, presentation of first results in mid

29 blowup media: leading giant poster business 29 > Number 1 in all markets covered (Germany, the UK, Benelux, Spain) > Organic growth boosted significantly in 2010 (up 31%), especially by the foreign subsidiaries > EBITDA margin up almost twofold in 2010 > Launch of backlit giant posters in major European cities (incl. Munich, Amsterdam and Rotterdam) 29
30 Our strategy guarantees value growth Pure play 360 out-of-home advertising Consolidation Innovation Growth markets > Full range of out-of-home advertising > One-stop shopping > National offerings/ contract portfolio > All out-ofhome touchpoints > European focus > Valueenhancing transactions > State-of-theart product launches > High quality design and functionality > Benefit from below average penetration of out-of-home advertising > Emerging markets Market leadership Organic growth Top results 30


31 Corporate social responsibility > Cooperations and partnerships focusing on > Sport > Diet > Health > Culture > Social issues > Fundraising for emergency relief > Energy-saving technology 31 31

32 Ströer financials
33 Ströer Group Full Year 2010 P&L Summary ( MM) Change(%) Revenue Direct costs SG&A Other operating result Operational EBITDA Margin % Depreciation Amortisation Exceptional items Goodwill impairments 0-4,0 - EBIT >100 Net financial result Income taxes Net Income >100 Net Adjusted Income Margin %
34 Full year Revenues fuelled by Organic Growth and Consolidation Effects Σ + 9.4% Organic Scope/FX Turkey Organic (100%) Turkey FX (100%) > Total full-year organic revenue growth finished above guidance at 9.4% > Ströer TR and blowup represent largest drivers of organic growth in PF (incl. 100% Turkey) > Scope effects down to M&A activity while FX impact stems from TL and PLN appreciation
35 2010 Operational EBITDA performance at record level % Margin 21.3% 24.0% 23.9% reported Op EBITDA 2010 reported Op EBITDA Consolidation Effect SKV 2010 PF incl. 100% Turkey > Ströer Germany and Ströer Turkey strongest contributors > Moderate overhead cost development supported profitability > Operating Leverage increased to approx. 44% 35
36 Ströer outperformed its European Peers on EBITDA margins also in 2010 Operational EBITDA Margin (%) JC Decaux +210BP Clear Channel Outdoor (International) +650BP > Ströer with best in class EBITDA margins and premiums of 210 to 650 BPS over peers > Proven resilience in the 2009 downturn paved the way for industry-leading profitability 36
37 Group Net Adjusted Income improved nearly 2-fold yearon-year MM 55.8 % Margin 6.2% 3.6% 4.0 (35.2) 24.0 (15.4) Net Income Reported 2010 Exceptional Items Amortisation Acquired Contracts Financial Result Exceptionals Tax 31.7% Net Adjusted Income 2010 Net Adjusted Income 2009 > +61MM exceptional non-cash revaluation gain of existing Ströer Turkey stake > IPO related exceptional P&L items amounted to some 18MM > Exceptional charges in financial result mainly due to non-cash valuation effects of hedges 37
38 Ströer Germany - Solid revenue performance with strongly improved EBITDA MM Revenues Organic Growth -1.9% 4.6% 31.4% Operational EBITDA % Margin 34.6% 24.2% 26.7% CAPEX* % % % % Q Q Q Q > High comps in Q4 due to late money but high-single growth momentum in Q > Digital operations account for some 20MM up 20% year-on-year > Effective cost management still benefiting from rigid cost cutting in prior years * w/o Acquisitions 38
39 Ströer Turkey Dynamic environment driving results and investments MM Revenues Organic Growth 31.6% 36.4% 33.3% Operational EBITDA % Margin 44.8% 25.8% 28.9% CAPEX* 47.9% % % % Q Q Q Q > Outstanding headline and organic revenue growth well in excess of 30% > Sales increase fuelled by higher filling ratios across key asset classes > Operating leverage temporarily impacted by rent mix changes and sales bonus pay-out * w/o Acquisitions 39

40 Ströer Rest of Europe* Strong rebound of blowup and enlarged scope in Poland MM Revenues Operational EBITDA CAPEX** Organic Growth % Margin 15.2% 11.2% 11.9% 12.4% 7.7% 7.8% % % % % Q Q Q Q > blowup key driver of revenues (organic growth >30%) and operational EBITDA growth > Giant poster performance strongly pushed by rebound in UK and Spain > Ströer Poland with minor positive organic growth in Q3 and Q4 in challenging environment * blowup Media Group and Ströer Poland ** w/o Acquisitions 40
41 Substantial underlying cash generation MM Cash flow from Operations Cash Flow from Investing* +60% reported / normalized 2010 reported IPO cashout 2010 normalized Free Cash Flow Comments reported reported +95% 73.3 Acquisition CAPEX 27.4 IPO cash out normalized > Cash flow from operations increased by 60% leaving aside IPO exceptionals > Cash flow from investing at moderate level despite initial capex for PBB 5000 & OOHC > Strong FCF generation excluding acquisitions and IPO costs * excluding M&A 41
42 Competitive capital structure put in place post IPO Figures in million Syndicated loan* RCF Subordinated Current loans* accounts + accrued interest Other financial debt Total financial debt Total Net Debt 2010 (YE) > Debt maturity of syndicated loan extended to June 2014 > Some 150 MM of debt repayments leading to pro-forma leverage of 2.4x at the end of 2010 > Interest cover ratio strongly improved from 1.5x in 2009 to 2.3x in 2010** Cash Total Net Debt 2009 (YE) * Amounts shown at book value in line with IFRS accounts ** Interest cover equals ratio of net interest paid to adjusted EBIT 42
43 Ströer s capital base leads to ROCE outperformance ROCE* (%) Ströer JC Decaux Lamar Clear Channel Outdoor > Ströer only operator in outdoor space with double-digit ROCE in 2010* > 2010 average capital employed of 680MM with Operational EBIT of 73MM > Best-in-class efficiency in capital deployment * ROCE defined as Operational EBIT of the financial year divided by the average invested capital (total assets less current liabilities adjusted for short-term portions of debt) net of cash in the respective financial year 43


44 Outlook Ströer s management is confident that the Group will benefit from a favourable macroeconomic situation, new projects and structural growth in the full fiscal year Hence, we expect to see another year of solid organic revenue growth around the mid to high-singledigit mark along with a possible slight improvement in margins. In the first quarter of 2011, we expect organic revenue growth of 8% for the Group fuelled by the strong performance of the German and blowup operations. The Turkish business will also contribute to this organic growth at a rate broadly in line with the group figure, while the market dynamics in Poland are proving more challenging than expected. In the second quarter we expect to see a continuation of the Group s positive revenue development and forecast a mid to highsingle-digit organic growth rate. Management will further quantify the Q2 organic growth targets when the Q1 results are published on 19 May. Due to ramp-up and overhead investment effects mainly during the first six months of 2011 management currently expects only a slight increase in operational margin for the full year 2011 compared to the high reference value of


45 Q&A Session with Ströer AG s Executive Board Udo Müller Co-Founder, CEO Alfried Bührdel CFO and Executive Vice President Dirk Wiedenmann CEO of Ströer Media Deutschland, Board Member 45
46 Disclaimer This presentation contains forward looking statements regarding Ströer Out-of-Home Media AG ( Ströer ) or Ströer Group, including opinions, estimates and projections regarding Ströer s or Ströer Group s financial position, business strategy, plans and objectives of management and future operations. Such forward looking statements involve known and unknown risks, uncertainties and other important factors that could cause the actual results, performance or achievements of Ströer or Ströer Group to be materially different from future results, performance or achievements expressed or implied by such forward looking statements. These forward looking statements speak only as of the date of this presentation and are based on numerous assumptions which may or may not prove to be correct. No representation or warranty, express or implied, is made by Ströer with respect to the fairness, completeness, correctness, reasonableness or accuracy of any information and opinions contained herein. The information in this presentation is subject to change without notice, it may be incomplete or condensed, and it may not contain all material information concerning Ströer or Ströer Group. Ströer undertakes no obligation to publicly update or revise any forward looking statements or other information stated herein, whether as a result of new information, future events or otherwise. 46
FY 2011: Building the future of outdoor Ströer Out-of-Home Media AG Investor Presentation Roadshow Zurich, 17 th April 2012
 1 FY : Building the future of outdoor Ströer Out-of-Home Media AG Investor Presentation Roadshow Zurich, 17 th April 2012 Ströer highlights Solid increase of revenue (+8.6%) and Operational EBITDA (+3.9%)
Results Presentation 2012 Lippert/Heilshorn & Associates Roadshow Ströer Media AG 9-11 April 2013, Boston / New York
 1 Results Presentation 2012 Lippert/Heilshorn & Associates Roadshow Ströer Media AG 9-11 April 2013, Boston / New York Ströer group developments in 2012 FY organic revenue growth (-4.0%) and operational
Ströer Out-of-Home Media AG Company Presentation Commerzbank AG Roadshow 21 st November 2012, Frankfurt
 1 Ströer Out-of-Home Media AG Company Presentation Commerzbank AG Roadshow 21 st November 2012, Frankfurt Ströer developments in Q3 2012 Group organic revenue growth rate at -5.4% Sales increase in German
Ströer increases revenue and earnings significantly in the first six months following the acquisition of T-Online
 PRESS RELEASE Ströer increases revenue and earnings significantly in the first six months following the acquisition of T-Online Ströer reports organic growth of 8.7% T-Online acquisition pushes H1 revenue
Ströer AG: Positive business performance in the fourth quarter after a challenging year overall
 PRESS RELEASE Ströer AG: Positive business performance in the fourth quarter after a challenging year overall Q4 revenues and operational EBITDA up on last year Consolidated revenue down 2.9% in 2012 to
Ströer Media AG: Positive business performance in the first quarter
 PRESS RELEASE Ströer Media AG: Positive business performance in the first quarter Consolidated revenue up 5.8% to EUR 125.5m 5.9% organic growth Operational EBITDA increases by 45.6% to EUR 13.5m Clear
Ströer continues on a successful course in the third quarter and expects more profitable growth in 2018
 PRESS RELEASE Ströer continues on a successful course in the third quarter and expects more profitable growth in 2018 Ströer anticipating consolidated revenue of EUR 1.5b and operational EBITDA of EUR
Ströer Media SE posts record-high earnings in fiscal year 2014
 PRESS RELEASE Ströer Media SE posts record-high earnings in fiscal year 2014 Revenue for the year climbs to EUR 721.1m Operational EBITDA rises to EUR 148.1m in 2014, up 25% on the prior year Adjusted
Company Presentation. March 2018 Ströer SE & Co. KGaA
 Company Presentation March 2018 Ströer SE & Co. KGaA INDEX 01 02 03 04 Company Overview Financials and Strategy Guidance 2018 Financial Calendar 2 Ströer At a Glance 2018 Multichannel Media Sales House
Quarterly financial report 9M/Q3 2011
 Quarterly financial report 9M/Q3 2011 The Group s financial figures at a glance 1 Foreword by the board of management 2 Share 4 Interim group management report 6 The Group and the reporting period 6 Results
Q4/FY 2014 RESULTS PRESENTATION. 25 th March 2015 Ströer Media SE
 Q4/FY 2014 RESULTS PRESENTATION 25 th March 2015 Ströer Media SE Agenda Q4/FY 2014 1 Key developments - Udo Müller, CEO 2 Operational highlights - Christian Schmalzl, COO 3 Financials - Dr. Bernd Metzner,
Company Presentation. October 2018 Ströer SE & Co. KGaA
 Company Presentation October 2018 Ströer SE & Co. KGaA INDEX Q2 2018 01 02 03 04 05 Overview Challenges Segment Update Financial Update Appendix 2 The most customer-centric, multi-channel media company
Preliminary Figures FY February 2017 Ströer SE & Co. KGaA
 Preliminary Figures FY 2016 22 February 2017 Ströer SE & Co. KGaA Preliminary Results FY 2016 EURm FY 2016 Q4 2016 Revenues Reported (1) 1,123.3 +36% 357.6 +32% Organic (2) +7.2% +6.9% Operational EBITDA
Half-year financial report 2011
 Half-year financial report 2011 The Group s financial figures at a glance 1 Foreword by the board of management 2 Share 4 Interim group management report 7 The Group and the reporting period 7 Results
The Group s financial figures at a glance 3 Foreword by the board of management 4 Share 5 Interim group management report
 Ströer Media AG 2 CONTENTS The Group s financial figures at a glance 3 Foreword by the board of management 4 Share 5 Interim group management report Group structure and reporting period 8 Business environment
Adjusted revenue up +1.5% to 1,641.4 million. Adjusted organic revenue up +0.4%, with an accelerating Q2 at +1.5%
 H1 2017 Results Adjusted revenue up +1.5% to 1,641.4 million Adjusted organic revenue up +0.4%, with an accelerating Q2 at +1.5% Adjusted operating margin of 255.0 million, down -3.6% Adjusted EBIT, before
Strong H1 2018: Ströer sustainably increases revenue and earnings
 PRESS RELEASE Strong H1 2018: Ströer sustainably increases revenue and earnings Consolidated revenue in H1 up a substantial 24% from EUR 597m to EUR 742m Organic growth at 7.8% for the first six months
Q th May 2017 Ströer SE & Co. KGaA
 Q1 2017 11th May 2017 Ströer SE & Co. KGaA Results Q1 2017 EURm Q1 2017 Q1 2016 Revenues Reported (1) 281.2 226.2 +24% Organic (2) 8.8% 11.5% -2.6%pts Operational EBITDA 55.6 46.2 +20% Operational EBITDA
Quarterly Financial Report Q STRÖER MEDIA AG
 Quarterly Financial Report Q1 2014 STRÖER MEDIA AG Ströer Media AG 2 CONTENTS The Group s financial figures at a glance 3 Foreword by the board of management 4 Share 5 Interim group management report Background
FIRST-HALF 2017 RESULTS. 27 July 2017
 FIRST-HALF 2017 RESULTS 27 July 2017 Disclaimer FORWARD LOOKING STATEMENTS This presentation contains certain statements that constitute "forward-looking statements", including but not limited to statements
OSRAM holding its ground in a difficult market environment
 www.osram.com OSRAM holding its ground in a difficult market environment Q3 FY18 Earnings Release (unaudited figures) August 1, 2018 Light is OSRAM Disclaimer This presentation may contain forward-looking
Altice USA Q4 and Full-Year 2018 Results. February 21, 2019
 Altice USA Q4 and Full-Year 2018 Results February 21, 2019 Disclaimer FORWARD-LOOKING STATEMENTS Certain statements in this presentation constitute forward-looking statements within the meaning of the
Ströer SE & Co. KGaA Preliminary Figures FY 2017 Roadshow Hauck & Aufhäuser, London. February 23, 2018 Ströer SE & Co. KGaA
 Ströer SE & Co. KGaA Preliminary Figures FY 2017 Roadshow Hauck & Aufhäuser, London February 23, 2018 Ströer SE & Co. KGaA INDEX 01 02 03 04 2017 Results & Strategic Update Segment Performance & Operational
KION Q3 UPDATE CALL Gordon Riske, CEO Thomas Toepfer, CFO Wiesbaden, 14 November 2013
 KION Q3 UPDATE CALL 2013 Gordon Riske, CEO Thomas Toepfer, CFO Wiesbaden, 14 November 2013 AGENDA 1 Highlights 2013 Gordon Riske 2 Financial Update Thomas Toepfer 3 Outlook Gordon Riske 14 November 2013
Interim Report Q2 FY 18
 Interim Report Q2 FY 18 Quarter 2 / Fiscal Year 2018 Strong revenue growth driven by Signia Nx Sivantos delivered a strong organic growth 1) of 9.8% in Q2 2018 while nominal growth at 3.6% accounted negative
I N V E S T OR P R E S E NTATION. May 2014
 I N V E S T OR P R E S E NTATION May 2014 Disclaimer Forward-looking Statements This presentation contains forward-looking statements, including our financial guidance for 2014, the statements regarding
H1 16 interim results. 22 September 2015
 H1 16 interim results 22 September 2015 Important notice 2 This presentation may include certain forward-looking statements, beliefs or opinions, including statements with respect to the Company s business,
Interim Report Q1 FY 18
 Interim Report Q1 FY 18 Quarter 1 / Fiscal Year 2018 Continued positive development extends into the new fiscal year Sivantos delivered 3.5% organic growth 1) in Q1 2018 with negative Fx translation effects
Annual Results GfK SE Analyst Call. March 18, GfK 2016 Analyst call March 18, 2016
 Annual Results 2015 GfK SE Analyst Call March 18, 2016 1 2015 Growth and further development Matthias Hartmann CEO GfK SE March 2016 2 Overview What did we achieve in 2015? Results Back to growth Missed
Capital Markets Day ProSiebenSat.1 Media AG. Financials. Axel Salzmann, October 5, 2011
 Capital Markets Day ProSiebenSat.1 Media AG Financials Axel Salzmann, October 5, 211 P7S1 has transformed its financial profile 1 We achieved a significant cost reduction and margin uplift 2 We optimized
Ströer Media SE 1. Quarterly financial report Q Quarterly financial report Q STRÖER MEDIA SE
 Ströer Media SE 1 Quarterly financial report Q1 2015 STRÖER MEDIA SE Ströer Media SE 2 CONTENTS The Group s financial figures at a glance 3 Foreword by the board of management 4 Share 5 Interim group management
HUGO BOSS First Nine Months Results 2011
 HUGO BOSS First Nine Months Results 2011 Mark Langer (CFO) November 2, 2011 Conference Call, First Nine Months Results 2011 HUGO BOSS November 2, 2011 2 / 30 AGENDA OPERATIONAL HIGHLIGHTS FIRST NINE MONTHS
BRD - GROUP R E S U LT S 3 R D Q U AR T E R AN D F I R S T 9 M O N T H S N O V E M B E R
 BRD - GROUP R E S U LT S 3 R D Q U AR T E R AN D F I R S T 9 M O N T H S 2 0 1 7 0 6 N O V E M B E R 2 0 1 7 DISCLAIMER The consolidated and separate financial position and income statement for the period
HELLA Investor Update Q1 2015/16
 HELLA Investor Update Q1 2015/16 Conference Call on September 25th, 2015 Dr. Wolfgang Ollig, Chief Financial Officer Carl Pohlschmidt, Finance Director HF-7761DE_C (2012-12) Disclaimer This document was
Ströer SE & Co. KGaA. Salesforce Briefing October 2016
 Ströer SE & Co. KGaA Salesforce Briefing October 2016 STRÖER #1 in OOH & DIGITAL Ströer: Focus on highest growing Ad Sub Segments Video ca. +20% Display/Mobile ca. 6% OoH ca. +6% Radio / TV Magazines Newspaper
25 October Q Revenues. Gilles Petit, CEO Arnaud Louet, CFO
 Q3 2016 Revenues Gilles Petit, CEO Arnaud Louet, CFO Q3 2016 Revenues FORWARD LOOKING STATEMENTS This presentation contains certain statements that constitute "forward-looking statements", including but
FIRST-HALF 2018 RESULTS 30 JULY 2018
 FIRST-HALF 2018 RESULTS 30 JULY 2018 Disclaimer FORWARD LOOKING STATEMENTS This presentation contains certain statements that constitute "forward-looking statements", including but not limited to statements
The power of television
 The power of television November 3, 2016 Q3 2016 Press Presentation October 13, 2016 The power of television November 3, 2016 Q3 2016 At a Glance Thomas Ebeling Chief Executive Officer Press Presentation
January March 2010 Conference Call. Georg Denoke Member of the Executive Board & CFO 4 May 2010
 January March 2010 Conference Call Georg Denoke Member of the Executive Board & CFO 4 May 2010 Disclaimer This presentation contains forward-looking statements about Linde AG ( Linde ) and their respective
Interim Report Q4 FY 17
 Interim Report Q4 FY 17 Quarter 4 / Fiscal Year 2017 Sustained positive development Sivantos delivered 3.1% organic growth 1) in Q4 FY2017. The moderate growth rate compared to previous quarters was a
t e c h n i c o l o r. c o m
 2017 t e c h n i c o l o r. c o m Forward looking statements THIS PRESENTATION contains certain statements that constitute "forward-looking statements", including but not limited to statements that are
Letter to Shareholders
 Letter to Shareholders www.apgsga.ch APG SGA SA Letter to shareholders July 28, 2017 3 Strong operational performance and slight increase in net result. Slight downturn in revenues caused by reduced advertising
DEUTSCHE TELEKOM Q4/12 RESULTS
 DEUTSCHE TELEKOM RESULTS DISCLAIMER This presentation contains forward-looking statements that reflect the current views of Deutsche Telekom management with respect to future events. These forwardlooking
Philips Lighting reports 0.5% full year comparable sales growth, 10% operational profitability and EUR 403 million free cash flow
 Philips Lighting reports 0.5% full year comparable sales growth, 10% operational profitability and EUR 403 million free cash flow Q4 & Full Year 2017 presentation February 2, 2018 Important information
DEUTSCHE TELEKOM Q2/14 Results
 DEUTSCHE TELEKOM Results DISCLAIMER This presentation contains forward-looking statements that reflect the current views of Deutsche Telekom management with respect to future events. These forwardlooking
The Analyst Conference will take place in London, on November 13, at 4.30 p.m. CET, and will be webcast on
 Siemens Q4 FY08 IR FLASHLIGHT The Analyst Conference will take place in London, on November 13, at 4.30 p.m. CET, and will be webcast on www.siemens.com/investorrelations The Annual Press Conference will
MAISONS DU MONDE: FIRST-HALF 2018 RESULTS
 PRESS RELEASE MAISONS DU MONDE: FIRST-HALF 2018 RESULTS A solid first half in a challenging environment Updated full-year 2018 targets Sales up 11% to 507m including Modani, and up 9.8% at constant scope
Vita Group (VTG)! Results Presentation!
! Results Presentation!") Vita Group (VTG) Results Presentation First half FY14 Group highlights Sustained trend of strong profit, dividend growth Underlying EBITDA 1 +18%, underlying NPAT 2 +56%, dividend +66% Areas of strategic
Vita Group (VTG) Results Presentation First half FY14 Group highlights Sustained trend of strong profit, dividend growth Underlying EBITDA 1 +18%, underlying NPAT 2 +56%, dividend +66% Areas of strategic
HELLA Investor Update H1 FY 2016/17
 HELLA Investor Update 2016/17 Conference Call on January 12th, 2017 Dr. Rolf Breidenbach, CEO Bernard Schäferbarthold, CFO HF-7761DE_C (2012-12) Disclaimer This document was prepared with reasonable care.
Financial Division Research, Strategic Planning and Investor Relations May Portugal. Q1'18 Earnings Presentation
 Financial Division Research, Strategic Planning and Investor Relations May 2018 Portugal Q1'18 Earnings Presentation Disclaimer Santander Totta SGPS, S.A. ( Santander Totta ) cautions that this presentation
Bertelsmann Annual Results 2016
 Bertelsmann Annual Results Investor Conference Call March 28, 2017 Bernd Hirsch Member of the Executive Board and CFO of Bertelsmann Summary and highlights Financial year Strong operating performance in
Full Year 2008 Earnings
 Full Year 2008 Earnings Olivier Piou, CEO Jacques Tierny, CFO March 19, 2009 www.gemalto.com Disclaimer Forward-Looking Statements This communication contains certain statements that are neither reported
H1/2018 Results Investor/Analyst Conference Call Berlin, July 27, Dr Mathias Döpfner, Chairman & CEO Dr Julian Deutz, CFO
 H1/2018 Results Investor/Analyst Conference Call Berlin, Dr Mathias Döpfner, Chairman & CEO Dr Julian Deutz, CFO Disclaimer This document, which has been issued by Axel Springer SE (the "Company"), comprises
Zur Rose Group 2017 Results Analyst & Media Conference
 Zur Rose Group 2017 Results Analyst & Media Conference Walter Oberhänsli Marcel Ziwica 21 March 2018 Highlights and Lowlights Zur Rose Group Conference call 23 August 2017 3 Highlights and Lowlights Successful
HELLA Investor Update FY 2016/17
 HELLA Investor Update FY 2016/17 Conference Call on August 10th, 2017 Dr. Rolf Breidenbach, CEO Bernard Schäferbarthold, CFO HF-7761DE_C (2012-12) Disclaimer This document was prepared with reasonable
Full-Year 2017 Results
 Full-Year 2017 Results Adjusted revenue up +2.3% to 3,471.9 million, adjusted organic revenue up +3.2% Adjusted operating margin of 653.5 million, up +1.1% Adjusted EBIT, before impairment charge, of 358.1
Atalian Servest Q results. November 29, 2018
 Atalian Servest Q3 2018 results November 29, 2018 Disclaimer Certain statements in this presentation are forward-looking. All statements other than statements of historical facts included in this presentation,
Q Earnings Presentation. Rainer Beaujean, Speaker of the Management Board and CFO April 12, 2018
 Q1 2018 Earnings Presentation Rainer Beaujean, Speaker of the Management Board and CFO April 12, 2018 Disclaimer This presentation may contain certain forward-looking statements, including assumptions,
MAISONS DU MONDE: FULL-YEAR 2018 RESULTS
 PRESS RELEASE MAISONS DU MONDE: FULL-YEAR 2018 RESULTS Strong performance in line with targets Continued solid momentum in online and international sales Focus on strategic pillars to deliver further profitable
Full Year Results 2014
 Legal disclaimer Information in this presentation may involve guidance, expectations, beliefs, plans, intentions or strategies regarding the future. These forward-looking statements involve risks and uncertainties.
July 26, 2017 LafargeHolcim Ltd 2015
 Second Quarter 2017 Results Beat Hess, Chairman and Interim CEO Roland Köhler, Interim COO and Regional Head of Europe, Australia/NZ & Trading Ron Wirahadiraksa, CFO July 26, 2017 LafargeHolcim Ltd 2015
Financial results & business update. Quarter and year ended 31 December February 2016
 Financial results & business update Quarter and year ended 31 December 2015 11 February 2016 Disclaimer 3 Any remarks that we may make about future expectations, plans and prospects for the company constitute
VGi GLOBAL MEDIA PLC MEDIA INDUSTRY AND BUSINESS IMPACT ANALYSIS IMPORTANT EVENTS IN 1Q 2017/18 MANAGEMENT DISCUSSION & ANALYSIS 1Q 2017/18 2 AUG 2017
 MEDIA INDUSTRY AND BUSINESS IMPACT ANALYSIS Advertising spending declined by.3% YoY to 26,85mn in Q 207/8. The TV sector with the highest market share at 66.3% fell 3.7% YoY to THB 7,359mn and Traditional
Investor Meeting Presentation
 Investor Meeting Presentation November 2014 Investor Meeting Presentation HUGO BOSS November 2014 2 / 54 Agenda Update on Key Strategic Initiatives Nine Months Results 2014 Outlook Investor Meeting Presentation
Q Results presentation
 Q1 2016 Results presentation 12 May 2016 1 Disclaimer This presentation (the "Presentation") has been prepared and is issued by, and is the sole responsibility of Telepizza Group, S.A. ( Telepizza" or
> Financing costs sharply down by 38.6% or MEUR 10.3 to MEUR due to successful refinancing measures undertaken in FY 2017
 Q1 - HIGHLIGHTS PORTFOLIO EFFICIENCY ON VERY ROBUST LEVEL COST SAVINGS AND IMPROVED KPIs > Occupancy rate stable at record level of 94.2% > Adjusted rental income (like-for-like) rose 3.7% > Overall rental
Full-Year 2016 Results
 7 Full-Year 2016 Results This version published on March 24 th, 2017 solves a printing problem on page 8 of the version dated March 2 nd, 2017 and put online at this date Adjusted revenue up +5.8% to 3,392.8
A leading European learning and media company
 A leading European learning and media company Markus Holm, CFO & COO SEB Nordic Seminar 2019 SANOMA AS AN INVESTMENT: A leading European learning and media company Growing dividends Strong and balanced
DNA Plc Financial Statements Bulletin 2018
 DNA Plc Financial Statements Bulletin 2018 Analyst presentation, 6 February 2019, London Jukka Leinonen Timo Karppinen Marja Mäkinen CEO CFO Head of IR 1 Forward looking statement This presentation contains,
Ströer Out-of-Home Media AG Half-year financial report 2010
 Ströer Out-of-Home Media AG Half-year financial report 2010 STRÖER OUT-OF-HOME MEDIA AG PAGE 2 Financial figures The Group s financial figures at a glance In EUR m Q2 Q2 Change H1 H1 Change 2010 2009 2010
NLSN 4Q and FY 2011 Investor Presentation
 NLSN 4Q and FY 2011 Investor Presentation Forward Looking Statements The following discussion contains forward-looking statements, including those about Nielsen s outlook and prospects, in the meaning
Fourth Quarter Earnings Presentation. March 29, 2016
 Fourth Quarter Earnings Presentation March 29, 2016 Safe Harbor Agreement This presentation contains forward looking statements within the meaning of the Private Securities Litigation Reform Act of 1995
Makes it easier to be professional
 Makes it easier to be professional Handelsbanken Nordic Mid/small Cap Seminar June 8, 2017 President and CEO Johan Nilsson 2 2 Introduction One-Stop-Shop multi channel offering for professionals Branches
3Q 2018 Fornebu, October 24, 2018 Luis Araujo and Svein Stoknes
 3Q 2018 Fornebu, October 24, 2018 Luis Araujo and Svein Stoknes Agenda 3Q 2018 Answers Questions Introduction Luis Araujo Chief Executive Officer Financials Svein Stoknes Chief Financial Officer Q&A Session
H Financial Results
 H1 2016 Financial Results Gilles Petit, CEO Arnaud Louet, CFO H1 2016 Financial Results FORWARD LOOKING STATEMENTS This presentation does not constitute an offer to sell securities in the United States
Third Quarter 2017 Results Jan Jenisch, CEO Ron Wirahadiraksa, CFO. October 27, 2017 LafargeHolcim Ltd 2015
 Third Quarter 2017 Results Jan Jenisch, CEO Ron Wirahadiraksa, CFO October 27, 2017 LafargeHolcim Ltd 2015 01 Initial views Q3 2017 and Outlook Jan Jenisch, Chief Executive Officer 2017 LafargeHolcim 2
CEVA Logistics AG Investor Call Second Quarter/First Half July CEVA Logistics AG Q2 2018
 CEVA Logistics AG Investor Call Second Quarter/First Half 2018 27 July 2018 1 Highlights Q2 Revenue up 5.1% year on year in constant currency Good Ocean volumes, Air picking up after softer Q1 CL growth
RECORD RESULTS FOR 2004 REFLECT STRONG ORGANIC GROWTH SOLID GROWTH ANTICIPATED IN 2005
 RECORD RESULTS FOR 2004 REFLECT STRONG ORGANIC GROWTH SOLID GROWTH ANTICIPATED IN 2005 Revenues up 5.7% to 1,631.4 million, organic revenues up 6.2% EBITDA rises 11.6% to 465.2 million Operating income
VGi GLOBAL MEDIA PLC.
 MEDIA INDUSTRY AND BUSINESS IMPACT ANALYSIS 1Q 14/15 VS 1Q 15/16 THAI ADVERTISING SPENDING (THB MN) MEDIA INDUSTRY MARKET SHARE (1Q 14/15 VS 1Q 15/16) Industry TV Newspapers Radio Cinema Magazines Transit
home24 FY 2018/Q4 Trading Update 13 February 2019
 home24 FY 208/Q4 Trading Update 3 February 209 0 Our mission: to be the online destination for Home & Living Huge and uniquely attractive Home & Living market opportunity of EUR 7 billion Markets characterized
Q1 FY14 Management Presentation
 www.osram-licht.ag FY14 Management Presentation (preliminary figures) Solid start into FY14 OSRAM Licht AG January 29, 2014 Safe Harbor Statement This presentation may contain forward-looking statements
HELLA Investor Update H1 FY 2018/19
 HELLA Investor Update 2018/19 Conference Call on January 11, 2019 Dr. Rolf Breidenbach, CEO Bernard Schäferbarthold, CFO HF-7761DE_C (2012-12) Disclaimer This document was prepared with reasonable care.
Merck FY/Q Financial Summary for Investors and Analysts
 Merck FY/Q4 2018 Financial Summary for Investors and Analysts A year of investments and delivery on Guidance Healthcare Solid organic growth of 5.2% driven by resilient core business with 3% organic growth
Sanoma acquires Iddink, a leading Dutch educational platform and service provider
 Sanoma acquires Iddink, a leading Dutch educational platform and service provider News conference, 12 December 2018 Susan Duinhoven, President & CEO Markus Holm, CFO & COO Iddink provides Sanoma Learning
Bilfinger Berger: Entering new growth phase
 Bilfinger Berger: Entering new growth phase Roadshow London, Roland Koch, CEO Andreas Müller, Head of Corporate Accounting and Investor Relations Agenda 1. Bilfinger Berger Overview 2. Preliminary figures
2018 Second Quarter August 8, 2018
 2018 Second Quarter August 8, 2018 Safe Harbor Disclaimer Cautionary Statement Regarding Forward-Looking Statements We have made statements in this document that are forward-looking statements within the
January June 2010 Conference Call. Georg Denoke Member of the Executive Board & CFO 2 August 2010
 January June 2010 Conference Call Georg Denoke Member of the Executive Board & CFO 2 August 2010 Disclaimer This presentation contains forward-looking statements about Linde AG ( Linde ) and their respective
Scout24 AG FY 2016 Results Conference Call
 www.scout24.com Scout24 AG FY 2016 Results Conference Call March 29, 2017 Disclaimer This document has been issued by Scout24 AG (the Company and, together with its direct and indirect subsidiaries, the
Executing Our TAP Agenda
 Executing Our TAP Agenda Joe Kaeser, CFO 2008 EPG Conference Longboat Key, Florida May 20, 2008 Safe Harbour Statement This document contains forward-looking statements and information that is, statements
HY 2017 Results. Strong growth and cash generation. July 31, 2017
 HY 2017 Results Strong growth and cash generation July 31, 2017 Legal Disclaimer Information in this presentation may involve guidance, expectations, beliefs, plans, intentions or strategies regarding
FY 2019 First Quarter Earnings Call
 FY 2019 First Quarter Earnings Call February 7, 2019 Improving the experience of a world in motion Important information Adient has made statements in this document that are forward-looking and, therefore,
9M 2017 Results. Ongoing strong growth and acceleration of cash flow generation. October 31, 2017
 9M 2017 Results Ongoing strong growth and acceleration of cash flow generation October 31, 2017 Legal Disclaimer Information in this presentation may involve guidance, expectations, beliefs, plans, intentions
Full-year results Cologne, 10 March Entertain. Inform. Engage.
 Full-year results 2015 Cologne, 10 March 2016 Entertain. Inform. Engage. Agenda 1 2 3 4 2016 Full-year 2015 highlights Group financials Business update Strategy & Outlook 2016 2 Highlights 2015 in a nutshell
Full Year 2018 Results. 27 February 2019
 Full Year 2018 Results 27 February 2019 1. Key Highlights and Financial Summary Strong financial performance across all segments and progress made on all aspects of the strategic framework Financial Highlights
Q presentation. 19 November 2015
 Q3 2015 presentation 19 November 2015 1 Today s presenters Axel Hjärne Chief Executive Officer Gert Sköld Chief Financial Officer 2 Eltel in brief Q3 2015 business performance Q3 2015 financials Market
Strong order growth highlights successful first quarter
 Strong order growth highlights successful first quarter Joe Kaeser, President and CEO Ralf P. Thomas, CFO Unrestricted Siemens AG siemens.com Notes and forward looking statements This presentation has
January - September 2015 Results
 January - September 2015 Results 23 rd October 2015 Disclaimer The information and forward-looking statements contained in this presentation have not been verified by an independent entity and the accuracy,
FY 2011 Results. February 28th, 2012
 FY 2011 Results February 28th, 2012 Disclaimer In addition to figures prepared in accordance with IFRS, PRISA presents non-gaap financial performance measures, e.g., EBITDA, EBITDA margin, adjusted EBITDA,
Q Conference Call Note
 CREATING TOMORROW`S SOLUTIONS Dr. Rudolf Staudigl (CEO), Dr. Tobias Ohler (CFO) April 27th, 2017 0 Disclaimer The information contained in this presentation is for background purposes only and is subject
M. M. Warburg & CO Warburg Highlights Hamburg, June 6, Lothar Lanz, CFO & COO Daniel Fard-Yazdani, Co-Head of IR
 M. M. Warburg & CO Warburg Highlights Hamburg, June 6, 2013 Lothar Lanz, CFO & COO Daniel Fard-Yazdani, Co-Head of IR Disclaimer This document, which has been issued by Axel Springer Aktiengesellschaft