Investor Presentation May 2015
|
|
|
- Carmella Bruce
- 5 years ago
- Views:
Transcription

1 Disciplined Growth Investor Presentation May 2015
2 Safe Harbor Statement This presentation contains unaudited financial information and forward-looking statements. Statements that are not historical are forward-looking statements and may contain words such as may, will, believe, expect, anticipate, intend, plan, project, estimate, and objective or similar terminology, concerning the company s future financial performance, business strategy, plans, goals and objectives. These expressions are intended to identify forward-looking statements within the meaning of the Private Securities Litigation Reform Act of Forward-looking statements include information concerning the Company s possible or assumed future performance or results of operations and are not guarantees. While these statements are based on assumptions and judgments that management has made in light of industry experience as well as perceptions of historical trends, current conditions, expected future developments and other factors believed to be appropriate under the circumstances, they are subject to risks, uncertainties and other factors that may cause the Company s actual results, performance or achievements to be materially different. Such risks and uncertainties include, but are not limited to, economic conditions, product and price competition, supplier and raw material prices, foreign currency exchange rate changes, interest rate changes, increased legal expenses and litigation results, legal and regulatory developments and other risks and uncertainties described under Item 1A, Risk Factors, in the Company s Annual Report on Form 10-K and in other filings with the Securities and Exchange Commission. Such forward-looking statements are made as of the date hereof and we undertake no obligation to update these forward-looking statements regardless of new developments or otherwise. This presentation also contains certain measures that are not in accordance with U.S. generally accepted accounting principles ( GAAP ). The non-gaap financial information presented herein should be considered supplemental to, and not a substitute for, or superior to, financial measures calculated in accordance with GAAP. The Company has provided this supplemental information to investors, analysts, and other interested parties to enable them to perform additional analyses of operating results, to illustrate the results of operations giving effect to the non-gaap adjustments shown in the reconciliations, and to provide an additional measure of performance which management considers in operating the business. A reconciliation of these items to the most comparable GAAP measures is provided in our filings with the SEC and in the Appendix to this presentation. 2
3 Agenda Management Company at a glance Investment case Performance trends Segments and products Growth strategy Corporate focus, goals and initiatives Financial results and outlook 3


4 Experienced Management Team Dennis Martin, President and Chief Executive Officer President and Chief Executive Officer since October 2010 Previously served as Chairman, President and CEO of General Binding Corporation 35+ years operational and leadership experience, primarily at Illinois Tool Works and Ingersoll-Rand Jennifer Sherman, Chief Operating Officer Appointed Chief Operating Officer April 29, 2014 Previously Chief Administrative Officer, Secretary and General Counsel, with operating responsibilities for the Company s Safety and Security Systems Group Joined Federal Signal in 1994 as Corporate Counsel Brian Cooper, Chief Financial Officer Appointed Chief Financial Officer May 28, 2013 Chief Financial Officer of Westell Technologies, Inc. from Previously with Fellowes, Inc. (CFO), United Stationers, Borg-Warner Security and Amoco Strong treasury, financial, M&A and strategic background 4
5 Federal Signal Overview Company Overview Q1 TTM 2015 Net Sales by Segment, $ Millions Founded in 1901, joined NYSE in 1969 ( FSS ) Safety, security and environmental products and services that protect people and our planet Fire Rescue Group 15% $140 (As of (3/31/15) Environmental Solutions Group (ESG) Safety & Security Systems Group (SSG) Fire Rescue Group (FRG) Restructured for growth and profitability $940 million TTM revenue, $105 million TTM operating income Safety & Security Systems Group 26% $244 $556 Environmental Solutions Group 59% $946 million market capitalization (5/6/15) Net debt of $30 million (3/31/15) Increasing global presence and customer base Leading brands serving municipal, governmental, industrial and commercial markets Diversified manufacturing, 12 facilities in 6 countries Over 3,000 customers in more than 100 countries Employees: 2,700 worldwide Valuable Brands 5
6 Investment Case Leading positions in niche governmental and industrial markets Valuable brands, high quality products, well-established distribution Flexible manufacturing capacity to leverage profits Favorable market dynamics Improving municipal spend and top North American dealer network Growing higher-margin industrial markets Security solutions addressing man-made and natural disasters Solid execution, results and outlook Company culture steadfastly focused on 80/20 and continuous improvement Management depth in sales, marketing, engineering and operations Organic and inorganic opportunities to grow shareholder value Strong balance sheet, profitability and free cash flow 6
7 Performance Levers and Progress 2010: Introduced 80/20 and continuous improvement focus Prioritized customers and suppliers Tackled proactive pricing improvements Streamlined product offerings Streamlined management structure Drove lean manufacturing efficiencies 2012: Major repositioning with sale of FSTech 2013: Debt refinancing to reduce interest costs : Investments to promote growth and innovation Additional space and engineering resources at Jetstream Paint and cutting systems and new production lines at Vactor New plant layouts and other lean improvements at Bronto and Elgin Innovations and product development initiatives Significant turnaround in financial performance 7
8 Key Financial Trends Business Segment Improving Operating Margins FY 2012 Operating Margin FY 2013 Operating Margin Solid Growth FY2014 Operating Margin Q1 TTM 2015 Operating Margin ESG 9.8% 12.3% 15.3% 16.3% SSG 12.0% 11.3% 13.2% 14.1% FRG 6.6% 6.5% 2.8% 3.6% Operating margin excludes the impact of restructuring charges in all periods Operating Margin Total FSC Continuing Operations 12.0% 10.0% 8.0% 6.0% 4.0% 2.0% 0.0% Targeting 12% Company Margin 4.8% 6.6% 8.4% 10.1% Declining Debt and Leverage 11.2% Q1 TTM 2015 Net Sales, $ in millions Total Debt/Adjusted EBITDA Q1 TTM Q1 TTM


 Victor mining and electrical safety equipment Bronto Skylift high-reach aerial lift access platforms for")

9 Federal Signal Segments Environmental Solutions (ESG) Safety and Security Systems (SSG) Fire Rescue (FRG) Products Elgin street sweepers Vactor truck-mounted sewer cleaners, hydro-excavators, and industrial vacuum trucks Jetstream waterblasters FS Depot and FS Solutions parts and service deliveries and rental centers Vehicle lights and sirens (U.S. and Vama) Indoor and outdoor mass warning and notification systems (Industrial Systems and Alerting & Notification Systems) Victor mining and electrical safety equipment Bronto Skylift high-reach aerial lift access platforms for fire rescue and wind turbine maintenance, utilities and other industrial applications Representative Market Share Q1 TTM 2015 Revenue 30-50% U.S. Range, avg. 30% U.S. 50% Globally $556M (59% of sales) $244M (26% of sales) $140M (15% of sales) Non-US 20% Non-U.S. 18% U.S. 13% Geographic Mix U.S. 59% Non-U.S. 41% U.S. 82% Non-U.S. 87% 9


10 Environmental Solutions Group 10


11 Safety and Security Systems Group 11


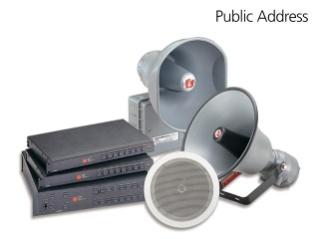


12 Safety and Security Global Systems Control Modules/Nodes Control Modules/Nodes Sensors/Detectors Control Modules/Nodes Cameras SmartMsg Enabled Systems Networked PAGASYS Rack Enterprise Integrated Command Solution 12


13 Fire Rescue Group 13


14 Growth Strategy Geographic Expansion Jetstream and Industrial Systems in the Asia Pacific and Middle East Export markets from U.S. Bronto in North America New Markets for Existing Products Waterblasting Hydro-excavation Security systems New Product Development and Acquisitions Innovation program Leverage use of established platforms 14
15 Growth Markets and Opportunities Developing growth product areas Vactor (hydro-excavation, vacuum loading and sewer cleaning) Jetstream (waterblasting) Integrated Systems (communication safety and warning systems) These predominantly industrial areas aggregate to 50% of total revenue* Growth opportunities and drivers U.S. market and industrial uses for high-reach lifts (Bronto) Healthy U.S. municipal spending (Elgin, among others) Recovering government spending in Europe (Bronto, Vama) Expanding utilities applications (Vactor) Industrial cleaning and international waterblasting (Jetstream) Environmental protection and clean-up (Vactor) Product and service introductions in police, fire, ambulance and other safety markets (Safety and Security Systems Group) * (as of 12/31/14) 15
16 Focus and Long-Term Goals Create Disciplined Growth Organic and Acquisitions Grow revenue faster than GDP, Grow EPS at an average % rate in low to mid teens Leverage Invested Capital Continually improve ROIC Grow Shareholder Value Improve Manufacturing Efficiencies and Costs Operating margin targets Consolidated 12% ESG 13-16% SSG 14-16% FRG 10-12% Diversify Customer Base Increase industrial revenue share 16
17 Specific Initiatives New HXX line at Vactor Leverage core competencies Jetstream expansion Leverage Invested Capital New ProDIGy line at Elgin ROIC-based compensation Flexible ESG manufacturing Optimize ERP System Core tuck-in acquisitions New Navigator Fire light bar Create Disciplined Growth Organic and Acquisitions Streamlined Global Systems leadership New international systems products Paint, robotics and machining investments New products for utilities markets Improve Manufacturing Efficiencies and Costs Continued 80/20 and lean focus Engineering refocus IT cost savings Up-fitting police cars New innovation teams and focus Organic and M&A growth in industrial markets Diversify Customer Base Bronto U.S. industrial opportunities SSG productivity measures from ERP Freight cost savings 17
18 Consolidated Historical Financial Performance* ($ in millions) Q Net sales $ $ $ $ % Growth 16.6% 6.0% 7.9% Cost of sales Gross profit $ $ $ $ 59.2 % Margin 23.6% 24.1% 25.4% 26.7% Operating expenses Operating income $ 51.5 $ 70.6 $ 92.6 $ 24.8 % Margin 6.4% 8.3% 10.1% 11.2% Interest expense Debt settlement charges Other expense, net Pre-tax income $ 25.9 $ 53.0 $ 87.3 $ 23.3 * Consolidated financial results reflect only continuing operations of the Company. 18
19 EPS Trends and Outlook Adjusted Earnings Per Share * $ per share Full Year Range $0.95- $ Q EPS 0.00 YR 2011 YR 2012 YR 2013 YR 2014 YR 2015 * To facilitate comparisons to 2015, adjusted earnings for 2014 are $0.93 per share, which is computed after excluding the benefit from a release of valuation allowance against foreign deferred tax assets and a tax benefit associated with change in Spanish tax rate. GAAP earnings for 2014 were $0.99 per share. Adjusted earnings for 2013 were $0.67 per share, which is computed after excluding special tax items, the impacts of restructuring and debt settlement charges and applying a normalized income tax rate of 32%. A reconciliation of adjusted earnings per share is included in Appendix 1. 19
20 Capital Allocation Priorities Strong cash flow and flexibility TTM Q cash flow from operating activities of $82.6 M At 0.4 times adjusted EBITDA, debt is already low Funding of internal growth opportunities Projects leverage existing businesses and generally require limited cash investment Innovation efforts target new and updated products Generally, already funded within operating results and cash flow Acquisitions Targeting tuck-in opportunities which leverage core operations, are modest size (+/- $50 M), with returns greater than FSS cost of capital, and accretive within a year Would also consider transformational acquisitions Quarterly dividend In the first quarter of 2015, we doubled our quarterly dividend to $0.06 per share Share repurchase programs Spent $13.8 M to repurchase approximately 930,000 shares of our stock under authorized share repurchase programs The remaining aggregate authorization under these programs represents approximately 8% of our market capitalization 20
21 Building Equity in Our Brands 21
22 Appendix 1: Adjusted Earnings per Share * ($ in millions, expect per share amounts) Q Income from continuing operations $ 22.0 $ $ 63.0 $ 14.9 Add (less): Income tax expense (benefit) 3.9 (107.2) Income before income taxes Add (less): Restructuring Debt settlement charges Adjusted income before income taxes Adjusted income tax expense (1) (8.6) (20.1) (28.2) (8.4) Adjusted net income from continuing operations $ 22.2 $ 42.3 $ 59.1 $ 14.9 EPS from continuing operations (diluted) $ 0.35 $ 2.53 $ 0.99 $ 0.23 Adjusted EPS from continuing operations (diluted) $ 0.35 $ 0.67 $ 0.93 $ 0.23 (1) Adjusted income tax expense for fiscal years w as computed by applying the Company's normalized effective tax rate of approximately 28% and 32% for 2012 and 2013, respectively. The normalized tax rate excludes the impacts of the valuation allow ance release and other special tax items in these periods. Adjusted income tax expense for 2014 w as recomputed after excluding the impact of a release of valuation allow ance against foreign deferred tax assets and a tax benefit associated w ith change in Spanish tax rate. * The adjusted financial measures presented above are unaudited and are not in accordance with U.S. generally accepted accounting principles ( GAAP ). The non-gaap financial information presented herein should be considered supplemental to, and not a substitute for, or superior to, financial measures calculated in accordance with GAAP. The Company has provided this supplemental information to investors, analysts, and other interested parties to enable them to perform additional analyses of operating results, to illustrate the results of operations giving effect to the non-gaap adjustments shown in the reconciliations below, and to provide an additional measure of performance which management considers in operating the business. 22
23 Appendix 2: Total Debt to Adjusted EBITDA The Company uses the ratio of total debt to adjusted EBITDA as one measure of its long-term financial stability. The ratio of debt to adjusted EBITDA is a non-gaap measure that represents total debt divided by the trailing 12-month total of income from continuing operations before interest expense, debt settlement charges, other expense, income tax benefit or expense and depreciation and amortization expense. The Company uses the ratio to calibrate the magnitude of its debt and its debt capacity against adjusted EBITDA, which is used as an operating performance measure. We believe that investors use a version of this ratio in a similar manner. In addition, financial institutions (including the Company s lenders) use the ratio in connection with debt agreements to set pricing and covenant limitations. For these reasons, the Company believes that the ratio is a meaningful metric to investors in evaluating the Company s long-term financial performance and stability. Other companies may use different methods to calculate total debt to EBITDA. The following table summarizes the Company s ratio of total debt to adjusted EBITDA, and reconciles income from continuing operations to adjusted EBITDA as of and for the trailing twelve month periods ended March 31, 2015 and 2014: ($ in millions) Total Debt $ 52.9 $ 88.1 Income from continuing operations Add: Interest expense Other expense, net Income tax expense (benefit) 28.5 (103.2) Depreciation and amortization Adjusted EBITDA $ $ 85.7 Total debt to adjusted EBITDA ratio ($ in millions) Q Q Q Total Debt $ 52.9 $ 50.2 $ 88.1 Less: Cash and cash equivalents (23.0) (30.4) (16.0) Net Debt $ 29.9 $ 19.8 $
24 Appendix 3: Estimated Global Sales Sales of domestic subsidiaries within U.S (in US $) Sales of domestic subsidiaries outside of U.S (in US $)* Sales of non-u.s. subsidiaries outside of U.S (in local currency) ** Sales of non-u.s. subsidiaries to U.S (in US $) 1% 19% 17% 63% Estimated annual sales allocations as of December 31,2014 * Sales from the U.S. are predominantly denominated in U.S. dollars. ** Sales from and within other currency zones are predominantly in the source-location currencies. 24
25 Appendix 4: Return on Capital Employed * ($ in millions) Adjusted net income from continuing operations $ 42.3 $ 59.1 Current assets $ $ Add (less): Current liabilities (132.6) (139.1) Properties and equipment, net Goodwill Capital employed $ $ Return on capital employed 9.0% 12.1% * The adjusted financial measures presented above are unaudited and are not in accordance with U.S. GAAP. The non-gaap financial information presented herein should be considered supplemental to, and not a substitute for, or superior to, financial measures calculated in accordance with GAAP. The Company has provided this supplemental information to investors, analysts, and other interested parties to enable them to perform additional analyses of operating results, to illustrate the results of operations giving effect to the non-gaap adjustments shown in the reconciliations below, and to provide an additional measure of performance which management considers in operating the business. 25
26
Investor Presentation December 2014
 Disciplined Growth Investor Presentation December 2014 Safe Harbor Statement This presentation contains unaudited financial information and forward-looking statements. Statements that are not historical
Disciplined Growth Investor Presentation March 2016
 Disciplined Growth Investor Presentation March 2016 Safe Harbor Statement This presentation contains unaudited financial information and forward-looking statements. Statements that are not historical are
Disciplined Growth Investor Presentation August 2016
 Disciplined Growth Investor Presentation August 2016 Safe Harbor Statement This presentation contains unaudited financial information and forward-looking statements. Statements that are not historical
Disciplined Growth. Investor Presentation June 2017* *Updated to reflect completion of TBEI acquisition
 Disciplined Growth Investor Presentation June 2017* *Updated to reflect completion of TBEI acquisition Safe Harbor Statement This presentation contains unaudited financial information and forward-looking
Disciplined Growth. Investor Presentation March 2019
 Disciplined Growth Investor Presentation March 2019 Safe Harbor Statement This presentation contains unaudited financial information and forward-looking statements. Statements that are not historical are
Federal Signal Q Earnings Call November 6, Jennifer Sherman, President & Chief Executive Officer Ian Hudson, SVP, Chief Financial Officer
 Federal Signal Q3 2018 Earnings Call November 6, 2018 Jennifer Sherman, President & Chief Executive Officer Ian Hudson, SVP, Chief Financial Officer Safe Harbor This presentation contains unaudited financial
Federal Signal Q Earnings Call August 8, 2017
 Federal Signal Q2 2017 Earnings Call August 8, 2017 Jennifer Sherman, President & Chief Executive Officer Ian Hudson, VP, Interim Chief Financial Officer Safe Harbor This presentation contains unaudited
Federal Signal Q Earnings Call May 8, Jennifer Sherman, President & Chief Executive Officer Ian Hudson, SVP, Chief Financial Officer
 Federal Signal Q1 2018 Earnings Call May 8, 2018 Jennifer Sherman, President & Chief Executive Officer Ian Hudson, SVP, Chief Financial Officer Safe Harbor This presentation contains unaudited financial
Federal Signal Q Earnings Call August 7, Jennifer Sherman, President & Chief Executive Officer Ian Hudson, SVP, Chief Financial Officer
 Federal Signal Q2 2018 Earnings Call August 7, 2018 Jennifer Sherman, President & Chief Executive Officer Ian Hudson, SVP, Chief Financial Officer Safe Harbor This presentation contains unaudited financial
Second Quarter 2018 Results July 31, 2018
 Second Quarter 2018 Results July 31, 2018 Eddie Edwards President and Chief Executive Officer Alex Pease Executive Vice President and Chief Financial Officer Safe harbor Caution Regarding Forward Looking
Fourth-Quarter 2017 Results. January 31, 2018
 Fourth-Quarter 2017 Results January 31, 2018 Safe Harbor This presentation includes forward-looking statements which are statements that are not historical facts, including statements that relate to the
Quad/Graphics Reports Second Quarter and Year-to-Date 2017 Results
 FOR IMMEDIATE RELEASE Quad/Graphics Reports Second Quarter and Year-to-Date 2017 Results Consistent Execution of Strategic Objectives Drives Increased Net Earnings and Margins SUSSEX, WI, August 1, 2017
Daseke, Inc. Q Earnings Presentation
 Daseke, Inc. Q2 2018 Earnings Presentation August 9, 2018 Important Disclaimers Forward-Looking Statements This presentation includes forward-looking statements within the meaning of the safe harbor provisions
Veritiv Corporation Fourth Quarter and Full Year 2018 Financial Results February 28, 2019
 Veritiv Corporation Fourth Quarter and Full Year 2018 Financial Results February 28, 2019 Tom Morabito Director of Investor Relations 2 Safe Harbor Provision Certain statements contained in this presentation
Investor Presentation
 Investor Presentation November 2018 SAFE HARBOR STATEMENT & NON-GAAP MEASURES Statements in this presentation include forward-looking statements within the meaning of the Private Securities Litigation
Q3 Fiscal Year 2019 Financial Highlights
 Q3 Fiscal Year 2019 Financial Highlights For the quarter ended October 31, 2018 November 29, 2018 Forward Looking Statements Certain statements in this communication may contain forward looking statements
FEDERAL SIGNAL CORPORATION
 (Mark One) UNITED STATES SECURITIES AND EXCHANGE COMMISSION Washington, D.C. 20549 FORM 10-K þ ANNUAL REPORT PURSUANT TO SECTION 13 OR 15(d) OF THE SECURITIES EXCHANGE ACT OF 1934 For the fiscal year ended
Fiscal 2019 First Quarter Results. October 30, 2018
 Fiscal 2019 First Quarter Results October 30, 2018 Safe Harbor This presentation contains forward-looking statements within the meaning of Section 27A of the Securities Act of 1933, as amended, and Section
Third Quarter 2018 Results November 8, 2018
 Third Quarter 2018 Results November 8, 2018 Safe Harbor Caution Regarding Forward Looking Statements This presentation any other oral or written statements made by us or on our behalf may include forward-looking
UNITED STATES SECURITIES AND EXCHANGE COMMISSION Washington, D.C Form 10-K
 10-K 1 d281202d10k.htm FORM 10-K Table of Contents UNITED STATES SECURITIES AND EXCHANGE COMMISSION Washington, D.C. 20549 Form 10-K þ ANNUAL REPORT PURSUANT TO SECTION 13 OR 15(d) OF THE SECURITIES EXCHANGE
Third-Quarter 2014 Results. October 22, 2014
 Third-Quarter 2014 Results October 22, 2014 Safe Harbor This presentation includes forward-looking statements, which are statements that are not historical facts, including statements that relate to the
William Blair Growth Conference Tom Richards. Chairman & CEO CDW Corporation
 William Blair Growth Conference 2015 Tom Richards Chairman & CEO 2012 CDW Corporation Disclaimers This presentation contains forward-looking statements within the meaning of the federal securities laws.
First Quarter 2017 Results & Outlook for May 2, 2017
 First Quarter 2017 Results & Outlook for 2017 May 2, 2017 Forward-Looking Statements and Risk Factors This presentation contains statements which constitute forward-looking statements, within the meaning
ALLEGION REPORTS THIRD-QUARTER 2017 FINANCIAL RESULTS
 ALLEGION REPORTS THIRD-QUARTER 2017 FINANCIAL RESULTS Third-quarter 2017 net earnings per share (EPS) of $0.94, compared with 2016 EPS of $0.02; Adjusted 2017 EPS of $1.02, up 9.7 percent compared with
ALLEGION REPORTS FOURTH-QUARTER, FULL-YEAR 2016 FINANCIAL RESULTS, PROVIDES 2017 OUTLOOK
 ALLEGION REPORTS FOURTH-QUARTER, FULL-YEAR 2016 FINANCIAL RESULTS, PROVIDES 2017 OUTLOOK Fourth-quarter 2016 earnings per share from continuing operations (EPS) of $0.77, compared with 2015 EPS of $0.74;
Bank of America Merrill Lynch Global Industrials Conference 2018 March 2018
 Bank of America Merrill Lynch Global Industrials Conference 2018 March 2018 Safe Harbor This presentation includes forward-looking statements which are statements that are not historical facts, including
FIRST QUARTER 2018 EARNINGS CONFERENCE CALL MAY 9, 2018
 FIRST QUARTER 2018 EARNINGS CONFERENCE CALL MAY 9, 2018 Forward-Looking Statements and Non-GAAP Financial Measures Forward-Looking Statements This webcast and presentation contain statements that are forward-looking
INVESTOR PRESENTATION. Fall 2017
 INVESTOR PRESENTATION Fall 2017 DISCLAIMERS Forward-Looking Statements Statements in this document that are not statements of historical fact are forward-looking statements within the meaning of the safe
Waters Corporation Management Presentation
 Waters Corporation Management Presentation Chris O Connell Chairman & Chief Executive Officer January 2019 Cautionary Statements This presentation may contain forward-looking statements regarding future
For more information, contact: Brad Pogalz (952)
") For more information, contact: Brad Pogalz (952) 887-3753 Donaldson Reports Fourth Quarter and Full-Year 2017 Earnings Fourth quarter 2017 sales increased 11.2 percent, full-year sales increased 6.8 percent
For more information, contact: Brad Pogalz (952) 887-3753 Donaldson Reports Fourth Quarter and Full-Year 2017 Earnings Fourth quarter 2017 sales increased 11.2 percent, full-year sales increased 6.8 percent
Bank of America Merrill Lynch Leverage Finance Conference November 30, 2017
 Bank of America Merrill Lynch Leverage Finance Conference November 30, 2017 Mark Olson Executive Vice President and Chief Financial Officer Safe Harbor Caution Regarding Forward Looking Statements This
2018 Financial Outlook
 2018 Financial Outlook Nick Gangestad Senior Vice President and Chief Financial Officer December 12, 2017 1 Agenda Executing on our 2016 2020 plan Tracking to the top-half of 2017 full-year organic growth
Diluted EPS $0.46 $0.46 0% $1.16 $1.26 (8)%
%") Donaldson Reports Third Quarter Results Donaldson Company, Inc. (NYSE: DCI) announced its financial results for its fiscal 2013 third quarter. Summarized financial results are as follows (dollars in millions,
Donaldson Reports Third Quarter Results Donaldson Company, Inc. (NYSE: DCI) announced its financial results for its fiscal 2013 third quarter. Summarized financial results are as follows (dollars in millions,
Fourth Quarter 2016 Results
 Fourth Quarter 2016 Results February 23, 2017 Eddie Edwards President and Chief Executive Officer Mark Olson Executive Vice President and Chief Financial Officer 1 Safe Harbor Caution Regarding Forward
Fourth Quarter and Full Year 2018 Financial Review and Analysis
 Fourth Quarter and Full Year 2018 Financial Review and Analysis (preliminary, unaudited) Supplemental Presentation Materials Unless otherwise indicated, comparisons are to the same periods in the prior
Gabelli 41 st Annual Automotive Aftermarket Symposium. October 30 31, 2017
 Gabelli 41 st Annual Automotive Aftermarket Symposium October 30 31, 2017 1 Forward Looking Statements You should be aware that except for historical information, the matters discussed herein are forward
XYLEM INC. Q EARNINGS RELEASE FEBRUARY 1, 2018
 XYLEM INC. Q4 2017 EARNINGS RELEASE FEBRUARY 1, 2018 Q4 2017 EARNINGS RELEASE FORWARD-LOOKING STATEMENTS This presentation contains information that may constitute forward-looking statements. Forward-looking
Investor Overview Presentation. August 2018
 Investor Overview Presentation August 2018 Forward-Looking Statements Statements about future results made in this presentation constitute forward-looking statements within the meaning of the Private Securities
4Q 2018 Highlights and Operating Results. Products. Technology. Services. Delivered Globally.
 4Q 2018 Highlights and Operating Results Products. Technology. Services. Delivered Globally. Table of Contents Page 3 Safe Harbor Statement and Non-GAAP Financial Measures 4 Sales Overview 9 Overview of
The Manitowoc Company
 The Manitowoc Company STIFEL CONFERENCE, NEW YORK: JUNE 13, 2016 Safe Harbor Statement Any statements contained in this presentation that are not historical facts are forwardlooking statements. These statements
Pentair KeyBanc Capital Markets Industrial, Automotive & Transportation Conference
 Pentair KeyBanc Capital Markets Industrial, Automotive & Transportation Conference John L. Stauch Chief Financial Officer May30, 2013 PENTAIR FORWARD-LOOKING STATEMENTS CAUTION CONCERNING FORWARD-LOOKING
2018 FOURTH QUARTER EARNINGS CALL
 NORTH AMERICA S LEADING BUILDING MATERIALS DISTRIBUTOR RESIDENTIAL COMMERCIAL INTERIOR SOLAR 2018 FOURTH QUARTER EARNINGS CALL Forward Looking Statements / Non-GAAP Measures This presentation contains
3Q 2018 Highlights and Operating Results. Products. Technology. Services. Delivered Globally.
 3Q 2018 Highlights and Operating Results Products. Technology. Services. Delivered Globally. Table of Contents Page 3 Safe Harbor Statement and Non-GAAP Financial Measures 4 Sales Overview 9 Overview of
4Q17 EARNINGS PRESENTATION NYSE: DOOR
 4Q17 EARNINGS PRESENTATION NYSE: DOOR Safe Harbor / Non-GAAP Financial Measures SAFE HARBOR / FORWARD LOOKING STATEMENT This investor presentation contains forward-looking information and other forward-looking
Consolidated Earnings & Capital Allocation Outlook. Mark E. Newman, CFO
 Consolidated Earnings & Capital Allocation Outlook Mark E. Newman, CFO Generating Value Delivering Against Our Commitments Revenue ($ Millions) Adjusted EBITDA ($ Millions) 8,000 7,000 6,000 5,000 4,000
ALLEGION REPORTS FIRST-QUARTER 2018 FINANCIAL RESULTS
 ALLEGION REPORTS FIRST-QUARTER 2018 FINANCIAL RESULTS First-quarter 2018 net earnings per share (EPS) of $0.75, compared with 2017 EPS of $0.71; usted 2018 EPS of $0.80, up 9.6 percent compared with 2017
Sealed Air Reports Fourth Quarter and Full Year 2018 Results
 Exhibit 99.1 Sealed Air Corporation 2415 Cascade Pointe Blvd. Charlotte, NC 28208 For release: February 7, 2019 Sealed Air Reports Fourth Quarter and Full Year 2018 Results Solid year-over-year sales and
Q1 Fiscal Year 2019 Financial Highlights
 Fiscal Year 2019 Financial Highlights For the quarter ended April 30, 2018 May 31, 2018 Forward-Looking Statements Certain statements in this communication may contain forward-looking statements within
The Manitowoc Company, Inc.
 The Manitowoc Company, Inc. RBC CAPITAL MARKETS GLOBAL INDUSTRIALS CONFERENCE SEPTEMBER 5, 2018 LAS VEGAS, NV Dave Antoniuk, SVP & CFO Ion Warner, VP Marketing & IR Forward- Looking Statements Safe Harbor
TENNANT COMPANY INVESTOR PRESENTATION REINVENTING HOW THE WORLD CLEANS
 INVESTOR PRESENTATION REINVENTING HOW THE WORLD CLEANS 2 Safe Harbor Statement This presentation contains certain statements that are considered forward-looking statements within the meaning of the Private
4Q 2017 Highlights and Operating Results
 4Q 2017 Highlights and Operating Results January 30, 2018 1 4Q 2017 Highlights and Operating Results Table of Contents Page(s) 1 Sales Overview 4-8 2 Financial Performance Trends 9-16 3 Leverage Metrics
Avery Dennison Jefferies Industrials Conference
 Avery Dennison Jefferies Industrials Conference August 9, 2016 Anne Bramman SVP and Chief Financial Officer 1 Avery Dennison Investor Presentation Forward-Looking Statements Certain statements contained
CDW Corporation. Webcast Conference Call May 2, CDW.com
 CDW Corporation Webcast Conference Call May 2, 2018 CDW.com 800.800.4239 Today's Agenda First Quarter 2018 Results Key Performance Drivers and Strategic Progress Financial Results Outlook Q&A 2 Disclaimers
Q4 and Full Year 2017 Financial Results. February 16, 2018
 Q4 and Full Year 2017 Financial Results February 16, 2018 Safe Harbor Language and Reconciliation of Non-GAAP Measures This presentation contains certain forward-looking statements within the meaning of
Earnings Presentation. October 27, 2011
 Q1 Fiscal Year 2012 Earnings Presentation & Financial Results Supplement October 27, 2011 Safe Harbor Statement This presentation contains statements about our future expectations, plans and prospects
ACTUANT REPORTS THIRD QUARTER RESULTS; UPDATES FISCAL 2018 GUIDANCE
 For Immediate Release N86 W12500 Westbrook Crossing Menomonee Falls, WI 53051 Contact: Karen Bauer Communications & Investor Relations Leader 262-293-1562 ACTUANT REPORTS THIRD QUARTER RESULTS; UPDATES
ALLEGION REPORTS SECOND-QUARTER 2018 FINANCIAL RESULTS
 ALLEGION REPORTS SECOND-QUARTER 2018 FINANCIAL RESULTS Second-quarter 2018 net earnings per share (EPS) of $1.19, compared with 2017 EPS of $1.10; usted 2018 EPS of $1.25, up 12.6 percent compared with
SECOND QUARTER 2018 BUSINESS REVIEW. Jonathan W. Painter, President & CEO Michael J. McKenney, Executive Vice President & CFO
 SECOND QUARTER 2018 BUSINESS REVIEW Jonathan W. Painter, President & CEO Michael J. McKenney, Executive Vice President & CFO Forward-Looking Statements The following constitutes a Safe Harbor statement
Driving Value Through Culture, Innovation and Results
 Driving Value Through Culture, Innovation and Results THIRD QUARTER 2018 EARNINGS PRESENTATION November 2, 2018 1 Agenda Introduction Business Overview Financial Overview Roger Hendriksen Director, Investor
Second Quarter 2017 Earnings Conference Call
 Second Quarter 2017 Earnings Conference Call July 28, 2017 NYSE: TEN Agenda Second Quarter Highlights Segment Results and Financial Overview Outlook and Strategic Priorities Brian Kesseler Chief Executive
Xylem Agrees to Acquire Sensus to Broaden Portfolio and Enhance Growth Platform AUGUST 15, 2016
 1 Xylem Agrees to Acquire Sensus to Broaden Portfolio and Enhance Growth Platform AUGUST 15, 2016 Forward-Looking Statements This presentation contains information that may constitute forward-looking statements.
Our Transformation Continues. March 21, 2018
 Our Transformation Continues March 21, 2018 Disclosure Regarding Forward-Looking Statements Forward-Looking Statements and Factors That May Affect Future Results: Throughout this presentation, we make
Second Quarter 2018 Financial Review and Analysis (preliminary, unaudited)
") Second Quarter 2018 Financial Review and Analysis (preliminary, unaudited) Supplemental Presentation Materials Unless otherwise indicated, comparisons are to the same period in the prior year. 1 Second
Second Quarter 2018 Financial Review and Analysis (preliminary, unaudited) Supplemental Presentation Materials Unless otherwise indicated, comparisons are to the same period in the prior year. 1 Second
2016 Financial Update and 2017 Outlook. Webcast Presentation December 13, 2016
 2016 Financial Update and 2017 Outlook Webcast Presentation December 13, 2016 Safe Harbor Statement Note: All statements made herein that are not historical facts should be considered as forwardlooking
First Quarter 2018 Results May 1, 2018
 First Quarter 2018 Results May 1, 2018 Eddie Edwards President and Chief Executive Officer Alex Pease Executive Vice President and Chief Financial Officer Safe harbor Caution Regarding Forward Looking
Quaker Chemical Corporation. Investor Presentation. August 2016
 Quaker Chemical Corporation Investor Presentation August 2016 1 Risk and Uncertainties Statement Regulation G The attached charts include Company information that does not conform to generally accepted
July 26, Second Quarter 2018 Earnings Presentation
 July 26, 2018 Second Quarter 2018 Earnings Presentation Disclaimer Statement Regarding Safe Harbor For Forward-Looking Statements This presentation contains forward-looking statements, that is, information
First Quarter 2018 Financial Review and Analysis (preliminary, unaudited)
") First Quarter 2018 Financial Review and Analysis (preliminary, unaudited) Supplemental Presentation Materials Unless otherwise indicated, comparisons are to the same period in the prior year. 1 First Quarter
First Quarter 2018 Financial Review and Analysis (preliminary, unaudited) Supplemental Presentation Materials Unless otherwise indicated, comparisons are to the same period in the prior year. 1 First Quarter
News Release FOR IMMEDIATE RELEASE ACCO BRANDS CORPORATION REPORTS FOURTH QUARTER AND FULL YEAR 2018 RESULTS
 News Release FOR IMMEDIATE RELEASE ACCO BRANDS CORPORATION REPORTS FOURTH QUARTER AND FULL YEAR 2018 RESULTS LAKE ZURICH, ILLINOIS, February 13, 2019 - ACCO Brands Corporation (NYSE: ACCO), one of the
OWENS-ILLINOIS. Credit Suisse 2018 Basic Materials Conference
 OWENS-ILLINOIS Credit Suisse 2018 Basic Materials Conference ANDRES LOPEZ, CEO JAN BERTSCH, CFO SEPTEMBER 12, 2018 Safe harbor comments Forward-Looking Statements This document contains "forward-looking"
Investor Presentation
 Investor Presentation May 2018 SAFE HARBOR STATEMENT & NON-GAAP MEASURES Forward-Looking Statements Statements in this presentation concerning the Company s goals, strategies, and expectations for business
Digital River, Inc. First Quarter Results (In thousands, except share data) Subject to reclassification
 Subject to reclassification") (In thousands, except share data) Consolidated Balance Sheets (Unaudited) December 31, Assets Current assets Cash and cash equivalents $ 500,742 $ 542,851 Short-term investments 144,615 162,794 Accounts
(In thousands, except share data) Consolidated Balance Sheets (Unaudited) December 31, Assets Current assets Cash and cash equivalents $ 500,742 $ 542,851 Short-term investments 144,615 162,794 Accounts
Third-Quarter 2015 Results. October 27, 2015
 Third-Quarter 2015 Results October 27, 2015 Safe Harbor This presentation includes forward-looking statements, which are statements that are not historical facts, including statements that relate to the
Gardner Denver Reports Strong Second Quarter 2018 Results and Raises Full Year 2018 Adjusted EBITDA Midpoint Guidance
 August 1, 2018 Gardner Denver Reports Strong Second Quarter 2018 Results and Raises Full Year 2018 Adjusted EBITDA Midpoint Guidance Revenues of $668.2 million increased 15% over the prior year, supported
Safe Harbor. Non-GAAP Financial Information
 1 Safe Harbor This document contains forward-looking statements within the meaning of the Private Securities Litigation Reform Act of 1995, including financial projections subject to risks, uncertainties
RBC Capital Markets-Global. Conference. Las Vegas
 RBC Capital Markets-Global Industrial Conference September 10 2013 September 10, 2013 Las Vegas Safe Harbor Statements in this presentation that are not historical are considered forwardlooking statements
United Rentals to Acquire RSC Holdings
 United Rentals to Acquire RSC Holdings Investor Presentation DECEMBER 2011 Introductory Information Cautionary Statement Regarding Forward-Looking Statements This document contains forward-looking statements
FOR IMMEDIATE RELEASE
 Investor Contact Media Contact David Martin Kenneth Julian 717.612.5628 717.730.3683 damartin@harsco.com kjulian@harsco.com FOR IMMEDIATE RELEASE REPORTS SECOND QUARTER 2014 RESULTS Adjusted Operating
INVESTOR PRESENTATION
 INVESTOR PRESENTATION April 30, 2015 Safe Harbor Forward-Looking Statements. This presentation contains "forward-looking statements" within the meaning of the Private Securities Litigation Reform Act of
4Q 2016 Earnings Call February 28, :30am ET
 2016 Earnings Call February 28, 2017 8:30am ET 1 Safe Harbor Statement Certain statements made within this presentation contain forward-looking statements, within the meaning of the Private Securities
Daseke, Inc. Q Earnings Presentation
 Daseke, Inc. Q1 2018 Earnings Presentation May 8, 2018 Presenters Don Daseke CEO and Chairman Scott Wheeler President, CFO and Director 1 Important Disclaimers Forward-Looking Statements This presentation
Third Quarter 2018 Earnings Thursday, November 8, 2018
 Third Quarter 2018 Earnings Thursday, November 8, 2018 1 Forward-Looking Statements This presentation may contain "forward-looking statements" as defined in the Private Securities Litigation Reform Act
CARS.COM. Third Quarter 2017 Earnings November 8, 2017
 CARS.COM Third Quarter 2017 Earnings November 8, 2017 Forward Looking Statements This presentation contains forward looking statements within the meaning of the federal securities laws, including those
2015 Fourth Quarter February 25, 2016
 2015 Fourth Quarter February 25, 2016 Safe Harbor Disclaimer Forward-Looking Statements We have made statements in this document that are forward-looking statements within the meaning of the federal securities
2Q 2017 Highlights and Operating Results
 2Q 2017 Highlights and Operating Results July 25, 2017 1 2Q 2017 Highlights and Operating Results Table of Contents Page(s) 1 Sales Overview and Highlights 4-5 2 NSS Overview 6-7 3 EES Overview 8-9 4 UPS
Q Earnings. January 24, 2018
 Q1 2018 Earnings January 24, 2018 Forward-Looking Statements and Non-GAAP Measures Forward-Looking Statements This presentation contains certain forward-looking statements within the meaning of the U.S.
TENNANT COMPANY. INVESTOR PRESENTATION Second Quarter 2018 REINVENTING HOW THE WORLD CLEANS
 INVESTOR PRESENTATION Second Quarter 2018 REINVENTING HOW THE WORLD CLEANS 2 Safe Harbor Statement This presentation contains certain statements that are considered forward-looking statements within the
Forward-Looking Statements
 Forward-Looking Statements Parts of this presentation contain forward-looking statements within the meaning of the Private Securities Litigation Reform Act of 1995. These forward-looking statements involve
Q Earnings Conference Call Supplemental 2020 Plan Details
 Karen Colonias CEO Brian Magstadt CFO Q3 2017 Earnings Conference Call Supplemental 2020 Plan Details October 30, 2017 Safe Harbor This document contains forward-looking statements within the meaning of
Veritiv Corporation Fourth Quarter and Fiscal Year 2017 Financial Results March 1, 2018
 Veritiv Corporation Fourth Quarter and Fiscal Year 2017 Financial Results March 1, 2018 Tom Morabito Director of Investor Relations 2 Safe Harbor Provision Certain statements contained in this presentation
NEXSTAR MEDIA GROUP THIRD QUARTER NET REVENUE RISES 13.3% TO A RECORD $693.4 MILLION
 NEXSTAR MEDIA GROUP THIRD QUARTER NET REVENUE RISES 13.3% TO A RECORD $693.4 MILLION Net Revenue Growth Drives Record 3Q Operating Income of $192.9 Million and Net Income of $99.8 Million Record 3Q BCF
CDW Corporation. Webcast Conference Call February, CDW.com
 CDW Corporation Webcast Conference Call February, 7 2018 CDW.com 800.800.4239 Today's Agenda Fourth Quarter and YTD 2017 Results Key Performance Drivers and Strategic Progress Financial Results ASC 606
1Q 2018 Highlights and Operating Results
 1Q 2018 Highlights and Operating Results April 26, 2018 1 Table of Contents Page(s) 4 Announced Agreements to Acquire Australia and New Zealand Security Businesses 5-9 Sales Overview 10-17 Financial Performance
Magellan Health. Cantor Fitzgerald Healthcare Conference September 26, 2017
 Magellan Health Cantor Fitzgerald Healthcare Conference September 26, 2017 Cautionary Statement and Non-GAAP measures 2 This slide presentation and our accompanying oral comments include forward-looking
Q Earnings Report. Sabre Corporation August 4, 2015
 Q2 2015 Earnings Report Sabre Corporation August 4, 2015 1 Forward-looking Statements Forward Looking Statements Certain statements herein are forward-looking statements about trends, future events, uncertainties
Q Preliminary Earnings Results Summary. November 1, 2018
 Q3 2018 Preliminary Earnings Results Summary November 1, 2018 SAFE HARBOR STATEMENT This presentation may contain projections or other forward-looking statements within the meaning Section 27A of the Private
FIRST QUARTER FISCAL YEAR 2019 Earnings Conference Call & Presentation. February 7, 2019 at 9:00 a.m. CT (10:00 a.m. ET)
") FIRST QUARTER FISCAL YEAR 2019 Earnings Conference Call & Presentation February 7, 2019 at 9:00 a.m. CT (10:00 a.m. ET) 1 First Quarter Fiscal Year 2019 Welcome to Nexeo s Earnings Conference Call and
FIRST QUARTER FISCAL YEAR 2019 Earnings Conference Call & Presentation February 7, 2019 at 9:00 a.m. CT (10:00 a.m. ET) 1 First Quarter Fiscal Year 2019 Welcome to Nexeo s Earnings Conference Call and
ANIXTER INTERNATIONAL INC.
 UNITED STATES SECURITIES AND EXCHANGE COMMISSION WASHINGTON, D.C. 20549 FORM 8-K CURRENT REPORT PURSUANT TO SECTION 13 OR 15(d) OF THE SECURITIES EXCHANGE ACT OF 1934 Date of Report (Date of earliest event
Parker s Acquisition of CLARCOR to Enhance Filtration Platform
 Parker s Acquisition of CLARCOR to Enhance Filtration Platform December 1, 2016 Forward-Looking Statements Forward-looking statements contained in this and other written and oral reports are made based
Q EARNINGS CONFERENCE CALL BILL NUTI, CHAIRMAN & CEO MARK BENJAMIN, PRESIDENT & COO BOB FISHMAN, CFO
 1 Q2 2017 EARNINGS CONFERENCE CALL BILL NUTI, CHAIRMAN & CEO MARK BENJAMIN, PRESIDENT & COO BOB FISHMAN, CFO July 20, 2017 NOTES TO INVESTORS FORWARD-LOOKING STATEMENTS. Comments made during this conference