Q EARNINGS CONFERENCE CALL
|
|
|
- Amos Gilbert
- 5 years ago
- Views:
Transcription


1 Q EARNINGS CONFERENCE CALL BILL NUTI, CHAIRMAN AND CEO BOB FISHMAN, CFO April 28,
2 NOTES TO INVESTORS FORWARD-LOOKING STATEMENTS. Comments made during this conference call and in these materials contain forwardlooking statements within the meaning of the Private Securities Litigation Reform Act of Statements that describe or relate to NCR's future plans, goals, intentions, strategies or financial outlook, and statements that do not relate to historical or current fact, are examples of forward-looking statements. The forward-looking statements in these materials include statements about the expected benefits of NCR's Kalpana ATM technology; industry investment trends and market conditions affecting NCR and its business; expectations for the growth of NCR's Retail Solutions business; expectations regarding the transformation of NCR's sales and services functions; the success of NCR's ongoing restructuring plan; foreign currency fluctuations and their impact on NCR's results and NCR's FY 2015 overall, FY 2015 segment and Q financial outlook. Forward-looking statements are based on our current beliefs, expectations and assumptions, which may not prove to be accurate, and involve a number of known and unknown risks and uncertainties, many of which are out of NCR's control. Forward-looking statements are not guarantees of future performance, and there are a number of important factors that could cause actual outcomes and results to differ materially from the results contemplated by such forward-looking statements, including those factors listed in Item 1a "Risk Factors" of NCR's Annual Report on Form 10-K and those factors detailed from time to time in NCR's other SEC reports. These materials are dated April 28, 2015, and NCR does not undertake any obligation to publicly update or revise any forward-looking statements, whether as a result of new information, future events or otherwise. NON-GAAP MEASURES. While NCR reports its results in accordance with generally accepted accounting principles in the United States (GAAP), comments made during this conference call and these materials will include the following "non-gaap" measures: nonpension operating income (NPOI), non-gaap diluted earnings per share (non-gaap diluted EPS), free cash flow (FCF), operational gross margin, operational gross margin rate, expenses (non-gaap), adjusted EBITDA, effective tax rate, non-gaap net income and selected measures expressed on a constant currency basis. These measures are included to provide additional useful information regarding NCR's financial results, and are not a substitute for their comparable GAAP measures. Explanations of these non-gaap measures and reconciliations of these non-gaap measures to their directly comparable GAAP measures are included in the accompanying "Supplementary Non-GAAP Materials" and are available on the Investor Relations page of NCR's website at Descriptions of many of these non-gaap measures are also included in NCR's SEC reports. USE OF CERTAIN TERMS. As used in these materials, (i) the term "software-related revenue" includes software license, software maintenance, cloud, and professional services revenue associated with software delivery, (ii) the term "recurring revenue" means the sum of cloud, hardware maintenance and software maintenance revenue, (iii) the terms "cloud" and "cloud revenue" are used to describe NCR s software-as-a-service offerings and the revenue associated therewith (prior earnings releases and presentation materials referred to these offerings and revenues as "SaaS" and "SaaS revenue") and (iv) the term "CC" means constant currency. These presentation materials and the associated remarks made during this conference call are integrally related and are intended to be presented and understood together. 2
3 Q FINANCIAL RESULTS $1.52 billion REVENUE $1.48 billion FX Impact ~($95M) OPERATIONAL GROSS MARGIN 28.6% 27.6% FX Impact ~(25 bps) Q Q Revenue down 3% y/y, up 3% CC Recurring revenue down 2% y/y, up 4% CC, 45% of total Q Q Down 100 bps y/y, down ~75 bps CC NPOI $155 million FX Impact ~($18M) $146 million NON-GAAP EPS $0.50 FX Impact ~($0.08) $0.43 FREE CASH FLOW ($51) million $24 million Q Q Q Q Q Q NPOI down 6% y/y, up 6% CC Non-GAAP EPS down 14% y/y, up 2% CC FCF improvement driven by cash from operations, capital expenditures, and disc ops 3

4 SOFTWARE-RELATED REVENUE GROWTH Q1 Professional Services Cloud SW Licenses & SW Maintenance Fx Impact ~($15M) $395 $135 $113 $147 $414 $131 $134 $149 Q1 Software-related revenue up 5% y/y; up 9% CC Q1 Cloud revenue up 19% y/y; up 20% CC Q1 Professional Services revenue down 3% y/y; up 3% CC Q Q ($'s in Millions) 4


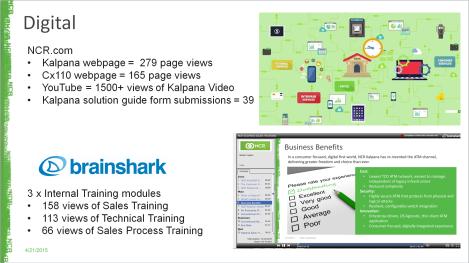


5 NCR Kalpana is here! Making omni-channel a reality NCR Kalpana software enables the best consumer experience at the lowest cost to serve SECURITY INTEGRATION Seamlessly integrates the experience across all channels Enables institutions to run a combination of conventional ATMs and the tablet-like, ultra-thin client Cx110 Delivers the world s first ATM security certification to PCI 4.0, and is designed to eliminate malware Controls and originates all software updates at the server level SPEED Eliminates legacy PC architecture that is inefficient and complex Runs ATMs remotely, enabling new customer services to be brought to market twice as fast as before SAVINGS Cloud-driven creation, delivery and processing of transactions Management of selfservice channel moved to the cloud; eliminates costly onsite service visits Reduces operating costs by up to 40% 5
6 Q SUMMARY Q1 results in-line with expectations Improving execution and metrics across NCR Significant FX headwinds Well positioned across end markets Financial Services strong demand for omni-channel solutions Retail Solutions investment priorities beginning to shift back to omni-channel and customer experience solutions; expect improvement in the second half of 2015 Hospitality higher software and cloud revenue drive strong operating margin expansion Growth of software and cloud revenues Total software-related revenue up 5%; up 9% CC Cloud revenue up 19%; up 20% CC Building a stronger NCR Sales and Services transformation gaining traction Services margins improving in Q1 Restructuring initiatives on track Free cash flow increased $75 million 6
7 Q1 OPERATIONAL RESULTS For the Three Months Ended March As Reported Constant Currency Revenue $1,476 $1,518 (3)% 3% Operational Gross Margin (6)% 1% Operational Gross Margin Rate 27.6% 28.6% Expenses (non-gaap) (6)% (2)% % of Revenue 17.7% 18.4% NPOI (6)% 6% % of Revenue 9.9% 10.2% -30 bps +30 bps Interest and other expense (51) (50) 2% 2% Non-GAAP Diluted EPS (1) $0.43 $0.50 (14)% 2% (1) Effective tax rate of 21% in Q and 17% in Q $ millions, except per share amounts 7
8 Q1 GAAP RESULTS For the Three Months Ended March % Change Revenue $1,476 $1,518 (3)% Gross Margin (6)% Gross Margin Rate 26.4% 27.4% Expenses (4)% % of Revenue 20.0% 20.3% Income from Operations (12)% % of Revenue 6.4% 7.1% Interest and other expense (51) (50) 2% GAAP Diluted EPS $0.23 $0.31 (26)% $ millions, except per share amounts 8

9 FINANCIAL SERVICES Q Update Financial Results Revenue up 1% as reported and up 9% CC: Growth in Americas, Europe and Middle East Africa driven by increased software-related revenue Operating income up 2% as reported and up 15% CC due to a higher mix of omni-channel solutions Q Q As Reported Constant Currency Revenue $798M $794M 1% 9% Operating Income $105M $103M 2% 15% Operating Income as a % of Revenue 13.2% 13.0% +20 bps +70 bps Key Metrics Key Market Developments Cloud revenue up 19%; up 19% CC Software-related revenue up 10%; up 15% CC Performance in key markets Growth in U.S., Middle East / Africa, Brazil and Western Europe Continued challenges in China and Russia Key elements of solution portfolio Branch Transformation and software license revenues were up significantly Y/Y Record end user growth in Digital banking Initial Kalpana TM win closed 9

10 RETAIL SOLUTIONS Q Update Financial Results Q Q As Reported Constant Currency Revenue $445M $490M (9%) (4%) Operating Income $16M $36M (56%) (44%) Operating Income as a % of Revenue 3.6% 7.3% -370 bps -300 bps Key Metrics Revenue down 9% as reported and down 4% CC; Decline in all theaters due to reduced spending by retailers Operating income down 56% as reported and down 44% CC due to lower volume and a less favorable mix of software-related revenue Cloud revenue flat; up 4% CC Software-related revenue down 3%; up 1% CC Key Market Developments As expected, challenging retail market impacting results in Q1 with improvement forecasted in the second half of 2015; Positive momentum in orders in Q1 Improving demand for our omni-channel and self-checkout solutions in Greater China, Southeast Asia and Russia Significant Services win in Q1 resulting from strong Customer Service execution 10
 1% Operating Income $18M $12M 50% 50% Operating Income")
11 HOSPITALITY Q Update Financial Results Revenue down 1% as reported and up 1% CC due to higher software-related revenue partially offset by lower hardware revenue Operating income up 50% as reported due to higher software-related revenue including cloud revenue Q Q As Reported Constant Currency Revenue $148M $149M (1%) 1% Operating Income $18M $12M 50% 50% Operating Income as a % of Revenue 12.2% 8.1% +410 bps +410 bps Key Metrics Key Market Developments Cloud revenue up 24%; up 26% CC Software-related revenue up 14%; up 15% CC International software-related revenue grew by 33% y/y Cloud application sites up 21% y/y Continuing to advance North America SMB market strategy with 11% revenue growth y/y and 21% softwarerelated revenue growth y/y Software revenue growth driven by increasing wallet share with our existing customers through implementation of omni-channel solutions 11


12 EMERGING INDUSTRIES Q Update Revenue flat as reported and up 8% CC; Growth driven by Telecom & Technology revenue, up 6% Financial Results Q Q As Reported Constant Currency Revenue $85M $85M % 8% Operating Income $7M $4M 75% 125% Operating Income as a % of Revenue 8.2% 4.7% +350 bps +510 bps Key Metrics Operating income up 75% as reported and up 125% CC due to higher services margins Key Market Developments Telecom & Technology Base expansion wins in new portfolios: Advanced and Managed Services Added two new Telecom expansion accounts Travel Delivered a record 40M mobile airline boarding passes in Q1 2015, up 172% y/y Small Business (NCR Silver) Increased adoption of NCR Silver; Customer base up 11% over Q and up 127% y/y 12
13 Q1 SUPPLEMENTAL REVENUE INFORMATION For the Periods Ended March Three Months % Change % Change (Constant Currency) Cloud $134 $113 19% 20% Software License and Software Maintenance % 6% Professional Services (3%) 3% Total Software-Related Revenue % 9% Hardware (5%) 2% Other Services (5%) 2% Total Revenue $1,476 $1,518 (3%) 3% $ millions 13
14 FREE CASH FLOW Q Q FY 2015e FY 2014 Cash Provided by Operating Activities (1) $79 $31 $595 - $625 $524 Net capital expenditures (51) (66) (215) - (235) (258) Cash used In Discontinued Operations (4) (16) (35) (1) Pension discretionary contributions and settlements 48 Free Cash Flow $24 ($51) $325 - $375 $313 Free Cash Flow as a % of non-gaap net income ~75% 67% (1) Includes cash tax rate of 12% in FY 2014 and an expected cash tax rate of 13% in FY $ millions, except metrics 14
15 RESTRUCTURING PROGRESS UPDATE Expected Savings ~$18M in 2014, ~$70M in 2015 and ~$105M in 2016 ~50% of the savings benefiting NPOI in each year GAAP Income Statement Impact Total charge of $200M to $225M from 2014 through 2015; $16M in Q ~$21M to ~$46M remaining in FY 2015 Cash Impact Total cash impact of $100M to $115M from 2014 through 2015; $16M in Q ~$55M to ~$70M remaining in FY
16 NET DEBT & EBITDA METRICS Q Q Q Debt $3,949 $3,659 $3,615 Cash Net Debt $3,434 $3,148 $3,153 Adjusted EBITDA $904 (1) $1,000 $996 (1) Net Debt / Adjusted EBITDA 3.8x 3.1x 3.2x (1) Adjusted EBITDA for the trailing twelve-month period. $ in millions, except metrics Goal for Net Debt / Adjusted EBITDA under 3x in
17 FY 2015 GUIDANCE 2015 Guidance 2014 Revenue $6,525 - $6,675 $6,591 Year-over-Year Revenue Growth (1%) to 1% 8% Constant Currency Year-Over-Year Revenue Growth 5% to 7% (1) 10% Income from Operations (GAAP) (2) $625 - $690 $353 Non-Pension Operating Income (NPOI) $830 - $870 $820 Adjusted EBITDA $1,047 - $1,087 $1,000 Diluted EPS (GAAP) (2) $ $2.10 $1.06 Non-GAAP Diluted EPS (3) $ $2.80 $2.74 Cash Flow from Operating Activities $595 - $625 $524 Free Cash Flow $325 - $375 $313 (1) (2) (3) $ in millions, except per share amounts Expected constant currency growth has been adjusted from 4% to 6% to 5% to 7% to reflect an increase of 1% in anticipated unfavorable foreign currency impact. We previously expected unfavorable foreign currency impacts of approximately 5% in revenue and now expect unfavorable foreign currency impacts of approximately 6% in revenue. Income from operations and diluted earnings per share guidance excludes the impact of the actuarial mark to market pension adjustment that will be determined in the fourth quarter of 2015 and the impact of the transfer of the UK London plan to an insurer that is expected to occur in 2015 or early The UK London plan was approximately $420 million overfunded as of December 31, guidance includes expected other expense (income), net (OIE) of $215M to $220M, a 25% tax rate and a share count of 175M results include OIE of $213M, a 22% tax rate and a share count of 171.2M. 17
18 2015 SEGMENT REVENUE GUIDANCE Segment 2015e 2015e Constant Currency FY 2014 Financial Services (2%) to 0% 4% to 6% $3,561 Retail Solutions (1%) to 1% 4% to 6% $2,008 Hospitality 3% to 7% 5% to 9% $659 Emerging Industries (6%) to (1%) 0% to 5% $363 Total (1%) to 1% 5% to 7% $6,591 $ in millions 18
19 Q GUIDANCE Q2 2015e Q Income from Operations (GAAP) $140 - $150 (1) $169 Non-Pension Operating Income (Non-GAAP) $190 - $200 (2) $210 Tax rate 28% 27% Other expense ~$55 $49 (1) (2) Includes an estimated pre-tax charge of $14M in Q related to the ongoing restructuring plan. Includes an estimated unfavorable foreign currency impact of approximately $20M in NPOI in Q $ millions 19
20 SUPPLEMENTARY NON-GAAP MATERIALS
21 NON-GAAP MEASURES While NCR reports its results in accordance with generally accepted accounting principles (GAAP) in the United States, comments made during this conference call and in these materials will include non-gaap measures. These measures are included to provide additional useful information regarding NCR's financial results, and are not a substitute for their comparable GAAP measures. NPOI, Non-GAAP Diluted EPS, Operational Gross Margin, Operational Gross Margin Rate, Expenses (non-gaap), Effective Tax Rate and Non-GAAP Net Income. NCR's non-pension operating income (NPOI), non-gaap net income and non-gaap diluted earnings per share (non-gaap diluted EPS) are determined by excluding pension expense and special items, including amortization of acquisition related intangibles, from NCR's GAAP income (loss) from operations. NCR also determines operational gross margin, operational gross margin rate, expenses (non-gaap) and effective tax rate (non-gaap) by excluding pension expense and these special items from its GAAP gross margin, gross margin rate, expenses and effective tax rate. Due to the significant change in its pension expense from year to year and the non-operational nature of pension expense and these special items, NCR's management uses these non-gaap measures to evaluate year-over-year operating performance. NCR also uses NPOI and non-gaap diluted EPS to manage and determine the effectiveness of its business managers and as a basis for incentive compensation. NCR believes these measures are useful for investors because they provide a more complete understanding of NCR's underlying operational performance, as well as consistency and comparability with NCR's past reports of financial results. Free Cash Flow. NCR defines free cash flow as net cash provided by/used in operating activities and cash flow provided by/ used in discontinued operations less capital expenditures for property, plant and equipment, additions to capitalized software, discretionary pension contributions and settlements. NCR's management uses free cash flow to assess the financial performance of the Company and believes it is useful for investors because it relates the operating cash flow of the Company to the capital that is spent to continue and improve business operations. In particular, free cash flow indicates the amount of cash generated after capital expenditures which can be used for, among other things, investment in the Company's existing businesses, strategic acquisitions, strengthening the Company's balance sheet, repurchase of Company stock and repayment of the Company's debt obligations. Free cash flow does not represent the residual cash flow available for discretionary expenditures since there may be other nondiscretionary expenditures that are not deducted from the measure. Free cash flow (FCF) do not have uniform definitions under GAAP and, therefore, NCR's definition may differ from other companies' definition of this measure. 21
22 NON-GAAP MEASURES Adjusted EBITDA. NCR believes that Adjusted EBITDA (adjusted earnings before interest, taxes, depreciation and amortization) provides useful information to investors because it is an indicator of the strength and performance of the Company's ongoing business operations, including its ability to fund discretionary spending such as capital expenditures, strategic acquisitions and other investments. NCR determines Adjusted EBITDA for a given period based on its GAAP income (loss) from continuing operations plus interest expense, net; plus income tax expense (benefit); plus depreciation and amortization; plus other income (expense); plus pension expense (benefit); and plus special items included in the definition of NPOI. NCR believes that its ratio of net debt to Adjusted EBITDA provides useful information to investors because it is an indicator of the company's ability to meet its future financial obligations. Constant Currency. NCR presents certain measures, such as period-over-period revenue growth, on a constant currency basis, which excludes the effects of foreign currency translation. Due to the continuing strengthening of the U.S. dollar against foreign currencies and the overall variability of foreign exchange rates from period to period, NCR's management uses these measures on a constant currency basis to evaluate period-over-period operating performance. Measures presented on a constant currency basis are calculated by translating current period results at prior period monthly average exchange rates. NCR management's definitions and calculations of these non-gaap measures may differ from similarly-titled measures reported by other companies and cannot, therefore, be compared with similarly-titled measures of other companies. These non-gaap measures should not be considered as substitutes for, or superior to, results determined in accordance with GAAP. These non- GAAP measures are reconciled to their corresponding GAAP measures in the following slides and elsewhere in these materials. These reconciliations and other information regarding these non-gaap measures are also available on the Investor Relations page of NCR's website at 22
23 GAAP TO NON-GAAP RECONCILIATION in millions Income from Operations (GAAP) to Non-Pension Operating Income (non-gaap) and Adjusted EBITDA (non-gaap) Q LTM FY 2014 Q LTM Income from Operations (GAAP) $689 $353 $340 FY 2015e Q2 2015e Q $625 - $690 $140 - $150 Pension Expense (Benefit) (86) Restructuring Plan Acquisition-Related Amortization of Intangibles Acquisition-Related Costs Acquisition-Related Purchase Price Adjustment OFAC and FCPA Investigations (1) Non-Pension Operating Income (non-gaap) $743 $820 $811 $830 - $870 Depreciation and Amortization Ongoing Pension Expense (12) (3) (2) (3) Stock Compensation Expense Adjusted EBITDA $904 $1,000 $996 $1,047 - $1,087 $190 - $200 $169 $210 (1) Estimated expenses for 2015 will be affected by, among other things, the status and progress of these matters. There can be no assurance that the Company will not be subject to fines or other remedial measures as a result of OFAC's, the SEC's or the DOJ's investigations. 23
24 GAAP TO NON-GAAP RECONCILIATION Q QTD Acquisitionrelated OFAC and Pension Q1 QTD Acquisitionrelated Q1 QTD Acquisitionrelated purchase FCPA (expense) 2015 Restructuring 2015 plan amortization GAAP costs price Investigations benefit non-gaap of intangibles in millions (except per share amounts) adjustments Product revenue $604 $ $ $ $ $ $ $604 Service revenue Total revenue 1,476 1,476 Cost of products 483 (1) (10) 472 Cost of services 603 (6) 597 Gross margin Gross margin rate 26.4% 0.1% 1.1% % % % % 27.6% Selling, general and administrative expenses 225 (16) (2) (1) 206 Research and development expenses Restructuring-related charges 15 (15) Total expenses 295 (15) (16) (2) (1) 261 Total expense as a % of revenue 20.0% (1)% (1.1)% (0.1)% % (0.1)% % 17.7% Income (loss) from operations Income (loss) from operations as a % of revenue 6.4% 1.1% 2.2% 0.1% % 0.1% % 9.9% Interest and Other (expense) income, net (51) (51) Income (loss) from continuing operations before income taxes Income tax expense (benefit) Effective tax rate 5% 21% Income (loss) from continuing operations Net income (loss) attributable to noncontrolling interests 2 2 Income (loss) from continuing operations (attributable to NCR) $40 $11 $21 $1 $ $ $ $73 Diluted earnings per share $0.23 $0.07 $0.12 $0.01 $ $ $ $0.43 Diluted shares outstanding
25 GAAP TO NON-GAAP RECONCILIATION Q QTD Acquisitionrelated OFAC and Pension Acquisitionrelated Q Acquisitionrelated purchase FCPA (expense) Q GAAP amortization non-gaap costs price Investigations benefit of intangibles in millions (except per share amounts) adjustments Product revenue $634 $634 Service revenue Total revenue 1,518 1,518 Cost of products 476 (10) (2) 464 Cost of services 626 (6) (1) Gross margin (1) 434 Gross margin rate 27.4% 1.1% % 0.2% % -0.1% 28.6% Selling, general and administrative expenses 245 (14) (14) (1) 216 Research and development expenses Total expenses 308 (14) (14) (1) 279 Total expense as a % of revenue 20.3% (0.9)% (0.9)% % (0.1)% % 18.4% Income (loss) from operations (1) 155 Income (loss) from operations as a % of revenue 7.1% 2.0% 0.9% 0.2% 0.1% (0.1)% 10.2% Interest and Other (expense) income, net (50) (50) Income (loss) from continuing operations before (1) 105 income taxes Income tax expense (benefit) (1) 18 Effective tax rate 7% 17% Income (loss) from continuing operations Net income (loss) attributable to noncontrolling interests 1 1 Income (loss) from continuing operations $53 $20 $10 $2 $1 $ $86 (attributable to NCR) Diluted earnings per share $0.31 $0.11 $0.06 $0.01 $0.01 $ $0.50 Diluted shares outstanding
26 GAAP TO NON-GAAP RECONCILIATION Q QTD Acquisitionrelated OFAC and Pension Q2 QTD Acquisitionrelated Q2 QTD Acquisitionrelated purchase FCPA (expense) amortization GAAP costs price Investigations benefit non-gaap of intangibles in millions (except per share amounts) adjustments Product revenue $722 $722 Service revenue Total revenue 1,658 1,658 Cost of products 531 (10) (1) 520 Cost of services 647 (6) (1) 640 Gross margin Gross margin rate 29.0% 1% % 0.1% % % 30% Selling, general and administrative expenses 247 (14) (6) (1) (1) 225 Research and development expenses 64 (1) 63 Total expenses 311 (14) (6) (1) (2) 288 Total expense as a % of revenue 18.8% (0.8)% (0.4)% % (0.1)% (0.1)% 17.4% Income (loss) from operations Income (loss) from operations as a % of 10.2% 1.8% 0.4% 0.1% 0.1% 0.1% 12.7% revenue Interest and Other (expense) income, net (49) (49) Income (loss) from continuing operations before income taxes Income tax expense (benefit) Effective tax rate 24% 27% Income (loss) from continuing operations Net income (loss) attributable to noncontrolling interests 1 1 Income (loss) from continuing operations $90 $20 $5 $2 $ $ $117 (attributable to NCR) Diluted earnings per share $0.53 $0.11 $0.03 $0.01 $ $ $0.68 Diluted shares outstanding
27 GAAP TO NON-GAAP RECONCILIATION FY 2014 Acquisitionrelated Acquisition- Acquisitionrelated OFAC and Pension FY 2014 Restructuring FY 2014 amortization related purchase FCPA (expense) GAAP plan non-gaap of costs price Investigations benefit in millions (except per share amounts) intangibles adjustments Product revenue $2,892 $2,892 Service revenue 3,699 3,699 Total revenue 6,591 6,591 Cost of products 2,153 (9) (39) (4) (3) 2,098 Cost of services 2,706 (47) (24) (2) (82) 2,551 Gross margin 1, ,942 Gross margin rate 26.3% 0.8% 1% % 0.1% % 1.3% 29.5% Selling, general and administrative 1,012 (56) (27) (3) (48) 878 expenses Research and development expenses 263 (19) 244 Restructuring-related charges 104 (104) Total expenses 1,379 (104) (56) (27) (3) (67) 1,122 Total expense as a % of revenue 20.9% (1.6)% (0.8)% (0.4)% % % (1.1)% 17% Income (loss) from operations Income (loss) from operations as a % of 5.4% 2.4% 1.8% 0.4% 0.1% % 2.3% 12.4% revenue Interest and Other (expense) income, net (216) 3 (213) Income (loss) from continuing operations before income taxes Income tax expense (benefit) (48) Effective tax rate (35)% 22% Income (loss) from continuing operations Net income (loss) attributable to noncontrolling interests Income (loss) from continuing operations $181 $116 $80 $20 $4 $2 $66 $469 (attributable to NCR) Diluted earnings per share $1.06 $0.68 $0.47 $0.12 $0.02 $0.01 $0.38 $2.74 Diluted shares outstanding
28 GAAP TO NON-GAAP RECONCILIATION Diluted Earnings per Share (GAAP) to Non-GAAP Diluted Earnings per Share (non-gaap) FY 2015e Diluted EPS (GAAP) $ $2.10 Pension Expense (Benefit) 0.01 Restructuring Plan Acquisition-Related Costs 0.04 Acquisition-Related Amortization of Intangibles 0.47 Acquisition-Related Purchase Price Adjustment OFAC and FCPA Investigations (1) Non-GAAP Diluted EPS $ $2.80 (1) Estimated expenses for 2015 will be affected by, among other things, the status and progress of these matters. There can be no assurance that the Company will not be subject to fines or other remedial measures as a result of OFAC's, the SEC's or the DOJ's investigations. 28
29 GAAP TO NON-GAAP RECONCILIATION Revenue Growth % (GAAP) to Revenue Growth % on a Constant Currency Basis (non-gaap) Q Revenue Growth % (GAAP) Favorable (unfavorable) FX impact Constant Currency Revenue Growth % (non-gaap) Financial Services 1% (8)% 9% Retail Solutions (9)% (5)% (4)% Hospitality (1)% (2)% 1% Emerging Industries % (8)% 8% Total Revenue (3)% (6)% 3% 29
30 GAAP TO NON-GAAP RECONCILIATION Revenue Growth % (GAAP) to Revenue Growth % on a Constant Currency Basis (non-gaap) Q Revenue Growth % (GAAP) Favorable (unfavorable) FX impact Constant Currency Revenue Growth % (non-gaap) Cloud 19% (1)% 20% Software License/ Software Maintenance 1% (5)% 6% Professional Services (3)% (6)% 3% Total Software Related 5% (4)% 9% Hardware (5)% (7)% 2% Other Services (5)% (7)% 2% Total Revenue (3)% (6)% 3% 30
31 GAAP TO NON-GAAP RECONCILIATION Operating Income Growth % (GAAP) to Operating Income Growth % on a Constant Currency Basis (non-gaap) Operating Income Growth % Reported Q Favorable (unfavorable) FX impact Constant Currency Operating Income Growth % (non- GAAP) Financial Services 2% (13)% 15% Retail Solutions (56)% (12)% (44)% Hospitality 50% % 50% Emerging Industries 75% (50)% 125% Total Operating Income (6)% (12)% 6% 31
32 GAAP TO NON-GAAP RECONCILIATION Operating Income Growth bps (GAAP) to Operating Income Growth bps on a Constant Currency Basis (non-gaap) Operating Income bps Growth Reported Q Favorable (unfavorable) FX impact Constant Currency Operating Income bps Growth (non- GAAP) Financial Services +20 bps -50 bps +70 bps Retail Solutions -370 bps -70 bps -300 bps Hospitality +410 bps bps +410 bps Emerging Industries +350 bps -160 bps +510 bps Total Operating Income -30 bps -60 bps +30 bps 32
33 33
Q EARNINGS CONFERENCE CALL BILL NUTI, CHAIRMAN & CEO MARK BENJAMIN, PRESIDENT & COO BOB FISHMAN, CFO
 1 Q2 2017 EARNINGS CONFERENCE CALL BILL NUTI, CHAIRMAN & CEO MARK BENJAMIN, PRESIDENT & COO BOB FISHMAN, CFO July 20, 2017 NOTES TO INVESTORS FORWARD-LOOKING STATEMENTS. Comments made during this conference
INVESTOR PRESENTATION
 INVESTOR PRESENTATION NOTES TO INVESTORS FORWARD-LOOKING STATEMENTS. These materials contain forward-looking statements. Statements that describe or relate to NCR's plans, goals, intentions, strategies,
NCR Announces Fourth Quarter and Full Year 2018 Results
 NCR Corporation Logo NCR Announces Fourth Quarter and Full Year 2018 Results February 7, 2019 ATLANTA--(BUSINESS WIRE)--Feb. 7, 2019-- NCR Corporation (NYSE: NCR) reported financial results today for the
XYLEM INC. Q EARNINGS RELEASE OCTOBER 30, 2018
 XYLEM INC. Q3 2018 EARNINGS RELEASE OCTOBER 30, 2018 Q3 2018 EARNINGS RELEASE FORWARD-LOOKING STATEMENTS This presentation contains information that may constitute forward-looking statements. within the
Supplementary Materials First Quarter Fiscal 2018 Earnings Call
 Supplementary Materials First Quarter Fiscal 2018 Earnings Call November 2, 2017 Safe Harbor This document contains forwardlooking statements within the meaning of the Private Securities Litigation Reform
ALLEGION REPORTS FOURTH-QUARTER, FULL-YEAR 2016 FINANCIAL RESULTS, PROVIDES 2017 OUTLOOK
 ALLEGION REPORTS FOURTH-QUARTER, FULL-YEAR 2016 FINANCIAL RESULTS, PROVIDES 2017 OUTLOOK Fourth-quarter 2016 earnings per share from continuing operations (EPS) of $0.77, compared with 2015 EPS of $0.74;
Q Earnings. July 26, 2017
 Q3 2017 Earnings July 26, 2017 Forward-Looking Statements and Non-GAAP Measures Forward-Looking Statements This presentation contains certain forward-looking statements within the meaning of the U.S. Private
XYLEM INC. Q EARNINGS RELEASE FEBRUARY 1, 2018
 XYLEM INC. Q4 2017 EARNINGS RELEASE FEBRUARY 1, 2018 Q4 2017 EARNINGS RELEASE FORWARD-LOOKING STATEMENTS This presentation contains information that may constitute forward-looking statements. Forward-looking
ORACLE CORPORATION. Q4 FISCAL 2013 FINANCIAL RESULTS CONDENSED CONSOLIDATED STATEMENTS OF OPERATIONS ($ in millions, except per share data)
") Q4 FISCAL 2013 FINANCIAL RESULTS CONDENSED CONSOLIDATED STATEMENTS OF OPERATIONS ( in millions, except per share data) REVENUES Software Revenues Hardware systems support Hardware Systems Revenues Services
Q4 FISCAL 2013 FINANCIAL RESULTS CONDENSED CONSOLIDATED STATEMENTS OF OPERATIONS ( in millions, except per share data) REVENUES Software Revenues Hardware systems support Hardware Systems Revenues Services
FOURTH QUARTER & FULL YEAR 2018 EARNINGS CONFERENCE CALL. February 13, 2019
 FOURTH QUARTER & FULL YEAR 2018 EARNINGS CONFERENCE CALL February 13, 2019 Overview Fourth quarter 2018 net revenue increased 13.3% o Organic growth of net revenue was 7.1% US organic growth was 6.3% International
New York City November 7, 2018
 1 New York City November 7, 2018 FORWARD-LOOKING STATEMENTS. Comments made during this presentation and in these materials contain forward-looking statements. Statements that describe or relate to NCR's
XYLEM INC. Q EARNINGS RELEASE MAY 1, 2018
 XYLEM INC. Q1 2018 EARNINGS RELEASE MAY 1, 2018 Q1 2018 EARNINGS RELEASE FORWARD-LOOKING STATEMENTS This presentation contains information that may constitute forward-looking statements. Forward-looking
Q Earnings. November 1, 2017
 Q4 2017 Earnings November 1, 2017 Forward-Looking Statements and Non-GAAP Measures Forward-Looking Statements This presentation contains certain forward-looking statements within the meaning of the U.S.
Fiscal Year 2016 Fourth Quarter Conference Call
 Fiscal Year 2016 Fourth Quarter Conference Call November 7, 2016 2 Safe Harbor Statement This presentation includes statements related to the expected future results of the company and are therefore forward-looking
XYLEM INC. Q EARNINGS RELEASE JULY 31, 2018
 XYLEM INC. Q2 2018 EARNINGS RELEASE JULY 31, 2018 Q2 2018 EARNINGS RELEASE FORWARD-LOOKING STATEMENTS This presentation contains information that may constitute forward-looking statements. within the meaning
HP Q1 FY15 Earnings Announcement
 HP Q1 FY15 Earnings Announcement February 24, 2015 http://www.hp.com/investor/home Forward-looking statements This presentation contains forward-looking statements that involve risks, uncertainties and
HP Q3 FY15 Earnings Announcement
 HP Q3 FY15 Earnings Announcement August 20, 2015 http://www.hp.com/investor/home Forward-looking statements This presentation contains forward-looking statements that involve risks, uncertainties and assumptions.
Q Earnings Report. Sabre Corporation August 4, 2015
 Q2 2015 Earnings Report Sabre Corporation August 4, 2015 1 Forward-looking Statements Forward Looking Statements Certain statements herein are forward-looking statements about trends, future events, uncertainties
Q Earnings. April 26, 2017
 Q2 2017 Earnings April 26, 2017 Forward-Looking Statements and Non-GAAP Measures Forward-Looking Statements This presentation contains certain forward-looking statements within the meaning of the U.S.
Q EARNINGS CALL FEBRUARY 20, 2018
 Q4 2017 EARNINGS CALL FEBRUARY 20, 2018 1 IMPORTANT INFORMATION Forward Looking Statements These slides contain (and the accompanying oral discussion will contain) forward looking statements. All statements
Q Earnings. January 25, 2017
 Q1 2017 Earnings January 25, 2017 Forward-Looking Statements and Non-GAAP Measures Forward-Looking Statements This presentation contains certain forward-looking statements within the meaning of the U.S.
PTC PREPARED REMARKS FOURTH QUARTER AND FULL YEAR FISCAL 2017 OCTOBER 25, 2017
 PTC PREPARED REMARKS FOURTH QUARTER AND FULL YEAR FISCAL 2017 OCTOBER 25, 2017 Please refer to the Important Disclosures section of these prepared remarks for important information about our operating
HPE Q3 FY17 Earnings Announcement
 HPE Q3 FY17 Earnings Announcement September 5, 2017 http://www.investors.hpe.com Forward-looking statements This presentation contains forward-looking statements that involve risks, uncertainties and assumptions.
McKesson Corporation Fiscal 2018 Financial Performance Fiscal 2019 Annual Outlook. Financial Results and Company Highlights May 24, 2018
 McKesson Corporation Fiscal 2018 Financial Performance Fiscal 2019 Annual Outlook Financial Results and Company Highlights Forward-Looking Statements Some of the information in this presentation is not
Q Earnings. January 23, 2019
 Q1 2019 Earnings January 23, 2019 Forward-Looking Statements and Non-GAAP Financial Measures Forward-Looking Statements This presentation contains certain forward-looking statements within the meaning
Sabre Reports Third Quarter 2015 Results
 Sabre Reports Third Quarter 2015 Results Revenue + 16.7%, Adjusted EBITDA + 12.1% and Adjusted EPS + 26.1% Double digit year-over-year increases in Revenue, Adjusted EBITDA and Adjusted EPS Reaffirming
ORACLE CORPORATION. Q1 FISCAL 2016 FINANCIAL RESULTS CONDENSED CONSOLIDATED STATEMENTS OF OPERATIONS ($ in millions, except per share data)
") CONDENSED CONSOLIDATED STATEMENTS OF OPERATIONS ($ in millions, except per share data) REVENUES % Increase Three Months Ended August 31, % Increase (Decrease) % of % of (Decrease) in Constant 2015 Revenues
CONDENSED CONSOLIDATED STATEMENTS OF OPERATIONS ($ in millions, except per share data) REVENUES % Increase Three Months Ended August 31, % Increase (Decrease) % of % of (Decrease) in Constant 2015 Revenues
Q2 18 Earnings Report
 Q2 18 Earnings Report July 31, 2018 2018 Sabre GLBL Inc. All rights reserved. 1 Forward-looking statements Forward-looking Statements Certain statements herein are forward-looking statements about trends,
Sabre reports fourth quarter and full-year 2018 results
 Sabre reports fourth quarter and full-year 2018 results Fourth quarter 2018 highlights: Revenue increased 4.8% Net income attributable to common stockholders increased 2.8% to $84.4 million Diluted net
Staples, Inc. Earnings Webcast Second Quarter August 17, 2011
 Staples, Inc. Earnings Webcast Second Quarter 2011 August 17, 2011 1 Safe Harbor Forward Looking Statements Safe Harbor Certain remarks that we may make about management s future expectations, plans and
Contact: Ken Bond Deborah Hellinger Oracle Investor Relations Oracle Corporate Communications
 For Immediate Release Contact: Ken Bond Deborah Hellinger Oracle Investor Relations Oracle Corporate Communications 1.650.607.0349 1.212.508.7935 ken.bond@oracle.com deborah.hellinger@oracle.com ORACLE
Q3 Fiscal Year 2019 Financial Highlights
 Q3 Fiscal Year 2019 Financial Highlights For the quarter ended October 31, 2018 November 29, 2018 Forward Looking Statements Certain statements in this communication may contain forward looking statements
Q Earnings. October 31, 2018
 Q4 2018 Earnings October 31, 2018 Forward-Looking Statements and Non-GAAP Financial Measures Forward-Looking Statements This presentation contains certain forward-looking statements within the meaning
2017 Annual Meeting of Stockholders 2017 ANNUAL MEETING OF STOCKHOLDERS 1
 2017 Annual Meeting of Stockholders 2017 ANNUAL MEETING OF STOCKHOLDERS 1 Agenda Call to Order and Welcome Call of the Meeting and Presence of Quorum Proposals Proposal 1. Election of Directors Proposal
HPE Q2 FY16 Earnings Announcement May 24,
 HPE Q2 FY16 Earnings Announcement May 24, 2016 http://www.investors.hpe.com Forward-looking statements This presentation contains forward-looking statements that involve risks, uncertainties and assumptions.
PTC SECOND QUARTER FISCAL 2017 PREPARED REMARKS APRIL 19, 2017
 PTC SECOND QUARTER FISCAL 2017 PREPARED REMARKS APRIL 19, 2017 Please refer to the Important Disclosures section of these prepared remarks for important information about our operating metrics (including
HPE Q2 FY17 Earnings Announcement
 HPE Q2 FY17 Earnings Announcement May 31, 2017 http://www.investors.hpe.com Forward-looking statements This presentation contains forward-looking statements that involve risks, uncertainties and assumptions.
Teradata Reports 2018 First Quarter Results
 NEWS RELEASE Teradata Reports 2018 First Quarter Results Better than expected first quarter revenue of $506 million Bookings mix shift to subscription moving faster than expected Recurring revenue increased
CADENCE REPORTS FOURTH QUARTER AND FISCAL YEAR 2017
 CADENCE REPORTS FOURTH QUARTER AND FISCAL YEAR 2017 CADENCE DESIGN SYSTEMS, INC. CFO COMMENTARY January 31, 2018 Q4 2017 Key Takeaways Strong, consistent financial results for Q4 with key metrics meeting
NIELSEN REPORTS 2nd QUARTER 2018 RESULTS Conducting a Strategic Review of Buy Segment
 News Release Investor Relations: Sara Gubins, +1 646 654 8153 Media Relations: Laura Nelson, +1 203 563 2929 NIELSEN REPORTS 2nd QUARTER 2018 RESULTS Conducting a Strategic Review of Buy Segment New York,
Q Earnings Call. November 5, 2012
 Q4 2012 Earnings Call November 5, 2012 Forward-Looking Statements and Non-GAAP Measures Forward-Looking Statements -- This presentation contains certain forward-looking statements within the meaning of
HP INC. Q1 FY19. February 27,
 HP INC. Q1 FY19 February 27, 2019 http://investor.hp.com 1 Forward-looking statements This presentation contains forward-looking statements that involve risks, uncertainties and assumptions. If the risks
August 8, Conduent Q Earnings Results
 August 8, 2018 Conduent Q2 2018 Earnings Results Cautionary Statements Forward-Looking Statements This report contains forward-looking statements, as defined in the Private Securities Litigation Reform
Q3 Fiscal Year 2016 Financial Results January 20, 2016
 Q3 Fiscal Year 2016 Financial Results January 20, 2016 FORWARD-LOOKING STATEMENTS This presentation contains forward-looking statements within the meaning of the federal securities laws, including, without
Teradata Reports 2014 Third Quarter Results
 NEWS RELEASE Teradata Reports 2014 Third Quarter Results Revenue of $667 million, up 1 percent in constant currency (1) GAAP EPS $0.60, non-gaap EPS $0.71 (2) Year-to-date Cash from Operations increased
Sabre reports third quarter 2018 results
 Sabre reports third quarter 2018 results Sabre third quarter revenue increased 7.7% to $970.3 million Travel Network revenue rose 10.7%; bookings grew 7.7% Airline Solutions revenue increased 1.1% Hospitality
2018 FOURTH QUARTER EARNINGS CALL
 NORTH AMERICA S LEADING BUILDING MATERIALS DISTRIBUTOR RESIDENTIAL COMMERCIAL INTERIOR SOLAR 2018 FOURTH QUARTER EARNINGS CALL Forward Looking Statements / Non-GAAP Measures This presentation contains
Q Earnings. July 20, 2016
 Q3 2016 Earnings July 20, 2016 Forward-Looking Statements and Non-GAAP Measures Forward-Looking Statements This presentation contains certain forward-looking statements within the meaning of the U.S. Private
PTC PREPARED REMARKS THIRD QUARTER FISCAL 2018 JULY 18, 2018
 PTC PREPARED REMARKS THIRD QUARTER FISCAL 2018 JULY 18, 2018 Please refer to the updated Important Disclosures section of these prepared remarks for important information about our operating metrics (including
Sabre Reports Fourth Quarter and Full Year 2014 Results
 Sabre Reports Fourth Quarter and Full Year 2014 Results Airline and Hospitality Solutions Momentum Continues, Including New Fourth Quarter Agreements With Alitalia, Copa and Wyndham Travelocity Segment
Gates Industrial Reports Strong Fourth-Quarter and Full-Year 2017 Results
 Gates Industrial Reports Strong Fourth-Quarter and Full-Year 2017 Results Fourth-Quarter 2017 Highlights Record fourth-quarter sales of $781.8 million, a 17.1% increase over prior-year quarter Net income
TE Connectivity Reports Fiscal Fourth Quarter and Full Year Results
 TE Connectivity Reports Fiscal Fourth Quarter and Full Year Results SCHAFFHAUSEN, Switzerland October 28, 2015 TE Connectivity Ltd. (NYSE: TEL) today reported results for the fiscal fourth quarter and
Q Earnings Call. April 24, 2013
 Q2 2013 Earnings Call April 24, 2013 Forward-Looking Statements and Non-GAAP Measures Forward-Looking Statements -- This presentation contains certain forward-looking statements within the meaning of the
Fourth Quarter and Full Year 2017 Financial Results. January 26, 2018
 Fourth Quarter and Full Year 2017 Financial Results January 26, 2018 Investor Information Forward-Looking Statements This presentation contains forward-looking statements within the meaning of the Private
Safe Harbor. Non-GAAP Financial Information
 1 Safe Harbor This document contains forward-looking statements within the meaning of the Private Securities Litigation Reform Act of 1995, including financial projections subject to risks, uncertainties
Science Applications International Corporation (SAIC) Third Quarter Fiscal Year 2018 Earnings Call. December 7, 2017
 Third Quarter Fiscal Year 2018 Earnings Call. December 7, 2017") Science Applications International Corporation (SAIC) Third Quarter Fiscal Year 2018 Earnings Call December 7, 2017 Supplemental Financial Information Conference Call Information Date: December 7, 2017
Science Applications International Corporation (SAIC) Third Quarter Fiscal Year 2018 Earnings Call December 7, 2017 Supplemental Financial Information Conference Call Information Date: December 7, 2017
Sabre reports first quarter 2017 results
 Sabre reports first quarter 2017 results First quarter revenue increased 6.5% Airline and Hospitality Solutions revenue grew 8.2% Travel Network revenue rose 6.1%, with bookings growth of 5.8% Net income
IDEXX Laboratories Announces Third Quarter Results
 FOR IMMEDIATE RELEASE Contact: Kerry Bennett, Investor Relations, 1-207-556-8155 IDEXX Laboratories Announces Third Quarter Results Reports revenue growth of 11% on a reported basis and 12% on an organic
3Q Fiscal 2017 ADP Earnings Call & Webcast. May 3, 2017
 3Q Fiscal 2017 ADP Earnings Call & Webcast May 3, 2017 Forward Looking Statements This presentation and other written or oral statements made from time to time by ADP may contain forward-looking statements
HP Inc. Q4 FY17 Earnings Announcement. November 21, 2017
 HP Inc. Q4 FY17 Earnings Announcement November 21, 2017 http://www.hp.com/investor/home Forward-looking statements This presentation contains forward-looking statements that involve risks, uncertainties
Q Earnings. April 25, 2018
 Q2 2018 Earnings April 25, 2018 Forward-Looking Statements and Non-GAAP Measures Forward-Looking Statements This presentation contains certain forward-looking statements within the meaning of the U.S.
4 th Quarter 2018 Earnings Release Conference Call
 4 th Quarter 2018 Earnings Release Conference Call February 20, 2019 1 2019 Belden Inc. belden.com @beldeninc Safe Harbor Statement Our commentary and responses to your questions may contain forward-looking
HP Q4 FY15 Earnings Announcement
 HP Q4 FY15 Earnings Announcement November 24, 2015 http://www.hp.com/investor/home Forward-looking statements This presentation contains forward-looking statements that involve risks, uncertainties and
CFO COMMENTARY Q4 FY 2018
 Q4 FY 2018 FINANCIAL INFORMATION AND CONFERENCE CALL Please see the accompanying earnings press release available at www.scansource.com in the Investor Relations section. The information included in this
1Q 2011 Earnings Presentation April 19,
 1Q 2011 Earnings Presentation April 19, 2011 Forward Looking Statements and Non-GAAP Information Certain comments made in this presentation may be characterized as forward looking under the Private Securities
CARBONITE (NASDAQ: CARB)
") CARBONITE (NASDAQ: CARB) FOURTH QUARTER AND FY 2016 FINANCIAL RESULTS Thursday, February 9 th 2017 JERRY SISITSKY VP, Investor Relations Phone: 781-928-0713 Email: investor.relations@carbonite.com (NASDAQ:
CARBONITE (NASDAQ: CARB) FOURTH QUARTER AND FY 2016 FINANCIAL RESULTS Thursday, February 9 th 2017 JERRY SISITSKY VP, Investor Relations Phone: 781-928-0713 Email: investor.relations@carbonite.com (NASDAQ:
Supplementary Materials. For use in conjunction with the November 2, 2016 Earnings Call
 Supplementary Materials For use in conjunction with the November 2, 2016 Earnings Call 1 Safe Harbor This document contains forward-looking information and financial projections subject to risks, uncertainties
PTC PREPARED REMARKS SECOND QUARTER FISCAL 2018 APRIL 18, 2018
 PTC PREPARED REMARKS SECOND QUARTER FISCAL 2018 APRIL 18, 2018 Please refer to the Important Disclosures section of these prepared remarks for important information about our operating metrics (including
Q4 & FY 2018 Results. January 30, 2019
 Q4 & FY 2018 Results January 30, 2019 This presentation contains a number of forwardlooking statements. Words, and variations of words, such as will, expect, may, believe, estimate, deliver, potential,
Earnings Conference Call
 FOURTH QUARTER 2018 Earnings Conference Call Patrick Harshman, President & CEO Sanjay Kalra, CFO 2019 Harmonic Inc. All rights 2019 reserved Harmonic worldwide. Inc. All rights reserved worldwide. February
3 rd Quarter 2018 Earnings Release Conference Call
 3 rd Quarter 2018 Earnings Release Conference Call October 31, 2018 1 2018 Belden Inc. belden.com @beldeninc Safe Harbor Statement Our commentary and responses to your questions may contain forward-looking
SENSATA SECOND QUARTER 2017 EARNINGS PRESENTATION JULY 25, 2017
 SENSATA SECOND QUARTER 2017 EARNINGS PRESENTATION JULY 25, 2017 Forward-Looking Statements In addition to historical facts, this earnings presentation, including any documents incorporated by reference
Symantec Reports Fourth Quarter and Fiscal Year 2017 Results
 Logo Financial Highlights Symantec Reports Fourth Quarter and Fiscal Year 2017 Results Q4 GAAP revenue $1.115 billion, up 28% year over year; non-gaap revenue $1.176 billion, up 35% year over year Fiscal
Q Earnings. April 20, 2016
 Q2 2016 Earnings April 20, 2016 Forward-Looking Statements and Non-GAAP Measures Forward-Looking Statements This presentation contains certain forward-looking statements within the meaning of the U.S.
DISCOVERY COMMUNICATIONS REPORTS THIRD QUARTER 2016 RESULTS
 DISCOVERY COMMUNICATIONS REPORTS THIRD QUARTER 2016 RESULTS Third Quarter 2016 Financial Highlights: Revenues of $1,556 million were flat vs. last year (increased 3% excluding currency effects) DCI Net
PTC THIRD QUARTER FISCAL 2016 PREPARED REMARKS JULY 20, 2016
 PTC THIRD QUARTER FISCAL 2016 PREPARED REMARKS JULY 20, 2016 Please refer to the Important Disclosures section of these prepared remarks for important information about our operating metrics (including
IBM 4Q 2017 Earnings. January 18, ibm.com/investor
 IBM 4Q 2017 Earnings January 18, 2018 ibm.com/investor Forward Looking Statements and Non-GAAP Information 2 Certain comments made in this presentation may be characterized as forward looking under the
ZEBRA TECHNOLOGIES SECOND-QUARTER 2016 RESULTS. August 9, 2016
 ZEBRA TECHNOLOGIES SECOND-QUARTER 2016 RESULTS August 9, 2016 Anders Gustafsson Chief Executive Officer Mike Smiley Chief Financial Officer 2 Safe Harbor Statement Statements made in this presentation
Third Quarter 2018 Earnings Call November 2, 2018
 Third Quarter 2018 Earnings Call November 2, 2018 Forward-Looking Statements This supplemental information contains forward-looking statements within the meaning of the Private Securities Litigation Reform
Fourth Quarter and FY 2018 Earnings Presentation November 28, 2018
 Fourth Quarter and FY 2018 Earnings Presentation November 28, 2018 Cautionary statements This presentation contains forward-looking statements that are subject to known and unknown risks and uncertainties,
Gardner Denver Reports Strong Second Quarter 2018 Results and Raises Full Year 2018 Adjusted EBITDA Midpoint Guidance
 August 1, 2018 Gardner Denver Reports Strong Second Quarter 2018 Results and Raises Full Year 2018 Adjusted EBITDA Midpoint Guidance Revenues of $668.2 million increased 15% over the prior year, supported
Q215 Earnings Call. August 5, Silver Spring Networks. All rights reserved.
 Earnings Call August 5, 2015 Forward-Looking Statements This document contains forward-looking statements that involve risks and uncertainties. These forwardlooking statements include statements regarding
SECOND QUARTER 2018 BUSINESS REVIEW. Jonathan W. Painter, President & CEO Michael J. McKenney, Executive Vice President & CFO
 SECOND QUARTER 2018 BUSINESS REVIEW Jonathan W. Painter, President & CEO Michael J. McKenney, Executive Vice President & CFO Forward-Looking Statements The following constitutes a Safe Harbor statement
Financial results & business update
 Financial results & business update Quarter ended 31 March 2019 16 April 2019 Disclaimer Any remarks that we may make about future expectations, plans and prospects for the company constitute forward-looking
Financial results & business update. Quarter and year ended 31 December February 2016
 Financial results & business update Quarter and year ended 31 December 2015 11 February 2016 Disclaimer 3 Any remarks that we may make about future expectations, plans and prospects for the company constitute
Sabre reports first quarter 2018 results
 Sabre reports first quarter 2018 results First quarter revenue increased 8.0% Travel Network revenue rose 8.7%, with bookings growth of 5.7% Airline Solutions revenue grew 6.7% Hospitality Solutions revenue
UNITED STATES SECURITIES AND EXCHANGE COMMISSION WASHINGTON, DC FORM 8-K
 UNITED STATES SECURITIES AND EXCHANGE COMMISSION WASHINGTON, DC 20549 FORM 8-K CURRENT REPORT Pursuant to Section 13 or 15(d) of the Securities Exchange Act of 1934 Date of Report (Date of earliest event
Reconciliation of Non-GAAP Items Required by SEC Rules
 2016 ACTUAL RESULTS CVS Health is providing non-gaap information that excludes certain items because of the nature of these items and the impact they have on the analysis of underlying business performance
Bottomline Technologies Reconciliation to Non GAAP Measures Three Months Ended June 30, 2013
 Reconciliation to Measures Three Months Ended June 30, 2013 Non Cash Amortization of Equity Based Integration Restructuring Interest GAAP Intangible Assets Compensation Related Expenses Expenses Expense
Q Earnings. November 2, 2016
 Q4 2016 Earnings November 2, 2016 Forward-Looking Statements and Non-GAAP Measures Forward-Looking Statements This presentation contains certain forward-looking statements within the meaning of the U.S.
Supplementary Materials Second Quarter Fiscal 2018 Earnings Call
 Supplementary Materials Second Quarter Fiscal 2018 Earnings Call February 1, 2018 1 Safe Harbor This document contains forwardlooking statements within the meaning of the Private Securities Litigation
HP INC. Q1 FY18. February 22,
 HP INC. Q1 FY18 February 22, 2018 http://www.hp.com/investor/home Forward-looking statements This presentation contains forward-looking statements that involve risks, uncertainties and assumptions. If
Johnson Controls reports solid fourth quarter and full year earnings and provides fiscal 2018 guidance
 FOR IMMEDIATE RELEASE CONTACT: Investors: Antonella Franzen (609) 720-4665 Ryan Edelman (609) 720-4545 Media: Fraser Engerman (414) 524-2733 Johnson Controls reports solid fourth quarter and full year
February 21, Fourth Quarter 2018 Results
 February 21, 2019 Fourth Quarter 2018 Results Forward-looking statements This presentation, as well as other statements made by Delphi Technologies PLC (the Company ), contains forward-looking statements
CFO Commentary on Second Quarter 2017 Preliminary Financial Results
 Juniper Networks, Inc. 1133 Innovation Way Sunnyvale, CA 94089 July 25, 2017 CFO Commentary on Second Quarter 2017 Preliminary Financial Results Related Information The following commentary is provided
Q1 Fiscal Year 2019 Financial Highlights
 Fiscal Year 2019 Financial Highlights For the quarter ended April 30, 2018 May 31, 2018 Forward-Looking Statements Certain statements in this communication may contain forward-looking statements within
THIRD QUARTER 2016 EARNINGS CONFERENCE CALL. October 21, 2016
 THIRD QUARTER 2016 EARNINGS CONFERENCE CALL October 21, 2016 Overview Third Quarter 2016 Total revenue increased 3.0% in Q3 and 3.0% for the 9M YTD Organic growth was 4.3% in Q3 and 4.8% for the 9M YTD
First Quarter 2018 Earnings Call. May 10, 2018
 First Quarter 2018 Earnings Call May 10, 2018 Forward-Looking Statements This presentation includes certain statements relating to future events and our intentions, beliefs, expectations, and predictions
IBM 1Q 2018 Earnings. April 17, ibm.com/investor
 IBM 1Q 2018 Earnings April 17, 2018 ibm.com/investor Forward Looking Statements and Non-GAAP Information 2 Certain comments made in this presentation may be characterized as forward looking under the Private
Where Intelligence Meets Infrastructure
 Where Intelligence Meets Infrastructure Earnings Conference Call For The Fourth Quarter and Year Ended September 30, 2018 November 6, 2018 These slides are not intended to be a stand-alone presentation,