Simple and easy to understand business model. Dominant in its industry. Superior returns on capital. Sustainable competitive advantage
|
|
|
- Poppy Horton
- 5 years ago
- Views:
Transcription


1 January 2019
 under the WD-40, 3-IN-ONE and GT85 brand names.")
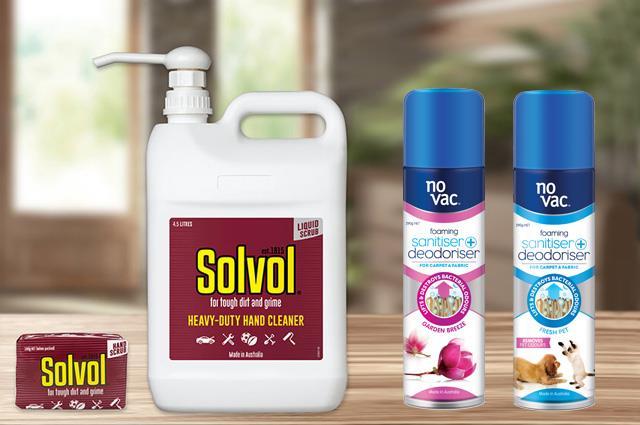
2 Historical financial and operating data in this presentation reflect the consolidated results of WD-40 Company, its subsidiaries and its legal entities. WD-40 Company markets maintenance products ( MP ) under the WD-40, 3-IN-ONE and GT85 brand names. Currently included in the WD-40 brand are the WD-40 Multi-Use Product and the WD-40 Specialist and WD-40 BIKE product lines. WD-40 Company markets the following homecare and cleaning ( HCCP ) brands: X-14 mildew stain remover and automatic toilet bowl cleaners, 2000 Flushes automatic toilet bowl cleaners, Carpet Fresh and no vac rug and room deodorizers, Spot Shot aerosol and liquid carpet stain removers, 1001 household cleaners and rug and room deodorizers and Lava and Solvol heavy-duty hand cleaners. Except for the historical information contained herein, this presentation contains forward-looking statements within the meaning of the Private Securities Litigation Reform Act of Such statements reflect the Company s current expectations with respect to currently available operating, financial and economic information. These forward-looking statements are subject to certain risks, uncertainties and assumptions that could cause actual results to differ materially from those anticipated in or implied by the forward-looking statements. Our forward-looking statements include, but are not limited to, discussions about future financial and operating results, including: growth expectations for certain products; expected levels of promotional and advertising spending; plans for and success of product innovation, the impact of new product introductions on the growth of sales; anticipated results from product line extension sales; the impacts of the Tax Cuts and Jobs Act ; and forecasted foreign currency exchange rates and commodity prices. Our forward-looking statements are generally identified with words such as believe, expect, intend, plan, could, may, aim, anticipate, estimate and similar expressions. The Company's expectations, beliefs and forecasts are expressed in good faith and are believed by the Company to have a reasonable basis, but there can be no assurance that the Company's expectations, beliefs or forecasts will be achieved or accomplished. Actual events or results may differ materially from those projected in forward-looking statements due to various factors, including, but not limited to, those identified in Part I Item 1A, Risk Factors, in the Company s Annual Report on Form 10-K for the fiscal year ended August 31, 2018 which the Company filed with the SEC on October 22, 2018 and in the Company s Quarterly Report on Form 10-Q for the period ended November 30, 2018 which the Company filed with the SEC on January 9, All forward-looking statements included in this presentation should be considered in the context of these risks. All forward-looking statements speak only as of January 9, 2019 and we undertake no obligation to update or revise any forward-looking statements, whether as a result of new information, future events or otherwise. Investors and prospective investors are cautioned not to place undue reliance on our forwardlooking statements. 2


3
4 Simple and easy to understand business model Dominant in its industry Superior returns on capital Sustainable competitive advantage Significant cash flow generation Strong balance sheet Growth opportunities Proven management team 4


5 In the 1950 s a chemist in San Diego set out to create a compound that would prevent rust and corrosion. It took him 40 attempts to get the water displacing formula right, but the end result became the original secret formula for WD-40 Multi-Use Product Rocket Chemical Company Incorporated WD-40 MUP is used by aerospace industry and on the SM-65 Atlas missile 1958 WD-40 Multi-Use Product makes appearance on store shelves in San Diego 1970 The name WD-40 Company was adopted 1973 WD-40 Company goes public on the NASDAQ; stock increases 61% on first trading day 1997 Garry Ridge named president and CEO 2008 International sales exceed domestic sales for the first time in Company s history 2005 WD-40 Smart Straw successfully launched 2011 WD-40 Specialist product line successfully launched 2015 WD-40 EZ- REACH successfully launched In 2018 Company celebrates 65 th anniversary, flagship WD-40 brand is more popular than ever, achieved over $408 million in net sales and products are available in over 176 countries and territories worldwide 5


6 Currently make up ~90% of net sales Core strategic focus and primary growth engine Available in niche segments and geographies Generate positive cash flows but are not core strategic focus 6

7 7

8 8

9 9
10

11 11

12 The shield carries with it positive brand equity - the brand is memorable, easily recognizable, and known for its superiority in quality and reliability. Similar to Coca-Cola, Kentucky Fried Chicken and Google, the formula for WD-40 Multi-Use Product is a trade secret so protected that there was never a patent filed for it. 12


13 Question Result Average of all questions 93.3 I love to tell people that I work for WD-40 Company I feel my opinions and values are a good fit with the WD-40 Company culture I understand how my job contributes to achieving WD-40 Company s goals I know what results are expected of me I am clear on the company s goals I respect my coach WD-40 Company s vision and mission motivates me to help the company succeed I feel like I am a valued member of my functional team I am excited about WD-40 Company s future direction WD-40 Company encourages employees to continually improve in their job My definition of success is having the opportunity to enjoy what I do for a living and I have found that here. I am inspired by every tribe member and our ability to make a difference in our end-users life every day. - Claudia Fenske, Sales Director 13

14 Our products are currently available in 176 countries and territories worldwide and in over 62 unique trade channels Aircraft Supplies Appliance Repair Automotive Bicycle Big Box Body Shop Building Supplies Chemicals Drug Store E-Commerce Electrical Equipment Farming Equipment Grocery Hardware HVAC Industrial Supplies Janitorial Lawn and Garden Locksmith Marine Motorcycle Office Supplies Plumbing Refrigeration Sporting Goods Welding Equipment The Company s unique infrastructure enables it to take its products to more places, with more people, who have more uses, more frequently. 14

15 15


16 The majority of sales of maintenance products come from end-users in workshops and factories 8 out of 10 U.S. households have at least one can of WD-40 Multi-Use Product in their home Annual usage amounts vary dramatically among our end users $70.00 per year $0.40 per year 16
17

18 18


19 Anticipated Target 1. Grow WD-40 Multi-Use Product Maximize the product line through geographic expansion, increased market penetration and development of new and unique delivery systems. More places, more people, more uses, more frequently. Grow WD-40 Multi-Use Product to $530 million in net sales by the end of Grow the WD-40 Specialist Product Line Leverage the WD-40 Specialist line to create growth through continued geographic expansion as well as by developing new products and product categories within identified platforms. Grow WD-40 Specialist to $100 million in net sales by the end of Broaden Product and Revenue Base Leverage the recognized strengths of WD-40 Company to derive revenue from existing brands as well as from new sources and products. Continue to grow, nurture, develop or acquire products that fit well with our unique multi-channel distribution network and grow to $70 million in net sales by the end of Attract, Develop and Retain Outstanding Tribe Members Succeed as a tribe while excelling as individuals. Grow employee engagement to greater than 95 percent 5. Operational Excellence Continuous improvement by optimizing resources, systems and processes as well as applying rigorous commitment to quality assurance, regulatory compliance, and intellectual property protection. Execute the 55/30/25 business model while safeguarding the Power of the Shield Anticipated targets for revenue are projected by the end of FY2025 and are based on the Company's expectations, beliefs and forecasts. They are expressed in good faith and are believed by the Company to have a reasonable basis, but there can be no assurance that they will be achieved or accomplished. 19


20 20
21 Our 2025 brands have grown at a compounded annual growth rate of 5.3% over the last 10-years $248 $278 $ Brands Revenue (1) (In millions) $298 $326 $335 $342 $359 $377 $397 FY09 FY10 FY11 FY12 FY13 FY14 FY15 FY16 FY17 FY18 1) FY18 presented as reported, all prior years presented on a constant currency basis using FY18 foreign currency exchange rates. 21
22 We estimate the potential global market opportunity for WD-40 Multi-Use Product to be ~$1.0B (1) $100 India China Indonesia Germany Iran Saudi Arabia Brazil Russia Mexico Venezuela Eqypt Thailand Turkey South Korea Nigeria Algeria Columbia Spain Italy Canada $0 1) Based on Industrial Value Added (IVA) / Purchase Price Parity (PPP) third-party benchmarking. WD-40 Company s estimated IVA/PPP figure is calculated using country GDP 22 (PPP) data, which is a country's GDP converted into international dollars using the PPP index, then multiplied by the country's IVA (% GDP) figure.


23 CLASSIC CAN EZ-REACH Premiumization of the blue and yellow can with the little red top creates opportunities for revenue growth and gross margin expansion 23

24 24


25 General Maintenance Lawn and Garden 25

26 Make it EASY TO BUY by maximizing store placement and shelf space 26


27 Continue to derive revenue from existing brands as well as from new sources and products 27
 1) Anticipated targets for revenue are projected by the end of FY2025 and are based on the Company's")

28 FY 2008 Reported Revenue $317M FY 2018 Reported Revenue $408M FY 2025 Anticipated Revenue Target ~$700M (1) $219M $314M ~$530M $56M $52M $31M ~$100M ~$70M Revenue Generated by Strategic Initiative #1 Revenue Generated by Strategic Initiative #2 Revenue Generated by Strategic Initiative #3 (2) 1) Anticipated targets for revenue are projected by the end of FY2025 and are based on the Company's expectations, beliefs and forecasts. They are expressed in good faith and are believed by the Company to have a reasonable basis, but there can be no assurance that they will be achieved or accomplished. Historical revenue numbers have not been adjusted for changes in foreign currency exchange rates. 2) Strategic Initiative #3 includes WD-40 Company products under the following brands: 3-IN-ONE, GT85, WD-40 BIKE, no vac, Spot Shot, 1001, Lava and Solvol. 28
29 The Americas ~50% of global sales Targeting a compound annual growth rate of 2-5% EMEA ~35% of global sales Targeting a compound annual growth rate of 8-10% Asia-Pacific ~15% of global sales Targeting a compound annual growth rate of 10-12% Total Company Targeting a compound annual growth rate of ~8% Primary Growth Drivers: Increased penetration of WD-40 Multi-Use Product Increased penetration of WD-40 Specialist Conversion to Smart Straw delivery system Heightened focus on e-commerce and digital channels Increased penetration of WD-40 EZ-REACH Channel development opportunities Anticipated targets for revenue are projected by the end of FY2025 and are based on the Company's expectations, beliefs and forecasts. They are expressed in good faith and are believed by the Company to have a reasonable basis, but there can be no assurance that they will be achieved or accomplished. 29
30
31 Value of $100 Invested on August 31, 2013 $340 $320 $300 $280 $260 $240 $220 $200 $180 $160 $140 $120 $100 $80 FY 2013 FY 2014 FY 2015 FY 2016 FY 2017 FY 2018 WD-40 Company S&P 500 Russell 2000 *$100 invested on 8/31/13 in stock or index, including reinvestment of dividends. Fiscal year ending August 31. Copyright 2018 Standard & Poor's, a division of S&P Global. All rights reserved. Copyright 2018 Russell Investment Group. All rights reserved. 31
32 SOLID FINANCIAL FOUNDATION Strong balance sheet Predictable free cash flow Strong liquidity & access to capital FOCUSED ON CREATING VALUE High Returns on Invested Capital ROIC was 27% in FY15, 33% in FY16, 32% in FY17 and 31% in FY18 Employee earned incentives tied to EBITDA growth EFFICIENT BUSINESS MODEL WITH ASSET-LIGHT STRATEGY Average annual maintenance CAPEX needs of about 1% to 2% of net sales Outsourced manufacturing and distribution Sales per employee of $0.85M in FY18 GROWTH PLATFORM SUPPORTED BY STRONG BRANDS Brand portfolio includes many well-known brands and products Global diversification reduces risk Long runway of growth ahead We invest in brands and people, not factories and warehouses 32
33 Maintenance product sales continue to increase despite global macroeconomic challenges Maintenance Product Sales (In millions) $350 $300 $250 $200 $210 $241 $254 $264 $298 $308 $314 $333 $352 $372 $150 $100 $50 $ FY09 FY10 FY11 FY12 FY13 FY14 FY15 FY16 FY17 FY18 1) FY18 presented as reported, all prior years presented on a constant currency basis using FY18 foreign currency exchange rates. 33
34 MP Sales by Segment (In millions) $180 $160 $140 $120 $100 $80 $60 $40 $20 $ FY09 FY10 FY11 FY12 FY13 FY14 FY15 FY16 FY17 FY18 Americas EMEA Asia Pac 1) FY18 presented as reported, all prior years presented on a constant currency basis using FY18 foreign currency exchange rates. 34
35
36 WD-40 Company s business is guided by the 55/30/25 business model We target gross margin at or above 55%, cost of doing business of 30%, and an EBITDA of 25% 55 Gross Margin 55% of net sales 30 Cost of Doing Business (1) 30% of net sales Maintenance CAPES & Regular Dividends Maintenance CAPEX of between EBITDA $2M to $4M (1) per fiscal year Annual dividends targeted 25% at ~50% of net of earnings sales or ~$20M 25 1) See appendix for descriptions and reconciliations of these non-gaap measures. 36
37 In FY18 the Company achieved gross margin of 55.1% down from 56.2% in FY17 Changes in petroleum-based specialty chemicals and aerosol cans in all three segments (-1.3pp) Warehousing and distribution costs (-0.2pp) Higher discounts given to our customers (-0.1pp) Price increases in EMEA (+0.5pp) Continued focus on driving gross margin improvement over the long-term New product development, innovations and reformulations Operational efficiencies Product mix and market mix Pricing adjustments, as needed, to offset input cost increases 5-Year Gross Margin Trend 56% 56% 55% Gross Margin Target 55% 53% 52% FY14 FY15 FY16 FY17 FY18 Gross margin can be impacted positively and negatively by things not under the Company s control like changes in foreign currency exchange rates and input costs 37

38 Approximate Cost Breakdown of a Typical Can of WD-40 MUP Manufactured in the United States 3% 19% Corrugate Plastic 35% Petroleum-Based Specialty Chemicals 13% Manufacturing Fees 30% Can Data as of September Represents average input costs over 6-month period of a typical 12 ounce can of WD-40 Multi-Use Product manufactured in the United States. Current manufacturing and input costs typically take approximately days to be reflected in the Company s consolidated statement of operations due to production and inventory life cycles. 38
39 FY 2018 cost of doing business was at 34% of net sales down from 35% compared to FY 2017 Cost of Doing Business In FY 2018 cost of doing business came from three primary areas: People costs, including earned incentive accruals Marketing, advertising and promotion Freight costs to get products to customers Additional investments in research and development, brand development and protection, as well as regulatory and quality assurance remain a high priority People A&P Investment Freight Other Revenue growth is the most important factor in achieving the 30 target 39
40 55/30/25 Business Model Target FY18 FY17 FY16 Actuals Actuals Actuals Gross Margin 55% 55% 56% 56% Cost of Doing Business 30% 34% 35% 36% EBITDA 25% 21% 22% 21% * See appendix for descriptions and reconciliations of these non-gaap measures. Note: Percentages may not aggregate to EBITDA percentage due to rounding and because amounts recorded in other income (expense), net on the Company s consolidated statement of operations are not included as an adjustment to earnings in the Company s EBITDA calculation. 40
41

42 42
43 46% $ % $1.48 Dividends 45% $ % $1.89 $2.11 FY14 FY15 FY16 FY17 FY18 FY Dividend per Share Dividend Payout Ratio 45% Paid dividends without interruption for over 40 years 2018 represents the ninth consecutive year the Company has raised its annual dividend Future increases expected to grow in-line with earnings over-time $42.8 Share Repurchases (in millions) $30.3 $32.1 $31.1 $22.6 FY14 FY15 FY16 FY17 FY18 Share Repurchases Current share repurchase plan provides authorization to acquire up to $75 million in shares through August 2020 Company repurchased ~175K shares at a total cost of $22.6 million during FY18 Over the last five years Company has repurchased nearly $160 million in WDFC stock 43
44
45 ($ in millions; except EPS, gross profit and % change) FY18 FY17 % Change Net Sales $408.5 $ % Gross Profit (%) 55.1% 56.2% -110 bp Operating Income $78.6 $75.9 4% Net Income $65.2 $ % EPS (Diluted) $4.64 $ % Overall, changes in foreign currency exchange rates had a favorable impact on net sales in FY18. Translation of our foreign subsidiaries results from their functional currencies to U.S. dollars increased total net sales by approximately $10.5 million. Unfavorable transaction-related impacts slightly offset these favorable translation impacts by approximately $0.2 million. Net income and diluted earnings per share were positively impacted by the U.S. Tax Cuts and Jobs Act in FY18. 45

46
47 Continue to live our values and enrich our tribal culture High levels of employee engagement Steady growth of WD-40 Multi-Use Product across all markets Growth of WD-40 Specialist product line Innovation and development to support growth Maintain gross margin of 55% or greater Manage cost of doing business as a % of revenue towards 30% Protect the power of the shield and mitigate regulatory impact 47
48 Not continuing to live our values or enriching our tribal culture Loss of focus not executing against our strategic drivers Overwhelming complexity of operating a business that operates in 176 countries and 62 trade channels Misaligned compensation moving away from pay for performance Not being deliberate and focused deviating away from best-in-class products that generate positive lasting memories for our end-users Temptation to di-worsify bad capital allocation Developing products that need more support than our business model allows Targeting end-users that don t fit our existing distribution model Global volatility, uncertainty, complexity, ambiguity 48
49
50 ($ in millions; except EPS, gross profit and % change) Financial Results As reported FY18 FY17 % Change Net Sales $408.5 $ % Gross Profit (%) 55.1% 56.2% -110 bp Operating Income $78.6 $75.9 4% Net Income $65.2 $ % EPS (Diluted) $4.64 $ % Financial Results Constant currency basis FY18 CC* FY17 % Change Net Sales $398.0 $ % Operating Income $76.1 $75.9 0% Net Income $63.3 $ % EPS (Diluted) $4.51 $ % *FY18 results translated at FY17 foreign currency exchange rates 50
51 (1) This presentation contains certain non-gaap (accounting principles generally accepted in the United States of America) measures, that our management believes provide our stockholders with additional insights into WD-40 Company s results of operations and how it runs its business. Our management uses these non-gaap financial measures in order to establish financial goals and to gain an understanding of the comparative performance of the Company from year to year or quarter to quarter. The non-gaap measures referenced in this presentation, which include EBITDA (earnings before interest, income taxes, depreciation and amortization) and the cost of doing business, are supplemental in nature and should not be considered in isolation or as alternatives to net income, income from operations or other financial information prepared in accordance with GAAP as indicators of the Company s performance or operations. Reconciliations of these non-gaap financial measures to the WD-40 Company financials as prepared under GAAP are as follows: Fiscal Year Ended August 31, Total operating expenses - GAAP $ 146,659 $ 137,976 $ 143,021 Amortization of definite-lived intangible assets (2,951) (2,879) (2,976) Depreciation (in operating departments) (3,725) (2,789) (2,744) Cost of doing business $ 139,983 $ 132,308 $ 137,301 Net sales $ 408,518 $ 380,506 $ 380,670 Cost of doing business as a percentage of net sales - non-gaap 34% 35% 36% EBITDA: Fiscal Year Ended August 31, Net income - GAAP $ 65,215 $ 52,930 $ 52,628 Provision for income taxes 9,963 21,692 20,161 Interest income (454) (508) (683) Interest expense 4,219 2,582 1,703 Amortization of definite-lived intangible assets 2,951 2,879 2,976 Depreciation 4,849 3,890 3,489 EBITDA $ 86,743 $ 83,465 $ 80,274 Net sales $ 408,518 $ 380,506 $ 380,670 EBITDA as a percentage of net sales - non-gaap 21% 22% 21% Note: Percentages may not aggregate to EBITDA percentage due to rounding and because amounts recorded in other income (expense), net on the Company s consolidated statement of operations are not included as an adjustment to earnings in the Company s EBITDA calculation. 51
Simple and easy to understand business model. Dominant in its industry. Superior returns on capital. Sustainable competitive advantage
 October 2018 Historical financial and operating data in this presentation reflect the consolidated results of WD-40 Company, its subsidiaries and its legal entities. WD-40 Company markets maintenance products
Corporate Overview. January 2018
 Corporate Overview January 2018 FORWARD-LOOKING STATEMENTS Historical financial and operating data in this presentation reflect the consolidated results of WD-40 Company, its subsidiaries and its legal
Annual Meeting of Stockholders. December 13, 2016
 Annual Meeting of Stockholders December 13, 2016 Forward-Looking Statements Historical financial and operating data in this presentation reflect the consolidated results of WD-40 Company, its subsidiaries
FY 2014 Corporate Overview. Updated: April 2015
 FY 2014 Corporate Overview Updated: April 2015 Forward-Looking Statements Historical financial and operating data in this presentation reflect the consolidated results of WD-40 Company, its subsidiaries
Q4 & FY18 Earnings Results. October 18, 2018
 Q4 & FY18 Earnings Results October 18, 2018 FORWARD-LOOKING STATEMENTS Historical financial and operating data in this presentation reflect the consolidated results of WD-40 Company, its subsidiaries and
Q1 FY18 Earnings Results. January 9, 2018
 Q1 FY18 Earnings Results January 9, 2018 FORWARD-LOOKING STATEMENTS Historical financial and operating data in this presentation reflect the consolidated results of WD-40 Company, its subsidiaries and
Q3 FY17 Earnings Results. July 10, 2017
 Q3 FY17 Earnings Results July 10, 2017 Forward-Looking Statements Historical financial and operating data in this presentation reflect the consolidated results of WD-40 Company, its subsidiaries and its
WD-40 Company Reports Fourth Quarter and Fiscal Year 2015 Financial Results
 NEWS RELEASE WD-40 Company Reports Fourth Quarter and Fiscal Year 2015 Financial Results 10/15/2015 ~ Company reports diluted earnings per common share of $3.04 for fiscal year 2015 ~~ Impacts of changing
WD-40 COMPANY (Exact Name of Registrant as specified in its charter )
") Delaware (State or other jurisdiction of incorporation or organization) UNITED STATES SECURITIES AND EXCHANGE COMMISSION Washington, D.C. 20549 FORM 8-K CURRENT REPORT PURSUANT TO SECTION 13 OR 15(d) OF
Delaware (State or other jurisdiction of incorporation or organization) UNITED STATES SECURITIES AND EXCHANGE COMMISSION Washington, D.C. 20549 FORM 8-K CURRENT REPORT PURSUANT TO SECTION 13 OR 15(d) OF
WD-40 Company Reports 4% Increase in First Quarter Sales
 NEWS RELEASE WD-40 Company Reports 4% Increase in First Quarter Sales 1/10/2011 SAN DIEGO, Jan 10, 2011 /PRNewswire via COMTEX/ -- WD-40 Company (Nasdaq: WDFC) today reported sales for the first quarter
WD 40 CO FORM 10-K. (Annual Report) Filed 10/21/14 for the Period Ending 08/31/14
 Filed 10/21/14 for the Period Ending 08/31/14") WD 40 CO FORM 10-K (Annual Report) Filed 10/21/14 for the Period Ending 08/31/14 Address 9715 BUSINESSPARK AVENUE SAN DIEGO, CA, 92131 Telephone 6192751400 CIK 0000105132 Symbol WDFC SIC Code 2890 - Miscellaneous
WD 40 CO FORM 10-K (Annual Report) Filed 10/21/14 for the Period Ending 08/31/14 Address 9715 BUSINESSPARK AVENUE SAN DIEGO, CA, 92131 Telephone 6192751400 CIK 0000105132 Symbol WDFC SIC Code 2890 - Miscellaneous
William Blair Growth Stock Conference. Eric Dey EVP & CFO
 William Blair Growth Stock Conference Eric Dey EVP & CFO June 12, 2018 Safe Harbor Provision This presentation contains forward-looking statements within the meaning of the federal securities laws. Statements
Investor Presentation. March 2016
 Investor Presentation March 2016 Safe Harbor Statement This presentation includes forward-looking statements (statements which are not historical facts) within the meaning of the Private Securities Litigation
B. Riley Investor Conference. May 23, 2018
 B. Riley Investor Conference May 23, 2018 About This Presentation Safe Harbor Statement This presentation includes forward-looking statements (statements which are not historical facts) within the meaning
SAFE HARBOR STATEMENT
 1 SAFE HARBOR STATEMENT Forward Looking Statements This press release, and the above referenced conference call, contains or may contain forward-looking statements made pursuant to the safe harbor provisions
FOSSIL GROUP, INC. REPORTS FIRST QUARTER FISCAL 2015 RESULTS; First Quarter Net Sales of $725 Million; Diluted EPS of $0.75
 FOSSIL GROUP, INC. REPORTS FIRST QUARTER FISCAL 2015 RESULTS; First Quarter Net Sales of $725 Million; Diluted EPS of $0.75 Maintains Full Year Constant Currency Guidance and Provides Second Quarter Guidance
Zep Inc. Investor Presentation. August 2014
 Zep Inc. Investor Presentation August 2014 Safe Harbor This presentation and our commentary contain forward-looking statements within the meaning of the Private Securities Litigation Reform Act of 1995.
Forward-Looking Statements
 William Blair & Company 27 th Annual Growth Stock Conference June 20, 2007 0 Forward-Looking Statements This presentation contains forward-looking statements that are subject to a number of risks and uncertainties,
SECURITIES AND EXCHANGE COMMISSION Washington, D. C FORM 10-K
 10-K 1 d10k.htm FORM 10-K FOR WD-40 COMPANY SECURITIES AND EXCHANGE COMMISSION Washington, D. C. 20549 FORM 10-K ANNUAL REPORT PURSUANT TO SECTION 13 OR 15(d) OF THE SECURITIES EXCHANGE ACT OF 1934 For
Reasons to Believe IR OVERVIEW 2014
 Reasons to Believe IR OVERVIEW 2014 2 Forward-Looking Statements This presentation may contain statements, estimates or projections that constitute forward-looking statements as defined under U.S. federal
FOR IMMEDIATE RELEASE CONTACT: Media: Ben Deutsch (404) Investors: Ann Taylor (404) THE COCA-COLA COMPANY REPORTS
 Investors: Ann Taylor (404) THE COCA-COLA COMPANY REPORTS") Media Relations Department P.O. Box 1734, Atlanta, GA 30301 Telephone (404) 676-2121 FOR IMMEDIATE RELEASE CONTACT: Media: Ben Deutsch (404) 676-2683 Investors: Ann Taylor (404) 676-5383 THE COCA-COLA
Media Relations Department P.O. Box 1734, Atlanta, GA 30301 Telephone (404) 676-2121 FOR IMMEDIATE RELEASE CONTACT: Media: Ben Deutsch (404) 676-2683 Investors: Ann Taylor (404) 676-5383 THE COCA-COLA
Samsonite International S.A Avenue de la Liberte, L-1931, Luxembourg RCS Luxembourg: B (Incorporated under the laws of Luxembourg with
 Samsonite International S.A. 13 15 Avenue de la Liberte, L-1931, Luxembourg RCS Luxembourg: B159469 (Incorporated under the laws of Luxembourg with limited liability) Consolidated financial statements
TELECONFERENCE Q FINANCIAL RESULTS
 TELECONFERENCE FINANCIAL RESULTS 10:00 CET, 13 May 2014 1 AGENDA AGENDA Business highlights: Key developments in Market development and sales-out Performance of newly launched products Guidance 2014 Financial
May 2017 Investor Meetings
 May 2017 Investor Meetings Safe Harbor Statement This presentation includes forward-looking statements (statements which are not historical facts) within the meaning of the Private Securities Litigation
FINANCIAL OVERVIEW AL MISTYSYN SENIOR VICE PRESIDENT, FINANCE & CHIEF FINANCIAL OFFICER FINANCIAL COMMUNITY PRESENTATION OCTOBER 3, 2017
 FINANCIAL OVERVIEW AL MISTYSYN SENIOR VICE PRESIDENT, FINANCE & CHIEF FINANCIAL OFFICER FINANCIAL COMMUNITY PRESENTATION OCTOBER 3, 2017 Forward Looking Statement The presentations today will contain certain
2010 Annual Results. February 10, 2011
 2010 Annual Results February 10, 2011 Disclaimer This presentation contains forward-looking statements. The use of the words "aim(s)," "expect(s)," "feel(s)," "will," "may," "believe(s)," "anticipate(s)"
SAFE HARBOR STATEMENT
 1 SAFE HARBOR STATEMENT Forward Looking Statements This press release contains or may contain forward-looking statements made pursuant to the safe harbor provisions of the Private Securities Litigation
Eric Foss Chairman & CEO. Al Drewes SVP & CFO
 Eric Foss Chairman & CEO Al Drewes SVP & CFO Cautionary Statement Statements made in this presentation that relate to future performance or financial results of PBG are forward-looking statements, which
TELECONFERENCE FY 2014 FINANCIAL RESULTS
 TELECONFERENCE FY 2014 FINANCIAL RESULTS 10:00 CET, 17 February 2015 1 DISCLAIMER Certain statements in this presentation constitute forward-looking statements. Forward-looking statements are statements
Quaker Chemical Corporation. Investor Presentation. August 2016
 Quaker Chemical Corporation Investor Presentation August 2016 1 Risk and Uncertainties Statement Regulation G The attached charts include Company information that does not conform to generally accepted
First Quarter 2016, Champion Europe and Knights Apparel FAQs
 First Quarter 2016, Champion Europe and Knights Apparel FAQs Updated April 21, 2016 New or updated information is in red First Quarter 2016 and HBI related FAQs Q: Can you provide an update on your various
TELECONFERENCE Q FINANCIAL RESULTS
 TELECONFERENCE FINANCIAL RESULTS 10:00 CET, 11 November 2014 1 12 AUGUST 2014 AGENDA AGENDA Business highlights: Key developments in Market development and sales-out Performance of newly launched products
Sanford Bernstein Conference Rockwell Automation
 Sanford Bernstein Conference Rockwell Automation Keith D. Nosbusch Chairman and CEO May 31, 2013 Rev 5058-CO900D Safe Harbor Statement This presentation contains statements (including certain projections
McCormick & Company, Inc. 2nd Quarter 2017 Financial Results and Outlook June 29, 2017
 McCormick & Company, Inc. 2nd Quarter 2017 Financial Results and Outlook June 29, 2017 1 The following slides accompany a June 29, 2017 presentation to investment analysts. This information should be read
TENNANT COMPANY INVESTOR PRESENTATION REINVENTING HOW THE WORLD CLEANS
 INVESTOR PRESENTATION REINVENTING HOW THE WORLD CLEANS 2 Safe Harbor Statement This presentation contains certain statements that are considered forward-looking statements within the meaning of the Private
Zep Inc. Company Overview. October 2013
 Zep Inc. Company Overview October 2013 Safe Harbor This release contains, and other written or oral statements made by or on behalf of Zep may include, forward-looking statements, within the meaning of
FORWARD LOOKING STATEMENTS
 May 2015 FORWARD LOOKING STATEMENTS We are making some forward looking statements today that use words like outlook or target or similar predictive words. Such forward looking statements involve risks
Creating Value by Accelerating Transformation & Growth
 Creating Value by Accelerating Transformation & Growth Univar Announces Agreement to Acquire Nexeo September 17, 2018 1 2018 Univar, Inc. All rights reserved. Forward-Looking Statements This communication
Credit Suisse 6 th Annual Industrials Conference November 2018
 Credit Suisse 6 th Annual Industrials Conference November 2018 Safe Harbor This presentation includes forward-looking statements which are statements that are not historical facts, including statements
Investor Deck December 2018
 Investor Deck December 2018 Safe Harbor This presentation includes forward-looking statements which are statements that are not historical facts, including statements that relate to the mix of and demand
Forward Looking Statements and Non-GAAP Measures Caution Regarding Forward-Looking Statements
 Ravi Saligram, CEO Forward Looking Statements and Non-GAAP Measures Caution Regarding Forward-Looking Statements This presentation contains forward-looking statements and forward-looking information within
ITW Conference Call First Quarter 2013
 ITW Conference Call First Quarter 2013 April 23, 2013 SOLID GROWTH. STRONG RETURNS. BEST-IN-CLASS OPERATOR. Forward-Looking Statements Safe Harbor Statement This conference call contains forward-looking
Acquisition of Signode: Global Leader In Transit Packaging. December 19, 2017
 Acquisition of Signode: Global Leader In Transit Packaging December 19, 2017 Forward Looking Statement Except for historical information, all other information in this presentation consists of forward-looking
Q2 13 FINANCIAL HIGHLIGHTS
 Q2 13 FINANCIAL HIGHLIGHTS 7.16.2013 1 This presentation contains forward-looking statements concerning Yahoo! s expected financial performance and Yahoo! s strategic and operational plans. Risks and uncertainties
Pursuing Growth Building Value
 a global diversified industrial company Pursuing Growth Building Value Sidoti Roadshow December 17-18 Disclosure regarding forward-looking statements Forward-Looking Statements and Factors That May Affect
Western Digital Announces Q3 Revenue of $3.8 Billion and Non-GAAP Net Income of $514 Million, or $2.10 Per Share 1
 Western Digital Announces Q3 Revenue of $3.8 Billion and Non-GAAP Net Income of $514 Million, or $2.10 Per Share 1 IRVINE, Calif. Apr. 24, 2013 Western Digital Corp. (NASDAQ: WDC) today reported revenue
Fiscal Year 2016 Fourth Quarter Conference Call
 Fiscal Year 2016 Fourth Quarter Conference Call November 7, 2016 2 Safe Harbor Statement This presentation includes statements related to the expected future results of the company and are therefore forward-looking
2017 FIRST QUARTER RESULTS. Ended March 31, 2017
 2017 FIRST QUARTER RESULTS Ended March 31, 2017 Forward Looking Statements Disclaimer This presentation contains statements, including statements about future plans and expectations, which constitute forwardlooking
Investor Presentation
 Investor Presentation May 2018 SAFE HARBOR STATEMENT & NON-GAAP MEASURES Forward-Looking Statements Statements in this presentation concerning the Company s goals, strategies, and expectations for business
ITW Conference Call Fourth Quarter 2012
 ITW Conference Call Fourth Quarter 2012 January 29, 2013 SOLID GROWTH. STRONG RETURNS. BEST-IN-CLASS OPERATOR. 100 YEARS STRONG Safe Harbor Statement Forward-Looking Statements This conference call contains
FOSSIL GROUP, INC. REPORTS FIRST QUARTER 2018 RESULTS. First Quarter Net Sales of $569 million; Diluted EPS (Loss) of $(0.99)
 of $(0.99)") FOSSIL GROUP, INC. REPORTS FIRST QUARTER RESULTS First Quarter Net Sales of $569 million; Diluted EPS (Loss) of $(0.99) Provides Second Quarter Guidance and Updates Fiscal Guidance Richardson, TX. May
FOSSIL GROUP, INC. REPORTS FIRST QUARTER RESULTS First Quarter Net Sales of $569 million; Diluted EPS (Loss) of $(0.99) Provides Second Quarter Guidance and Updates Fiscal Guidance Richardson, TX. May
SAMSONITE INTERNATIONAL S.A.
 Hong Kong Exchanges and Clearing Limited and The Stock Exchange of Hong Kong Limited take no responsibility for the contents of this announcement, make no representation as to its accuracy or completeness
Q1 14 FINANCIAL HIGHLIGHTS. April 15, 2014
 Q1 14 FINANCIAL HIGHLIGHTS April 15, 2014 This presentation contains forward-looking statements concerning the expected financial performance of Yahoo! Inc. and its consolidated subsidiaries ( we, Yahoo
Watts Water Technologies 4Q and FY 2017 Earnings Conference Call
 Watts Water Technologies 4Q and FY 2017 Earnings Conference Call February 13, 2018 Forward Looking Statements Certain statements in this presentation constitute forward-looking statements within the meaning
TENNANT COMPANY. INVESTOR PRESENTATION Second Quarter 2018 REINVENTING HOW THE WORLD CLEANS
 INVESTOR PRESENTATION Second Quarter 2018 REINVENTING HOW THE WORLD CLEANS 2 Safe Harbor Statement This presentation contains certain statements that are considered forward-looking statements within the
Investor Presentation. Domino s Pizza
 Investor Presentation Domino s Pizza July 2005 Forward-Looking Statements This presentation and our accompanying comments may contain forward-looking statements. These statements relate to future events
Samsonite International S.A. Announces 2013 Final Results Net sales top a record US$2 billion for the first time
 (Incorporated in Luxembourg with limited liability) (Stock code: 1910) Samsonite International S.A. Announces 2013 Final Results Net sales top a record US$2 billion for the first time Highlights Samsonite
SAFE HARBOR STATEMENT
 1 SAFE HARBOR STATEMENT Forward Looking Statements This press release contains or may contain forward-looking statements made pursuant to the safe harbor provisions of the Private Securities Litigation
CIGNA CORPORATION INVESTOR PRESENTATION. May 5, Cigna
 CIGNA CORPORATION INVESTOR PRESENTATION May 5, 2017 1 Forward looking statements CAUTIONARY STATEMENT FOR PURPOSES OF THE SAFE HARBOR PROVISIONS OF THE PRIVATE SECURITIES LITIGATION REFORM ACT OF 1995
TENNANT COMPANY. INVESTOR PRESENTATION Third Quarter 2018 REINVENTING HOW THE WORLD CLEANS
 INVESTOR PRESENTATION Third Quarter 2018 REINVENTING HOW THE WORLD CLEANS 2 Safe Harbor Statement This presentation contains certain statements that are considered forward-looking statements within the
Jefferies 10 th Annual Global Industrials Conference
 Jefferies 10 th Annual Global Industrials Conference August 2014 www.jacobs.com worldwide Forward-Looking Statement Disclaimer Statements included in this presentation that are not based on historical
TELECONFERENCE Q FINANCIAL RESULTS
 TELECONFERENCE FINANCIAL RESULTS 10:00 CET, 12 August 2014 1 AGENDA AGENDA Business highlights: Key developments in Market development and sales-out Performance of newly launched products Guidance 2014
Investment Community Conference Call
 DieboldNixdorf.com Investment Community Conference Call Third Quarter, 2018 Earnings October 31, 2018 Use of non-gaap Financial Information To supplement our condensed consolidated financial statements
Dunkin Brands Group, Inc.
 Dunkin Brands Group, Inc. Investor Presentation Jefferies Consumer Conference Nigel Travis Chairman & CEO 1 Forward-Looking Statements Certain information contained in this presentation, particularly information
Rockwell Automation. Company Overview August 2018 PUBLIC. Copyright 2018 Rockwell Automation, Inc. All Rights Reserved.
 Rockwell Automation Company Overview August 2018 SAFE HARBOR STATEMENT THIS PRESENTATION INCLUDES STATEMENTS RELATED TO THE EXPECTED FUTURE RESULTS OF THE COMPANY AND ARE THEREFORE FORWARD-LOOKING STATEMENTS.
Third Quarter 2014 Conference Call
 Third Quarter 2014 Conference Call E. Scott Santi, President & CEO Michael M. Larsen, Senior Vice President & CFO John Brooklier, Vice President, Investor Relations Aaron Hoffman, Vice President, Investor
Disclosure Statement. Page 2
 Disclosure Statement Page 2 This presentation and the accompanying slides (the Presentation ) which have been prepared by Samsonite International S.A. ( Samsonite or the Company ) do not constitute any
McCormick & Company, Inc. 3rd Quarter 2017 Financial Results and Outlook September 28, 2017
 McCormick & Company, Inc. 3rd Quarter 2017 Financial Results and Outlook September 28, 2017 1 The following slides accompany a September 28, 2017 earnings release conference call. This information should
McCormick & Company, Inc. 1 st Quarter 2018 Financial Results and Outlook
 McCormick & Company, Inc. 1 st Quarter 2018 Financial Results and Outlook March 27, 2018 The following slides accompany a March 27, 2018, earnings release conference call. This information should be read
INC. ANNOUNCES FOURTH QUARTER AND FULL YEAR 2006 FINANCIAL RESULTS
 ebay INC. ANNOUNCES FOURTH QUARTER AND FULL YEAR 2006 FINANCIAL RESULTS - Reports Record Q4 Net Revenues of $1.7 Billion - - Delivers Q4 GAAP Diluted EPS of $0.25 and Non-GAAP Diluted EPS of $0.31 - -
Dunkin Brands Group, Inc.
 Dunkin Brands Group, Inc. Investor Presentation Fourth Quarter 2013 1 Forward-Looking Statements Certain information contained in this presentation, particularly information regarding future economic performance,
Zep Inc. Investor Presentation. February, 2015
 Zep Inc. Investor Presentation February, 2015 Safe Harbor This presentation and our commentary contain forward-looking statements within the meaning of the Private Securities Litigation Reform Act of 1995.
First-Quarter 2018 Results. April 25, 2018
 First-Quarter 2018 Results April 25, 2018 Safe Harbor This presentation includes forward-looking statements which are statements that are not historical facts, including statements that relate to the mix
This presentation contains certain forward-looking statements within the meaning of the Private Securities Litigation Reform Act of 1995, such as stat
 This presentation contains certain forward-looking statements within the meaning of the Private Securities Litigation Reform Act of 1995, such as statements regarding the Company s expected financial performance,
TELECONFERENCE Q FINANCIAL RESULTS
 TELECONFERENCE Q3 2013 FINANCIAL RESULTS 10:00 CET, 12 November 2013 1 AUGUST 2013 INVESTOR PRESENTATION AGENDA AGENDA Business highlights: Key developments in Q3 2013 Market development and sales-out
2017 SECOND QUARTER RESULTS. Ended June 30, 2017
 2017 SECOND QUARTER RESULTS Ended June 30, 2017 Forward Looking Statements Disclaimer This presentation contains statements, including statements about future plans and expectations, which constitute forwardlooking
2016 INVESTOR MEETINGS FIRST QUARTER 2016 WHIRLPOOL CORPORATION
 2016 INVESTOR MEETINGS FIRST QUARTER 0 FIRST-QUARTER INVESTOR MEETINGS WHIRLPOOL CORPORATION ADDITIONAL INFORMATION This Presentation contains forward-looking statements about Whirlpool Corporation and
Sanford C. Bernstein Strategic Decisions Conference
 Sanford C. Bernstein Strategic Decisions Conference May 31, 2012 Essentials for a Better Life A Long and Successful History Celebrating 140 th anniversary in 2012 Company founded before the telephone,
ROTH Capital Partners 30 th Annual Conference. Monday, March 12, 2018
 Monday, March 12, 2018 1 Forward-Looking Statements This presentation may contain "forward-looking statements" as defined in the Private Securities Litigation Reform Act of 1995. Forward-looking statements
2017 THIRD QUARTER RESULTS. Ended September 30, 2017
 2017 THIRD QUARTER RESULTS Ended September 30, 2017 Forward Looking Statements Disclaimer This presentation contains statements, including statements about future plans and expectations, which constitute
Fourth-Quarter 2017 Results. January 31, 2018
 Fourth-Quarter 2017 Results January 31, 2018 Safe Harbor This presentation includes forward-looking statements which are statements that are not historical facts, including statements that relate to the
1st Quarter Revenue. April 22, 2010
 1st Quarter Revenue April 22, 2010 Disclaimer This presentation contains forward looking statements. The use of the words "aim(s)," "expect(s)," "feel(s)," "will," "may," "believe(s)," "anticipate(s)"
Working together to create value in the world of real estate. Investor Presentation. 58,000 employees, 230 offices, 80 countries, 1 global brand
 Working together to create value in the world of real estate Investor Presentation 58,000 employees, 230 offices, 80 countries, 1 global brand September 2015 Who we are JLL is a leading provider of real
PPG Industries, Inc. First 2018 Financial Results Earnings Brief April 19, 2018
 PPG Industries, Inc. First 2018 Financial Results Earnings Brief April 19, 2018 First Quarter Financial Highlights PPG first quarter net sales from continuing operations were approximately $3.8 billion,
UPDATE: NetSol Technologies Reports Fiscal First Quarter 2009 Financial Results
 November 13, 2008 UPDATE: NetSol Technologies Reports Fiscal First Quarter 2009 Financial Results Revenue, GAAP Net Income and EBITDA Increase Year-Over-Year, Supported by a 33% Rise in License Fees EMERYVILLE,
Investor Presentation. December 2015
 Investor Presentation December 2015 Disclaimer This presentation contains forward-looking statements that are based on current expectations, forecasts and projections, including (but not limited to) expected
Bank of America Merrill Lynch Global Industrials Conference 2018 March 2018
 Bank of America Merrill Lynch Global Industrials Conference 2018 March 2018 Safe Harbor This presentation includes forward-looking statements which are statements that are not historical facts, including
Forward-Looking Statements
 March 2006 0 Forward-Looking Statements This presentation contains forward-looking statements that are subject to a number of risks and uncertainties, many of which are outside our control. These forward-looking
Q3 Fiscal Year 2019 Financial Highlights
 Q3 Fiscal Year 2019 Financial Highlights For the quarter ended October 31, 2018 November 29, 2018 Forward Looking Statements Certain statements in this communication may contain forward looking statements
Aegis Group plc. 17 March 2011
 Aegis Group plc 2010 Full Year Results 2010 Full Year Results 17 March 2011 Agenda Introduction John Napier, Chairman Aegis Group overview Jerry Buhlmann, CEO Divisional review Aegis Media - Jerry Buhlmann,
First Quarter 2018 Earnings Call. May 10, 2018
 First Quarter 2018 Earnings Call May 10, 2018 Forward-Looking Statements This presentation includes certain statements relating to future events and our intentions, beliefs, expectations, and predictions
INVESTOR PRESENTATION
 INVESTOR PRESENTATION Click to edit text December 13, 2018 Fiscal 4Q and FY2018 Results and 2019 Outlook NASDAQ: NDSN Safe Harbor Statement Under the Private Securities Litigation Reform Act of 1995 Information
During the year, the Company achieved a number of milestones in executing its growth strategy:
 Party City Announces Fourth Quarter and Full Year 2015 Results Revenue increase of 4% 1 on a constant currency basis to a record $2.29 billion for fiscal year 2015 Adjusted Net Income increase of 32% in
Hill-Rom Fourth Quarter 2016 Financial Results. November 3, 2016
 Hill-Rom Fourth Quarter 2016 Financial Results November 3, 2016 Forward Looking Statements Certain statements in this presentation contain forward-looking statements, within the meaning of the Private
4Q 2018 Highlights and Operating Results. Products. Technology. Services. Delivered Globally.
 4Q 2018 Highlights and Operating Results Products. Technology. Services. Delivered Globally. Table of Contents Page 3 Safe Harbor Statement and Non-GAAP Financial Measures 4 Sales Overview 9 Overview of
Second Quarter 2014 Conference Call
 Second Quarter 2014 Conference Call E. Scott Santi, President & CEO Michael M. Larsen, Senior Vice President & CFO John Brooklier, Vice President Investor Relations July 29, 2014 FORWARD LOOKING STATEMENTS
Sealed Air Reports Fourth Quarter and Full Year 2018 Results
 Exhibit 99.1 Sealed Air Corporation 2415 Cascade Pointe Blvd. Charlotte, NC 28208 For release: February 7, 2019 Sealed Air Reports Fourth Quarter and Full Year 2018 Results Solid year-over-year sales and
Watts Water Technologies 1Q 2018 Earnings Conference Call
 Watts Water Technologies 1Q 2018 Earnings Conference Call May 4, 2018 Forward Looking Statements Certain statements in this presentation constitute forward-looking statements within the meaning of the
Third Quarter 2018 Earnings Thursday, November 8, 2018
 Third Quarter 2018 Earnings Thursday, November 8, 2018 1 Forward-Looking Statements This presentation may contain "forward-looking statements" as defined in the Private Securities Litigation Reform Act
Financial Review. John Sznewajs, Chief Financial Officer
 Financial Review John Sznewajs, Chief Financial Officer Safe Harbor Statement This presentation contains statements that reflect our views about our future performance and constitute forward-looking statements