Third Quarter 2018 Results. November 2, 2018
|
|
|
- Randolph Reeves
- 5 years ago
- Views:
Transcription


1 Third Quarter 2018 Results November 2, 2018
2 Safe Harbor Statement Under the Private Securities Litigation Reform Act of 1995 All information set forth in this presentation, except historical and factual information, represents forward-looking statements. This includes all statements about the company s plans, beliefs, estimates, and expectations. These statements are based on current estimates, projections and assumptions, which involve certain risks and uncertainties that could cause actual results to differ materially from those in the forward-looking statements. Important factors that may affect these forward-looking statements include, but are not limited to: intense competition; the ability to execute TDS business strategy; uncertainties in TDS future cash flows and liquidity and access to the capital markets; the ability to make payments on TDS and U.S. Cellular indebtedness or comply with the terms of debt covenants; impacts of any pending acquisitions/divestitures/exchanges of properties and/or licenses, including, but not limited to, the ability to obtain regulatory approvals, successfully complete the transactions and the financial impacts of such transactions; the ability of the company to successfully manage and grow its markets; the access to and pricing of unbundled network elements; the ability to obtain or maintain roaming arrangements with other carriers on acceptable terms; the state and federal telecommunications regulatory environment; the value of assets and investments; adverse changes in the ratings afforded TDS and U.S. Cellular debt securities by accredited ratings organizations; industry consolidation; advances in telecommunications technology; pending and future litigation; changes in income tax rates, laws, regulations or rulings; changes in customer growth rates, average monthly revenue per user, churn rates, roaming revenue and terms, the availability of wireless devices, or the mix of products and services offered by U.S. Cellular and TDS Telecom. Investors are encouraged to consider these and other risks and uncertainties that are discussed in documents furnished to the Securities and Exchange Commission. 2

3 3
4 Executing on 2018 strategic priorities Attract new customers and protect our base Sequential improvement in gross and net additions Postpaid handset churn remained low at 1.02% in Q3 Drive revenue growth Operating revenues up 4%, up 5% excluding ASC 606 Aggressive, yet economical, promotions and pricing Introduced Unlimited with Payback plan Continue to drive improvements in cost structure Invest in network Continued investment to meet growth in data Planning for additional VoLTE markets launches in 2019 Strong year-to-date results drive raise in guidance 4

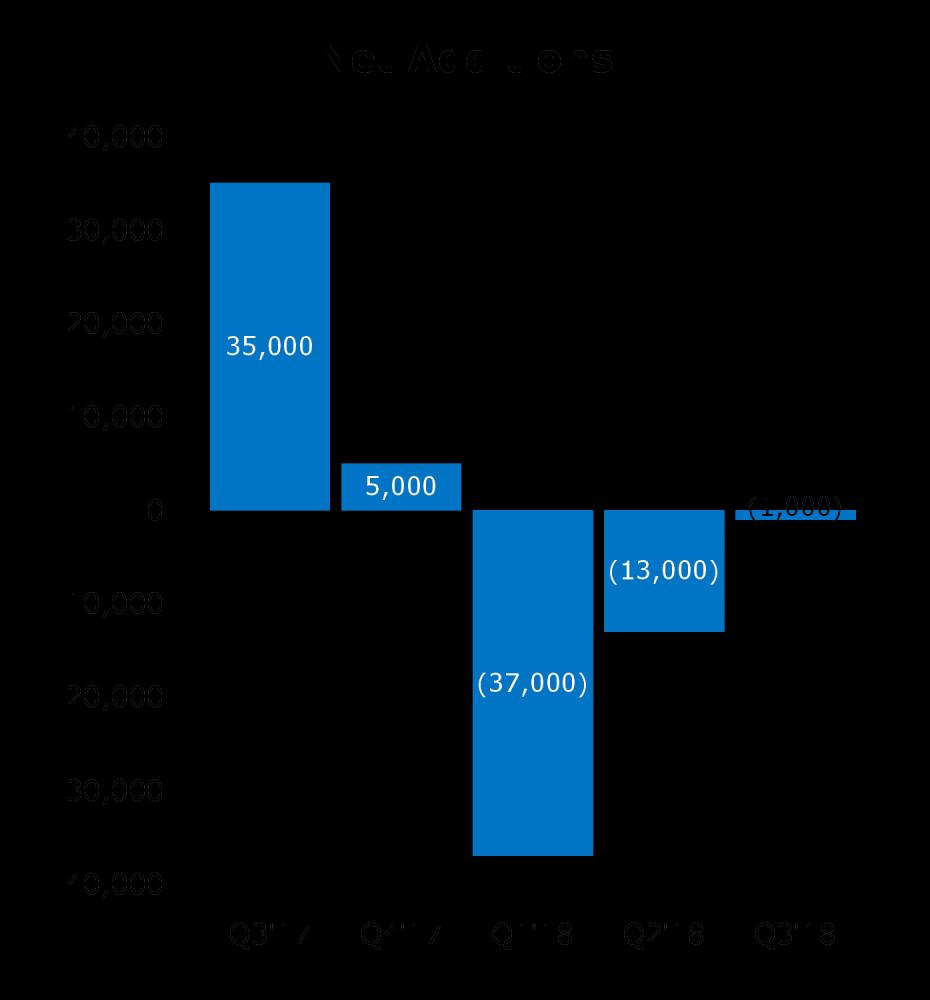
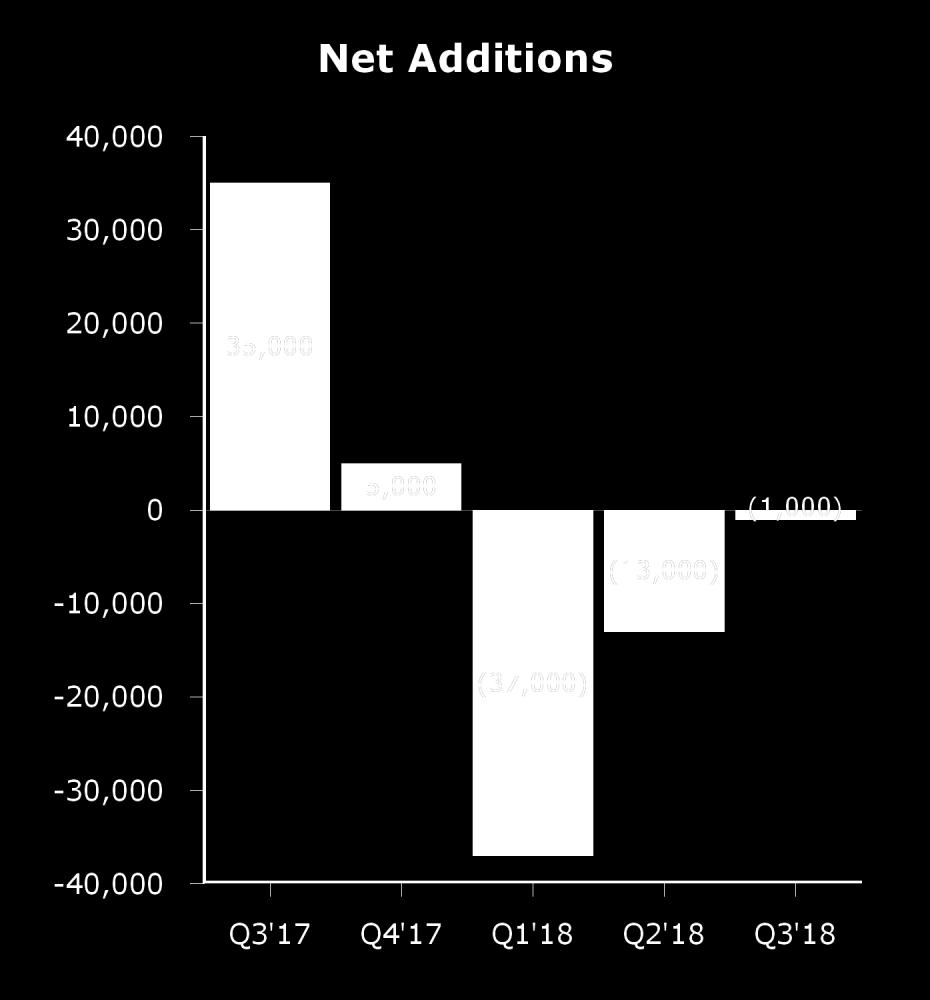
5 Total postpaid connections 5

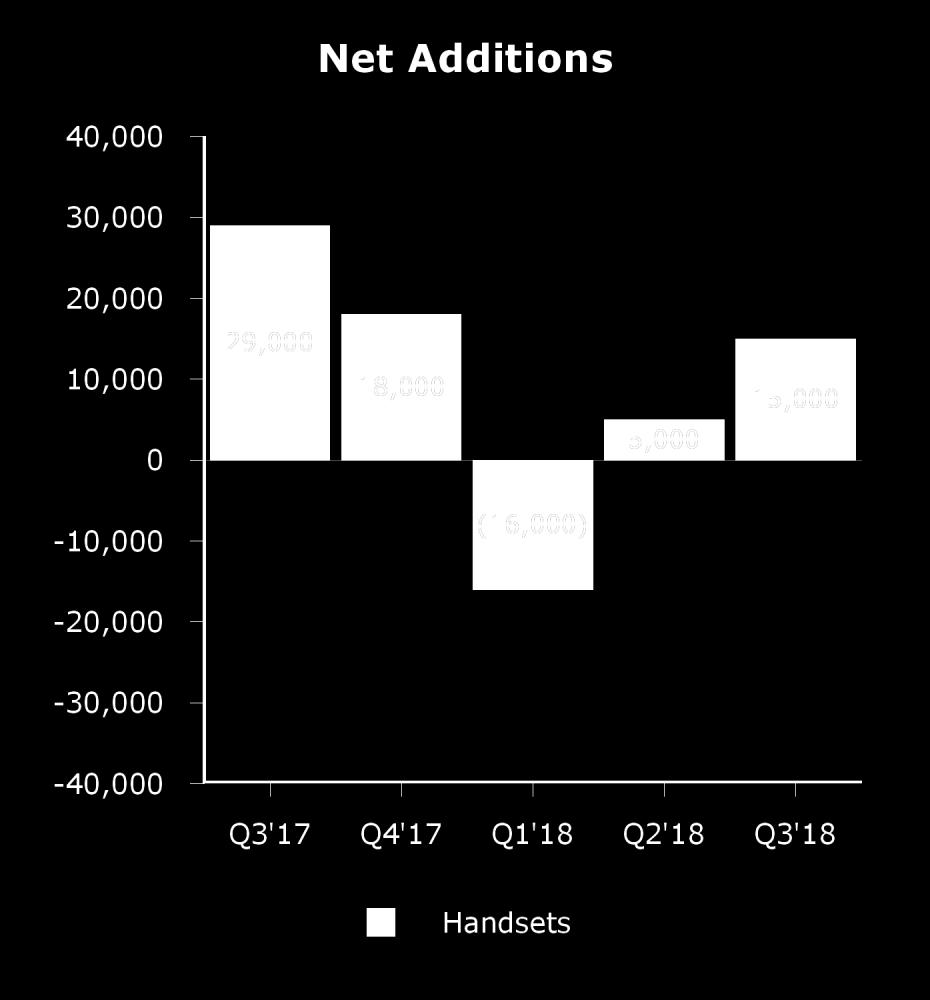
6 Postpaid handsets connections 6

7 Postpaid churn rate 7
8 Impacts of New Revenue Recognition Accounting Standard (ASC 606) (1) (in millions) (Gain) loss on license sales and exchanges, net Results under prior accounting Three Months Ended September 30, 2018 standard Adjustment As reported Service revenues $ 787 $ (28) $ 759 Equipment sales Total operating revenues 1,010 (9) 1,001 System operations Cost of equipment sold 261 (3) 258 Selling, general and administrative 348 (2) 346 Total cash expenses (2) 809 (5) 804 Adjusted OIBDA (3) $ 201 $ (4) $ 197 (1), (2), (3) - See slide 28 for explanations 8
 (1) - See slide 28 for")
9 Total operating revenues (1) (in millions) (1) - See slide 28 for explanation 9
 Average Billings Per Account (ABPA)")
10 Postpaid revenue Average Billings Per User (ABPU) Average Billings Per Account (ABPA) 10
11 Adjusted OIBDA ($ in millions) Q3'18 (1) Q3'17 % Change Total operating revenues $ 1,001 $ 963 4% System operations expense % Cost of equipment sold (1)% SG&A expenses (1)% Total cash expenses (2) % Adjusted OIBDA (3) $ 197 $ % (1), (2), (3) - See slide 28 for explanations 11
12 Adjusted EBITDA ($ in millions) Q3'18 (1) Q3'17 % Change Adjusted OIBDA (3) $ 197 $ % Equity in earnings of unconsolidated entities % Interest and dividend income 4 2 N/M Adjusted EBITDA (3) $ 243 $ % N/M - Percentage change not meaningful (1), (3) - See slide 28 for explanations 12
13 2018 guidance * Strong performance drives increased guidance ($ in millions) As of November 2, Actual 2018 Current Estimates (1) 2018 Previous Estimates (1) Total operating revenues $3,890 $3,950-$4,000 $3,925-$4,025 Adjusted OIBDA (3) $675 $760-$810 $700-$800 Adjusted EBITDA (3) $820 $925-$1,000 $850-$950 Capital expenditures $469 $500 $500-$550 * There can be no assurance that final results will not differ materially from such estimated results. (1), (3) - See slide 28 for explanations 13

14 14

15 Executing on 2018 strategic priorities Wireline and Cable Intense focus on increasing broadband penetration Invest in Cloud TV platform Wireline Execute fiber program both in and out of the current ILEC footprint Rural Broadband Deployment A-CAM State Broadband Grants Cost management A-CAM Service Addresses at Sept. 30, 2018 (770,900) Un-Upgraded Copper Copper Bonded or Vectored Fiber Cable No Cable Competition (21%) Increase broadband penetration and ARPU Continue to evaluate potential acquisitions Cable Competition (79%) 15
16 TDS Telecom operating performance ($ in millions) Q3 18 (1) Q3 17 % Change Wireline $ 177 $ 179 (1)% Cable % Total operating revenues * % Cash expenses (2) % Adjusted EBITDA (3) $ 80 $ 79 1% Capital expenditures $ 54 $ 56 (3)% * Includes intercompany eliminations (1), (2), (3) - See slide 28 for explanations 16


 3% (Y/Y) (1) - See")
17 Third quarter Wireline highlights Growth in video connections and broadband penetration driving an increase in residential revenue per connection Demand for higher speeds is strong Growth from fiber investments and A-CAM support helps to offset legacy revenue declines Residential revenue per connection (1) 3% (Y/Y) (1) - See slide 28 for explanation 17
18 Wireline operating performance ($ in millions) Q3 18 (1) Q3 17 % Change Residential $ 81 $ 80 1% Commercial (8)% Wholesale % Total operating revenues (1)% Cash expenses (2) % Adjusted EBITDA (3) $ 61 $ 66 (6)% Capital expenditures $ 41 $ 41 (1)% (1), (2), (3) - See slide 28 for explanations 18
 Tenth consecutive quarter of double digit")
 14% Broadband connections (Y/Y")
19 Third quarter Cable highlights Broadband connections increase 14% (including acquisitions) Tenth consecutive quarter of double digit broadband growth Revenues increase 11% Adjusted EBITDA increases 35% 10% Total connections (Y/Y growth) 14% Broadband connections (Y/Y growth) 19
20 Cable operating performance ($ in millions) Q3 18 (1) Q3 17 % Change Residential $ 47 $ 43 11% Commercial % Total operating revenues % Cash expenses (2) % Adjusted EBITDA (3) $ 18 $ 14 35% Capital expenditures $ 13 $ 14 (7)% (1), (2), (3) - See slide 28 for explanations 20
21 2018 TDS Telecom guidance * ($ in millions) As of November 2, 2018 Wireline and Cable 2017 Actual 2018 Current Estimates (1) 2018 Previous Estimates (1) Total operating revenues $919 $900-$950 Unchanged Adjusted OIBDA (3) $314 $290-$320 Unchanged Adjusted EBITDA (3) $323 $300-$330 Unchanged Capital expenditures $201 $250 $270 * There can be no assurance that final results will not differ materially from such estimated results. (1), (3) - See slide 28 for explanations 21

22 Third quarter HMS highlights Total revenues up due to equipment revenue growth Continued to add new logos Strategic services, such as cloud revenues, were up Churn and compression continues to impact service revenues Continuing to implement additional cost saving programs 22
23 Appendix 23
24 Adjusted OIBDA and Adjusted EBITDA Reconciliation (1) Three Months Ended September 30, 2018 Three Months Ended September 30, 2017 ($ in millions) U.S. Cellular Wireline Cable Total TDS U.S. Telecom (5) TDS (6) Cellular Wireline Cable Total TDS Telecom (5)(7) TDS (6) Net income (loss) (GAAP) $37 N/A N/A $36 $53 ($298) N/A N/A $18 ($231) Add back: Income tax expense (benefit) 14 N/A N/A (5) 5 (53) N/A N/A 11 (5) Income (loss) before income taxes (GAAP) (351) (236) Add back: Interest expense 29 (1) (1) Depreciation, amortization and accretion expense EBITDA (3) (non-gaap) (170) Add back: Loss on impairment of goodwill (Gain) loss on asset disposals, net 3 (4) 1 (3) (Gain) loss on sale of business and other exit costs, net (1) (1) (Gain) loss on license sales and exchanges, net Adjusted EBITDA (3) (non-gaap) Deduct: Equity in earnings of unconsolidated entities Interest and dividend income Other, net (7) Adjusted OIBDA (3) (non-gaap) $197 $59 $18 $77 $271 $167 $63 $13 $77 $243 (1), (3), (5), (6), (7) - See slide 28 for explanations 24
25 Adjusted OIBDA and Adjusted EBITDA Reconciliation 2018 Estimated and 2017 Full Year (1) In providing 2018 estimated results, TDS has not completed the below reconciliation to net income because it does not provide guidance for income taxes. TDS believes that the impact of income taxes cannot be reasonably predicted; therefore, the company is unable to provide such guidance Estimated Results Actual Results Year ended December 31, 2017 (Dollars in millions) U.S. Cellular TDS Telecom (5) TDS (6) U.S. Cellular TDS Telecom (5)(7) TDS (6) Net income (loss) (GAAP) N/A N/A N/A $15 $138 $157 Add back: Income tax expense (benefit) N/A N/A N/A (287) (13) (279) Income (loss) before income taxes (GAAP) $175-$250 $80-$110 $155-$260 $(272) $125 $(122) Add back: Interest expense Depreciation, amortization and accretion EBITDA (3) (non-gaap) $935-$1,010 $300-$330 $1,230-$1,335 $456 $319 $892 Add back: Loss on impairment of goodwill (Gain) loss on asset disposals, net (Gain) loss on sale of business and other exit costs, net (1) (1) (Gain) loss on license sales and exchanges, net (20) (20) (22) (22) Adjusted EBITDA (3) (non-gaap) $925-$1,000 $300-$330 $1,220-$1,325 $820 $323 $1,152 Deduct: Equity in earnings of unconsolidated entities Interest and dividend income Other, net (7) Adjusted OIBDA (3) (non-gaap) $760-$810 $290-$320 $1,045-$1,125 $675 $314 $996 (1), (3), (5), (6), (7) - See slide 28 for explanations 25
26 Cable and Wireline Reconciliation to Total TDS Telecom (5) Adjusted OIBDA and Adjusted EBITDA Reconciliation For Year-Ended December 31, 2017 ($ in millions) Wireline Cable Cable/Wireline Adjustments Cable and Wireline HMS Eliminations TDS Telecom (As reported) (7) Total operating revenues $714 $206 ($1) $919 $225 ($4) $1,140 Income (loss) before income taxes (GAAP) $117 $8 $125 ($60) $65 Add back: Interest expense 4 4 Depreciation, amortization and accretion expense EBITDA (3) (Non-GAAP) $267 $52 $319 ($29) $291 Add back: Loss on impairment of goodwill (Gain) loss on sale of business and other exit costs, net (Gain) loss on license sales and exchanges, net (Gain) loss on asset disposals, net Adjusted EBITDA (3) (Non-GAAP) $269 $54 $323 $6 $329 Deduct: Equity in earnings of unconsolidated entities Interest and dividend income Other, net (7) Adjusted OIBDA (3) (Non-GAAP) $260 $54 $314 $6 $320 (3), (5), (7) - See slide 28 for explanations 26
27 Postpaid ABPU (4) and Postpaid ABPA (4) Reconciliation (Dollars and connection counts in millions)) Three months ended September 30, 2018 (1) Three Months Ended September 30, 2017 Calculation of Postpaid ARPU Postpaid service revenues $607 $586 Average number of postpaid connections Number of months in period 3 3 Postpaid ARPU (GAAP metric) $45.31 $43.41 Calculation of Postpaid ABPU (4) Postpaid service revenues $607 $586 Equipment installment plan billings Total billings to postpaid connections $796 $738 Average number of postpaid connections Number of months in period 3 3 Postpaid ABPU (non-gaap metric) $59.41 $54.71 Calculation of Postpaid ARPA Postpaid service revenues $607 $586 Average number of postpaid accounts Number of months in period 3 3 Postpaid ARPA (GAAP metric) $ $ Calculation of Postpaid ABPA (4) Postpaid service revenues $607 $586 Equipment installment plan billings Total billings to postpaid accounts $796 $738 Average number of postpaid accounts Number of months in period 3 3 Postpaid ABPA (non-gaap metric) $ $ (1), (4) - See slide 28 for explanations 27
28 1) As of January 1, 2018, TDS and U.S. Cellular adopted ASC 606, using modified retroactive approach. Under this method, the new accounting standard is applied only to ) Total cash expenses represent total operating expenses as shown in the Consolidated Statement of Operations Highlights in the TDS and U.S. Cellular SEC Forms 8-K, less depreciation, amortization and accretion and gain/losses. 3) EBITDA, Adjusted EBITDA and Adjusted OIBDA are defined as net income adjusted for the items set forth in the reconciliation on slide 24. EBITDA, Adjusted EBITDA and Adjusted OIBDA are not measures of financial performance under Generally Accepted Accounting Principles in the United States (GAAP) and should not be considered as alternatives to Net income or Cash flows from operating activities, as indicators of cash flows or as measures of liquidity. TDS and U.S. Cellular do not intend to imply that any such items set forth in the reconciliation on slide 24 are non-recurring, infrequent or unusual; such items may occur in the future. Management uses Adjusted EBITDA and Adjusted OIBDA as measurements of profitability, and therefore reconciliations to Net income are deemed appropriate. Management believes Adjusted EBITDA and Adjusted OIBDA are useful measures of TDS and U.S. Cellular's operating results before significant recurring non-cash charges, gains and losses, and other items as presented above as they provide additional relevant and useful information to investors and other users of TDS and U.S. Cellular's financial data in evaluating the effectiveness of its operations and underlying business trends in a manner that is consistent with management s evaluation of business performance. Adjusted EBITDA shows adjusted earnings before interest, taxes, depreciation, amortization and accretion, and gains and losses, while Adjusted OIBDA reduces this measure further to exclude Equity in earnings of unconsolidated entities and Interest and dividend income in order to more effectively show the performance of operating activities excluding investment activities. The table on slide 24 reconciles EBITDA, Adjusted EBITDA and Adjusted OIBDA flow to the corresponding GAAP measure, Net income or Income (loss) before income taxes. Additional information and reconciliations related to Non-GAAP financial measures for September 30, 2018, can be found on TDS and U.S. Cellular's website at investors.tdsinc.com or investors.uscellular.com. 4) U.S. Cellular presents Postpaid ABPU and Postpaid ABPA to reflect the revenue shift from Service revenues to Equipment and product sales resulting from the increased adoption of equipment installment plans. Postpaid ABPU and Postpaid ABPA, as previously defined, are non-gaap financial measures which U.S. Cellular believes are useful to investors and other users of its financial information in showing trends in both service and equipment revenues received from customers. 5) TDS has re-evaluated internal reporting roles with regard to its HMS business unit and, as a result, has changed its reportable segments. Effective January 1, 2018, HMS is no longer reported under TDS Telecom. Prior periods have been recast to conform to the revised presentation. 6) The TDS column includes U.S. Cellular, TDS Telecom and also the impacts of consolidating eliminations, corporate operations and non-reportable segments (including HMS as indicated in Note (5) above). 7) ASU , regarding net periodic pension cost and net periodic postretirement benefit cost was adopted as of January 1, 2018, and applied retrospectively. All prior periods have been recast to conform to this standard. 28
Second Quarter 2018 Results. August 3, 2018
 Second Quarter 2018 Results August 3, 2018 Safe Harbor Statement Under the Private Securities Litigation Reform Act of 1995 All information set forth in this presentation, except historical and factual
First Quarter 2018 Results. May 1, 2018
 First Quarter 2018 Results May 1, 2018 Safe Harbor Statement Under the Private Securities Litigation Reform Act of 1995 All information set forth in this presentation, except historical and factual information,
First Quarter 2017 Results. May 5, 2017
 First Quarter 2017 Results May 5, 2017 Safe Harbor Statement Under the Private Securities Litigation Reform Act of 1995 All information set forth in this presentation, except historical and factual information,
Third Quarter 2017 Results. November 8, 2017
 Third Quarter 2017 Results November 8, 2017 Safe Harbor Statement Under the Private Securities Litigation Reform Act of 1995 All information set forth in this presentation, except historical and factual
Fourth Quarter 2017 Results 2017 Accomplishments 2018 Strategic Priorities and Guidance. February 23, 2018
 Fourth Quarter 2017 Results 2017 Accomplishments 2018 Strategic Priorities and Guidance February 23, 2018 Safe Harbor Statement Under the Private Securities Litigation Reform Act of 1995 All information
TDS reports strong third quarter 2018 results
 As previously announced, TDS will hold a teleconference November 2, 2018, at 9:30 a.m. CDT. Listen to the call live via the Events & Presentations page of investors.tdsinc.com. FOR IMMEDIATE RELEASE TDS
TDS reports second quarter 2018 results U.S. Cellular raises guidance
 As previously announced, TDS will hold a teleconference August 3, 2018, at 9:30 a.m. CDT. Listen to the call live via the Events & Presentations page of investors.tdsinc.com. FOR IMMEDIATE RELEASE TDS
TDS reports fourth quarter and full year 2017 results Provides 2018 guidance
 As previously announced, TDS will hold a teleconference February 23, 2018 at 9:30 a.m. CST. Listen to the call live via the Events & Presentations page of investors.tdsinc.com. FOR IMMEDIATE RELEASE TDS
First Quarter 2016 Results. May 6, 2016
 First Quarter 2016 Results May 6, 2016 Safe Harbor Statement Under the Private Securities Litigation Reform Act of 1995 All information set forth in this presentation, except historical and factual information,
TDS reports second quarter 2017 results 2017 guidance reaffirmed
 As previously announced, TDS will hold a teleconference August 4, 2017, at 9:30 a.m. CDT. Listen to the call live via the Events & Presentations page of investors.tdsinc.com. FOR IMMEDIATE RELEASE TDS
Deutsche Bank 25th Annual Media and Telecom Conference March 6, 2017
 Deutsche Bank 25th Annual Media and Telecom Conference March 6, 2017 Safe Harbor Statement All information set forth in this presentation, except historical and factual information, represents forward-looking
U.S. Cellular reports second quarter 2018 results U.S. Cellular raises guidance
 As previously announced, U.S. Cellular will hold a teleconference August 3, 2018, at 9:30 a.m. CDT. Listen to the live call via the Events & Presentations page of investors.uscellular.com. FOR IMMEDIATE
Second Quarter Results. August 1, 2014
 Second Quarter Results August 1, 2014 Safe Harbor Statement Under the Private Securities Litigation Reform Act of 1995 All information set forth in this presentation, except historical and factual information,
November 7, U.S. Cellular Midwest Market Announcement TDS Third Quarter 2012 Results and Guidance
 November 7, 2012 U.S. Cellular Midwest Market Announcement TDS Third Quarter 2012 Results and Guidance Safe Harbor Statement Under the Private Securities Litigation Reform Act of 1995 Safe Harbor Statement
UBS 38 th Annual Global Media and Communications Conference. December 7, 2010
 UBS 38 th Annual Global Media and Communications Conference December 7, 2010 1 LeRoy T. Carlson, Jr. President and CEO 2 Safe Harbor Safe Harbor Statement Under the Private Securities Litigation Reform
U.S. CELLULAR REPORTS FOURTH QUARTER 2012 RESULTS AND 2013 FINANCIAL GUIDANCE
 As previously announced, U.S. Cellular will hold a teleconference Feb. 26, 2013 at 9:30 a.m. CST. Listen to the live call via the Conference Calls page of www.teldta.com or www.uscellular.com. Contact:
U.S. CELLULAR REPORTS SECOND QUARTER 2013 RESULTS
 As previously announced, U.S. Cellular will hold a teleconference Aug. 2, 2013 at 9:30 a.m. CDT. Listen to the live call via the Conference Calls page of teldta.com or uscellular.com. Contact: Jane W.
7:30 a.m. CST. (312) (312) FOR REPORTS. retail customers. increased Postpaid smartphone. end.
 (312) FOR REPORTS. retail customers. increased Postpaid smartphone. end.") As previously announced, U.S. Cellular will hold a teleconference Nov. 7, 2012 at 7:30 a.m. CST. Interested parties may listen to the call live by accessing the Investor Relations page of www.uscellular.com
As previously announced, U.S. Cellular will hold a teleconference Nov. 7, 2012 at 7:30 a.m. CST. Interested parties may listen to the call live by accessing the Investor Relations page of www.uscellular.com
2016 Annual Report
 2016 Annual Report www.tdsinc.com TDS 2016 QUICK FACTS 32 % INCREASE IN IPTV CONNECTIONS 99% OF U.S. CELLULAR CUSTOMERS HAVE ACCESS TO 4G LTE SPEEDS TDS REJOINS THE STRONG CUSTOMER LOYALTY AT U.S. CELLULAR
Sandra L. Helton Executive Vice President and CFO Telephone and Data Systems, Inc. Deutsche Bank Media/Telecom Conference June 13, 2006
 Sandra L. Helton Executive Vice President and CFO Telephone and Data Systems, Inc. Deutsche Bank Media/Telecom Conference June 13, 2006 Safe Harbor Safe Harbor Statement Under the Private Securities Litigation
2 nd Quarter 2018 Earnings Results. July 24, 2018
 2 nd Quarter 2018 Earnings Results July 24, 2018 Safe Harbor statement NOTE: In this presentation we have made forward-looking statements. These statements are based on our estimates and assumptions and
Less: Net Income Attributable to Noncontrolling Interest (82) (107) (90) (78) (357) (105) (99) (94) (99) (397) (97) (91)
 (107) (90) (78) (357) (105) (99) (94) (99) (397) (97) (91)") Consolidated Statements of Income 3 AT&T Inc. Dollars in millions except per share amounts Unaudited 3/31/16 6/30/16 9/30/16 12/31/16 2016 3/31/17 6/30/17 9/30/17 12/31/17 2017 3/31/18 3/31/18 Operating
Consolidated Statements of Income 3 AT&T Inc. Dollars in millions except per share amounts Unaudited 3/31/16 6/30/16 9/30/16 12/31/16 2016 3/31/17 6/30/17 9/30/17 12/31/17 2017 3/31/18 3/31/18 Operating
Kenneth R. Meyers. Peter L. Sereda
 Kenneth R. Meyers Executive Vice President and Chief Financial Officer Peter L. Sereda Vice President and Treasurer Deutsche Bank 16 th Annual 2008 Media and Telecommunications Conference June 9, 2008
3 rd Quarter 2011 Earnings Results
 3 rd Quarter 2011 Earnings Results Fran Shammo Chief Financial Officer October 21, 2011 Safe Harbor Statement NOTE: This presentation contains statements about expected future events and financial results
Shenandoah Telecommunications Company Reports Second Quarter 2018 Results
 Shenandoah Telecommunications Company Reports Second Quarter 2018 Results August 7, 2018 Company Achieves Triple Digit Operating Income Growth Second Quarter 2018 Highlights Second quarter operating revenue
Page 2. Historical Accounting. Method 2
 Consolidated Statements of Income 3 AT&T Inc. except per share amounts Unaudited 3/31/17 6/30/17 9/30/17 12/31/17 2017 3/31/18 6/30/18 9/30/18 12/31/18 2018 3/31/18 6/30/18 9/30/18 12/31/18 2018 Operating
Financial and Operational Trends
 Q3 2018 AT&T EARNINGS Financial and Operational Trends INCOME STATEMENTS, CASH FLOWS, SEGMENT RESULTS, REVENUE DETAILS AND OPERATING VOLUMES OCTOBER 24, 2018 Consolidated Statements of Income 3 AT&T Inc.
Equipment 4,375 4,260 4,455 5,667 18,757 3,848 4,138 4,191 6,532 18,709 4,848 4,377 4,848 4,377
 Consolidated Statements of Income 3 AT&T Inc. except per share amounts Unaudited 3/31/16 6/30/16 9/30/16 12/31/16 2016 3/31/17 6/30/17 9/30/17 12/31/17 2017 3/31/18 6/30/18 3/31/18 6/30/18 Operating Revenues
Selected Financial Data
 Selected Financial Data Results of Operations (dollars in millions, except per share amounts) 2017 2016 2015 2014 2013 Operating revenues $ 126,034 $ 125,980 $ 131,620 $ 127,079 $ 120,550 Operating income
Wachovia Securities Media and Communications 2006
 Wachovia Securities Media and Communications 2006 Bill Megan -- EVP Finance & CFO May 24, 2006 1 Safe Harbor Safe Harbor Statement Under the Private Securities Litigation Reform Act of 1995: All information
Selected Financial Data
 verizon communications inc. and subsidiaries Selected Financial Data (dollars in millions, except per share amounts) 2014 2013 2012 2011 2010 Results of Operations Operating revenues $ 127,079 $ 120,550
Management s Discussion and Analysis of Financial Condition and Results of Operations
 Management s Discussion and Analysis of Financial Condition and Results of Operations Overview Verizon Communications Inc. (Verizon or the Company) is a holding company that, acting through its subsidiaries,
Condensed Consolidated Statements of Income
 Condensed Consolidated Statements of Income (dollars in millions, except per share amounts) 9/30/17 9/30/16 % Change 9/30/17 9/30/16 % Change Operating Revenues Service revenues and other Wireless equipment
Condensed Consolidated Statements of Income
 Condensed Consolidated Statements of Income (dollars in millions, except per share amounts) Operating Revenues $ 30,818 $ 29,420 4.8 Operating Expenses Cost of services and sales 11,189 10,932 2.4 Selling,
Verizon Communications Inc. Condensed Consolidated Statements of Income. Operating Revenues $ 31,483 $ 29, $ 62,301 $ 59,206 5.
 Condensed Consolidated Statements of Income (dollars in millions, except per share amounts) Operating Revenues $ 31,483 $ 29,786 5.7 $ 62,301 $ 59,206 5.2 Operating Expenses Cost of services and sales
Supplemental Financial Information. Third Quarter 2018
 Supplemental Financial Information Third Quarter 2018 TSX: RCI NYSE: RCI Consolidated Financial Results (In millions of dollars, except per share amounts) Q3'18 Q2'18 Q1'18 Annual Q4'17 Q3'17 Q2'17 Q1'17
Investor Update. Second Quarter 2018 July 31, Frontier Communications
 Investor Update Second Quarter July 31, Agenda 1 Strategic and Operational Review Daniel McCarthy President & Chief Executive Officer 2 Financial Review Perley McBride Executive Vice President & Chief
Selected Financial Data
 Selected Financial Data (dollars in millions, except per share amounts) 2016 2015 2014 2013 2012 Results of Operations Operating revenues $ 125,980 $ 131,620 $ 127,079 $ 120,550 $ 115,846 Operating income
[1] after adjusting for hurricane and other non-recurring charges
![[1] after adjusting for hurricane and other non-recurring charges](/thumbs/80/82165558.jpg "[1] after adjusting for hurricane and other non-recurring charges") [1] after adjusting for hurricane and other non-recurring charges [2] Ookla s analysis of Speedtest Intelligence data comparing March 2017 to March 2018 for all mobile results 54.6 54.6 53.6 53.7 54.0
[1] after adjusting for hurricane and other non-recurring charges [2] Ookla s analysis of Speedtest Intelligence data comparing March 2017 to March 2018 for all mobile results 54.6 54.6 53.6 53.7 54.0
Frontier Communications Reports 2018 First Quarter Results
 401 Merritt 7 Norwalk, CT 06851 (203) 614-5600 www.frontier.com Frontier Communications Reports 2018 First Quarter Results First Quarter Total revenue of $2.20 billion Achieved sequential growth in consumer
Share on share on facebookshare on twittershare on google_plusone_shareshare on linkedinshare on more28 Consolidated
 141021_Earnings_Q32014_640x400.jpg 10.21.2014 Financial Verizon Reports Strong Customer Additions and Another Quarter of Double-Digit Earnings Growth Share on emailshare on facebookshare on twittershare
[1] excluding the impact of the new revenue recognition standard
![[1] excluding the impact of the new revenue recognition standard](/thumbs/85/92222296.jpg "[1] excluding the impact of the new revenue recognition standard") [1] excluding the impact of the new revenue recognition standard [2] Sprint is the most improved network according to Ookla as shown in Speedtest Intelligence data1, and PCMag s 2018 Fastest Mobile Networks.
[1] excluding the impact of the new revenue recognition standard [2] Sprint is the most improved network according to Ookla as shown in Speedtest Intelligence data1, and PCMag s 2018 Fastest Mobile Networks.
For the full year, wireless service revenue plus installment plan billings and lease revenue of $28.4 billion was up slightly from the prior year.
 SPRINT FINISHES FISCAL YEAR 2015 BY GENERATING POSITIVE ANNUAL OPERATING INCOME FOR THE FIRST TIME IN NINE YEARS AND DELIVERING MORE POSTPAID PHONE NET ADDITIONS THAN VERIZON AND AT&T FOR THE FIRST TIME
Nov. 3, 2015 SPRINT QUARTERLY INVESTOR UPDATE FISCAL 2Q15 1
 Nov. 3, 2015 SPRINT QUARTERLY INVESTOR UPDATE FISCAL 2Q15 1 SPRINT HITS INFLECTION POINT IN ITS TURNAROUND BY REPORTING POSITIVE POSTPAID PHONE NET ADDITIONS AND RECORD LOW POSTPAID CHURN IN THE SECOND
Investor Update. Fiscal 1Q
 Investor Update Fiscal 1Q17 8-1-2017 www.sprint.com/investors 2 3 Highlights TABLE of contents 4 Customer Metrics Fiscal 2Q16 8 10 Activations Network 11 Financials 17 Liquidity 18 Outlook 19 Results Tables
[1] after adjusting for hurricane and other non-recurring charges
![[1] after adjusting for hurricane and other non-recurring charges](/thumbs/95/122862988.jpg "[1] after adjusting for hurricane and other non-recurring charges") [1] after adjusting for hurricane and other non-recurring charges [2] Average download speed increase based on Ookla s analysis of Speedtest Intelligence data comparing December 2016 to December 2017 for
[1] after adjusting for hurricane and other non-recurring charges [2] Average download speed increase based on Ookla s analysis of Speedtest Intelligence data comparing December 2016 to December 2017 for
 www.sprint.com/investors We took another step forward in our plan toward sustainable profitability and cash generation with this quarter s results. The top line is now growing, we continue to take costs
Charter Communications Second Quarter 2008 Earnings Call August 5, 2008
 Charter Communications Second Quarter 2008 Earnings Call August 5, 2008 1 Cautionary Statement Regarding Forward Looking Statements CAUTIONARY STATEMENT REGARDING FORWARD-LOOKING STATEMENTS: This presentation
Frontier Communications Reports 2017 First Quarter Results
 May 2, 2017 Frontier Communications Reports 2017 First Quarter Results Adjusted EBITDA 1 of $923 million and quarterly Net Loss of $75 million Third sequential quarter of improved FiOS gross adds in CTF
SPRINT REPORTS INFLECTION IN WIRELESS SERVICE REVENUE WITH FISCAL YEAR 2018 FIRST QUARTER RESULTS
 SPRINT REPORTS INFLECTION IN WIRELESS SERVICE REVENUE WITH FISCAL YEAR 2018 FIRST QUARTER RESULTS Wireless service revenue grew sequentially for the first time in more than four years, excluding the impact
Cincinnati Bell Second Quarter 2018 Results August 8, 2018
 Cincinnati Bell Second Quarter 2018 Results August 8, 2018 Safe Harbor This presentation may contain forward-looking statements, as defined in federal securities laws including the Private Securities Litigation
Financial and Operational Trends
 Q4 2017 AT&T EARNINGS Financial and Operational Trends Income Statements, Cash Flows, Segment Results, Revenue Details and Operating Volumes JANUARY 31, 2018 Consolidated Statements of Income AT&T Inc.
AT&T INC. FINANCIAL REVIEW 2017
 AT&T INC. FINANCIAL REVIEW 2017 Selected Financial and Operating Data 14 Management s Discussion and Analysis of Financial Condition and Results of Operations 15 Consolidated Financial Statements 49 Notes
Cincinnati Bell Third Quarter 2013 Results. November 7, 2013
 Cincinnati Bell Third Quarter 2013 Results November 7, 2013 Today s Agenda Highlights & Strategic Investments Ted Torbeck, President & Chief Executive Officer Segment Results & Financial Overview Leigh
[1] excluding the impact of the new rev enue standard
![[1] excluding the impact of the new rev enue standard](/thumbs/89/99440225.jpg "[1] excluding the impact of the new rev enue standard") [1] excluding the impact of the new rev enue standard 54.6 54.6 54.6 54.5 54.0 378 385 44 57 (20) Net Additions (Losses) - In Thousands End of Period Connections - In Millions The company had 20,000 net
[1] excluding the impact of the new rev enue standard 54.6 54.6 54.6 54.5 54.0 378 385 44 57 (20) Net Additions (Losses) - In Thousands End of Period Connections - In Millions The company had 20,000 net
August 9, Q18 Earnings Presentation
 August 9, 2018 2Q18 Earnings Presentation Participants Tony Thomas Chief Executive Officer Bob Gunderman Chief Financial Officer & Treasurer Chris King VP, Investor Relations 2 Safe Harbor Statement Windstream
2011 Annual Report uscellular.com
 2011 Annual Report uscellular.com 2011 performance highlights service revenues (in billions) total average monthly service revenue (Per customer) $4.0 $3.0 $3.7 $3.9 $3.9 $3.9 $4.1 $60 $40 $51.08 $53.22
Selected Financial Data
 verizon communications inc. and subsidiaries Selected Financial Data (dollars in millions, except per share amounts) 2011 2010 2009 2008 2007 Results of Operations Operating revenues $ 110,875 $ 106,565
SPRINT NEXTEL REPORTS FIRST QUARTER 2007 RESULTS
 Contacts: Media Relations James Fisher 703-433-8677 james.w.fisher@sprint.com Investor Relations Kurt Fawkes 800-259-3755 Investor.relations@sprint.com SPRINT NEXTEL REPORTS FIRST QUARTER 2007 RESULTS
Verizon ends first-half 2018 with strong operating results
 News Release FOR IMMEDIATE RELEASE July 24, 2018 Media contacts: Bob Varettoni 908.559.6388 robert.a.varettoni@verizon.com Eric Wilkens 908.559.3063 eric.wilkens@verizon.com Verizon ends first-half 2018
2016 Shareholder Meeting. April 19, 2016
 2016 Shareholder Meeting April 19, 2016 Management Reports Chris French President and CEO Safe Harbor Statement This presentation includes forward-looking statements within the meaning of Section 27A of
(20) 3QFY17 4QFY17 1QFY18 2QFY18 3QFY18
 3QFY17 4QFY17 1QFY18 2QFY18 3QFY18") 54.6 54.6 54.6 54.5 54.5 385 44 57 48 (20) Net Additions (Losses) - In Thousands End of Period Connections - In Millions The company had 48,000 net additions in the current quarter compared with 385,000
54.6 54.6 54.6 54.5 54.5 385 44 57 48 (20) Net Additions (Losses) - In Thousands End of Period Connections - In Millions The company had 48,000 net additions in the current quarter compared with 385,000
Sprint is turning the corner. Even with all the aggressive promotional offers from our competitors, we were still able to add more postpaid phone
 Sprint is turning the corner. Even with all the aggressive promotional offers from our competitors, we were still able to add more postpaid phone customers than both Verizon and AT&T while continuing to
2016 Annual Report. uscellular.com
 2016 Annual Report uscellular.com U.S. CELLULAR 2016 QUICK FACTS 5 million customers Strong customer loyalty 1.3% average churn rate 99% of customers have access to 4G LTE speeds Smartphone penetration
Sprint took a big step forward in the second year of our turnaround plan. Net operating revenues returned to growth and cost reductions accelerated,
 Sprint took a big step forward in the second year of our turnaround plan. Net operating revenues returned to growth and cost reductions accelerated, leading to the highest operating income in a decade
Cincinnati Bell First Quarter 2017 Results May 9, 2017
 Cincinnati Bell First Quarter 2017 Results May 9, 2017 Today's Agenda Highlights, Segment Results and Financial Overview Leigh Fox, President & Chief Operating Officer Question & Answer 2 Safe Harbor This
November 8, Q18 Earnings Presentation
 November 8, 2018 3Q18 Earnings Presentation Participants Tony Thomas Chief Executive Officer Bob Gunderman Chief Financial Officer & Treasurer Chris King VP, Investor Relations 2 Safe Harbor Statement
Windstream reports third-quarter results
 Windstream reports third-quarter results November 8, 2018 Grew broadband customer base for second consecutive quarter Continued acceleration in SD-WAN and Enterprise strategic sales Delivered third consecutive
MANAGEMENT'S DISCUSSION AND ANALYSIS
 MANAGEMENT'S DISCUSSION AND ANALYSIS This Management's Discussion and Analysis (MD&A) contains important information about our business and our performance for the three months ended March 3, 08, as well
Consolidated Communications Investor Presentation. December 2018
 Consolidated Communications Investor Presentation December 2018 Safe Harbor The Securities and Exchange Commission ( SEC ) encourages companies to disclose forward-looking information so that investors
First national carrier on record to improve postpaid churn from the April-June quarter to the July- September quarter
 SPRINT HITS INFLECTION POINT IN ITS TURNAROUND BY REPORTING POSITIVE POSTPAID PHONE NET ADDITIONS AND RECORD LOW POSTPAID CHURN IN THE SECOND FISCAL QUARTER OF 2015 First national carrier on record to
Fourth Quarter 2018 Results. January 31, 2019
 Fourth Quarter 2018 Results January 31, 2019 Cautionary Statement Regarding Forward-Looking Statements This quarterly presentation includes forward-looking statements within the meaning of Section 27A
News Release. Sprint Nextel 6200 Sprint Parkway Overland Park, Kan SPRINT NEXTEL REPORTS FOURTH QUARTER AND FULL-YEAR 2008 RESULTS
 News Release Sprint Nextel 6200 Sprint Parkway Overland Park, Kan. 66251 Contacts: Media Relations James Fisher 703-433-8677 james.w.fisher@sprint.com Investor Relations Yijing Brentano 800-259-3755 Investor.relations@sprint.com
FOR IMMEDIATE RELEASE Leap Contacts: Greg Lund, Media Relations
 FOR IMMEDIATE RELEASE Leap Contacts: Greg Lund, Media Relations 858-882-9105 glund@leapwireless.com Amy Wakeham, Investor Relations 858-882-6084 awakeham@leapwireless.com Leap Reports Strong Growth for
RBC Capital Markets 2009 Technology, Media & Communications Conference
 RBC Capital Markets 2009 Technology, Media & Communications Conference San Francisco, CA Brent Whittington, Executive Vice President and CFO June 10, 2009 Safe Harbor Statement Safe Harbor Statement Windstream
Fourth Quarter and Annual Results 2015
 Fourth Quarter and Annual Results 2015 Highlights Rising customer satisfaction supporting continued strong base growth in Consumer in Q4 2015 and FY 2015 +40k broadband net adds (FY 2015: +139k) and +69k
News Release. Sprint Nextel 6200 Sprint Parkway Overland Park, Kan SPRINT NEXTEL REPORTS THIRD QUARTER 2008 RESULTS
 News Release Sprint Nextel 6200 Sprint Parkway Overland Park, Kan. 66251 Contacts: Media Relations James Fisher 703-433-8677 james.w.fisher@sprint.com Investor Relations Yijing Brentano 800-259-3755 Investor.relations@sprint.com
Rogers Communications Reports Strong First Quarter 2006 Results
 Rogers Communications Reports Strong First Quarter 2006 Results Quarterly Revenue Grows to $2.0 Billion, Operating Profit Increases to Nearly $600 Million, and Strong Subscriber Growth Continues; Wireless
Cincinnati Bell Second Quarter 2017 Results August 4, 2017
 Cincinnati Bell Second Quarter 2017 Results August 4, 2017 Safe Harbor This presentation may contain forward-looking statements, as defined in federal securities laws including the Private Securities Litigation
Selected Financial Data
 Verizon Communications Inc. and Subsidiaries 9 Selected Financial Data (dollars in millions, except per share amounts) 2015 2014 2013 2012 2011 Results of Operations Operating revenues $ 131,620 $ 127,079
Consolidated Communications Investor Presentation. August 2018
 Consolidated Communications Investor Presentation August 2018 Safe Harbor The Securities and Exchange Commission ( SEC ) encourages companies to disclose forward-looking information so that investors can
SPRINT DELIVERS BEST FINANCIAL RESULTS IN COMPANY HISTORY WITH HIGHEST EVER NET INCOME AND OPERATING INCOME IN FISCAL YEAR 2017
 SPRINT DELIVERS BEST FINANCIAL RESULTS IN COMPANY HISTORY WITH HIGHEST EVER NET INCOME AND OPERATING INCOME IN FISCAL YEAR 2017 Fiscal year 2017 postpaid phone net additions of 606,000 o Third consecutive
Safe Harbor. Forward-Looking Statements + Disclaimer. Additional Information Relating to Defined Terms:
 Liberty Global plc Investor Call 2018 May 9, 2018 Safe Harbor Forward-Looking Statements + Disclaimer This presentation contains forward-looking statements within the meaning of the Private Securities
Q Investor Call. November 6, 2014
 Q3 2014 Investor Call November 6, 2014 Safe Harbor Safe Harbor Statement Under the Private Securities Litigation Reform Act of 1995: This presentation contains forward-looking statements within the meaning
1Q18 Earnings Presentation. May 3, 2018
 1Q18 Earnings Presentation May 3, 2018 Participants Tony Thomas Chief Executive Officer Bob Gunderman Chief Financial Officer Chris King VP, Investor Relations 2 Safe Harbor Statement Safe Harbor Statement
Investor. Update. Fourth Quarter 2017 FEBRUARY 27, 2018
 184934579 Investor Update Fourth Quarter 2017 FEBRUARY 27, 2018 Strategic and Operational Review Daniel McCarthy PRESIDENT & CHIEF EXECUTIVE OFFICER 2 Business Update Total revenues of $2.22 billion Consumer
Safe Harbor. Forward-Looking Statements. Information Relating to Defined Terms:
 Safe Harbor Forward-Looking Statements This presentation contains forward-looking statements within the meaning of the Private Securities Litigation Reform Act of 1995, including statements with respect
Exhibit 99.1 Ra R y a m y o m n o d n d J a J m a e m s e s I n I v n e v s e t s o t r o r C o C n o f n e f r e e r n e c n e c March 11, 2009
 Exhibit 99.1 Raymond James Investor Conference March 11, 2009 Safe Harbor Statement This presentation includes forward-looking statements within the meaning of Section 27A of the Securities Act and Section
AT&T INC. FINANCIAL REVIEW 2018
 AT&T INC. FINANCIAL REVIEW 2018 Selected Financial and Operating Data... 18 Management s Discussion and Analysis of Financial Condition and Results of Operations... 19 Consolidated Financial Statements...
Investor. Update. First Quarter 2017 MAY 2, 2017
 184934579 Investor Update First Quarter 2017 MAY 2, 2017 Earnings Call Agenda Strategic and Operational Review Financial Results Daniel McCarthy PRESIDENT & CHIEF EXECUTIVE OFFICER Perley McBride EXECUTIVE
Sprint Nextel 3Q12 Earnings Conference Call
 Sprint Nextel 3Q12 Earnings Conference Call October 25, 2012 Cautionary Statement This presentation includes forward-looking statements within the meaning of the securities laws. The words may, could,
SPRINT REPORTS HIGHEST RETAIL PHONE NET ADDITIONS IN MORE THAN TWO YEARS WITH FISCAL 2017 SECOND QUARTER RESULTS
 SPRINT REPORTS HIGHEST RETAIL PHONE NET ADDITIONS IN MORE THAN TWO YEARS WITH FISCAL 2017 SECOND QUARTER RESULTS Highest share of postpaid phone gross additions in company history o Postpaid phone gross
Cincinnati Bell Fourth Quarter 2016 Results February 15, 2017
 Cincinnati Bell Fourth Quarter 2016 Results February 15, 2017 Today's Agenda Highlights, Segment Results and Financial Overview Ted Torbeck, Chief Executive Officer Question & Answer 2 Safe Harbor This
THIRD QUARTER 2018 RESULTS November 6, 2018
 THIRD QUARTER 2018 RESULTS November 6, 2018 Safe Harbor for Forward-Looking Statements Certain statements in this presentation are forward-looking statements within the meaning of the Private Securities
AT&T Reports Fourth-Quarter Results
 News Release AT&T Reports Fourth-Quarter Results Full-Year Consolidated Results Diluted EPS of $2.85 as reported compared to $4.76 in the prior year (2017 impacted by tax reform) Adjusted EPS of $3.52
This presentation and the documents incorporated by reference herein contain forward-looking statements regarding future events and our future
 This presentation and the documents incorporated by reference herein contain forward-looking statements regarding future events and our future results that are subject to the safe harbor provisions of
Frontier Communications Reports 2013 Fourth Quarter and Full Year Results
 February 24, 2014 Frontier Communications Reports 2013 Fourth Quarter and Full Year Results STAMFORD, Conn.--(BUSINESS WIRE)-- (NASDAQ:FTR): Q4 2013 Full Year 2013 Strong broadband net additions 27,800
Verizon delivers continued earnings and operational growth in 1Q
 Verizon delivers continued earnings and operational growth in 1Q Thu April 21, 2016 7:25 AM PR Newswire About: VZ PR Newswire NEW YORK, April 21, 2016 /PRNewswire/ 1Q 2016 highlights Consolidated: $1.06
August 6, Q15 Earnings Presentation
 August 6, 2015 2Q15 Earnings Presentation Participants Tony Thomas Chief Executive Officer Bob Gunderman Chief Financial Officer Christie Grumbos Treasurer 2 Safe Harbor Statement Safe Harbor Statement
PARTNER COMMUNICATIONS REPORTS FOURTH QUARTER AND ANNUAL 2017 RESULTS 1
 PARTNER COMMUNICATIONS REPORTS FOURTH QUARTER AND ANNUAL 2017 RESULTS 1 ADJUSTED EBITDA 2 TOTALED NIS 917 MILLION IN 2017 PROFIT TOTALED NIS 114 MILLION IN 2017 NET DEBT 2 DECLINED BY NIS 620 MILLION IN