For the full year, wireless service revenue plus installment plan billings and lease revenue of $28.4 billion was up slightly from the prior year.
|
|
|
- Roy Lee
- 6 years ago
- Views:
Transcription
1 SPRINT FINISHES FISCAL YEAR 2015 BY GENERATING POSITIVE ANNUAL OPERATING INCOME FOR THE FIRST TIME IN NINE YEARS AND DELIVERING MORE POSTPAID PHONE NET ADDITIONS THAN VERIZON AND AT&T FOR THE FIRST TIME ON RECORD IN THE FISCAL FOURTH QUARTER Fiscal year 2015 operating income of $310 million was positive for the first time in nine years; Fiscal year 2015 Adjusted EBITDA* of $8.1 billion grew 36 percent year-over-year o Fiscal fourth quarter operating income of $8 million included charges of $258 million; Adjusted EBITDA* of $2.2 billion grew 24 percent year-over-year Fiscal year 2015 Sprint platform postpaid net additions of more than 1.2 million, including phone net additions of 438,000 which improved nearly two million year-over-year o Fiscal fourth quarter postpaid phone net additions of 22,000 are the third consecutive quarter of positive net additions and more than both Verizon and AT&T for the first time on record o Fiscal year 2015 Sprint platform postpaid churn of 1.61 percent and phone churn of 1.52 percent are the best in company history and both improved by approximately 50 basis points year-over-year Delivered substantial financial flexibility with $11 billion in currently committed liquidity, up from $6 billion at the end of the fiscal third quarter o Ended fiscal year 2015 with $5.7 billion of available liquidity, including $2.6 billion of cash o Successfully raised an additional $5.3 billion in April, including $2.2 billion of networkrelated financing, $1.1 billion from the second transaction with Mobile Leasing Solutions, LLC (MLS), and $2 billion of bridge financing OVERLAND PARK, Kan. May 3, 2016 Sprint Corporation (NYSE: S) today reported operating results for fiscal year 2015 fourth quarter and full year, including a nearly two million year-over-year improvement in Sprint platform postpaid phone net additions and the lowest annual Sprint platform postpaid phone churn in company history. The company also reported fiscal year 2015 net operating revenue of $32.2 billion, operating income of $310 million, and Adjusted EBITDA* of $8.1 billion, which grew 36 percent year-overyear. For the fiscal fourth quarter, the company reported net operating revenue of $8.1 billion, operating income of $8 million, and Adjusted EBITDA* of $2.2 billion, which grew 24 percent year-over-year. Fiscal 2015 was a transformational year in the turnaround of Sprint. We significantly reduced our operating expenses and stabilized operating revenues, leading to positive operating income for the first time in nine years. At the same time, we generated positive postpaid phone net additions for the first time in three years, capped off by surpassing both Verizon and AT&T for the first time on record this quarter, said Sprint CEO Marcelo Claure. These accomplishments provide positive momentum heading into fiscal year 2016 and put the business on a path to sustainable free cash flow. Cost Reduction Effort Showing Results Sprint has a multi-year plan to transform the way it does business and significantly lower its cost structure. The company has realized a $1.3 billion reduction in cost of services and selling, general and administrative (SG&A) expenses in fiscal year Moving forward, Sprint expects a sustainable reduction of $2 billion or more of run rate operating expenses exiting fiscal year 2016 and has already realized a portion of these reductions with its fiscal 2015 fourth
2 quarter results, as about half of the approximately $500 million year-over-year reduction in cost of services and SG&A expenses was related to these fiscal year 2016 initiatives. The company continues to expect approximately $1 billion of transformation program costs, split between both operating expenses and capital expenditures, to be incurred to achieve the $2 billion or more of run rate benefit. Approximately $200 million of the expected transformation program costs, mostly related to severance, were incurred in fiscal year The company also reported the following financial results: Net operating revenues of $8.1 billion in the quarter decreased three percent year-over-year, as growth in equipment revenue, mostly driven by higher leasing revenue, helped offset lower wireless and wireline service revenue. Net operating revenues have stabilized around $8 billion per quarter during fiscal year For the full year, net operating revenues of $32.2 billion decreased seven percent year-over-year. The decline was largely due to Brightstar sourcing some devices in Sprint s indirect channels, resulting in less equipment revenues than if Sprint had fulfilled these channels. While the impact to Adjusted EBITDA* was not material due to the offsetting reduction in cost of products expense, net operating revenues would have declined less year-over-year when adjusting for this change. Wireless service revenue plus installment plan billings and lease revenue, which represents the total recurring cash flows from customers, was $7.1 billion in the fiscal fourth quarter and increased one percent from the prior year period, as growth in both postpaid phone customers and postpaid average billings per user* were partially offset by lower prepaid service revenue. For the full year, wireless service revenue plus installment plan billings and lease revenue of $28.4 billion was up slightly from the prior year. Consolidated Adjusted EBITDA* of $2.2 billion in the fiscal fourth quarter grew 24 percent from the prior year period, as expense reductions, including approximately $500 million in cost of services and SG&A expenses, more than offset the decline in net operating revenues. For the full year, Consolidated Adjusted EBITDA* was $8.1 billion and grew 36 percent year-overyear. Operating income of $8 million in the fiscal fourth quarter included $258 million of charges and compared to operating income of $318 million in the year-ago quarter. The charges were mostly related to severance and lease exit costs, including the shutdown of legacy WiMAX service that will free up valuable spectrum and immediately lower network costs. Adjusting for the charges in both periods, operating income would have been relatively flat year-over-year. For the full year, operating income of $310 million improved by approximately $2.2 billion and was positive for the first time in nine years. Net loss of $554 million, or $0.14 per share, in the fiscal fourth quarter compared to a net loss of $224 million, or $0.06 per share, in the year-ago period. Adjusting for the aforementioned charges, net loss per share would have been relatively flat year-over-year. For the full year, net loss was approximately $2 billion, or $0.50 per share, compared to a net loss of approximately $3.3 billion, or $0.85 per share, in the prior year, which is an improvement of $1.3 billion, or $0.35 per share.
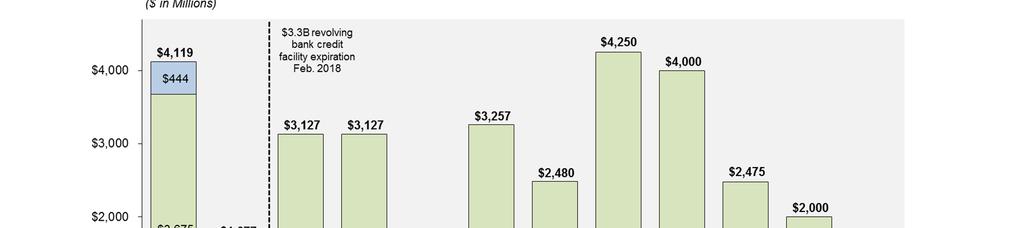
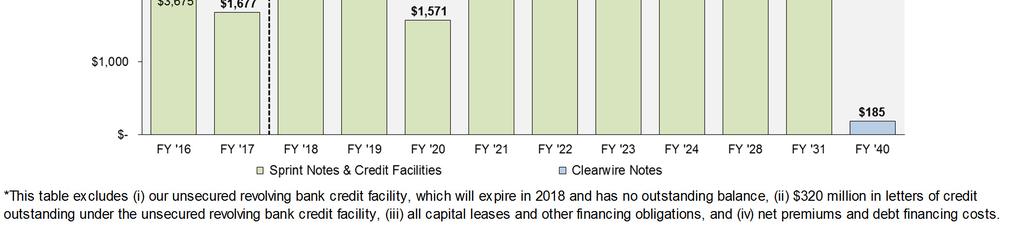
3 Adjusted free cash flow* was $603 million in the fiscal fourth quarter compared to negative $914 million in the prior year, an improvement of approximately $1.5 billion, which was driven by improved business trends and lower capital spending. For the full year, Adjusted free cash flow* of negative $1.4 billion compared to negative $3.3 billion in the prior year, an improvement of nearly $2 billion. Postpaid Phone Customer Growth Continues Sprint has been focused on attracting and retaining higher value postpaid phone customers and added 22,000 of these customers in a highly competitive fiscal fourth quarter, bringing the fiscal year total to 438,000 an improvement of nearly two million from the prior year and the third consecutive quarter of positive postpaid phone net additions. Significant network improvements, a more compelling value proposition, and better customer quality have led to higher customer retention, with postpaid phone churn reaching a record low of 1.52 percent in fiscal year 2015 and improving by approximately 50 basis points year-over-year. For the fiscal fourth quarter, postpaid phone churn of 1.56 percent improved 22 basis points year-over-year. In addition, the company also saw year-over-year growth in postpaid phone gross additions for both the fiscal fourth quarter and full year. The company also reported the following Sprint platform results: Total net additions were 447,000 in the fiscal fourth quarter, including postpaid net additions of 56,000, prepaid net losses of 264,000, and wholesale and affiliate net additions of 655,000. For the full year, total net additions were nearly 2.7 million, including postpaid net additions of more than 1.2 million, prepaid net losses of 1.3 million, and wholesale and affiliate net additions of over 2.7 million. Postpaid churn of 1.72 percent in the fiscal fourth quarter improved by 12 basis points year-overyear and was the lowest ever for a fiscal fourth quarter. For the full year, postpaid churn of 1.61 percent was also the best in company history and improved by approximately 50 basis points year-over-year. $11 Billion of Committed Liquidity Sprint has taken several actions to improve its financial flexibility and currently has $11 billion of committed liquidity, up from $6 billion at the end of the fiscal third quarter. The company also has an additional $1.2 billion of availability under vendor financing agreements that can be used toward the purchase of 2.5 GHz network equipment. Total liquidity at the end of fiscal year 2015 was $5.7 billion, including $2.6 billion of cash and cash equivalents, $3 billion of undrawn borrowing capacity under the revolving bank credit facility, and approximately $100 million of undrawn availability under the receivables facility. Sprint received $2.2 billion from the sale and lease-back of certain existing network assets at an attractive cost of funding in the mid-single digits. This transaction did not include any of the company s spectrum assets. The company executed its second sale-leaseback transaction of certain leased devices with MLS, providing a $1.1 billion cash infusion.
4 Sprint signed an 18-month bridge financing facility for $2 billion with better terms than its alternatives in the high-yield debt market. These sources of liquidity are expected to provide the resources for the company to execute its transformation plan and fully fund the repayment of the $3.3 billion of note maturities that come due in fiscal year The company continues to consider financing initiatives, including structures that would involve a small portion of its spectrum assets, as well as additional transactions with MLS to fund its transformation, continue to improve the network, and meet its future financial obligations. LTE Plus Network Expanding and Outperforming the Competition The Sprint LTE Plus Network, which takes advantage of the company s rich tri-band spectrum portfolio and uses some of the world s most advanced technologies in wireless such as carrier aggregation and antenna beamforming, is now available in 204 markets across the country, including recent launches in New York City, Boston, and Philadelphia. The expansion is driving network performance that is beating the competition. An analysis of Nielsen Mobile Performance crowd-sourced data from January through March 2016 showed that Sprint s LTE Plus Network continued to outperform Verizon, AT&T and T-Mobile by delivering the fastest LTE download speeds. Source: Sprint analysis of Nielsen NMP data for total LTE downloads 150 KB+ in 44 markets (over 155M POPs). Total LTE coverage now reaches nearly 300 million people, including approximately 70 percent being covered by the 2.5 GHz spectrum deployment. Outlook The company expects fiscal year 2016 Adjusted EBITDA* to be $9.5 billion to $10 billion. The company expects fiscal year 2016 operating income to be $1 billion to $1.5 billion. The company expects fiscal year 2016 cash capital expenditures, excluding indirect channel device leases, to be approximately $3 billion, as non-network expenditures are expected to decline yearover-year and more of the cash outlays related to network densification are expected to be incurred
5 in fiscal year The company s deep spectrum position and its small cell focused densification are also expected to improve overall capital efficiency. The company expects fiscal year 2016 Adjusted free cash flow* to be around break-even. Conference Call and Webcast Date/Time: 8:30 a.m. (ET) Tuesday, May 3, 2016 Call-in Information o U.S./Canada: (ID: ) o International: (ID: ) Webcast available via the Internet at Additional information about results, including the Quarterly Investor Update, is available on our Investor Relations website Contact Information Media Contact: Dave Tovar, , David.Tovar@sprint.com Investor Contact: Jud Henry, , Investor.Relations@sprint.com
6 Wireless Operating Statistics (Unaudited) Sprint platform (1) : Net additions (losses) (in thousands) Postpaid ,245 (212) Prepaid (264) (491) 546 (1,309) 449 Wholesale and affiliate ,733 2,349 Total Sprint platform wireless net additions ,249 2,669 2,586 End of period connections (in thousands) Postpaid 30,951 30,895 29,706 30,951 29,706 Prepaid 14,397 14,661 15,706 14,397 15,706 Wholesale and affiliate 13,458 12,803 10,725 13,458 10,725 Total Sprint platform end of period connections 58,806 58,359 56,137 58,806 56,137 Churn Postpaid 1.72% 1.62% 1.84% 1.61% 2.09% Prepaid 5.65% 5.82% 3.84% 5.39% 3.99% Supplemental data - connected devices End of period connections (in thousands) Retail postpaid 1,771 1,676 1,320 1,771 1,320 Wholesale and affiliate 8,575 7,930 5,832 8,575 5,832 Total 10,346 9,606 7,152 10,346 7,152 Supplemental data - total company End of period connections (in thousands) Sprint platform (1) 58,806 58,359 56,137 58,806 56,137 Transactions (2) - - 1,004-1,004 Total 58,806 58,359 57,141 58,806 57,141 (1) (a) Sprint platform ARPU Postpaid $ $ $ $ $ Prepaid $ $ $ $ $ NON-GAAP RECONCILIATION - ABPA*, POSTPAID PHONE ARPU AND ABPU* (Unaudited) (Millions, except accounts, connections, ABPA*, ARPU, and ABPU*) Sprint platform ABPA* (1) Postpaid service revenue $ 4,793 $ 4,813 $ 5,049 $ 19,463 $ 21,181 Add: Installment plan billings , Add: Lease revenue , Total for Sprint platform postpaid connections $ 5,742 $ 5,644 $ 5,472 $ 22,491 $ 22,222 Sprint platform postpaid accounts (in thousands) 11,358 11,261 11,199 11,248 11,453 Sprint platform postpaid ABPA* (b) $ $ $ $ $ Sprint platform postpaid phone ARPU and ABPU* (1) Postpaid phone service revenue $ 4,512 $ 4,529 $ 4,772 $ 18,331 $ 20,095 Add: Installment plan billings , Add: Lease revenue , Total for Sprint platform postpaid phone connections $ 5,429 $ 5,331 $ 5,178 $ 21,246 $ 21,089 Sprint platform postpaid average phone connections (in thousands) 25,297 25,040 24,946 25,020 25,420 Sprint platform postpaid phone ARPU (a) $ $ $ $ $ Sprint platform postpaid phone ABPU* (c) $ $ $ $ $ (a) ARPU is calculated by dividing service revenue by the sum of the monthly average number of connections in the applicable service category. Changes in average monthly service revenue reflect connections for either the postpaid or prepaid service category who change rate plans, the level of voice and data usage, the amount of service credits which are offered to connections, plus the net effect of average monthly revenue generated by new connections and deactivating connections. Sprint platform postpaid phone ARPU represents revenues related to our postpaid phone connections. (b) Sprint platform postpaid ABPA* is calculated by dividing service revenue earned from connections plus installment plan billings and lease revenue by the sum of the monthly average number of accounts during the period. (c) Sprint platform postpaid phone ABPU* is calculated by dividing postpaid phone service revenue earned from postpaid phone connections plus installment plan billings and lease revenue by the sum of the monthly average number of postpaid phone connections during the period.
7 Wireless Device Financing Summary (Unaudited) (Millions, except sales, connections, and sales and connections mix) Postpaid sales (in thousands) 3,438 4,799 4,057 16,394 17,326 Postpaid sales mix Subsidy/other 37% 35% 47% 36% 61% Installment plans 18% 10% 16% 13% 22% Leasing 45% 55% 37% 51% 17% Postpaid connections (in thousands) 30,951 30,895 29,706 30,951 29,706 Postpaid connections mix Subsidy/other 54% 56% 75% 54% 75% Installment plans 13% 14% 15% 13% 15% Leasing 33% 30% 10% 33% 10% Installment plans Installment sales financed $ 311 $ 251 $ 347 $ 1,059 $ 2,200 Installment billings , Installments receivables, net - - 1,396-1,396 Leasing Lease revenue $ 662 $ 531 $ 129 $ 1,838 $ 164 Lease depreciation , Leased device additions: Cash paid for capital expenditures - leased devices $ 568 $ 607 $ 439 $ 2,292 $ 582 Transfers from inventory - leased devices 621 1, ,244 1,246 Total leased device additions $ 1,189 $ 1,680 $ 982 $ 5,536 $ 1,828 Leased devices in property, plant and equipment, net $ 3,645 $ 3,321 $ 1,777 $ 3,645 $ 1,777 Leased device net proceeds Proceeds from MLS sale $ - $ 1,136 $ - $ 1,136 $ - Repayments to MLS Proceeds from lease securitization Repayments of lease securitization Net proceeds from the sale-leaseback of devices and sales of future lease receivables $ 600 $ 1,136 $ - $ 1,736 $ -
8 CONDENSED CONSOLIDATED STATEMENTS OF OPERATIONS (Unaudited) (Millions, except per share data) Net operating revenues Service revenue $ 6,574 $ 6,683 $ 7,138 $ 27,174 $ 29,542 Equipment revenue 1,497 1,424 1,144 5,006 4,990 Total net operating revenues 8,071 8,107 8,282 32,180 34,532 Net operating expenses Cost of services (exclusive of depreciation and amortization below) 2,245 2,348 2,381 9,439 9,660 Cost of products (exclusive of depreciation and amortization below) 1,551 1,589 1,827 5,795 9,309 Selling, general and administrative 1,939 2,129 2,331 8,479 9,563 Depreciation 1,592 1,549 1,091 5,794 3,797 Amortization ,294 1,552 Impairments (3) ,133 Other, net (29) 1, Total net operating expenses 8,063 8,304 7,964 31,870 36,427 Operating income (loss) 8 (197) (1,895) Interest expense (552) (546) (523) (2,182) (2,051) Other income, net Loss before income taxes (539) (739) (197) (1,854) (3,919) Income tax (expense) benefit (15) (97) (27) (141) 574 Net loss $ (554) $ (836) $ (224) $ (1,995) $ (3,345) Basic and diluted net loss per common share $ (0.14) $ (0.21) $ (0.06) $ (0.50) $ (0.85) Weighted average common shares outstanding 3,972 3,970 3,962 3,969 3,953 Effective tax rate -2.8% -13.1% -13.7% -7.6% 14.6% NON-GAAP RECONCILIATION - NET LOSS TO ADJUSTED EBITDA* (Unaudited) Net loss $ (554) $ (836) $ (224) $ (1,995) $ (3,345) Income tax expense (benefit) (574) Loss before income taxes (539) (739) (197) (1,854) (3,919) Other income, net (5) (4) (8) (18) (27) Interest expense ,182 2,051 Operating income (loss) 8 (197) (1,895) Depreciation 1,592 1,549 1,091 5,794 3,797 Amortization ,294 1,552 EBITDA* (4) 1,900 1,668 1,772 7,398 3,454 Impairments (3) ,133 Loss from asset dispositions and exchanges, net (5) Severance and exit costs (6) (29) Litigation (7) Partial pension settlement (8) Reduction in liability - U.S. Cellular asset acquisition (9) (20) (41) Adjusted EBITDA* (4) $ 2,158 $ 1,898 $ 1,743 $ 8,146 $ 6,000 Adjusted EBITDA margin* 32.8% 28.4% 24.4% 30.0% 20.3% Selected items: Cash paid for capital expenditures - network and other $ 722 $ 994 $ 1,608 $ 4,680 $ 5,422 Cash paid for capital expenditures - leased devices $ 568 $ 607 $ 439 $ 2,292 $ 582
9 WIRELESS STATEMENTS OF OPERATIONS (Unaudited) Net operating revenues Service revenue Sprint platform (1) : Postpaid $ 4,793 $ 4,813 $ 5,049 $ 19,463 $ 21,181 Prepaid 1,203 1,224 1,272 4,986 4,905 Wholesale, affiliate and other Total Sprint platform 6,151 6,219 6,510 25,152 26,810 Total transactions (2) Total service revenue 6,154 6,246 6,628 $ 25,371 $ 27,337 Equipment revenue 1,497 1,424 1,144 5,006 4,990 Total net operating revenues 7,651 7,670 7,772 30,377 32,327 Net operating expenses Cost of services (exclusive of depreciation and amortization below) 1,922 2,031 2,006 8,069 7,945 Cost of products (exclusive of depreciation and amortization below) 1,551 1,589 1,827 5,795 9,309 Selling, general and administrative 1,868 2,041 2,242 8,141 9,179 Depreciation 1,541 1,496 1,044 5,593 3,560 Amortization ,294 1,549 Impairments (3) ,900 Other, net (29) 1, Total net operating expenses 7,616 7,826 7,452 29,937 33,791 Operating income (loss) $ 35 $ (156) $ 320 $ 440 $ (1,464) WIRELESS NON-GAAP RECONCILIATION (Unaudited) Operating income (loss) $ 35 $ (156) $ 320 $ 440 $ (1,464) Impairments (3) ,900 Loss from asset dispositions and exchanges, net (5) Severance and exit costs (6) (29) Litigation (7) Partial pension settlement (8) Reduction in liability - U.S. Cellular asset acquisition (9) (20) (41) Depreciation 1,541 1,496 1,044 5,593 3,560 Amortization ,294 1,549 Adjusted EBITDA* (4) $ 2,132 $ 1,866 $ 1,697 $ 8,051 $ 5,894 Adjusted EBITDA margin* 34.6% 29.9% 25.6% 31.7% 21.6% Selected items: Cash paid for capital expenditures - network and other $ 577 $ 869 $ 1,518 $ 4,089 $ 4,860 Cash paid for capital expenditures - leased devices $ 568 $ 607 $ 439 $ 2,292 $ 582
10 WIRELINE STATEMENTS OF OPERATIONS (Unaudited) Net operating revenues Voice $ 194 $ 201 $ 264 $ 840 $ 1,174 Data Internet ,284 1,353 Other Total net operating revenues ,382 2,814 Net operating expenses Costs of services (exclusive of depreciation and amortization below) ,962 2,338 Selling, general and administrative Depreciation and amortization Impairments (3) Other, net 3 20 (2) Total net operating expenses ,509 3,227 Operating loss $ (32) $ (37) $ (4) $ (127) $ (413) WIRELINE NON-GAAP RECONCILIATION (Unaudited) Operating loss $ (32) $ (37) $ (4) $ (127) $ (413) Impairments (3) Severance and exit costs (6) 3 20 (2) Litigation (7) Partial pension settlement (8) Depreciation and amortization Adjusted EBITDA* $ 21 $ 33 $ 40 $ 92 $ 113 Adjusted EBITDA margin* 3.7% 5.7% 6.0% 3.9% 4.0% Selected items: Cash paid for capital expenditures - network and other $ 74 $ 74 $ 70 $ 279 $ 275
11 CONDENSED CONSOLIDATED CASH FLOW INFORMATION (Unaudited)** 3/31/16 3/31/15 Operating activities Net loss $ (1,995) $ (3,345) Impairments (3) - 2,133 Depreciation and amortization 7,088 5,349 Provision for losses on accounts receivable Share-based and long-term incentive compensation expense Deferred income tax expense (benefit) 123 (609) Amortization of long-term debt premiums, net (316) (303) Loss on disposal of property, plant and equipment Other changes in assets and liabilities: Accounts and notes receivable (1,663) (644) Inventories and other current assets (3,065) (1,573) Deferred purchase price from sale of receivables 2,478 - Accounts payable and other current liabilities (574) 481 Non-current assets and liabilities, net 111 (199) Other, net Net cash provided by operating activities 3,897 2,450 Investing activities Capital expenditures - network and other (4,680) (5,422) Capital expenditures - leased devices (2,292) (582) Expenditures relating to FCC licenses (98) (163) Reimbursements relating to FCC licenses - 95 Change in short-term investments, net 166 1,054 Proceeds from sales of assets and FCC licenses Proceeds from sale-leaseback transaction 1,136 - Other, net (29) (11) Net cash used in investing activities (5,735) (4,714) Financing activities Proceeds from debt and financings 755 1,930 Repayments of debt, financing and capital lease obligations (899) (574) Proceeds from sales of future lease receivables Debt financing costs (11) (87) Proceeds from issuance of common stock, net Other, net 14 - Net cash provided by financing activities 469 1,304 Net decrease in cash and cash equivalents (1,369) (960) Cash and cash equivalents, beginning of period 4,010 4,970 Cash and cash equivalents, end of period $ 2,641 $ 4,010 RECONCILIATION TO CONSOLIDATED FREE CASH FLOW* (NON-GAAP) (Unaudited) Net cash provided by operating activities $ 1,294 $ 806 $ 976 $ 3,897 $ 2,450 Capital expenditures - network and other (722) (994) (1,608) (4,680) (5,422) Capital expenditures - leased devices (568) (607) (439) (2,292) (582) Expenditures relating to FCC licenses, net (23) (30) (42) (98) (68) Proceeds from sales of assets and FCC licenses Other investing activities, net (4) (4) (2) (29) (11) Free cash flow* $ 3 $ (797) $ (914) $ (3,140) $ (3,318) Net proceeds from the sale-leaseback of devices and sales of future lease receivables 600 1,136-1,736 - Adjusted free cash flow* $ 603 $ 339 $ (914) $ (1,404) $ (3,318) **Certain prior period amounts have been reclassified to conform to the current period presentation.
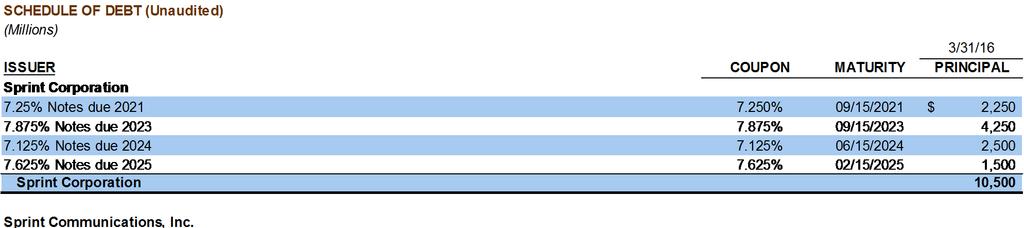
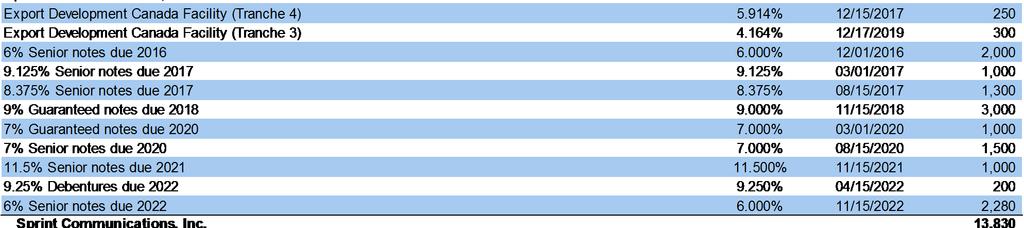
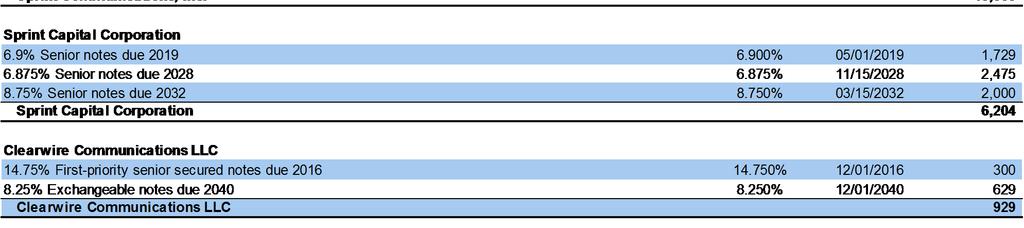
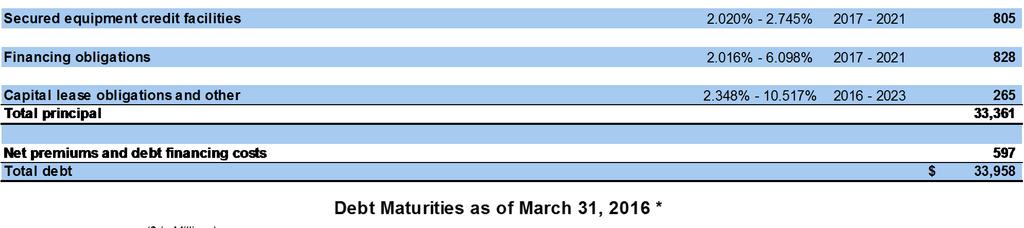
12 CONDENSED CONSOLIDATED BALANCE SHEETS (Unaudited) 3/31/16 3/31/15 ASSETS Current assets Cash and cash equivalents $ 2,641 $ 4,010 Short-term investments Accounts and notes receivable, net 1,099 2,290 Device and accessory inventory 1,173 1,359 Deferred tax assets - 62 Prepaid expenses and other current assets 1,920 1,890 Total current assets 6,833 9,777 Property, plant and equipment, net 20,297 19,721 Goodwill 6,575 6,575 FCC licenses and other 40,073 39,987 Definite-lived intangible assets, net 4,469 5,893 Other assets (10) Total assets $ 78,975 $ 82,841 LIABILITIES AND STOCKHOLDERS' EQUITY Current liabilities Accounts payable $ 2,899 $ 4,347 Accrued expenses and other current liabilities 4,374 5,293 Current portion of long-term debt, financing and capital lease obligations 4,690 1,300 Total current liabilities 11,963 10,940 Long-term debt, financing and capital lease obligations (10) 29,268 32,342 Deferred tax liabilities 13,959 13,898 Other liabilities 4,002 3,951 Total liabilities 59,192 61,131 Stockholders' equity Common stock Treasury shares, at cost (3) (7) Paid-in capital 27,563 27,468 Accumulated deficit (7,378) (5,383) Accumulated other comprehensive loss (439) (408) Total stockholders' equity 19,783 21,710 Total liabilities and stockholders' equity $ 78,975 $ 82,841 NET DEBT* (NON-GAAP) (Unaudited) 3/31/16 3/31/15 Total debt $ 33,958 $ 33,642 Less: Cash and cash equivalents (2,641) (4,010) Less: Short-term investments - (166) Net debt* $ 31,317 $ 29,466
13
14 NOTES TO THE FINANCIAL INFORMATION (Unaudited) (1) Sprint platform refers to the Sprint network that supports the wireless service we provide through our multiple brands. (2) Postpaid and prepaid connections from transactions are defined as retail postpaid and prepaid connections acquired from Clearwire in July 2013 who had not deactivated or been recaptured on the Sprint platform. (3) For the third quarter of fiscal year 2014, impairment losses were recorded after determining that the carrying value exceeded estimated fair value of both the Sprint trade name and Wireline asset group, which consists primarily of property, plant and equipment. (4) As more of our customers elect to lease a device rather than purchasing one under our subsidized program, there is a positive impact to EBITDA* and Adjusted EBITDA* primarily due to the fact the cost of the device is not recorded as cost of products but rather is depreciated over the customer lease term. Under our device leasing program for the direct channel, devices are transferred from inventory to property and equipment and the cost of the leased device is recognized as depreciation expense over the customer lease term to an estimated residual value. The customer payments are recognized as revenue over the term of the lease. Under our subsidized program, the cash received from the customer for the device is recognized as equipment revenue at the point of sale and the cost of the device is recognized as cost of products. During the three and twelve-month periods ended March 31, 2016, we leased devices through our Sprint direct channels totaling approximately $600 million and $3.2 billion, respectively, which would have increased cost of products and reduced EBITDA* if they had been purchased under our subsidized program. Also, during the three and twelve-month periods ended March 31, 2016, the equipment revenue derived from customers electing to finance their devices through device leasing or installment billing programs in our direct channel was 58% and 51%, respectively. The impact to EBITDA* and Adjusted EBITDA* resulting from the sale of devices under our installment billing program is neutral except for the impact from the time value of money element related to the imputed interest on the installment receivable. (5) During the fourth and second quarters of fiscal year 2015, we recorded losses on dispositions of assets primarily related to network development costs that are no longer relevant as a result of changes in the Company's network plans. (6) Severance and exit costs consist of lease exit costs primarily associated with tower and cell sites, access exit costs related to payments that will continue to be made under our backhaul access contracts for which we will no longer be receiving any economic benefit, and severance costs associated with reduction in our work force. (7) For the fourth and third quarters of fiscal year 2015, litigation activity is a result of unfavorable developments in connection with pending litigation. (8) The partial pension settlement resulted from amounts paid to eligible terminated participants who voluntarily elected to receive lump sum distributions as a result of an approved plan amendment to the Sprint Retirement Pension Plan by the Board of Directors in June (9) As a result of the U.S. Cellular asset acquisition, we recorded a liability related to network shut-down costs, which primarily consisted of lease exit costs, for which we agreed to reimburse U.S. Cellular. During the third quarter of fiscal year 2014, we identified favorable trends in actual costs and, as a result, reduced the liability resulting in a gain of approximately $41 million. During the first quarter of fiscal year 2015, we revised our estimate and, as a result, reduced the liability resulting in approximately $20 million of income. (10) During the fourth quarter of fiscal year 2015, the Company elected to adopt accounting guidance which requires that debt issuance costs related to a recognized debt liability be presented in the balance sheet as a direct deduction from the carrying amount of that debt liability, consistent with debt discounts. Also addressed in this guidance is the presentation and subsequent measurement of debt issuance costs associated with line-of-credit arrangements. We elected to adopt the guidance early with full retrospective application. Debt issuance costs associated with our revolving credit facility remain in "Other assets" on the consolidated balance sheet and continue to be amortized over the term of the facility as allowed by the guidance. For the year ended March 31, 2015 debt issuance costs for all other debt totaling $189 million have been reclassified from "Other assets" to "Long-term debt, financing and capital lease obligations" on the consolidated balance sheet.
15 *FINANCIAL MEASURES Sprint provides financial measures determined in accordance with GAAP and adjusted GAAP (non-gaap). The non-gaap financial measures reflect industry conventions, or standard measures of liquidity, profitability or performance commonly used by the investment community for comparability purposes. These measurements should be considered in addition to, but not as a substitute for, financial information prepared in accordance with GAAP. We have defined below each of the non-gaap measures we use, but these measures may not be synonymous to similar measurement terms used by other companies. Sprint provides reconciliations of these non-gaap measures in its financial reporting. Because Sprint does not predict special items that might occur in the future, and our forecasts are developed at a level of detail different than that used to prepare GAAP-based financial measures, Sprint does not provide reconciliations to GAAP of its forward-looking financial measures. The measures used in this release include the following: EBITDA is operating income/(loss) before depreciation and amortization. Adjusted EBITDA is EBITDA excluding severance, exit costs, and other special items. Adjusted EBITDA Margin represents Adjusted EBITDA divided by non-equipment net operating revenues for Wireless and Adjusted EBITDA divided by net operating revenues for Wireline. We believe that Adjusted EBITDA and Adjusted EBITDA Margin provide useful information to investors because they are an indicator of the strength and performance of our ongoing business operations. While depreciation and amortization are considered operating costs under GAAP, these expenses primarily represent non-cash current period costs associated with the use of longlived tangible and definite-lived intangible assets. Adjusted EBITDA and Adjusted EBITDA Margin are calculations commonly used as a basis for investors, analysts and credit rating agencies to evaluate and compare the periodic and future operating performance and value of companies within the telecommunications industry. Sprint Platform Postpaid ABPA is average billings per account and calculated by dividing postpaid service revenue earned from postpaid customers plus installment plan billings and lease revenue by the sum of the monthly average number of postpaid accounts during the period. We believe that ABPA provides useful information to investors, analysts and our management to evaluate average Sprint platform postpaid customer billings per account as it approximates the expected cash collections, including installment plan billings and lease revenue, per postpaid account each month. Sprint Platform Postpaid Phone ABPU is average billings per postpaid phone user and calculated by dividing service revenue earned from postpaid phone customers plus installment plan billings and lease revenue by the sum of the monthly average number of postpaid phone connections during the period. We believe that ABPU provides useful information to investors, analysts and our management to evaluate average Sprint platform postpaid phone customer billings as it approximates the expected cash collections, including installment plan billings and lease revenue, per postpaid phone user each month. Free Cash Flow is the cash provided by operating activities less the cash used in investing activities other than short-term investments, including changes in restricted cash, if any, and excluding the sale-leaseback of devices. Adjusted Free Cash Flow is Free Cash Flow plus the proceeds from the sale-leaseback of devices and sales of future lease receivables, net of repayments. We believe that Free Cash Flow and Adjusted Free Cash Flow provide useful information to investors, analysts and our management about the cash generated by our core operations and net proceeds obtained to fund certain leased devices, respectively, after interest and dividends, if any, and our ability to fund scheduled debt maturities and other financing activities, including discretionary refinancing and retirement of debt and purchase or sale of investments.
16 Net Debt is consolidated debt, including current maturities, less cash and cash equivalents, short-term investments and, if any, restricted cash. We believe that Net Debt provides useful information to investors, analysts and credit rating agencies about the capacity of the company to reduce the debt load and improve its capital structure. SAFE HARBOR This release includes forward-looking statements within the meaning of the securities laws. The words may, could, should, estimate, project, forecast, intend, expect, anticipate, believe, target, plan, outlook, providing guidance, and similar expressions are intended to identify information that is not historical in nature. All statements that address operating performance, events or developments that we expect or anticipate will occur in the future including statements relating to our network, connections growth, and liquidity; and statements expressing general views about future operating results are forward-looking statements. Forward-looking statements are estimates and projections reflecting management s judgment based on currently available information and involve a number of risks and uncertainties that could cause actual results to differ materially from those suggested by the forward-looking statements. With respect to these forward-looking statements, management has made assumptions regarding, among other things, the development and deployment of new technologies and services; efficiencies and cost savings of new technologies and services; customer and network usage; connection growth and retention; service, speed, coverage and quality; availability of devices; availability of various financings, including any leasing transactions; the timing of various events and the economic environment. Sprint believes these forward-looking statements are reasonable; however, you should not place undue reliance on forward-looking statements, which are based on current expectations and speak only as of the date when made. Sprint undertakes no obligation to publicly update or revise any forward-looking statements, whether as a result of new information, future events or otherwise, except as required by law. In addition, forward-looking statements are subject to certain risks and uncertainties that could cause actual results to differ materially from our company's historical experience and our present expectations or projections. Factors that might cause such differences include, but are not limited to, those discussed in Sprint Corporation s Annual Report on Form 10-K for the fiscal year ended March 31, 2015 and, when filed, its Annual Report on Form 10-K for the fiscal year ended March 31, You should understand that it is not possible to predict or identify all such factors. Consequently, you should not consider any such list to be a complete set of all potential risks or uncertainties. About Sprint: Sprint (NYSE: S) is a communications services company that creates more and better ways to connect its customers to the things they care about most. Sprint served more than 58.8 million connections as of March 31, 2016 and is widely recognized for developing, engineering and deploying innovative technologies, including the first wireless 4G service from a national carrier in the United States; leading no-contract brands including Virgin Mobile USA, Boost Mobile, and Assurance Wireless; instant national and international push-to-talk capabilities; and a global Tier 1 Internet backbone. Sprint has been named to the Dow Jones Sustainability Index (DJSI) North America for the past five years. You can learn more and visit Sprint at or and
SPRINT REPORTS NET INCOME FOR THE FIRST TIME IN THREE YEARS WITH FIRST QUARTER OF FISCAL 2017 RESULTS
 SPRINT REPORTS NET INCOME FOR THE FIRST TIME IN THREE YEARS WITH FIRST QUARTER OF FISCAL 2017 RESULTS Net income of $206 million, operating income of $1.2 billion, and Adjusted EBITDA* of $2.9 billion
First national carrier on record to improve postpaid churn from the April-June quarter to the July- September quarter
 SPRINT HITS INFLECTION POINT IN ITS TURNAROUND BY REPORTING POSITIVE POSTPAID PHONE NET ADDITIONS AND RECORD LOW POSTPAID CHURN IN THE SECOND FISCAL QUARTER OF 2015 First national carrier on record to
 www.sprint.com/investors We took another step forward in our plan toward sustainable profitability and cash generation with this quarter s results. The top line is now growing, we continue to take costs
Sprint took a big step forward in the second year of our turnaround plan. Net operating revenues returned to growth and cost reductions accelerated,
 Sprint took a big step forward in the second year of our turnaround plan. Net operating revenues returned to growth and cost reductions accelerated, leading to the highest operating income in a decade
SPRINT DELIVERS BEST FINANCIAL RESULTS IN COMPANY HISTORY WITH HIGHEST EVER NET INCOME AND OPERATING INCOME IN FISCAL YEAR 2017
 SPRINT DELIVERS BEST FINANCIAL RESULTS IN COMPANY HISTORY WITH HIGHEST EVER NET INCOME AND OPERATING INCOME IN FISCAL YEAR 2017 Fiscal year 2017 postpaid phone net additions of 606,000 o Third consecutive
Sprint is turning the corner. Even with all the aggressive promotional offers from our competitors, we were still able to add more postpaid phone
 Sprint is turning the corner. Even with all the aggressive promotional offers from our competitors, we were still able to add more postpaid phone customers than both Verizon and AT&T while continuing to
SPRINT REPORTS HIGHEST RETAIL PHONE NET ADDITIONS IN MORE THAN TWO YEARS WITH FISCAL 2017 SECOND QUARTER RESULTS
 SPRINT REPORTS HIGHEST RETAIL PHONE NET ADDITIONS IN MORE THAN TWO YEARS WITH FISCAL 2017 SECOND QUARTER RESULTS Highest share of postpaid phone gross additions in company history o Postpaid phone gross
Nov. 3, 2015 SPRINT QUARTERLY INVESTOR UPDATE FISCAL 2Q15 1
 Nov. 3, 2015 SPRINT QUARTERLY INVESTOR UPDATE FISCAL 2Q15 1 SPRINT HITS INFLECTION POINT IN ITS TURNAROUND BY REPORTING POSITIVE POSTPAID PHONE NET ADDITIONS AND RECORD LOW POSTPAID CHURN IN THE SECOND
SPRINT REPORTS INFLECTION IN WIRELESS SERVICE REVENUE WITH FISCAL YEAR 2018 FIRST QUARTER RESULTS
 SPRINT REPORTS INFLECTION IN WIRELESS SERVICE REVENUE WITH FISCAL YEAR 2018 FIRST QUARTER RESULTS Wireless service revenue grew sequentially for the first time in more than four years, excluding the impact
SPRINT CORPORATION (Exact name of Registrant as specified in its charter)
") UNITED STATES SECURITIES AND EXCHANGE COMMISSION Washington, D.C. 20549 FORM 8-K CURRENT REPORT Pursuant to Section 13 or 15(d) of the Securities Exchange Act of 1934 Date of Report (Date of earliest event
UNITED STATES SECURITIES AND EXCHANGE COMMISSION Washington, D.C. 20549 FORM 8-K CURRENT REPORT Pursuant to Section 13 or 15(d) of the Securities Exchange Act of 1934 Date of Report (Date of earliest event
Investor Update. Fiscal 1Q
 Investor Update Fiscal 1Q17 8-1-2017 www.sprint.com/investors 2 3 Highlights TABLE of contents 4 Customer Metrics Fiscal 2Q16 8 10 Activations Network 11 Financials 17 Liquidity 18 Outlook 19 Results Tables
SPRINT CORPORATION (Exact name of Registrant as specified in its charter)
") UNITED STATES SECURITIES AND EXCHANGE COMMISSION Washington, D.C. 20549 FORM 8-K CURRENT REPORT Pursuant to Section 13 or 15(d) of the Securities Exchange Act of 1934 Date of Report (Date of earliest event
UNITED STATES SECURITIES AND EXCHANGE COMMISSION Washington, D.C. 20549 FORM 8-K CURRENT REPORT Pursuant to Section 13 or 15(d) of the Securities Exchange Act of 1934 Date of Report (Date of earliest event
[1] after adjusting for hurricane and other non-recurring charges
![[1] after adjusting for hurricane and other non-recurring charges](/thumbs/80/82165558.jpg "[1] after adjusting for hurricane and other non-recurring charges") [1] after adjusting for hurricane and other non-recurring charges [2] Ookla s analysis of Speedtest Intelligence data comparing March 2017 to March 2018 for all mobile results 54.6 54.6 53.6 53.7 54.0
[1] after adjusting for hurricane and other non-recurring charges [2] Ookla s analysis of Speedtest Intelligence data comparing March 2017 to March 2018 for all mobile results 54.6 54.6 53.6 53.7 54.0
[1] excluding the impact of the new revenue recognition standard
![[1] excluding the impact of the new revenue recognition standard](/thumbs/85/92222296.jpg "[1] excluding the impact of the new revenue recognition standard") [1] excluding the impact of the new revenue recognition standard [2] Sprint is the most improved network according to Ookla as shown in Speedtest Intelligence data1, and PCMag s 2018 Fastest Mobile Networks.
[1] excluding the impact of the new revenue recognition standard [2] Sprint is the most improved network according to Ookla as shown in Speedtest Intelligence data1, and PCMag s 2018 Fastest Mobile Networks.
[1] after adjusting for hurricane and other non-recurring charges
![[1] after adjusting for hurricane and other non-recurring charges](/thumbs/95/122862988.jpg "[1] after adjusting for hurricane and other non-recurring charges") [1] after adjusting for hurricane and other non-recurring charges [2] Average download speed increase based on Ookla s analysis of Speedtest Intelligence data comparing December 2016 to December 2017 for
[1] after adjusting for hurricane and other non-recurring charges [2] Average download speed increase based on Ookla s analysis of Speedtest Intelligence data comparing December 2016 to December 2017 for
SPRINT CORPORATION (Exact name of Registrant as specified in its charter)
") UNITED STATES SECURITIES AND EXCHANGE COMMISSION Washington, D.C. 20549 FORM 8-K CURRENT REPORT Pursuant to Section 13 or 15(d) of the Securities Exchange Act of 1934 Date of Report (Date of earliest event
UNITED STATES SECURITIES AND EXCHANGE COMMISSION Washington, D.C. 20549 FORM 8-K CURRENT REPORT Pursuant to Section 13 or 15(d) of the Securities Exchange Act of 1934 Date of Report (Date of earliest event
[1] excluding the impact of the new rev enue standard
![[1] excluding the impact of the new rev enue standard](/thumbs/89/99440225.jpg "[1] excluding the impact of the new rev enue standard") [1] excluding the impact of the new rev enue standard 54.6 54.6 54.6 54.5 54.0 378 385 44 57 (20) Net Additions (Losses) - In Thousands End of Period Connections - In Millions The company had 20,000 net
[1] excluding the impact of the new rev enue standard 54.6 54.6 54.6 54.5 54.0 378 385 44 57 (20) Net Additions (Losses) - In Thousands End of Period Connections - In Millions The company had 20,000 net
(20) 3QFY17 4QFY17 1QFY18 2QFY18 3QFY18
 3QFY17 4QFY17 1QFY18 2QFY18 3QFY18") 54.6 54.6 54.6 54.5 54.5 385 44 57 48 (20) Net Additions (Losses) - In Thousands End of Period Connections - In Millions The company had 48,000 net additions in the current quarter compared with 385,000
54.6 54.6 54.6 54.5 54.5 385 44 57 48 (20) Net Additions (Losses) - In Thousands End of Period Connections - In Millions The company had 48,000 net additions in the current quarter compared with 385,000
Sprint Nextel 3Q12 Earnings Conference Call
 Sprint Nextel 3Q12 Earnings Conference Call October 25, 2012 Cautionary Statement This presentation includes forward-looking statements within the meaning of the securities laws. The words may, could,
Sprint Nextel 2Q12 Earnings Conference Call
 Sprint Nextel 2Q12 Earnings Conference Call July 26, 2012 1 Cautionary Statement This presentation includes forward-looking statements within the meaning of the securities laws. The words may, could, should,
News Release. Sprint Nextel 6200 Sprint Parkway Overland Park, Kan SPRINT NEXTEL REPORTS FOURTH QUARTER AND FULL-YEAR 2008 RESULTS
 News Release Sprint Nextel 6200 Sprint Parkway Overland Park, Kan. 66251 Contacts: Media Relations James Fisher 703-433-8677 james.w.fisher@sprint.com Investor Relations Yijing Brentano 800-259-3755 Investor.relations@sprint.com
Sprint Nextel 1Q12 Earnings Conference Call April 25, 2012
 Sprint Nextel 1Q12 Earnings Conference Call April 25, 2012 1 Cautionary Statement This news release includes forward-looking statements within the meaning of the securities laws. The statements in this
SPRINT NEXTEL REPORTS FIRST QUARTER 2007 RESULTS
 Contacts: Media Relations James Fisher 703-433-8677 james.w.fisher@sprint.com Investor Relations Kurt Fawkes 800-259-3755 Investor.relations@sprint.com SPRINT NEXTEL REPORTS FIRST QUARTER 2007 RESULTS
News Release. Sprint Nextel 6200 Sprint Parkway Overland Park, Kan SPRINT NEXTEL REPORTS SECOND QUARTER 2008 RESULTS
 News Release Sprint Nextel 6200 Sprint Parkway Overland Park, Kan. 66213 SPRINT NEXTEL REPORTS SECOND QUARTER 2008 RESULTS Contacts: Media Relations James Fisher 703-433-8677 james.w.fisher@sprint.com
Sprint Nextel Reports Fourth Quarter and Full Year 2010 Results
 Sprint Nextel Reports Fourth Quarter and Full Year 2010 Results Company Release - 02/10/2011 07:00 Added nearly 1.1 million total wireless subscribers including net postpaid subscriber additions both bests
SPRINT CORPORATION (Exact name of Registrant as specified in its charter)
") UNITED STATES SECURITIES AND EXCHANGE COMMISSION Washington, D.C. 20549 FORM 8-K CURRENT REPORT Pursuant to Section 13 or 15(d) of the Securities Exchange Act of 1934 Date of Report (Date of earliest event
UNITED STATES SECURITIES AND EXCHANGE COMMISSION Washington, D.C. 20549 FORM 8-K CURRENT REPORT Pursuant to Section 13 or 15(d) of the Securities Exchange Act of 1934 Date of Report (Date of earliest event
News Release. Sprint Nextel 6200 Sprint Parkway Overland Park, Kan SPRINT NEXTEL REPORTS THIRD QUARTER 2008 RESULTS
 News Release Sprint Nextel 6200 Sprint Parkway Overland Park, Kan. 66251 Contacts: Media Relations James Fisher 703-433-8677 james.w.fisher@sprint.com Investor Relations Yijing Brentano 800-259-3755 Investor.relations@sprint.com
SPRINT CORPORATION (Exact Name of Registrant as Specified in Charter)
") UNITED STATES SECURITIES AND EXCHANGE COMMISSION WASHINGTON, D.C. 20549 FORM 8-K CURRENT REPORT PURSUANT TO SECTION 13 OR 15(d) OF THE SECURITIES EXCHANGE ACT OF 1934 Date of report (Date of earliest event
UNITED STATES SECURITIES AND EXCHANGE COMMISSION WASHINGTON, D.C. 20549 FORM 8-K CURRENT REPORT PURSUANT TO SECTION 13 OR 15(d) OF THE SECURITIES EXCHANGE ACT OF 1934 Date of report (Date of earliest event
Service revenues - Branded postpaid, including handset insurance, branded prepaid, wholesale, and roaming and other service revenues.
 Definitions of Terms Operating and financial measures are utilized by T-Mobile's management to evaluate its operating performance and, in certain cases, its ability to meet liquidity requirements. Although
Definitions of Terms
 Definitions of Terms Operating and financial measures are utilized by T-Mobile's management to evaluate its operating performance and, in certain cases, its ability to meet liquidity requirements. Although
TDS reports strong third quarter 2018 results
 As previously announced, TDS will hold a teleconference November 2, 2018, at 9:30 a.m. CDT. Listen to the call live via the Events & Presentations page of investors.tdsinc.com. FOR IMMEDIATE RELEASE TDS
U.S. CELLULAR REPORTS FOURTH QUARTER 2012 RESULTS AND 2013 FINANCIAL GUIDANCE
 As previously announced, U.S. Cellular will hold a teleconference Feb. 26, 2013 at 9:30 a.m. CST. Listen to the live call via the Conference Calls page of www.teldta.com or www.uscellular.com. Contact:
TDS reports fourth quarter and full year 2017 results Provides 2018 guidance
 As previously announced, TDS will hold a teleconference February 23, 2018 at 9:30 a.m. CST. Listen to the call live via the Events & Presentations page of investors.tdsinc.com. FOR IMMEDIATE RELEASE TDS
Service revenues - Branded postpaid, including handset insurance, branded prepaid, wholesale, and roaming and other service revenues.
 Definitions of Terms Operating and financial measures are utilized by T-Mobile's management to evaluate its operating performance and, in certain cases, its ability to meet liquidity requirements. Although
TDS reports second quarter 2018 results U.S. Cellular raises guidance
 As previously announced, TDS will hold a teleconference August 3, 2018, at 9:30 a.m. CDT. Listen to the call live via the Events & Presentations page of investors.tdsinc.com. FOR IMMEDIATE RELEASE TDS
7:30 a.m. CST. (312) (312) FOR REPORTS. retail customers. increased Postpaid smartphone. end.
 (312) FOR REPORTS. retail customers. increased Postpaid smartphone. end.") As previously announced, U.S. Cellular will hold a teleconference Nov. 7, 2012 at 7:30 a.m. CST. Interested parties may listen to the call live by accessing the Investor Relations page of www.uscellular.com
As previously announced, U.S. Cellular will hold a teleconference Nov. 7, 2012 at 7:30 a.m. CST. Interested parties may listen to the call live by accessing the Investor Relations page of www.uscellular.com
First Quarter 2018 Results. May 1, 2018
 First Quarter 2018 Results May 1, 2018 Safe Harbor Statement Under the Private Securities Litigation Reform Act of 1995 All information set forth in this presentation, except historical and factual information,
TDS reports second quarter 2017 results 2017 guidance reaffirmed
 As previously announced, TDS will hold a teleconference August 4, 2017, at 9:30 a.m. CDT. Listen to the call live via the Events & Presentations page of investors.tdsinc.com. FOR IMMEDIATE RELEASE TDS
U.S. Cellular reports second quarter 2018 results U.S. Cellular raises guidance
 As previously announced, U.S. Cellular will hold a teleconference August 3, 2018, at 9:30 a.m. CDT. Listen to the live call via the Events & Presentations page of investors.uscellular.com. FOR IMMEDIATE
FOR IMMEDIATE RELEASE Leap Contacts: Greg Lund, Media Relations
 FOR IMMEDIATE RELEASE Leap Contacts: Greg Lund, Media Relations 858-882-9105 glund@leapwireless.com Amy Wakeham, Investor Relations 858-882-6084 awakeham@leapwireless.com Leap Reports Strong Growth for
Fourth Quarter 2017 Results 2017 Accomplishments 2018 Strategic Priorities and Guidance. February 23, 2018
 Fourth Quarter 2017 Results 2017 Accomplishments 2018 Strategic Priorities and Guidance February 23, 2018 Safe Harbor Statement Under the Private Securities Litigation Reform Act of 1995 All information
Second Quarter 2018 Results. August 3, 2018
 Second Quarter 2018 Results August 3, 2018 Safe Harbor Statement Under the Private Securities Litigation Reform Act of 1995 All information set forth in this presentation, except historical and factual
T-Mobile USA, Inc. 1st Quarter 2013 Financial Results, Supplementary Data, and Non-GAAP Reconciliations
 T-Mobile USA, Inc. 1st Quarter Financial Results, Supplementary Data, and Non-GAAP Reconciliations May 8, Definitions of Terms Since all companies do not calculate these figures in the same manner, the
Supplemental Financial Information. Third Quarter 2018
 Supplemental Financial Information Third Quarter 2018 TSX: RCI NYSE: RCI Consolidated Financial Results (In millions of dollars, except per share amounts) Q3'18 Q2'18 Q1'18 Annual Q4'17 Q3'17 Q2'17 Q1'17
Vonage Holdings Corp. Reports Fourth Quarter and Full Year 2010 Results. Company Reports Record EBITDA and Free Cash Flow
 Vonage Holdings Corp. Reports Fourth Quarter and Full Year 2010 Results Company Reports Record EBITDA and Free Cash Flow Fourth Quarter 2010 -- Adjusted EBITDA 1 of $41 Million -- -- Net Income of $15
Condensed Consolidated Statements of Income
 Condensed Consolidated Statements of Income (dollars in millions, except per share amounts) 9/30/17 9/30/16 % Change 9/30/17 9/30/16 % Change Operating Revenues Service revenues and other Wireless equipment
Third Quarter 2018 Results. November 2, 2018
 Third Quarter 2018 Results November 2, 2018 Safe Harbor Statement Under the Private Securities Litigation Reform Act of 1995 All information set forth in this presentation, except historical and factual
U.S. CELLULAR REPORTS SECOND QUARTER 2013 RESULTS
 As previously announced, U.S. Cellular will hold a teleconference Aug. 2, 2013 at 9:30 a.m. CDT. Listen to the live call via the Conference Calls page of teldta.com or uscellular.com. Contact: Jane W.
Equipment 4,375 4,260 4,455 5,667 18,757 3,848 4,138 4,191 6,532 18,709 4,848 4,377 4,848 4,377
 Consolidated Statements of Income 3 AT&T Inc. except per share amounts Unaudited 3/31/16 6/30/16 9/30/16 12/31/16 2016 3/31/17 6/30/17 9/30/17 12/31/17 2017 3/31/18 6/30/18 3/31/18 6/30/18 Operating Revenues
UNITED STATES SECURITIES AND EXCHANGE COMMISSION WASHINGTON, DC FORM 8-K
 UNITED STATES SECURITIES AND EXCHANGE COMMISSION WASHINGTON, DC 20549 FORM 8-K CURRENT REPORT Pursuant to Section 13 or 15(d) of the Securities Exchange Act of 1934 Date of report (Date of earliest event
Receivables 212, ,296 Less allowance for doubtful receivables 4,408 4,407 Net receivables 208, ,889
 CONSOLIDATED BALANCE SHEETS (Amounts in thousands) March 31, December 31, ASSETS 2017 2016 Current assets: Cash and cash equivalents $ 14,759 19,297 Receivables 212,585 184,296 Less allowance for doubtful
Third Quarter 2017 Results. November 8, 2017
 Third Quarter 2017 Results November 8, 2017 Safe Harbor Statement Under the Private Securities Litigation Reform Act of 1995 All information set forth in this presentation, except historical and factual
UNITED STATES SECURITIES AND EXCHANGE COMMISSION WASHINGTON, DC FORM 8-K
 UNITED STATES SECURITIES AND EXCHANGE COMMISSION WASHINGTON, DC 20549 FORM 8-K CURRENT REPORT Pursuant to Section 13 or 15(d) of the Securities Exchange Act of 1934 Date of report (Date of earliest event
Less: Net Income Attributable to Noncontrolling Interest (82) (107) (90) (78) (357) (105) (99) (94) (99) (397) (97) (91)
 (107) (90) (78) (357) (105) (99) (94) (99) (397) (97) (91)") Consolidated Statements of Income 3 AT&T Inc. Dollars in millions except per share amounts Unaudited 3/31/16 6/30/16 9/30/16 12/31/16 2016 3/31/17 6/30/17 9/30/17 12/31/17 2017 3/31/18 3/31/18 Operating
Consolidated Statements of Income 3 AT&T Inc. Dollars in millions except per share amounts Unaudited 3/31/16 6/30/16 9/30/16 12/31/16 2016 3/31/17 6/30/17 9/30/17 12/31/17 2017 3/31/18 3/31/18 Operating
First Quarter 2017 Results. May 5, 2017
 First Quarter 2017 Results May 5, 2017 Safe Harbor Statement Under the Private Securities Litigation Reform Act of 1995 All information set forth in this presentation, except historical and factual information,
November 7, U.S. Cellular Midwest Market Announcement TDS Third Quarter 2012 Results and Guidance
 November 7, 2012 U.S. Cellular Midwest Market Announcement TDS Third Quarter 2012 Results and Guidance Safe Harbor Statement Under the Private Securities Litigation Reform Act of 1995 Safe Harbor Statement
Page 2. Historical Accounting. Method 2
 Consolidated Statements of Income 3 AT&T Inc. except per share amounts Unaudited 3/31/17 6/30/17 9/30/17 12/31/17 2017 3/31/18 6/30/18 9/30/18 12/31/18 2018 3/31/18 6/30/18 9/30/18 12/31/18 2018 Operating
Financial and Operational Trends
 Q4 2017 AT&T EARNINGS Financial and Operational Trends Income Statements, Cash Flows, Segment Results, Revenue Details and Operating Volumes JANUARY 31, 2018 Consolidated Statements of Income AT&T Inc.
Click to edit Master title style
 NASDAQ: CNSL CONSOLIDATED COMMUNICATIONS INVESTOR PRESENTATION April 2018 SAFE HARBOR The Securities and Exchange Commission ( SEC ) encourages companies to disclose forward-looking information so that
UNITED STATES SECURITIES AND EXCHANGE COMMISSION Washington, D.C FORM 10-Q
 UNITED STATES SECURITIES AND EXCHANGE COMMISSION Washington, D.C. 20549 FORM 10-Q x o QUARTERLY REPORT PURSUANT TO SECTION 13 OR 15(d) OF THE SECURITIES EXCHANGE ACT OF 1934 For the quarterly period ended
News Release. Investor Relations: Amy Glynn/Yaeni Kim, /5391 Media Relations: Anne Taylor Adams,
 News Release Investor Relations: Amy Glynn/Yaeni Kim, +1 646 654 4931/5391 Media Relations: Anne Taylor Adams, +1 646 654 5759 NIELSEN REPORTS 3 rd QUARTER 2016 RESULTS New York, USA October 25, 2016 Nielsen
ATN Reports Third Quarter 2018 Results
 ATN Reports Third Quarter 2018 Results October 24, 2018 - Another Quarter of Sequential Earnings Growth - Restoration of US Virgin Islands Network Almost Complete Third Quarter Financial Highlights: Revenues:
Consolidated Communications Investor Presentation. December 2018
 Consolidated Communications Investor Presentation December 2018 Safe Harbor The Securities and Exchange Commission ( SEC ) encourages companies to disclose forward-looking information so that investors
MANAGEMENT'S DISCUSSION AND ANALYSIS
 MANAGEMENT'S DISCUSSION AND ANALYSIS This Management's Discussion and Analysis (MD&A) contains important information about our business and our performance for the three months ended March 3, 08, as well
T-MOBILE INTERNATIONAL REPORTS FOURTH QUARTER AND FULL YEAR 2003 RESULTS FOR T-MOBILE USA
 Bonn, March 10, 2004 T-MOBILE INTERNATIONAL REPORTS FOURTH QUARTER AND FULL YEAR RESULTS FOR T-MOBILE USA More than 1 million new customers added in and 3.2 million in Customer base up 32% in, service
Shenandoah Telecommunications Company Reports Second Quarter 2018 Results
 Shenandoah Telecommunications Company Reports Second Quarter 2018 Results August 7, 2018 Company Achieves Triple Digit Operating Income Growth Second Quarter 2018 Highlights Second quarter operating revenue
Cenveo Reports Fourth Quarter and Full Year 2016 Results
 News Release Cenveo Reports Fourth Quarter and Full Year Results Announces Two-Year, $50 Million Profitability Improvement Plan Redeeming Remaining 11.5% Notes STAMFORD, CT (February 22, 2017) - Cenveo,
SoftBank Corp. Consolidated Financial Report For the six-month period ended September 30, 2014 (IFRS)
") This English translation of the financial report was prepared for reference purposes only and is qualified in its entirety by the original Japanese version. The financial information contained in this
This English translation of the financial report was prepared for reference purposes only and is qualified in its entirety by the original Japanese version. The financial information contained in this
Financial and Operational Trends
 Q3 2018 AT&T EARNINGS Financial and Operational Trends INCOME STATEMENTS, CASH FLOWS, SEGMENT RESULTS, REVENUE DETAILS AND OPERATING VOLUMES OCTOBER 24, 2018 Consolidated Statements of Income 3 AT&T Inc.
FOR IMMEDIATE RELEASE Investor Relations Contact: Paul Taaffe (704)
") Exhibit 99.1 FOR IMMEDIATE RELEASE Investor Relations Contact: Paul Taaffe (704) 227-3623 ptaaffe@fairpoint.com Media Contact: Angelynne Amores Beaudry (207) 535-4129 aamores@fairpoint.com FAIRPOINT COMMUNICATIONS
Exhibit 99.1 FOR IMMEDIATE RELEASE Investor Relations Contact: Paul Taaffe (704) 227-3623 ptaaffe@fairpoint.com Media Contact: Angelynne Amores Beaudry (207) 535-4129 aamores@fairpoint.com FAIRPOINT COMMUNICATIONS
FOR IMMEDIATE RELEASE Investor Relations Contact: Paul Taaffe (704)
") Exhibit 99.1 FOR IMMEDIATE RELEASE Investor Relations Contact: Paul Taaffe (704) 227-3623 ptaaffe@fairpoint.com Media Contact: Angelynne Beaudry (207) 535-4129 aamores@fairpoint.com FAIRPOINT COMMUNICATIONS
Exhibit 99.1 FOR IMMEDIATE RELEASE Investor Relations Contact: Paul Taaffe (704) 227-3623 ptaaffe@fairpoint.com Media Contact: Angelynne Beaudry (207) 535-4129 aamores@fairpoint.com FAIRPOINT COMMUNICATIONS
Verizon Communications Inc. Condensed Consolidated Statements of Income. Operating Revenues $ 31,483 $ 29, $ 62,301 $ 59,206 5.
 Condensed Consolidated Statements of Income (dollars in millions, except per share amounts) Operating Revenues $ 31,483 $ 29,786 5.7 $ 62,301 $ 59,206 5.2 Operating Expenses Cost of services and sales
Internap Reports Third Quarter 2016 Financial Results
 Internap Reports Third Quarter 2016 Financial Results Revenue of $74 million, churn down year-over-year and sequentially Including a $78.2 goodwill impairment, GAAP net loss was $(91.3) million, or $(1.75)
Share on share on facebookshare on twittershare on google_plusone_shareshare on linkedinshare on more28 Consolidated
 141021_Earnings_Q32014_640x400.jpg 10.21.2014 Financial Verizon Reports Strong Customer Additions and Another Quarter of Double-Digit Earnings Growth Share on emailshare on facebookshare on twittershare
Verizon delivers continued earnings and operational growth in 1Q
 Verizon delivers continued earnings and operational growth in 1Q Thu April 21, 2016 7:25 AM PR Newswire About: VZ PR Newswire NEW YORK, April 21, 2016 /PRNewswire/ 1Q 2016 highlights Consolidated: $1.06
Condensed Consolidated Statements of Income
 Condensed Consolidated Statements of Income (dollars in millions, except per share amounts) Operating Revenues $ 30,818 $ 29,420 4.8 Operating Expenses Cost of services and sales 11,189 10,932 2.4 Selling,
Consolidated Communications Investor Presentation. August 2018
 Consolidated Communications Investor Presentation August 2018 Safe Harbor The Securities and Exchange Commission ( SEC ) encourages companies to disclose forward-looking information so that investors can
Under Armour Reports Third Quarter Results; Updates Full Year 2018 Outlook
 Under Armour Reports Third Quarter Results; Updates Full Year 2018 Outlook October 30, 2018 BALTIMORE, Oct. 30, 2018 /PRNewswire/ -- (NYSE: UA, UAA) today announced financial results for the third quarter
Adjusted EBITDA $ 19,752 $ 19,714 $ 19,109 0% 3% Adjusted EBITDA Margin 25.2% 23.3% 23.8% 190 BPS 140 BPS
 Internap Reports Continued Adjusted EBITDA Margin Expansion and Positive Levered Free Cash Flow Revenue of $78.3 million, down 7% versus the third quarter of 2014 Data center services revenue of $58.6
PARTNER COMMUNICATIONS REPORTS FOURTH QUARTER AND ANNUAL 2017 RESULTS 1
 PARTNER COMMUNICATIONS REPORTS FOURTH QUARTER AND ANNUAL 2017 RESULTS 1 ADJUSTED EBITDA 2 TOTALED NIS 917 MILLION IN 2017 PROFIT TOTALED NIS 114 MILLION IN 2017 NET DEBT 2 DECLINED BY NIS 620 MILLION IN
Cenveo Reports Third Quarter 2016 Results
 News Release Cenveo Reports Third Quarter Results - Redeeming 50% of Remaining 11.5% Notes, Repurchased Most of 7% Convertible Notes - STAMFORD, CT (November 2, ) - Cenveo, Inc. (NYSE: CVO) reported financial
Burlington Stores, Inc. Announces Operating Results for the Third Quarter and Year-To- Date Period Ended November 2, 2013
 FOR IMMEDIATE RELEASE Burlington Stores, Inc. Announces Operating Results for the Third Quarter and Year-To- Date Period Ended November 2, For the third quarter and year-to-date periods: o Comparable store
Earnings Results for the Year Ended March 31, Data Sheet. May 11, 2015 SoftBank Corp.
 Earnings Results for the Year Ended March 31, 2015 Data Sheet May 11, 2015 SoftBank Corp. Index Accounting -1 Consolidated Results Summary -1- Accounting -2 Net Sales, EBITDA, Segment Income -2- Accounting
EarthLink Announces Third Quarter 2012 Results
 October 30, 2012 EarthLink Announces Third Quarter 2012 Results Announces Investment in Nationwide Fiber and Data Center Footprint, Plans to Reduce Debt ATLANTA, Oct. 30, 2012 /PRNewswire/ -- EarthLink,
icad REPORTS SECOND QUARTER 2018 FINANCIAL RESULTS
 icad REPORTS SECOND QUARTER 2018 FINANCIAL RESULTS PowerLook Tomo Detection Version 2.0 Submitted for FDA Approval Conference call today at 4:30 p.m. ET NASHUA, N.H. (August 14, 2018) icad, Inc. (NASDAQ:
BCE Reports 2008 Third Quarter Results
 For Immediate Release Montréal, October 29, 2008 This news release contains forward looking statements. For a description of the related risk factors and assumptions please see the section entitled Caution
SoftBank to Acquire 70% Stake in Sprint
 News Release Sprint Nextel 6200 Sprint Parkway Overland Park, Kan. 66251 Contacts: For SoftBank SoftBank Press Office + 81 3 6889 2300 Jim Barron / John Christiansen 212-687-8080 / 415-618-8750 For Sprint
(415) (415) LEVI STRAUSS & CO. ANNOUNCES FOURTH QUARTER & FISCAL YEAR 2017 FINANCIAL RESULTS
 (415) LEVI STRAUSS & CO. ANNOUNCES FOURTH QUARTER & FISCAL YEAR 2017 FINANCIAL RESULTS") FOR IMMEDIATE RELEASE Investor Contact: Edelita Tichepco Media Contact: Avery Vaught Levi Strauss & Co. Levi Strauss & Co. (415) 501-1953 (415) 501-2214 Investor-relations@levi.com newsmediarequests@levi.com
FOR IMMEDIATE RELEASE Investor Contact: Edelita Tichepco Media Contact: Avery Vaught Levi Strauss & Co. Levi Strauss & Co. (415) 501-1953 (415) 501-2214 Investor-relations@levi.com newsmediarequests@levi.com
Cogent Communications Reports Third Quarter 2014 Results and Increases Regular Quarterly Dividend on Common Stock
 FOR IMMEDIATE RELEASE Cogent Contacts: For Public Relations: For Investor Relations: Travis Wachter John Chang + 1 (202) 295-4217 + 1 (202) 295-4212 twachter@cogentco.com investor.relations@cogentco.com
Consolidated Communications Reports Third Quarter 2017 Results
 November 2, 2017 Consolidated Communications Reports Third Quarter 2017 Results Declared the 50 th consecutive quarterly dividend Closed on acquisition of FairPoint July 3, focused on integration activities
Blue Apron Holdings, Inc. Reports Third Quarter 2018 Results
 Key Highlights: Blue Apron Holdings, Inc. Reports Third Quarter 2018 Results Net loss improved 61% or $53.3 million year-over-year from $87.2 million to $33.9 million; adjusted EBITDA improved 61% or $29.2
2018 Revenues Decreased 0.9%, or 0.7% on a Constant Currency Basis, in Line with Guidance
 News Release Investor Relations: Sara Gubins, +1 646 654 8153 Media Relations: Laura Nelson, +1 203 563 2929 NIELSEN REPORTS 4 th QUARTER AND FULL YEAR 2018 RESULTS 2018 Revenues Decreased 0.9%, or 0.7%
Vonage Holdings Corp. Reports Fourth Quarter and Full Year 2011 Results
 Vonage Holdings Corp. Reports Fourth Quarter and Full Year 2011 Results Company Reports Record High Annual Adjusted EBITDA 1 and Net Income, Excluding Adjustments 2 Fourth Quarter 2011 Net Income of $25
Casa Systems Announces Fourth Quarter and Full Year 2017 Financial Results
 Casa Systems Announces Fourth Quarter and Full Year 2017 Financial Results Revenue of $351.6 million for 2017 Won Three Tier-1 Mobile Customers for New Wireless Solutions ANDOVER, Mass., March 06, 2018
News Release H&R Block Announces Fiscal 2014 Results CEO Perspective
 News Release For Immediate Release: June 11, 2014 H&R Block Announces Fiscal 2014 Results Total revenues increased $118 million, or 4%, to $3.024 billion 1 EBITDA increased 8% to $940 million, or 31% of
ServiceNow, Inc. Condensed Consolidated Statements of Operations (in thousands, except share and per share data) (Unaudited)
 (Unaudited)") Condensed Consolidated Statements of Operations (in thousands, except share and per share data) September 30, 2016 September 30, 2015 September 30, 2016 September 30, 2015 Revenues: Subscription $ 318,934
Condensed Consolidated Statements of Operations (in thousands, except share and per share data) September 30, 2016 September 30, 2015 September 30, 2016 September 30, 2015 Revenues: Subscription $ 318,934
McKESSON REPORTS FISCAL 2013 SECOND-QUARTER RESULTS
 McKESSON REPORTS FISCAL 2013 SECOND-QUARTER RESULTS Revenues of $29.9 billion for the second quarter, down 1%. Second-quarter GAAP earnings per diluted share of $1.67, up 42%. Second-quarter per diluted
Intelsat Announces First Quarter 2016 Results
 News Release 2016-23 Contact Dianne VanBeber Vice President, Investor Relations and Corporate Communications dianne.vanbeber@intelsat.com +1 703-559-7406 Intelsat Announces First Quarter 2016 Results First
ServiceNow, Inc. Condensed Consolidated Statements of Operations (in thousands, except share and per share data) (unaudited)
 (unaudited)") ServiceNow, Inc. Condensed Consolidated Statements of Operations (in thousands, except share and per share data) (unaudited) Revenues: Subscription $ 626,567 $ 449,506 $ 1,755,174 $ 1,239,762 Professional
ServiceNow, Inc. Condensed Consolidated Statements of Operations (in thousands, except share and per share data) (unaudited) Revenues: Subscription $ 626,567 $ 449,506 $ 1,755,174 $ 1,239,762 Professional
Groupon Announces First Quarter 2015 Results
 May 5, 2015 Groupon Announces First Quarter 2015 Results Gross billings of $1.6 billion Revenue of $750.4 million Adjusted EBITDA of $72.4 million GAAP loss per share of $0.02; non-gaap earnings per share