November/December 2010
|
|
|
- Thomasina Burke
- 5 years ago
- Views:
Transcription


1 1 November/December 2010
: 1,863 points of sales, located")

2 Largest Retailer in Brazil Gross Sales: R$ 44 billion (annualized based in 2010): 1,863 points of sales, located in 18 States and the Federal District More than 140,000 employees 600 million tickets per year 2.7 million m² of sales areas 2


3 Management Team Clique para editar o estilo do título mestre Clique para editar os estilos 13 years do in texto retail Clique para editar os mestre Enéas estilos do texto mestre 7 in GPA Segundo nível CORPORATE EXECUTIVE OFFICERS Segundo nível Terceiro Terceiro nível nível Quarto Commercial Quarto nível nívelmarket Human Strategy Financial and Strategy Resources Supply Chain IT 9 years in retail 25 years in retail 2 years in retail Quinto Quinto nível 4 GPA 8 months in 25 years in retail 9 in GPA 2 in GPA retail and in GPA 10 in GPA nível Corporate Relations 31 years in retail 9 in GPA CEO BUSINESSES OFFICERS Paulo Food Commercial 21 years in retail 21 in GPA Retail Business 31 years in retail 31 in GPA Specialized Business 18 years in retail 18 in GPA Cash & Carry 22 years in retail 8 in GPA Electronics 12 years in retail 7 abroad and 5 in Brazil E-commerce 16 years in e-commerce 2 in Ponto Frio FIC 18 years in retail 2 in FIC 3
4 New Management Model Retail Cash & Carry Specialized Businesses Electronics.Com Indicators Market Strategy Expansion Sales Strategy Sales Margin Corporate Relations Image Supply Chain Logistics Result Corporate Services, Finance / IT Financial Costs Human Resources Retention and Succession Retail Results Cash & Carry Results Specialized Businesses Results Electronics Results.Com Results 4


5 GPA s Management Model Symbols Monitoring/Control and Adjustment of Non-Compliance Right People Model of Management Role & Responsibility Organizational Structure Technical Knowledge Leadership (Right people in the right places) Method Processes Satisfaction & Happiness Clients Our people Society Suppliers Shareholders Goals Results & Growth Government Guidelines and Goals 5


6 Retail Momentum in Brazil 6 Rise of the Purchasing Power Focus on middle popular class Informality Reduction Channel Diversification Real Estate Boom Integration of Ponto Frio and Casas Bahia 2014 World Cup 2016 Olympic Games


7 ECONOMIC SCENARIO Exame Magazine August,


8 Economic Scenario Since I can remember this is the first time I see Brazil growing distributing income Abilio Diniz 8 Source: Data Popular in the Newspaper O Estado de SP in August 2,
9 9 Formats


10 Multiformat Structure Operational efficiency Supermarkets Cash & Carry Hypermarket Proximity Specialized Stores E-commerce 10


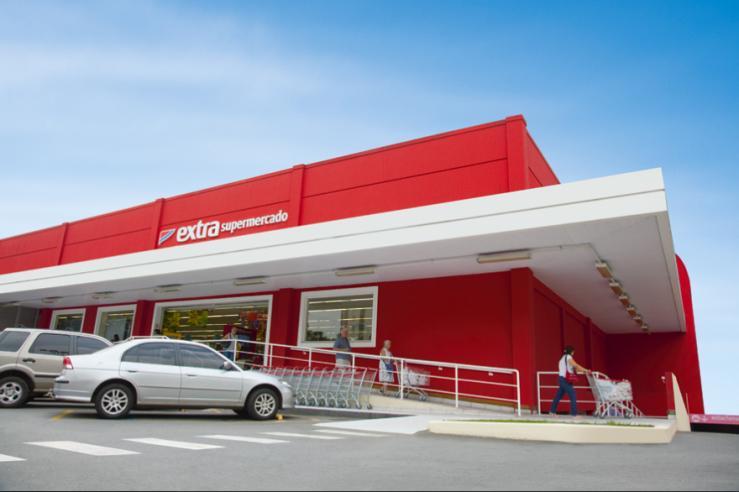
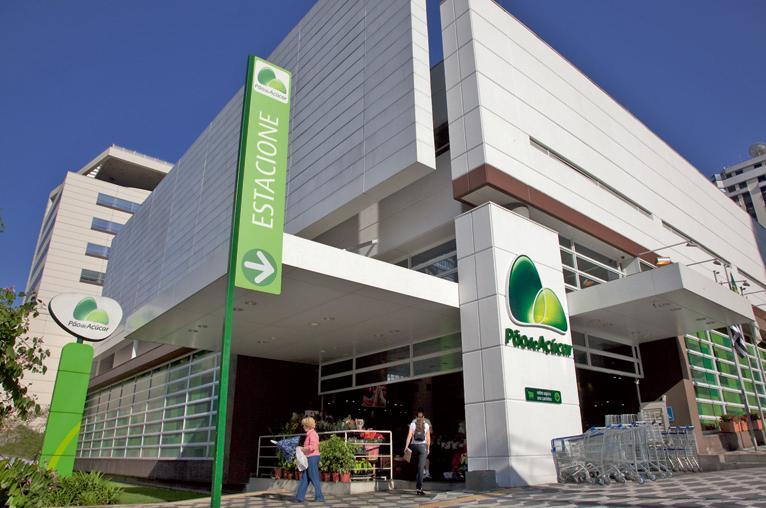
11 Supermarkets High income groups R$ 4.3 billion gross sales in 2009 Avg. sales area: ~1,500 m 2 Differentials: Neighborhood supermarket Innovative solutions Best food service/quality products Fair prices Variety (~51,000 itens) Medium/Low income groups R$ 4.7 billion gross sales in 2009 Avg. sales area: ~1,500 m2 Differentials: Neighborhood supermarket Competitive prices ~ 21,000 itens 11


12 Extra Multiformat Structure All income groups R$ 11.8 billion gross sales in 2009 Broad range of food and non-food products Competitive Prices 6,000 m2 ~ 69,000 itens Rapid Service / Essential Products 300 m² ~ 4,500 itens Second highest growth among all the formats Business model to improve ROIC Stores located in São Paulo, Pernambuco and Fortaleza, ready to roll out 1,500 m2 ~ 25,000 itens Serve the growing number of multichannel consumers 12 Scale is crucial for expansion


13 Specialized Businesses 13

14 Specialized Stores Electronics, Home Appliance and Furniture Focused on High/Middle Income Classes Positioning based on social classes 14

15 E-commerce 15

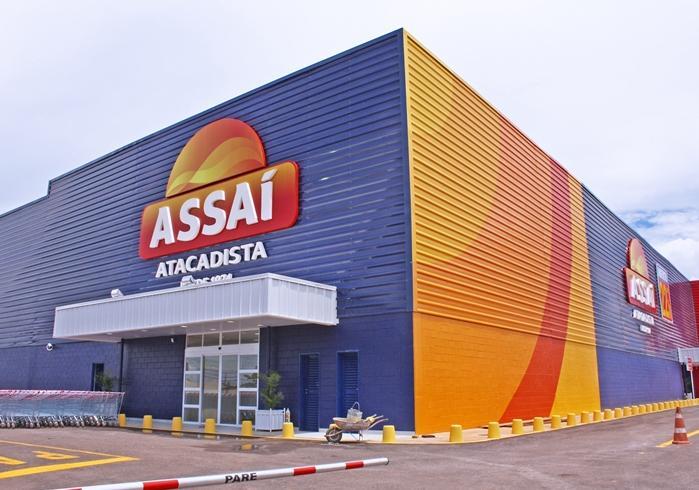
16 Cash & Carry Low income groups R$ 2.2 billion gross sales in 2009 Avg. sales area: 4,000 m2 Highly competitive prices Number of stores: Low cost structure 40 High asset turnover 34 Return on Invested Capital is very attractive for GPA Increase operations in other states 3Q09 4Q09 3Q10 4Q10E 16


17 17 Extra Supermercado
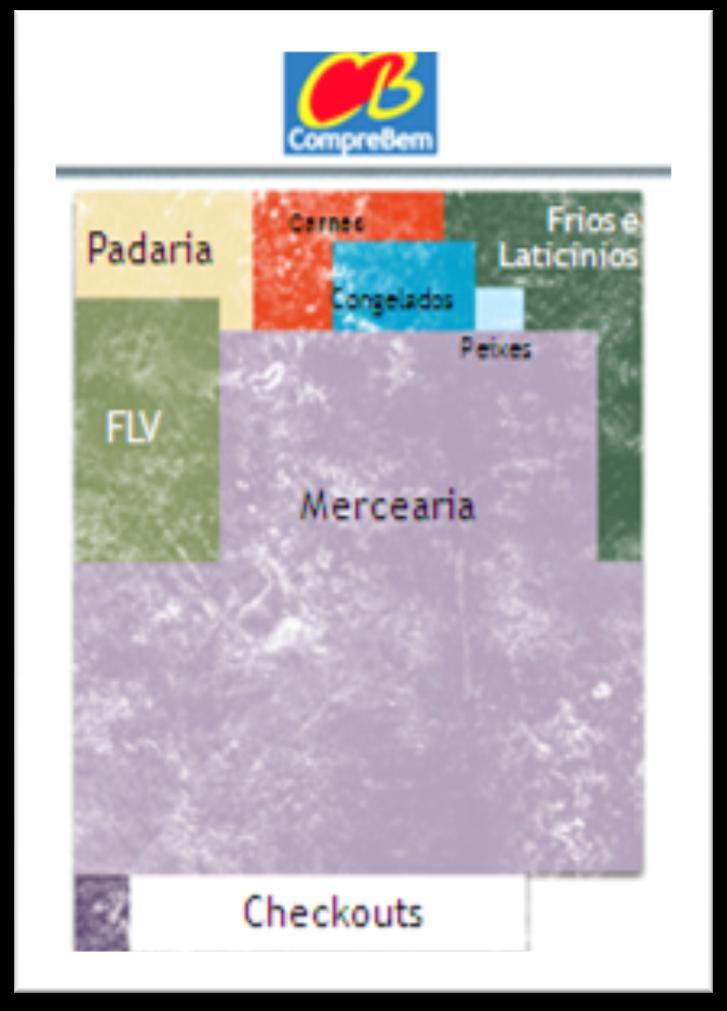
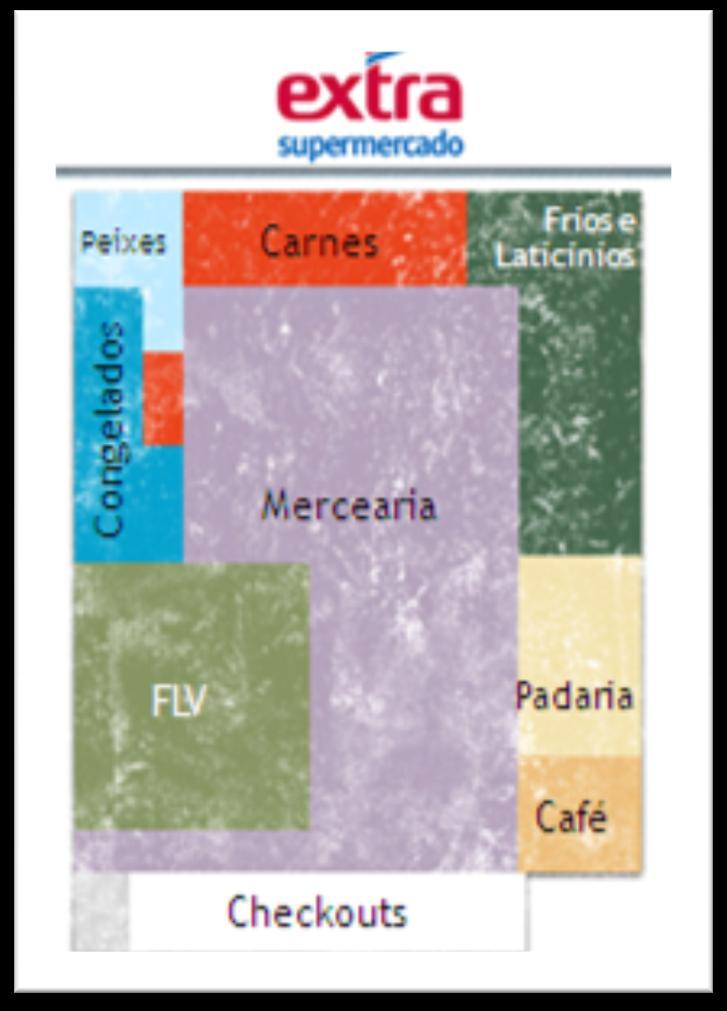


18 18 Extra Supermercado x CompreBem Differentials

19 Regional Stores Distribution (3Q10) Total Middle-West São Paulo Rio de Janeiro North east Total Food Business 608 stores Gas Stations Drugstores Total Electronic Business 1,022 stores Total Specialized Businesses
20 Business Opportunities: Food 20


21 Strategy Growth in Same-Store Sales (SSS) Expansion through Organic Growth Rationalization of Brands Geographical Strategy Bring expertise from specialized channels to hypermarkets Increase its presence in the less saturated markets particularly in the Northeast and Middle-East 21


¹ 13.")

22 Food Brazilian Market Formal Sector in 2009: R$ 177 billion 5.6% of the GDP Informal Sector accounts for approximately 50% of total food consumption Fragmented Market: Small / Medium Chains Increasing formalization of the market Market share (%)¹ 13.3% 13.8% 13.2% 14.8% 10.4% 10.4% 14.1% 11.0% 14.2% 10.7% 14.5% 11.1% 65.9% 61.1% 61.9% 59.6% Others 22 (1) Source: Abras Brazilian Supermarkets Association

 9.")


23 Continuous Gain of Market Share GPA vs Carrefour (Nominal same-store-sales) 9.7% Carrefour GPA 5.2% 7.7% GPA vs ABRAS (Nominal same-store sales) 3.9% 18.2% 15.2% 11.9% 15.1% 3T09 3T10 GPA s sales exceeded Carrefour s in In the last 9 consecutive quarters. In this period, the average sales growth was 2x higher than Carrefour s. 10.7% 9.8% * GPA Abras * up to September/2010
24 Business Opportunities: Electronics, Home Appliance and Furniture 24
25 New Globex Operation Street Shopping Malls * Positioning based on social classes A B C D E States * Includes Extra Eletro stores 25


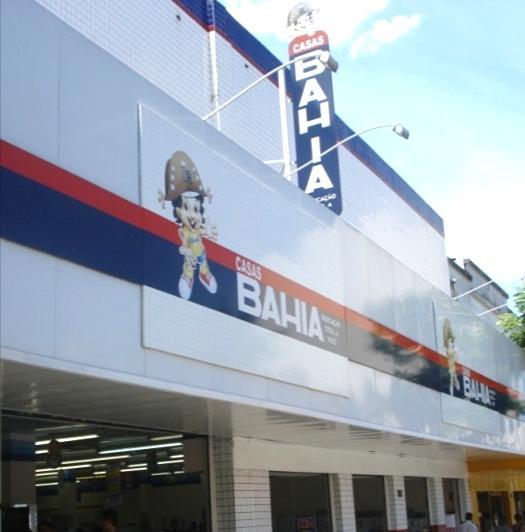
26 Positioning and Brand Strategy To be the best purchase choice for A/B class, and the best choice for B/C class after Casas Bahia. Reach consumers at the base of the pyramid. The strategy is to offer the best business opportunities for the pyramid's base, ensuring that the brand remains most remembered and admired by consumers in the base of the pyramid. 26
27 Furniture Factory - Bartira + Largest factory in Latin America 3 rd largest in the world Around 2 thousand employees More than 4 million items produced in 2009 High growth potential 27

")

28 Past Revenue Figures Total Gross Sales 1H10 (R$ mi) Growth same-store-sales (SSS) 1H10/09 6, % 2, % % Total 8,946 (1) (1) Proforma 28
 Total integration between Casas Bahia and")
29 Strategies for New Globex Strategy pillar Approach - actions 1 Commercial and operating management Commercial synergies Growth of sales 2 Management of Infrastructure and backoffice Centralization of inventories and stock up To take advantage of synergies with GPA Utilization of GPA backoffice platform (Shared Services Center and Indirect Purchase Center) Total integration between Casas Bahia and Ponto Frio Centralization of information systems Improvement of processes 3 Management of financial and capital structure Capitalize Ponto Frio (agreement) Utilization of GPA financial management platform 29


30 2008 Market Share 16% 7% 3% 3% 3% 3% Source: Valor Econômico Ranking (2008) 30
31 Shareholder Structure GPA The Klein Family 53% 1 47% % 1 Globex 50.1% 1 100% Executive Officers 6% New.com NCB 1 Not including Globex s minority shareholders. 31
32 Business Opportunities: E-Commerce 32

33 E-commerce Market Share B2W 53,8% 47,2% R$2 billion Gross Sales GPA.com 8,0% 12,7% 20% others 38,2% 40,1% e 33
34 Business Opportunities: Financial Operation 34


35 Largest Retailer in Brazil 35
36 36 Guidance
 GPA+ Ponto Frio R$ 1.3 billion More than R$ 1.8 billion CAPEX GPA + Ponto Frio R$ 0.7 billion Approximately R$ 1.")
37 GPA s Guidance for M10 Guidances TOTAL GROSS SALES (R$) REAL GROWTH IN GROSS SAME-STORE SALES (%) GPA GPA+ Ponto Frio GPA+ Ponto Frio R$ 18,8 billion More than R$ 26 billion R$ 23,5 billion More than R$ 33 billion 7.2% Between 4.0% and 5.0% EBITDA (R$) GPA+ Ponto Frio R$ 1.3 billion More than R$ 1.8 billion CAPEX GPA + Ponto Frio R$ 0.7 billion Approximately R$ 1.6 billion NET DEBT/ EBITDA GPA+ Ponto Frio 1.07 X Less than 1X 37
 above the market GROSS MARGIN (1) Higher than 25.5% Higher than 26.")
 % of net sales.")
38 Guidance for New Globex 2011E Year model GROSS SALES (R$) Above R$ 20 billion Growth (SSS) above the market GROSS MARGIN (1) Higher than 25.5% Higher than 26.5% EBITDA MARGIN (1) 4.5 to 6.0% Higher than 7.5% FINANCIAL RESULT (1) -3.5 to -4.5% Up to -4.0% CAPEX R$ 100 mn to R$ 120 mn (1) % of net sales. Projections include estimated synergies. 38


39 Main Synergies 1 Commercial and operating management 2 Management of infrastructure and back-office Integrate the Ponto Frio operating management to Casas Bahia model with margin and sales gains Centralization of purchase management with margin gains; Improvement of sales and pricing mix; Increase the penetration of services sales; Repositioning of Ponto Frio brand and maintaining strong the Casas Bahia brand Centralization of the companies inventories and stock ups; Utilization of GPA s back-office platform with Shared Services Center and total integration among Casas Bahia, Ponto Frio and the other areas; Refine the operational processes; Take advantage of other synergies with GPA (logistics, IT etc); 3 Management of financial and capital structure Manage the cash / Working Capital inside GPA platform; Reduction in funding costs / negotiation of financing instruments and lines at GPA cost; 39
 1 Commercial and operating management 1.0% - 2.")

 Total 3.0% - 5.")
40 Synergies Potential per year after total capture of synergies (1) 1 Commercial and operating management 1.0% - 2.0% (R$ mn) 2 Management of infra-structure and back-office 1.5% - 2.0% (R$ mn) 3 Management of financial and capital structure 0.5% - 1.0% (R$ mn) Total 3.0% - 5.0% (R$ mn) (1) Synergy calculated over the net sales. 40
41 3Q10 Results 3Q10 GPA Food Results 3Q10 Globex Results 41

 : 25.")
 Consolidated EBITDA: R$ 493")
 (+50 bps) Globex: 5,1% (R$ 77,1 mi)")
 Dividend distribution of R$ 19.")

42 3Q10 Highlights compared to 3Q09 Consolidated Gross Sales: R$ 7.9 bn (+15.6%) Gross same store sales: +12.5% Gross Margin GPA Food (1) : 25.9% (+50 bps) Globex: 19.8% (+ 400 bps) Consolidated EBITDA: R$ 493 M (7.0%) GPA Food (1) : 7.5% (R$ M) (+50 bps) Globex: 5,1% (R$ 77,1 mi) (+590 bps) Net Income: R$ 115 M (margin of 1.6%) Dividend distribution of R$ 19.6 M Approval of the Association with Casas Bahia in Extraordinary Shareholders Meeting in 11/09/ GPA Food (1) : refers to Consolidated GPA excluding Globex
43 3Q 10 Results 3Q10 GPA Food Results 43


44 Gross sales of R$ 6.2 bn, year-onyear growth of 10.0% R$ M GROWTH OF 7,7% IN GROSS SAME- STORE-SALES: 3Q10 X 3Q09 Highlights: Textile Personal Care & Household Cleaning Bazar Beverages and posted growth of 19.6% and 24.1% respectively In 9M10, gross sales totaled R$ 18,8 bn Missing R$ 7.2 bi in 4Q to reach the guidance of R$ 26 bi: % compared with 3Q % compared with 4Q09 44

45 Assaí 3Q10 Results: Gross Sales of R$ 816 M Gross Margin of 14.7% (+ 1oo bps compared to 3Q09) Expense of 11.3% of net sales (- 800 bps compared to 2Q10) 3.5% of EBITDA margin. Larger interest on GPA s sales: from 8.1% in 3Q09 to 10.3% in 3Q10 3Q10 Openings: 2 new stores Number of stores: convertions (1 of CompreBem and 2 of Sendas) New logistic operation: 40 2 DCs dedicated to store operation 1 DC dedicated to external and counter sales 34 Food Service Market: Growth of twice the retail food Over 35% of Brazilians eat away from home 3Q09 4Q09 3Q10 4Q10E 45


46 Gross Profit of R$ 1.4 bn Margin of 25.9% 110 bps up on 2Q10 and 50 bps up on 3Q R$ M ,288 1, % 29,3% 28,3% 27,3% 26,3% The improvement on results was due to: % 25,3% 24,3% More advantageous negotiations with suppliers Improved operational management Pricing Management tool Tax substitution regime - against informality 3Q09 3Q10 and more balanced pricing policy 46
 3Q09 3Q10 Recurring Technology to support business expansion")
47 Total Operating Expenses of R$ 1.0 bn, equivalent to 18.4% of Net Sales R$ M 1, % 18.4% 18,3% In this quarter, we had additional expenses with: Exceptional events Advertising and marketing Personnel (bargaining agreement) 3Q09 3Q10 Recurring Technology to support business expansion in the coming years Opening of new stores Despite the scenario above mentioned, expenses were in line with 3Q09 and 2Q10, which shows a dilution in other expenses. 47
48 EBITDA margin stood at 7.5% in 3Q10 EBITDA Margin EBITDA Margin of 8.1%, excluding Assaí The highest 3Q margin since 2007 GPA Food (excluding Assaí) GPA Food Assaí 48


 Net Debt in the end of the period.")
49 Financial Result and Indebtedness Net Financial Result R$ M 1.0%: interest and charges over the net debt: Net debt increase; SELIC rate increase % of net sales 0.5 %: cost of discounts on receivables: SELIC rate increase 0.3%: interest and charges over other liabilities. 49 (1) Net Debt in the end of the period. (2) Net Debt does not consider dicounted receivables.
 Acquisitions of R$ 792 M,")
 / EBITDA: 1.")
 Net Debt does not")
50 Evolution of Net Debt Evolution of net debt (1) Acquisitions of R$ 792 M, including Globex (R$ 665 M) Organic growth Net Debt (2) / EBITDA: 1.07x 3Q09 3Q10 50 (1) Net Debt in the final of period (2) Net Debt does not consider Receivables..


51 FIC IN 3Q10 FIC s Result: R$ 9 M BANNER PRIVAT E LABEL PRIVATE LABEL WITH BANNER CO-BRANDED R$ M Continuous card issuance; 50% of clients are insured; and Extra Hiper and Super s 19% interest in FIC 51
 Adjusted Net Income: R$ 144 M")


52 3Q10 Net Income Adjusted Net Income (R$ M) Adjusted Net Income: R$ 144 M Net Margin: 2.6% 100 bps up on 2Q10, due to improvements on gross margin and EBITDA Non-recurring effects in 3Q10: R$ 2 M due to REFIS in 2Q10 R$ 6 M due to restructuring expenses from the ZBB Net Income: R$ 138 M Net Margin: 2.5% 52

53 3Q10 Globex Results 53


54 Message from CEO Joint venture with Casa Bahia approved on Extraordinary Shareholders Meeting held on November 9, 2010 Raphael Klein The beginning of a journey that is aligned with our plans A single team playing towards the same goal Full support to financial cost reducing initiatives 54

55 Gross Sales of R$ 1.7 bn, year-onyear growth of 42% R$ M 41.7% (1) higher than 3Q09 Growth of 15% in sales/s.q.m² terms 15.2% increase in SSS sales 61.8% increase in e-commerce sales in 3Q10 compared to 3Q09 55 (1) Incluiding e-commerce.

56 Gross Profit of R$ 300 M, with gross margin of 19.8% The beginning of a journey that is aligned with our plans 400 bps improvement over 3Q09 and 200 bps improvement over 2Q10 R$ M Turnaround started on August/2009: More advantageous negotiations with suppliers Reformulation of the product mix Adjustment of expense level Synergies with Casas Bahia as of July/2010: Reinforcement in negotiations with suppliers Improvement on product mix First Commercial actions jointly 56 (1) 3Q09: first quarter OF Globex under GPA s management.

57 Total Operating Expenses of R$ 223 M, equivalent to 14.7% of Net Sales R$ M The beginning of a journey that is aligned with our plans: In 3Q10, 200 bps down on 3Q09 and 400 bps down on 2Q10 Main effects: Installation of the Expense Committee Elimination of Ponto Frio core structure use of GPA/CB s back office platform Expect of additional benefits to be generated for the Group due to synergies with Casas Bahia 57

 The beginning of a journey that is aligned with our")

58 EBITDA of R$ 77 M, with a margin of 5.1% EBITDA Margin 590 bps on 3Q09 (-0.8%) and 250 bps on 2Q10 (2.6%) The beginning of a journey that is aligned with our plans Main effects: Better negotiations with suppliers Expansion of the product mix with more profitable items Stricter control over expenses First synergy gains with Casas Bahia 58


59 Net Financial Expenses (1) in 3Q10 R$ 90 M: 5.9% of net sales Excluding non-recurring effect of R$ 18 M, representing 4.7% of net sales In line with the 2Q10 level of 5.8% Net Financial Expenses (R$ M) Main factors: Increase of SELIC rate in the period Increase in sales volume Term (days) 59 (1) Net Financial Expenses: Financial Result


 AUM: R$ 1,166 M Rate:")
60 Actions to Improve Financial Results Key actions underway to reduce the financial expenses: Constitution of FIDC Reduction of the average payment term of noninterest bearing sales from 9.5 months to 7.5 months Sales Growth at the same level FIDC Constitution (Receivables-Backed Investment Fund) AUM: R$ 1,166 M Rate: % of CDI Rating: AAA (Fitch) 60


61 FIC IN 3Q10 FIC s Results: R$ 2.3 mi Continuous card issuance; 75% of clients are insured; and 26% share in Ponto Frio s stores sales and 12% in e- commerce sales. 61


62 Net Income in 3Q10 Net Margin The beginning of a journey aligned with our plans, but full of accomplishmen ts to be made 62 * Adjusted Net Margin
 By the end")


 Sales Area")
63 Investiments and Area expansion (1) By the end of 2010: Investiments should amount R$ 1.3 bn Sales Area should reach 1,506,000 m 2 (+7% on 4Q09) Openings in 4Q10: 5 Extra Hipermercado (27,100 m²) 9 Assaí (31,200 m²) Sales Area Growth (000 m 2 ) 63 (1) GPA sem Globex
Largest Retailer in Brazil. Gross Sales: R$ 44 billion
 1 January 2011 Largest Retailer in Brazil Gross Sales: R$ 44 billion (annualized based in 2010): 1,863 points of sales, located in 18 States and the Federal District More than 140,000 employees 600 million
Clique para editar o estilo do título. mestre. mestre. Quarto nível. Clique para editar o estilo do título mestre
 estil estil estil Segun Segun Segun 1 September 2010 Largest Retailer in Brazil R$ 44 billion Grs Sales: (annualized based in 2010): estil estil estil Segun Segun Segun 1,891 points of sales, located in
CORPORATE PRESENTATION
 CORPORATE PRESENTATION Grupo Pão de Açúcar and Globex Utilidades May, 2011 ABOUT GRUPO PÃO DE AÇÚCAR > Key figures > R$ 50+ bi Sales 1 > #1 Retailer in Brazil > Growth higher than the 2nd player s 2 >
4Q10 and 2010 Results. Investor Relations February 24, 2011
 1 4Q10 and 2010 Results Investor Relations February 24, 2011 2010 Challenges 2010 The year started with important challenges: Enéas Pestana Replacement of the President Management of a multiformat company
2Q10 Results July 28, 2010
 2Q10 Results July 28, 2010 Disclaimer The numbers related to Grupo Pão de Açúcar s operating and financial performance commented on below are presented: (i) on a consolidated basis, which includes the
CORPORATE PRESENTATION
 CORPORATE PRESENTATION Grupo Pão de Açúcar and Globex Utilidades November, 2011 ABOUT GRUPO PÃO DE AÇÚCAR > Key figures > R$ 50+ bi Sales 1 > #1 Retailer in Brazil > Growth higher than the 2nd player s
1Q13 RESULTS. Grupo Pão de Açúcar and Viavarejo. April 30, 2013
 Grupo Pão de Açúcar and Viavarejo April 30, 2013 GPA CONSOLIDATED RESULTS 1Q13 Gross Sales R$ million, 1Q13 x 1Q12 Same-store-sales growth vs 1Q12 14,984 +9.7% SSS +6.6% EBITDA R$ million, 1Q13 x 1Q12
1Q18 Earnings April 27, Q18 Earnings Presentation April 27, 2018
 1Q18 Earnings Presentation April 27, 2018 Higher profitability at GPA: Reversal of sales trend and strong recovery in profitability at Multivarejo, accompanied by solid performance of Assaí Multivarejo
Quarterly Financial Information
 Quarterly Financial Information With Unqualified Report of Independent Registered Accounting Firm over the Quarterly Financial Information Page 0 of 160 CONVENIENCE TRANSLATION INTO ENGLISH FROM THE ORIGINAL
Resultados 3º Trimestre de de outubro Q18 and 2018 Results February 21, 2019
 4Q18 and 2018 Results February 21, 2019 2018: Highlights OPTIMIZATION OF STORE PORTFOLIO 15 Pão de Açúcar stores renovated into the new model 23 Extra Super to Mercado Extra 13 conversions to Compre Bem
4Q12/2012 RESULTS. Grupo Pão de Açúcar and Viavarejo. February 20, 2013
 4Q12/2012 RESULTS Grupo Pão de Açúcar and Viavarejo February 20, 2013 GPA CONSOLIDATED RESULTS 4Q12 Including Projects Excluding Projects Gross Sales R$ million, 4Q12 x 4Q11 Same-store-sales growth vs
Earnings Results 3Q18 October, 26, Q18 Results October 26, 2018
 3Q18 Results October 26, 2018 The multi-channel, multi-format and multi-region portfolio contributed to the sustainability of the Company's performance towards reaching this year's Guidance Gross Sales
Fourth Quarter and Full Year 2016 Results
 São Paulo, Brazil, February 23, 2017 GPA [BM&FBOVESPA: PCAR4 (PN); NYSE: CBD] announces its results for the fourth quarter of 2016 (4Q16). The comments refer to the consolidated results of the Group or
Deutsche Bank Conference. 17 June 2010
 Deutsche Bank Conference 17 June 2010 Casino s new profile Solid fundamentals to drive growth Appendices 2 Until 1997, Casino was a purely French, mediumsize player, concentrated on hypermarket and supermarket
SOCIETE GENERALE PREMIUM REVIEW CONFERENCE
 SOCIETE GENERALE PREMIUM REVIEW CONFERENCE 2 December 2010 FIRST-HALF 2010 RESULTS 1 CASINO GROUP S PROFILE 2011e consolidated sales: c.eur33bn* 200,000 employees around the world Over 11,000 stores worldwide
3Q18 EARNINGS. Food Business Multivarejo Assaí. (R$ million) (1) 3Q18 3Q17 Δ 3Q18 3Q17 Δ 3Q18 3Q17 Δ 3Q18 3Q17 Δ
 (1) 3Q18 3Q17 Δ 3Q18 3Q17 Δ 3Q18 3Q17 Δ 3Q18 3Q17 Δ") São Paulo, October 25, 2018 - GPA [B3: PCAR4; NYSE: CBD] announces its results for the third quarter of 2018. Due to the ongoing divestment of the interest held by GPA in Via Varejo S.A., as announced
São Paulo, October 25, 2018 - GPA [B3: PCAR4; NYSE: CBD] announces its results for the third quarter of 2018. Due to the ongoing divestment of the interest held by GPA in Via Varejo S.A., as announced
4Q18 & 2018 EARNINGS RELEASE
 São Paulo, February 20, 2019 - GPA [B3: PCAR4; NYSE: CBD] announces its results for the fourth quarter and full year of 2018. Due to the ongoing divestment of the interest held by GPA in Via Varejo S.A.,
Institutional Presentation
 Institutional Presentation November, 204 Summary A VIA VAREJO AT A GLANCE B VIA VAREJO S POSITIONING C HIGHLIGHTS OF 3Q4 2 Summary A VIA VAREJO AT A GLANCE B VIA VAREJO S POSITIONING C HIGHLIGHTS OF 3Q4
2Q17 RESULTS. Operating Highlights. Financial Highlights. Outlook
 São Paulo, Brazil, July 25, 2017 - GPA [B3: PCAR4 (PN); NYSE: CBD] announces its results for the 2 nd Quarter of 2017. The comments refer to the consolidated results of the Group or of its business units.
1Q10 Earnings Release
 Rio de Janeiro, Brazil, May 10, 2010 Globex Utilidades S.A. (BM&FBOVESPA: GLOB3; OTC: GBXPY) announces its results for the first quarter of 2010 (). The Company s operating and financial information presented
Corporate Presentation October 2018
 Corporate Presentation October 2018 GPA Overview Strategy CSR: Corporate Social Responsibility 2Q18 Results Company Structure Glossary 2 GPA Food in numbers Gross Sales Number of Stores Sales Area ('000
3 rd Quarter 2015 Earnings Release
 3 rd Quarter 2015 Earnings Release October 29 th, 2015 Highlights of Results Net Sales totaled R$ 4.095 billions in, down 22,7%, mainly due 1 to the market decline in consumption Adjustments in Cost structure,
4 th Quarter 2015 Earnings Release
 4 th Quarter 2015 Earnings Release February 24 th, 2016 Highlights of Results 1 2 Market share gain in the total market in, with Net Sales of R$ 5.461 billions, down 14.7%, and sales level recovery compared
4 TH QUARTER OF 2015 EARNINGS RELEASE. Net Cash of R$4.8 billion and market share gain in the quarter
 Net Cash of R$4.8 billion and market share gain in the quarter Net Sales of $5.5 billion, with market share gain in the total market and recovery in sales compared to the second and third quarters as a
 Page 1 of 305 20-F 1 cbdform20f_2011.htm FORM 20-F 2011 UNITED STATES SECURITIES AND EXCHANGE COMMISSION Washington, D.C. 20549 FORM 20-F REGISTRATION STATEMENT PURSUANT TO SECTION 12(b) OR (g) OF THE
1 March full-year RESULTS
 1 March 2011 2010 full-year RESULTS PRELIMINARY NOTES The 2010 consolidated financial statements were approved by the Board of Directors on 28 February 2011 and have been audited All the figures provided
Companhia Brasileira de Distribuição
 (FreeTranslation into English from the Original Previously Issued in Portuguese) Companhia Brasileira de Distribuição Individual and Consolidated Interim Financial Information for the Quarter Ended and
2Q17 Highlights. Same-store sales growth reached 10.8% in 2Q17 among brick and mortar stores. Double-digit growth not seen since 3Q13.
 July 24, 2017 Via Varejo S.A., Brazil s largest electronics, home appliances and furniture retailer, announces its results in the second quarter of 2017 (2Q17). On November 1, 2016, the Company started
2013 Annual Results March 7, 2014 RALLYE
 2013 Annual Results March 7, 2014 RALLYE GROUP PRESENTATION AS AT DECEMBER 31, 2013 RALLYE Listed company 48.4% of shares 59.5% of voting rights 93.7% of shares 94.6% of voting rights INVESTMENT PORTFOLIO
Financial Statements Companhia Brasileira de Distribuição
 Financial Statements Companhia Brasileira de Distribuição Consolidated Financial Statements Contents Independent Auditor s Report on Financial Statements... 2 Balance Sheets... 5 Statements of Income and
COMPANHIA BRASILEIRA DE DISTRIBUIÇÃO CNPJ/MF: / COMPANY REGISTRY (NIRE): São Paulo, 28 March 2016.
: São Paulo, 28 March 2016.") COMPANHIA BRASILEIRA DE DISTRIBUIÇÃO CNPJ/MF: 47.508.411/0001-56 COMPANY REGISTRY (NIRE): 35.300.089.901 São Paulo, 28 March 2016. MANAGEMENT PROPOSALS FOR THE EXTRAORDINARY AND ANNUAL SHAREHOLDERS MEETING
COMPANHIA BRASILEIRA DE DISTRIBUIÇÃO CNPJ/MF: 47.508.411/0001-56 COMPANY REGISTRY (NIRE): 35.300.089.901 São Paulo, 28 March 2016. MANAGEMENT PROPOSALS FOR THE EXTRAORDINARY AND ANNUAL SHAREHOLDERS MEETING
Full-Year 2009 Results. Outlook
 Paris, 4 March 2010 Full-Year 2009 Results Tangible growth in attributable net profit (8.6%) and EPS (up 12.2%) Moderate 4.5% decline in trading profit (down 2.5% organic) Significant reduction in net
4Q17 and 2017 RESULTS
 São Paulo, February 19, 2018 - GPA [B3: PCAR4; NYSE: CBD] announces its results for the fourth quarter. Due to the ongoing divestment of the interest held by GPA in Via Varejo S.A., as announced in the
1Q17 Highlights. Sales recovery in Brick and Mortar Stores, with same-store sales growth of 2.5% in 1Q17.
 April 26, 2017 Via Varejo S.A., Brazil s largest electronics, home appliances and furniture retailer, announces its results in the first quarter of 2017 (1Q17). On November 1, 2016, the Company started
2016 Highlights. Gross margin expanded in both channels to reach 31.4% (growth of 364bps)
") February 22, 2017 Via Varejo S.A., Brazil s largest retailer of electronics, home appliances and furniture, announces its results for the fourth quarter (4Q16) and full year 2016. On November 1, 2016,
February 22, 2017 Via Varejo S.A., Brazil s largest retailer of electronics, home appliances and furniture, announces its results for the fourth quarter (4Q16) and full year 2016. On November 1, 2016,
UNITED STATES SECURITIES AND EXCHANGE COMMISSION WASHINGTON, D.C Federative Republic of Brazil (Jurisdiction of Incorporation)
") UNITED STATES SECURITIES AND EXCHANGE COMMISSION WASHINGTON, D.C. 20549 FORM 20-F ANNUAL REPORT PURSUANT TO SECTION 13 OR 15(d) OF THE SECURITIES EXCHANGE ACT OF 1934 For the fiscal year ended: December
UNITED STATES SECURITIES AND EXCHANGE COMMISSION WASHINGTON, D.C. 20549 FORM 20-F ANNUAL REPORT PURSUANT TO SECTION 13 OR 15(d) OF THE SECURITIES EXCHANGE ACT OF 1934 For the fiscal year ended: December
2015 and 4Q15 Results FLRY3. March 2016
 2015 and Results FLRY3 March 2016 Disclosure This presentation may contain forward-looking statements. Such statements are not statements of historical facts and reflect the beliefs and expectations of
FORM 6-K. SECURITIES AND EXCHANGE COMMISSION Washington, D.C Report of Foreign Private Issuer
 6-K 1 cbditr1q14_6k.htm ITR 1Q14 FORM 6-K SECURITIES AND EXCHANGE COMMISSION Washington, D.C. 20549 Report of Foreign Private Issuer Pursuant to Rule 13a-16 or 15d-16 of the Securities Exchange Act of
Marisa at a Glance. Largest women fashion and underwear retailer in Brazil. Focus on the middle class. 63 years of track record.
 Institutional Presentation May 2012 Marisa at a Glance 63 years of track record Financial services platform Focus on the middle class Largest women fashion and underwear retailer in Brazil Multiformat
21 February 2013 FULL-YEAR RESULTS
 21 February 2013 FULL-YEAR RESULTS 2012 2012 HIGHLIGHTS AND 2013 PERSPECTIVES 2012 KEY FIGURES (Continuing operations) 2012 Change vs. 2011 Consolidated net sales 41,970.7m +22.1% EBITDA 2,853m +24.7%
Profit of R$239 million in 1Q15, growth of 34%; EBITDA Margin of 9.6%, or a 70 bps increase
 Profit of R$239 million in 1Q15, growth of 34%; EBITDA Margin of 9.6%, or a 70 bps increase In 1Q15, net revenue totaled R$5.388 billion, a flat growth compared to 1Q14, excluding the impact of store closures
Brazil A COUNTRY OF CONTRASTS. May 19th, Sunrise in Amazon / Amazônia
 Brazil A COUNTRY OF CONTRASTS 1 Sunrise in Amazon / Amazônia OBJECTIVE Brief presentation and discussion to put Brazil's market reality in perspective 2 Rio-Niteroi Bridge / Rio de Janeiro THREE ASPECTS
FINANCIAL RESULTS PIERRE-JEAN SIVIGNON
 FINANCIAL RESULTS PIERRE-JEAN SIVIGNON 2 FURTHER PROFIT GROWTH IN FIRST-HALF 2015 (in m) H1 2014 (1) H1 2015 (2) Variation at constant exch. rates Variation at current exch. rates Net sales 35,870 37,739
FIRST-HALF 2016 KEY FIGURES
 FIRST-HALF 2016 KEY FIGURES (in m) H1 2015 H1 2016 (1) Variation at constant exch. rates Variation at current exch. rates Net sales 37,739 36,289 +2.2% -3.8% Net sales excluding petrol 34,337 33,243 +3.2%
RALLYE Annual Results February 17, 2015
 RALLYE 2014 Annual Results February 17, 2015 GROUP PRESENTATION AS AT DECEMBER 31, 2014 RALLYE Listed company 48.4% of shares 60.4% of voting rights 100% INVESTMENT PORTFOLIO Strategic asset Among the
Corporate presentation August 2017 FLRY3
 Corporate presentation August 2017 FLRY3 Agenda Overview and Strategy Financial Performance Healthcare Sector in Brazil Expansion Plan Ownership Structure and Governance 2 Agenda Overview and Strategy
3Q16 results FLRY3. October 2016
 results FLRY3 October 2016 Disclosure This presentation may contain forward-looking statements. Such statements are not statements of historical facts and reflect the beliefs and expectations of the Company
Press release August 30, FIRST-HALF 2017 RESULTS Solid sales growth of +6.2% Recurring operating income of 621m
 FIRST-HALF 2017 RESULTS Solid sales growth of +6.2% Recurring operating income of 621m Net sales up +6.2% to 38.5bn, reflecting the combination of a good like-for-like performance and the effect of expansion:
H FINANCIAL RESULTS. August 30,
 August 30, 2017 1 Disclaimer This presentation contains both historical and forward-looking statements. These forward-looking statements are based on Carrefour management's current views and assumptions.
1st Quarter Results, April 28, 2017
 1Q17 Results April 28, 2017 Highlights R$ thousand 1Q17 Food Business Multivarejo Assaí Change vs. 1Q16 1Q17 Change vs. 1Q16 1Q17 Change vs. 1Q16 Net sales 10,552 +6.7% 6,513-3.4% 4,039 +28.3% Gross profit
3 rd QUARTER OF 2015 EARNINGS RELEASE
 Continuation of measures to improve efficiency and optimize costs; Intensification of commercial initiatives to drive sales growth and gain market share. Net sales totaled R$4.095 billion in 3Q15, down
FULL-YEAR RESULTS Full-Year Results. 28 February 2012
 FULL-YEAR RESULTS 2011 1 28 February 2012 PRELIMINARY NOTES The 2011 consolidated financial statements were approved by the Board of Directors on 27 February 2012 and audited by the statutory auditors.
CORPORATE PRESENTATION. March 2017
 CORPORATE PRESENTATION March 2017 InRetail Overview Multi-format retailer with exclusive focus in Peru Leading positions in its 3 segments #1 supermarket chain #1 pharmacy chain #1 shopping center operator
Corporate presentation May 2017 FLRY3
 Corporate presentation May 2017 FLRY3 Agenda Overview and Strategy Financial Performance Healthcare Sector in Brazil Expansion Plan Ownership Structure and Governance 2 Agenda Overview and Strategy Financial
Fourth-quarter and full-year 2017 RESULTS MARCH,
 Fourth-quarter and full-year 2017 RESULTS MARCH, 15 2018 DISCLAIMERS This presentation contains forward-looking statements. Such statements are not statements of historical fact, and reflect the beliefs
2017 FULL YEAR RESULTS. February 28,
 2017 FULL YEAR RESULTS February 28, 2018 1 Disclaimer This presentation contains both historical and forward-looking statements. These forward-looking statements are based on Carrefour management's current
2016 and 4Q16 Results FLRY3. March 2017
 2016 and Results FLRY3 March 2017 Disclosure This presentation may contain forward-looking statements. Such statements are not statements of historical facts and reflect the beliefs and expectations of
EARNINGS RELEASE 2Q16 e 1S16
 EARNINGS RELEASE 2Q16 e 1S16 CONSOLIDATED GROSS REVENUE OF R$ 9.4 BILLION IN 1S16 CONSOLIDATED EBITDA OF R$ 1.1 BILLION, +17.4% Rio de Janeiro, August 11th, 2016 Lojas Americanas S.A. [BOVESPA: LAME3 (common)
Corporate presentation March 2018
 Corporate presentation March 2018 Agenda Overview and Strategy Financial Performance Healthcare Sector in Brazil Expansion Plan Ownership Structure and Governance 2 Agenda Overview and Strategy Financial
Companhia Brasileira de Distribuição
 (FreeTranslation into English from the Original Previously Issued in Portuguese.) Companhia Brasileira de Distribuição Individual and Consolidated Interim Financial Information for the Quarter Ended and
Institutional Presentation. March
 Institutional Presentation March 2013 Marisa at a glance Largest women fashion and lingerie retailer in Brazil 64 years of track record Focus on the middle class National footprint 2 Multiformat store
Grupo Carrefour Brasil
 Free translation into English from the original previously issued in Portuguese Grupo Carrefour Brasil Individual and Financial Statements as of December 31, 2017 Atacadão S.A. Grupo Carrefour Brasil Individual
Merger Presentation 90, 90, 90
 228, 132, 106 85, 134, 180 233, 234, 235 254, 221, 34 Merger Presentation 90, 90, 90 1, 64, 148 226, 31, 29 December 2017 UNIDAS TRACK-RECORD 1985-2000 2001-2009 2010-2012 2013-2015 2016 Foundation SAG
Companhia Brasileira de Distribuição
 (Convenience Translation into English from the Original Previously Issued in Portuguese) Companhia Brasileira de Distribuição Individual and Interim Financial Information for the Quarter Ended and Report
INSTITUTIONAL PRESENTATION 3Q18. p. 1
 INSTITUTIONAL PRESENTATION 3Q18 p. 1 Market under transformation and with high growth potential Company ready to capture increase in profitability PROFITABILITY Scale business with high dilution potencial
Deutsche Bank Conference
 Deutsche Bank Conference 11 JUNE 2007 CASINO IN A SNAP SHOT A 100-year old banner 2006 consolidated sales: EUR22.5 Bio A leading multiformat French food retailer A rapid internationalisation since 1996:
EBITDA of R$ 76.0 million (+18.4%), with a 25.4% margin (+3.8 p.p.). Higher full-price sales volume, with 46.5% reduction of remarked-price sales.
, with a 25.4% margin (+3.8 p.p.). Higher full-price sales volume, with 46.5% reduction of remarked-price sales.") São Paulo, Brazil, May 7, 2018 - Restoque Comércio e Confecções de Roupas S.A. ( Company ) (LLIS3), leading company in the premium clothing and apparel retail industry in Brazil, presents its results for
São Paulo, Brazil, May 7, 2018 - Restoque Comércio e Confecções de Roupas S.A. ( Company ) (LLIS3), leading company in the premium clothing and apparel retail industry in Brazil, presents its results for
CORPORATE PRESENTATION
 CORPORATE PRESENTATION 2017 InRetail Overview Multi-format retailer with exclusive focus in Peru Leading positions in its 3 segments #1 supermarket chain #1 pharmacy chain #1 shopping center operator Controlled
FIRST QUARTER OF 2018 RESULTS
 FIRST QUARTER OF 2018 RESULTS São Paulo, May 07, 2018. Linx S.A. (B3: LINX3; Bloomberg: LINX3:BZ e Reuters: LINX3.SA), announces its consolidated results for the first quarter of 2018 (). The Company s
Press release July 26, 2018
 POSITIVE FIRST-HALF 2018 RESULTS Growth in recurring operating income and strong cash flow generation Rapid implementation of the transformation plan, targets confirmed Like-for-like sales up 0.7% in first-half
H Results. July 26th 2018
 H1 2018 Results July 26th 2018 FIRST SIGNIFICANT ADVANCES IN THE CARREFOUR 2022 TRANSFORMATION PLAN H1 2018: Strong momentum for Carrefour 2022 OMNICHANNEL RAPIDLY RAMPING-UP Rapid implementation of food
CORPORATE PRESENTATION
 CORPORATE PRESENTATION 2018 InRetail Overview Peruvian multi-format retailer, with presence in the Andean region through the pharma business Leading positions in Peru in its 3 segments #1 food retail chain
2Q17. Net profit of R$8.3 million in the 2Q17 (R$11.1 million excluding non-recurring impacts).
.") São Paulo, Brazil, August 7, 2017 - Restoque Comércio e Confecções de Roupas S.A. ( Company ) (LLIS3), leading company in the premium clothing and apparel retail industry in Brazil, presents its results
São Paulo, Brazil, August 7, 2017 - Restoque Comércio e Confecções de Roupas S.A. ( Company ) (LLIS3), leading company in the premium clothing and apparel retail industry in Brazil, presents its results
2017 FULL YEAR RESULTS
 2017 FULL YEAR RESULTS Consolidated net sales: +5.0% Consolidated trading profit: +20.1% Underlying earnings per share: +13.4% In 2017, the Group reached its objective of a trading profit growth of 20%
RALLYE. Investor Presentation November 2017
 RALLYE Investor Presentation November 2017 GROUP PRESENTATION AS AT JUNE 30, 2017 RALLYE Listed company 51.1% of shares (1) 63.6% of voting rights 100% INVESTMENT PORTFOLIO Strategic asset Among the global
Highlights of the period
 GROWTH IN REVENUES AND ADJUSTED EBITDA São Paulo, November 06, 2017. A Linx S.A. (B3: LINX3; Bloomberg: LINX3:BZ and Reuters: LINX3.SA), the leader in management software for retailers, announced its consolidated
IMPORTANT INFORMATION
 INSTITUTIONAL PRESENTATION Dec/2013 IMPORTANT INFORMATION This document contains forward-looking information to take into account regarding the business prospects, operational and financial results estimates
Company Overview 2008
 Company Overview 2008 Safe Harbor Statement During this presentation management may discuss certain forwardlooking statements concerning FEMSA s future performance that should be considered as good faith
SECOND SUPPLEMENT DATED 8 MARCH 2010 TO THE BASE PROSPECTUS DATED 13 NOVEMBER Casino Guichard-Perrachon
 SECOND SUPPLEMENT DATED 8 MARCH 2010 TO THE BASE PROSPECTUS DATED 13 NOVEMBER 2009 Casino Guichard-Perrachon Euro 6,000,000,000 Euro Medium Term Note Programme Due from one month from the date of original
Our net revenue has also been adversely affected by the re-burden of the payroll.
 São Paulo, Brazil, May 10, 2016 Restoque Comércio e Confecções de Roupas S.A. ( Company ) (LLIS3), a leading company of premium clothing and apparel industry in Brazil, presents its results for the first
4Q17 and 2017 Earnings Release. Earnings Release 4Q17 and 2017
 4Q17 and 2017 Earnings Release Earnings Release 4Q17 and 2017 Dear Investors, In 2017, our team set audacious goals for growth, value creation, customer satisfaction and brand positioning, even in an adverse
3Q14 Earnings Conference Call
 3Q14 Earnings Conference Call 2 Group Overview CONTAX IS THE LEADING CRM BPO COMPANY IN SOUTH AMERICA Contax Group at a glance Contax Group footprint and portfolio of services Contax Group Highlights 4
Raia Drogasil S.A. Quarterly Information (ITR) at March 31, 2018 and report on review of quarterly information
 at March 31, 2018 and report on review of quarterly information") Raia Drogasil S.A. Quarterly Information (ITR) at March 31, 2018 and report on review of quarterly information Contents Company information Capital composition 1 Dividends 2 Parent company financial information
Raia Drogasil S.A. Quarterly Information (ITR) at March 31, 2018 and report on review of quarterly information Contents Company information Capital composition 1 Dividends 2 Parent company financial information
Luis Henrique. Guimarães CEO
 Luis Henrique Guimarães CEO Disclaimer This presentation contains estimates and forward-looking statements regarding our strategy and opportunities for future growth. Such information is mainly based on
Press release 8 March RESULTS
 2011 RESULTS Slight growth in sales, supported by emerging markets Current Operating Income of 2.2bn Net income, Group share, down 14%, impacted by significant one off elements Net debt reduced by more
4Q17 and 2017 Earnings Release
 4Q17 and 2017 Earnings Release Dear Investors, The Company remains focused on its strategy of growth with profitability, surpassing the mark of 208 thousand cars in fleet. In 2Q18, we maintained a strong
Financial Statements VIA VAREJO S.A.
 Financial Statements VIA VAREJO S.A. December 31, 2013 with Independent Auditors Report on the Financial Statements Financial Statements Index Independent Auditors Report on the Financial Statements 1
CENCOSUD DAY BUENOS AIRES 2016 CONSOLIDATING OUR STRATEGY
 CENCOSUD DAY BUENOS AIRES 2016 CONSOLIDATING OUR STRATEGY AGENDA 1. CENCOSUD INDICATORS 2. STRATEGIC THRUSTS AND PROGRESS OF THE LAST 12 MONTHS 3. VISION FOR THE FUTURE 4. OPPORTUNITIES PER COUNTRY 1.
1Q17 Conference Call May, Magazine Luiza
 1Q17 Conference Call May, 5 2017 Magazine Luiza 1Q17 Highlights Sales E-commerce Gross Profit Operational Expenses EBITDA Net Profit Working Capital Leverage Luizacred Sales growth of 23% reaching R$3.4
(Convenience Translation into English from the Original Previously Issued in Portuguese)
") (Convenience Translation into English from the Original Previously Issued in Portuguese) Companhia Brasileira de Distribuição Consolidated Financial Statements for the Year Ended December 31, 2014 with
(Convenience Translation into English from the Original Previously Issued in Portuguese) Companhia Brasileira de Distribuição Consolidated Financial Statements for the Year Ended December 31, 2014 with
Earnings 2015 and 4Q15
 Earnings and Fleury ON (Bovespa FLRY3) (Bloomberg FLRY3 BZ; Thomson FLRY3-BR) Debentures: BRFLRYDBS007, BRFLRYDBS015 e BRFLRYDBS023 On December 31 st : Shares Outstanding 156.293.356 shares Shares Outs
Ultrapar Participações S.A. November 2018
 Ultrapar Participações S.A. November 2018 Considerations Forward-looking statements This document may include forward-looking statements within the meaning of the safe harbor provisions of the United States
CORPORATE PRESENTATION
 CORPORATE PRESENTATION 2018 InRetail Overview Peruvian multi-format retailer, also present in Ecuador, Colombia and Bolivia through the pharma business Leading positions in Peru in its 3 segments #1 supermarket
Corporate presentation August 2018
 Corporate presentation August 2018 Agenda Overview and Strategy Financial Performance Healthcare Sector in Brazil Expansion Plan Ownership Structure and Governance 2 Agenda Overview and Strategy Financial
Earnings Release 4Q14
 Earnings Release 4Q14 Earnings 4Q14 Fleury ON (Bovespa FLRY3) (Bloomberg FLRY3 BZ; Thomson FLRY3-BR) Debentures: BRFLRYDBS007, BRFLRYDBS015 e BRFLRYDBS023 On December 31 st 2014: Shares Outstanding 156,293,356
Full Year Results 2014
 Legal disclaimer Information in this presentation may involve guidance, expectations, beliefs, plans, intentions or strategies regarding the future. These forward-looking statements involve risks and uncertainties.
3Q18 EARNINGS RELEASE. Earnings Release 3Q18 1 / 16
 EARNINGS RELEASE 3Q18 1 / 16 Monterrey, Mexico, October 25 th, 2018. Grupo Famsa, S.A.B. de C.V. (BMV: GFAMSA), a leading Mexican commercial conglomerate in the retail, consumer and savings sector, announced
A Camargo Corrêa Group company
 A Camargo Corrêa Group company Contents 100 years of Brazilian Talent Vision Growth Strategies Financial Performance 9M2007 2012 Capital Markets Why Alpargatas? SLIDE 2-55 100 years of Brazilian Talent
Press release February 28, FULL-YEAR 2017 RESULTS Recurring Operating Income of 2.0bn Free cash flow (excluding exceptional items) of 950m
 of 950m") FULL-YEAR 2017 RESULTS Recurring Operating Income of 2.0bn Free cash flow (excluding exceptional items) of 950m Slowdown in Group like-for-like sales, at +1.6% in 2017 vs. +3.0% in 2016. Recurring Operating
FULL-YEAR 2017 RESULTS Recurring Operating Income of 2.0bn Free cash flow (excluding exceptional items) of 950m Slowdown in Group like-for-like sales, at +1.6% in 2017 vs. +3.0% in 2016. Recurring Operating
Almacenes Exito. Casino s Analyst Day December 10-11, 2009
 Almacenes Exito Casino s Analyst Day December 10-11, 2009 1 Agenda Almacenes Exito in a snapshot Colombia: Macroeconomic Overview and Retail Market Our Strategy Financial Highlights Opportunities going