Sanitec Corporation Financial Statements Release "Organic growth in the fourth quarter"
|
|
|
- Noreen Stone
- 5 years ago
- Views:
Transcription


1 Sanitec Corporation Financial Statements Release 2013 "Organic growth in the fourth quarter"
2 Sanitec Corporation - Financial Statements Release 2013 Page 1 of 22 "Organic growth in the fourth quarter" Financial Statements Release 2013 Fourth quarter 2013 in brief Net sales for the fourth quarter amounted to EUR million (167.8). Comparable net sales for the fourth quarter were 1.4% higher than prior year 1). Operating profit for the fourth quarter increased to EUR 14.2 million (12.7), 8.5% (7.6) of net sales. Operating profit for the fourth quarter adjusted for items affecting comparability increased to EUR 17.9 million (16.9), 10.7% (10.0) of net sales. Profit for the fourth quarter amounted to EUR 12.1 million (18.6). Cash flow from operating activities for the fourth quarter amounted to EUR 38.3 million (28.4). During December the shares in Sanitec (SNTC) were listed on NASDAQ OMX Stockholm. Full year 2013 in brief Net sales for 2013 amounted to EUR million (752.8). Comparable net sales for the year were 3.9% lower than prior year 1). The lower sales was explained by lower volume due to still challenging macroeconomic conditions in key markets, offset by better product mix and increased average sales prices, especially for Bathroom Ceramics. Operating profit for 2013 amounted to EUR 67.9 million (73.0), 9.7% (9.7) of net sales. Operating profit for 2013 adjusted for items affecting comparability amounted to EUR 74.4 million (77.9), 10.6% (10.4) of net sales. Profit for the period amounted to EUR 42.5 million (71.7). Earnings per share, basic and diluted, were EUR 0.42 (0.72). Cash flow from operating activities for 2013 amounted to EUR 74.7 million (87.9). The Board proposes a distribution through a refund of capital of EUR 0.22 per share from the reserve for invested unrestricted equity. Key figures for the Group Q4 Q4 Change Q1-Q4 Q1-Q4 Change EUR million % % Net sales ) ) Operating profit Items affecting comparability Operating profit, adjusted Operating margin, %, adjusted EBITDA, adjusted EBITDA margin, %, adjusted Profit before taxes Profit for the period Cash flow from operating activities Return on capital employed (ROCE), % rolling 12 months Net debt Net debt / EBITDA, adjusted Earnings per share, EUR Average number of employees 6,516 7,004 1) Calculated for comparable legal structure and in constant currency, i.e. organic change For definitions see page 22

3 Sanitec Corporation - Financial Statements Release 2013 Page 2 of 22 Comments by the President & CEO though there was a clear improvement in relative performance quarter by quarter. Naturally, it is extremely satisfying to be able to announce a quarter with organic growth for the first time since the second quarter However, the most important is that we continue to defend or strengthen our market positions in all our key markets and main product categories. Lower sales volumes during the year were offset by an improved product and market mix, higher average selling prices and continued increased productivity in the supply chain. This is also the result of enhanced efficiency in all functions and processes as well as a clear signal that we are utilising our strength by acting as one cohesive company One Sanitec. Successful stock exchange listing First and foremost, I would like to take this opportunity to welcome all new shareholders in Sanitec. As a company Sanitec is relatively unknown to the general public, despite our leading position in Europe and a unique portfolio of strong brands. Therefore, I view the listing as a crucial milestone that introduces Sanitec and our extensive product offering to an increasing audience. Cautious recovery Since the second quarter of 2013 we have noted stabilisation in the European economy and certain indications of a recovery. This view was strengthened slightly in the fourth quarter, although substantial variation exists between individual countries. Positive items from our perspective include the market trend in Central Europe and a healthy development in Germany with a 4% increase in planning consents in 2013 as well as a 2% increase in the sanitary fittings wholesale sector. Improved market conditions and increasing housing starts were also noted in the UK. In Eastern Europe we are still battling a challenging macroeconomic climate and, in some countries, political turbulence that significantly impacts construction and renovation activity in the short term. In addition, it is a general concern that the building supplies market in Russia could be negatively impacted following the major investments made in conjunction with the Olympic Games in Sochi. However, we are well positioned in our main markets with strong local brands and have a modern and efficient production network, which allows us to look confidently to the future. Growth in the fourth quarter Our net sales posted an increase of 1.4% in the fourth quarter (calculated in constant currency and comparable group structure). For the full year, the same figure posted a 3.9% decline even Innovation and design In the innovation area, we focus at four different main themes hygiene, environment, design and installation concepts for the trade market. The aim of the latter is to facilitate cooperation and strengthen the relationship with the 50,000 plumbers and installers that we work with around Europe. Over the past few years we have made significant investments in our production network as well as in innovation and design. Among other things, this has resulted in the successful introduction of our prize-winning Rimfree toilet. The launch is ongoing in many countries and has been received positively and with increasing visibility in showrooms. In Central Eastern Europe we launched two strategic product ranges at the end of last year the Traffic ceramic collection and Technic GT pre-wall line. Both ranges offer new unique functional features. Product presentations and trainings as well as displays in showrooms represented key actions to drive sales and synergy between the Bathroom Ceramics and Ceramics Complementary Products. In the UK Twyford will launch its Energy Collection in May 2014 the largest launch in the local market in three years. Favourable positioning Sanitec has a leading position in Europe with strong and wellestablished local brands, a healthy geographic spread and a modern, efficient and flexible production network. Together, this means that we are well positioned to be able to benefit from the recovery in volumes when the macroeconomic conditions improve. Our assessment is that the current market conditions will continue for the first half of the year, however, with a fair degree of variation between countries and market areas. Our high level of efficiency and our strong cash flow, despite the macroeconomic conditions, demonstrate the strength of One Sanitec a strategy to create a more integrated and efficient company. Peter Nilsson
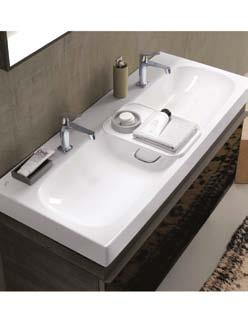
4 Sanitec Corporation - Financial Statements Release 2013 Page 3 of 22 Net sales Net sales for the fourth quarter amounted to EUR million (167.8). Comparable net sales for the quarter were 1.4% higher than prior year due to strong development in Central Europe region and the UK. The impact of net foreign exchange rates in the quarter was EUR 2.7 million negative compared with prior year. Quarterly net sales EUR million Net sales for Ceramics Complementary Products in the fourth quarter amounted to EUR 41.7 million (41.9). Net sales for Ceramics Complementary Products for 2013 amounted to EUR million (196.4). From the decline of 14% compared with prior year the majority is explained by the disposal of the French shower business Leda in October Quarterly net sales by region EUR million Sanitec is the leading bathroom ceramics specialist with a unique pan- European brand portfolio of locally well-established brands. Net sales Central Europe East Europe United Kingdom & Ireland North Europe South Europe Rest of the World Net sales for 2013 amounted to EUR million (752.8). The decline was mainly related to lower volumes due to continued challenging economic environment resulting in moderate development of new construction, renovation and rebuilding. Net sales were also reduced due to the disposal of Sanitec s former shower business in France in October Average sales prices improved during the year following an improved product and country mix and effects of price increases. The impact of net foreign exchange rates on net sales for 2013 was EUR 5.0 million negative or -0.7 percentage compared to prior year. Quarterly net sales by product area EUR million Bathroom Ceramics Ceramics Complementary Products Net sales for Bathroom Ceramics in the fourth quarter amounted to EUR million (125.9). In certain markets the renewal of the product assortment that started in 2012 has continued with new product introductions and discontinuation of sales of nonprofitable products. Although the volumes for the fourth quarter of 2013 were lower than in 2012, the average sales prices improved from the same period prior year. Net sales for Bathroom Ceramics for the full year amounted to EUR million (556.4). Net sales for Central Europe region for the fourth quarter increased to EUR 50.6 million (49.4). Strong sales in Germany, following increased new housing permissions and improved activity in the sanitary fittings wholesale sector, offset the reduction in sales in the Benelux countries. Cumulative net sales for year 2013 for Central Europe region amounted to EUR million (215.2). Net sales for North Europe region in the fourth quarter amounted to EUR 43.3 million (45.1). The 4% decline in North Europe sales during the quarter was mostly due to continued lower activity in Sweden after a strong second quarter and moderation in the Norwegian and Finnish markets, while the Danish markets showed positive signs. Net sales for North Europe region for 2013 amounted to EUR million (186.2). Net sales for East Europe region in the fourth quarter amounted to EUR 27.9 million (29.5). In East Europe the 5% decline was mainly due to continued challenging economic environment and political turbulence in the Ukrainian market that impact building and renovation activities. Net sales for East Europe region for the full year amounted to EUR million (128.7), a decline with 12%. During the fourth quarter net sales for South Europe region amounted to EUR 25.4 million (26.7). The decrease is mainly explained by continued weak markets in Italy and France. Net sales for the full year for South Europe region amounted to EUR million (145.5). A substantial part of the decline in sales is explained by the disposal of Leda S.A.S in October Excluding the effects of the divestment the decline in net sales was -7.0%.
5 Sanitec Corporation - Financial Statements Release 2013 Page 4 of 22 Sanitec's strategic brands and market position 2012 Clear number 1 Number 1 or 2 Number 3 or 4 Number 4 or lower In United Kingdom & Ireland region the market continued to show signs of recovery during the fourth quarter and net sales increased by 14% versus prior year, and amounted to EUR 13.8 million (12.1). Net sales for United Kingdom & Ireland region for the full year were EUR 51.6 million (54.4). Operating profit The fourth quarter operating profit increased to EUR 14.2 million compared with EUR 12.7 million in the previous year. The impact of net foreign exchange rates was EUR 0.3 million negative compared with prior year. Operating margin for the fourth quarter adjusted for items affecting comparability amounted to 10.7% (10.0). The lower sales volumes were compensated by better sales mix and improved average sales prices. Furthermore, more efficient sourcing, lower costs due to previously implemented actions to adjust the organisation to present market conditions and well Quarterly operating profit and operating profit margin managed manufacturing efficiency during the period supported the improved performance. Operating profit for the full year amounted to EUR 67.9 million (73.0). Adjusted operating profit for the full year amounted to EUR 74.4 million (77.9). Adjusted operating margin for the period amounted to 10.6% (10.4). The impact for 2013 of net foreign exchange rates was EUR 0.4 million negative compared with prior year. Profit for the period and earnings per share The net financial income and expenses amounted to EUR -5.8 million for the fourth quarter (-2.0) of which EUR -3.2 million (-1.9) is interest expenses on borrowings. The remaining amount relates mainly to net of foreign exchange differences. The net financial income and expenses amounted to EUR million for the full year (-6.0) of which EUR million is interest expenses on borrowings Quarterly operating profit and operating profit margin, adjusted EUR million % EUR million % % % 15 8 % 15 8 % 10 5 % 10 5 % 5 3 % 5 3 % 0 0 % 0 0 % Operating profit Operating profit margin, % Operating profit, adjusted Operating profit margin, adjusted, %
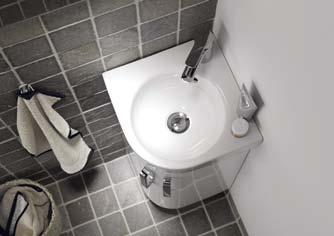
6 Sanitec Corporation - Financial Statements Release 2013 Page 5 of 22 (-8.5). This increase in interest expenses is due to the refinancing which took place in May Other net financial income and expenses amounted to EUR -8.2 million (2.5). The majority of this is due to that there were net foreign exchange gains of EUR 3.2 million in 2012, while there were net foreign exchange losses of EUR 3.8 million in Profit before taxes for the fourth quarter was EUR 8.4 million (10.7) and EUR 48.2 million (67.0) for the full year period. The change in income taxes compared with the previous year was EUR million. The change is primarily due to increase in income taxes for the financial period by EUR -4.0 million from 2012, which relates mainly to increased income taxes in Germany compared to In addition, 2012 income taxes from prior periods included a reversal of tax provision amounting to EUR 4.1 million related to German tax audit. Profit for the fourth quarter was EUR 12.1 million (18.6) and for the full year EUR 42.5 million (71.7). Earnings per share for the fourth quarter, basic and diluted, were EUR 0.12 (0.19) and for the full year EUR 0.42 (0.72). Cash flow Cash flow from operating activities amounted to EUR 38.3 million (28.4) during fourth quarter. Compared to previous year the variance is mainly due to better performance, EUR 27.3 million versus EUR 19.1 million previous year, as 2013 cash flow includes the EUR 7.1 million refund of EU fine, and lower paid income taxes, EUR 3.1 million versus EUR 9.7 million. This was partially offset by less cash generation from working capital, EUR 19.2 million versus 20.4 million. Cash flow from operating activities for full year 2013 amounted to EUR 74.7 million versus 87.9 million previous year. The decrease in cash flow from operating activities is mainly due to lower improvement in working capital of EUR -1.0 million (7.5). During a financial year the business normally ties up cash in working capital during the first half year and releases cash during the second half. This trend was confirmed again this year and Sanitec generated the same amount of cash during the second half of 2013 as in Cash conversion ratio at year-end 2013 was 82% (88), which is another year of meeting the long-term financial target. Cash flow from investing activities in the fourth quarter amounted to EUR -7.4 million (-3.4) which is primarily customary maintenance investments of property, plant and equipment in the ceramic production. Cash flow from investing activities for the full year 2013 amounted to EUR million (-11.4). Cash flow from financing activities during fourth quarter amounted to EUR -1.4 million (-5.8) and for the full year 2013 the amount was EUR million (-21.8). The negative cash flow from financing activities in 2013 is mainly related to the refinancing which took place in the second quarter and repayment of external Ukrainian loans in the third quarter. The refinancing also included a refund of capital amounting to EUR million. Quarterly cash conversion 100 % 90 % 80 % 70 % 60 % 50 % 40 % Cash conversion Long-term target Gross capital expenditure, depreciation, amortisation and impairment Gross capital expenditure for the fourth quarter amounted to EUR 8.4 million (5.1). The increase is primarily related to higher ceramic production investments which are customary maintenance investments to maintain and improve the manufacturing footprint. The gross capital expenditure for the full year 2013 amounted to EUR 19.3 million (13.1). All capital expenditure during the year has been financed by cash flow from operations. Capital expenditure corresponded in 2013 to 2.8% (1.7) of net sales. Depreciation, amortisation and impairment losses amounted 2013 to EUR million (-29.7) corresponding to 4.1% of net sales (3.9). Financial position and liquidity Cash and cash equivalents amounted to EUR 99.4 million (215.7) at the end of the year. In addition, Sanitec has an unused committed revolving credit facility of EUR 50 million. Sanitec s primary source of external funding is EUR 250 million senior secured floating rate notes, which were issued in May At the same time, a EUR 50 million super senior revolving credit facility was put in place. The floating rate notes bear an interest of 4.75% over three months euribor and they are due in Net debt, calculated from the nominal value of the loans, amounted to EUR million (-42.9). Net debt to adjusted EBITDA was 1.5 (-0.4) at the end of the year, which is a comfortable headroom to maximum leverage long-term financial target of 2.5. The increase in net debt compared to beginning of the year, EUR Sanitec offers a complete range of products; from traditional to contemporary and from economy to luxury segments.

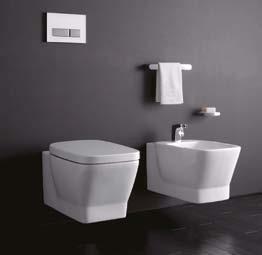
7 Sanitec Corporation - Financial Statements Release 2013 Page 6 of million, is mainly due to refund of capital from the reserve of invested unrestricted equity which was done as part of the refinancing activities in May At the end of the year 2013 total equity amounted to EUR 44.4 million (243.7). The equity ratio decreased during 2013 to 8.4% (37.1), which is explained by the refinancing arrangements in May Research and development Sanitec s research and development activities focus mainly on certain areas: environment, ease of installation, integrated and appealing design as well as the development of new products. In 2012, Sanitec consolidated its innovation and design, and technical product development efforts by coordinating these activities on Group level. As of 31 December 2013, 181 (160) of the employees (FTEs) were directly involved in this function. Research and development expenses amounted in 2013 to EUR 9.6 million (8.3), 1.4% (1.1) of net sales. Personnel The number of employees was 6,211 (6,688) at the end of the year. The reduction is due to continuous efficiency improvements in the manufacturing footprint, mainly related to East Europe region, and additional effects from activities. Long-term financial targets New long-term financial targets were set by the Board of Directors during the fourth quarter. Growth above market Sanitec s target is to keep achieving annual organic growth that is on average 2 p.p. higher than its core market growth. Additionally Sanitec aims opportunistically at growth through complementary acquisitions to enter new growth markets and/or to add complementary products in existing markets. Operating margin Sanitec s target is to achieve an adjusted operating margin (EBIT) at or above 12% over a business cycle. Cash conversion Sanitec s target is to achieve an annual cash conversion above 70% over a business cycle. Cash conversion is the ratio of operating cash flow defined as adjusted EBITDA less paid investments in intangible and tangible assets to adjusted EBITDA. Net debt / EBITDA Sanitec s target is to have a net debt in relation to adjusted EBITDA below 2.5. The capital structure should enable flexibility and allow the company to capture strategic opportunities while maintaining a sound financial position even when the market conditions are less favourable. Shares and share capital Sanitec Corporation s paid and registered share capital on 31 December 2013 was EUR 2.8 million and the number of issued and registered shares totalled 100,000,000. The number of issued shares was increased from 1,000,000 to 100,000,000 shares in November 2013 by issuance of 99,000,000 new shares without consideration. The company has one series of shares. Every share that the company does not hold itself entitles its owner to one vote at a General Meeting of Shareholders. The share has no nominal value. The counter book value of each registered share is EUR Sanitec s share ("SNTC") was listed on NASDAQ OMX Stockholm, Mid Cap segment, on 10 December The share is traded in Swedish krona (SEK). On 31 December 2013, the market capitalisation of the company s registered shares was EUR million (SEK 6,750.0 million). During 2013, approximately 20 million of the company s shares were traded, i.e. around 20% of the average number of registered shares. The closing price per share on 31 December 2013 was EUR 7.62 (SEK 67.50). The share price has been converted to euro using the closing rate of the period. The total number of shareholders at end of the period was 2,139. Litigation Sanitec is involved in and exposed to various legal actions or claims and other legal and administrative, including tax and environmental, investigations and proceedings that arise out of or are incidental to the ordinary course of its business. It is Sanitec s policy to provide for amounts related to the proceedings if liability is probable and amount thereof can be estimated with a reasonable certainty. Please see further details on page 18. New member of Board of Directors Effective 29 October 2013, Margareta Lehmann was elected as a new member of the Board of Directors of Sanitec Corporation. Margareta Lehmann is the President for SCA Incontinence Care Europe since 2012 with previous positions in different areas within SCA and Mölnlycke. Lehmann has a Bachelor s degree in Economics and Business Management. Risks and business uncertainties As a group operating on an international field, Sanitec is exposed to different business and financial risks. The business risks can be described as market, operational Sanitec is an integrated, pan- European company with long experience in bathroom ceramics.

8 Sanitec Corporation - Financial Statements Release 2013 Page 7 of 22 and legal risks. The financial risks are related to change in currency rates, interest rates, liquidity and funding capability. Risk management actions in Sanitec are focused on identifying the controllable risks and reducing risks related to the business. The basis for the management of risks is focusing on evaluating the probability for risks to occur and the potential impact on the Group. Compared to what was reported in the Annual Report for 2012, there has not been any material change in risks facing Sanitec Group, except for the development in the Ukraine. Events after the reporting date Sanitec received an offer in October 2013 from HLD Group to acquire 100% of the shares in the French ceramic kitchen sinks business Alliages Céramiques S.A.S. After evaluation of the offer in 2014, the transaction was not finalised. Annual General Meeting Sanitec Corporation's Annual General Meeting 2014 will be held in Stockholm on 13 May Any shareholders wishing to submit proposals for the members of the Board of Directors to be elected by the Annual General Meeting can contact Caspar Callerström by (caspar.callerstrom@eqt.se). Further details will be made available in due course before the Annual General Meeting. Dividend and distribution of funds Sanitec Corporation's, the parent company of Sanitec Group, distributable funds are EUR 374,024, The Board of Directors proposes to the Annual General Meeting that no dividend be distributed from the result for the year nor from retained earnings, and that EUR 22,000,000, i.e. EUR 0.22 per share, is paid as refund of capital from the reserve for invested unrestricted equity, which corresponds to 29% of cash flow from operating activities per share. Outlook for 2014 Since the second quarter of 2013 there has been a stabilisation and signs of recovery in the European economy, and this trend has enhanced slightly in the fourth quarter. Sanitec expects the macroeconomics and general market conditions to remain relatively stable in the Nordic countries, the UK and Central Europe through 2014 and the moderate positive trend experienced during second half of 2013 to continue. In Southern Europe market conditions are expected to remain challenging in the short term and Sanitec will continue to focus on efficiency improvements and implementation of "profit over volumes" throughout the region in The unstable political situation in Ukraine can as such have adverse effect on local Ukrainian market and neighbouring markets during The political turmoil and unrest is not, however, expected to have adverse effect directly on operations of the Ukrainian production facilities. Sanitec expects that the construction and renovation markets will continue to follow the main macroeconomic trends and allow Sanitec to benefit eventually, if materialised, from moderate increase in demand in public and private sectors and to continue to defend or improve its market positions with the support of modern, efficient and flexible production network and new products launched in 2013 and Helsinki, 19 February 2014 Board of Directors
9 Sanitec Corporation - Financial Statements Release 2013 Page 8 of 22 Conference call for investors An investor conference call in English will be held on 19 February 2014 at 10:00 CET/11:00 EET. President & CEO Peter Nilsson and CFO Gun Nilsson will present the financial results and answer questions. Related presentation material will be available at the corporate website before the start of the conference call. For further details, please refer to the invitation published at the corporate website For additional information, please contact: Niklas Alm Head of Investor Relations ir@sanitec.com mob Noora Koikkalainen Head of Corporate Communications sanitec.corporation@sanitec.com tel , mob Financial calendar Annual Report and Corporate Governance Statement 2013: End of March 2014 Interim Report January-March 2014: 13 May 2014 Annual General Meeting 2014: 13 May 2014 Interim Report January-June 2014: 18 July 2014 Interim Report January-September 2014: 24 October 2014 About Sanitec Sanitec is the market leader in bathroom ceramics and a leading supplier of bathroom fixtures in the Company s core markets with a unique portfolio of locally well-established brands. Sanitec has longstanding and stable relationships with customers, installers and other industrial partners, and develops sustainable and complete bathroom concepts including bathroom ceramics, furniture, pre-wall flushing solutions, taps and mixers, as well as baths and showers. Sanitec s brands and products represent a high level of innovation and quality, as well as advanced design that is both functional and attractive. Sanitec operates an integrated organisation with an unparalleled local presence to provide the best value to its customers when it comes to bathroom products. In 2013 net sales amounted to EUR 702 million, and currently Sanitec employs approximately 6,200 people working in 18 European based production plants and at the Company s sales, product management and design and other support offices. Sanitec s head office is located in Helsinki, Finland. The shares in Sanitec Corporation are admitted on trading on NASDAQ OMX Stockholm under the symbol SNTC. For more information about Sanitec, please visit
10 Sanitec Corporation - Financial Statements Release 2013 Page 9 of 22 CONDENSED CONSOLIDATED STATEMENT OF PROFIT OR LOSS 1 October - 31 December 1 January - 31 December EUR million NET SALES Other operating income Materials and services Employee benefits Other operating expenses Depreciation, amortisation and impairment losses OPERATING PROFIT Financial income and expenses PROFIT BEFORE TAXES Income taxes PROFIT FOR THE PERIOD Net profit for the period attributable to: Owners of the parent Non-controlling interest TOTAL Earnings per share, basic and diluted, EUR STATEMENT OF OTHER COMPREHENSIVE INCOME 1 October- 31 December 1 January - 31 December EUR million Profit for the period Items that will not be reclassified subsequently to profit or loss: Remeasurements of defined benefit plans Income tax relating to items that will not be reclassified Other restatements Total Items that may be reclassified subsequently to profit or loss: Cash flow hedges Exchange rate differences Income tax relating to items that may be reclassified Total Total comprehensive income Comprehensive income for the period attributable to: Owners of the parent Non-controlling interest Total
11 Sanitec Corporation - Financial Statements Release 2013 Page 10 of 22 CONSOLIDATED STATEMENT OF FINANCIAL POSITION EUR million 31 December December January 2012 ASSETS restated restated Non-current assets Intangible assets Property, plant and equipment Long-term investments Deferred tax assets Interest-bearing receivables Defined benefit assets Total non-current assets Current assets Inventories Other current receivables *) Assets for current tax Cash and cash equivalents Total current assets TOTAL ASSETS EQUITY AND LIABILITIES Equity Share capital Share premium Fair value reserve Reserve for invested unrestricted equity Exchange differences Retained earnings Total equity attributable to owners of the parent Non-controlling interests Total equity Non-current liabilities Deferred tax liabilities Defined benefit obligations Provisions Interest-bearing liabilities Total non-current liabilities Current liabilities Interest-bearing liabilities Provisions Other current liabilities Liabilities for current tax Total current liabilities TOTAL EQUITY AND LIABILITIES *) Other current receivables include assets held for sale of EUR 0.0 million consisting of Sanitec s remaining share in a former subsidiary (Ifö Sanitär Eesti AS). Sanitec has a binding agreement to sell the remaining holding in the company. The remaining share ownership has no material value.
12 Sanitec Corporation - Financial Statements Release 2013 Page 11 of 22 CONSOLIDATED STATEMENT OF CHANGES IN EQUITY Share capital Share premium Fair value reserve Reserve for invested unrestricted equity Exchange differences Retained earnings Total Noncontrolling interests Total equity EUR million Equity at 1 January Total other comprehensive income Profit for the period Total comprehensive income Change in non-controlling interest Equity at 31 December Total other comprehensive income Profit for the period Total comprehensive income Change in non-controlling interest Reclassification Refund of capital from reserve for invested unrestricted equity Equity at 31 December
13 Sanitec Corporation - Financial Statements Release 2013 Page 12 of 22 CONSOLIDATED STATEMENT OF CASH FLOWS 1 October - 31 December 1 January - 31 December EUR million CASH FLOW FROM OPERATING ACTIVITIES: Profit before income taxes Adjustments: Depreciation, amortisation and impairment losses Unrealised foreign exchange gains and losses Other non-cash income and expenses Financial income and expenses Cash flow before working capital changes Change in the working capital: Change in non-interest-bearing receivables Change in inventories Change in non-interest-bearing liabilities Cash flow from change in working capital Interest expenses paid and other financial items paid (-) / received (+) Interest income received Income taxes paid (-) / received (+) CASH FLOW FROM OPERATING ACTIVITIES CASH FLOW FROM INVESTING ACTIVITIES: Investments in intangible assets and property, plant and equipment Investments in subsidiaries Proceeds from disposal of intangible assets and property, plant and equipment Proceeds from disposal of subsidiaries CASH FLOW FROM INVESTING ACTIVITIES CASH FLOW FROM FINANCING ACTIVITIES: Refund of capital from reserve for invested unrestricted equity Increase (-) / decrease (+) in interest-bearing receivables Draw down (+) / repayment (-) of current interest-bearing liabilities Draw down (+) of non-current interest-bearing liabilities Repayment (-) of non-current interest-bearing liabilities CASH FLOW FROM FINANCING ACTIVITIES CHANGE IN CASH AND CASH EQUIVALENTS Cash and cash equivalents at the beginning of the period Effect of exchange rate differences on cash and cash equivalents Change in cash and cash equivalents Cash and cash equivalents at the end of the period
14 Sanitec Corporation - Financial Statements Release 2013 Page 13 of 22 Condensed notes to the financial statements General information Sanitec Corporation and its subsidiaries form a multinational group ( Sanitec or the Group ) engaged in designing, manufacturing and marketing of bathroom ceramics, bath and shower products and bathroom furniture. The Group s production plants are located in Europe and the sales and marketing network extends globally. Sanitec Corporation is a public limited company and it is domiciled in Helsinki, Finland. The address of Group Head Office is Kaupintie 2, Helsinki, Finland. This financial statements release is unaudited. Financial statements for 2013 are audited. Accounting policies The consolidated financial statements of Sanitec Group are prepared in accordance with International Financial Reporting Standards (IFRS), including International Accounting Standards (IAS) and Interpretations issued by the IFRS Interpretations Committee (SIC and IFRIC). International Financial Reporting Standards are standards and their interpretations adopted in accordance with the procedure laid down in regulation (EC) No 1606/2002 of the European Parliament and of the Council. The Notes to the Financial Statements are also in accordance with the Finnish Accounting Act and Ordinance and the Finnish Limited Liability Companies Act. These condensed consolidated financial statements have been prepared in accordance with International Financial Reporting Standard IAS 34 Interim Reporting as approved by the European Union. They do not include all the information required for full annual financial statements. The presentation of consolidated financial statements is in millions of euro. As a result of rounding differences, the figures presented in the tables may not add up to the total. New accounting principles Material accounting policies and valuation principles are those of the consolidated financial statements for the financial year ended 31 December 2012, save for the new IFRS accounting policies applied since 1 January 2013 as described in the following. Sanitec applies the Revised IAS 1 Presentation of Financial Statements in which items of other comprehensive income that will not be reclassified to profit or loss and items that may be subsequently reclassified to profit or loss are shown separately. Sanitec also applies the amended IAS 19 Employee Benefits standard. The standard includes the discontinuation of the corridor method for recognising defined benefit plans and a changed actuarial method for calculating the return on plan assets. The comparative information has been restated to reflect the impact of the amended IAS 19 standard, but the impact from the restatement was not significant, mainly due to the fact that Sanitec has not applied the corridor method previously and most of the defined benefit plans do not include plan assets. The amendment of IAS19 has only affected reclassification between items presented in the statement of financial position. Sanitec Group will apply the following new, revised or amended standards and interpretations as from 1 January 2014: IFRS 10 Consolidated Financial Statements. The new standard is effective in the European Union for financial years beginning on or after 1 January, The standard revises and clarifies definition of control. The new standard has not material effect on Sanitec. IFRS 12 Disclosure of Interests in Other Entities. The new standard is effective in the European Union for financial years beginning on or after 1 January, The standard increases disclosure requirements for all forms of interests in other entities, including subsidiaries, joint arrangements, associates and structured entities that are not controlled by the entity. The new standard increases the disclosure information in consolidated financial statements of Sanitec. Amendment to IAS 32 Financial Instruments: Presentation. The amended standard is effective for financial years beginning on or after 1 January, Amendments clarify some of the requirements for offsetting financial assets and financial liabilities in the statement of financial position. The amended standard has no material effect on Sanitec. Amendment to IAS 36 Impairment of Assets. The amendment is effective for financial years beginning on or after January 1, The amendment clarifies the disclosure requirements in respect of the recoverable amout based on fair value less costs of disposal. The amended standard has no material effect on Sanitec. Amendment to IAS 39 Financial Instruments: Recognition and Measurement. The amendment is effective for financial years beginning on or after 1 January, The amendment provides an exception to the requirement to discontinue hedge accounting in certain circumstances in which there is a change in the counterparty to a hedging instrument in order to achieve clearing for that instrument. The amended standard has no material effect on Sanitec. IFRIC 21 Levies. The new interpretation is effective for financial years beginning on or after 1 January, The interpretation is applicable to all levies other than outflows that are in scope of other standards and fines or other penalties for breaches of legislation. The interpretation clarifies the recognition of levies in the statement of financial position. The application of the new interpretation does not change the recognition of levies in Sanitec. Other new, revised or amended standards or interpretations have no effect or no material effect on Sanitec s consolidated financial statements.
15 Sanitec Corporation - Financial Statements Release 2013 Page 14 of 22 Intangible assets and property, plant and equipment December December EUR million Intangible assets Carrying amount on 1 January Changes in exchange rates Additions Amortisation and impairment Disposals and reclassifications Carrying amount at the end of the period December December EUR million Property, plant and equipment Carrying amount on 1 January Changes in exchange rates Additions Depreciation and impairment Disposals and reclassifications Carrying amount at the end of the period Gross capital expenditure 1 January - 31 December 1 January - 31 December EUR million Intangible and tangible assets Total Items affecting comparability 1 October - 31 December 1 January - 31 December EUR million Other non-recurring costs Divested businesses Restructuring costs EC fine and related legal fees Total Sanitec includes in items affecting comparability mainly items arising from restructuring, structural changes, such as losses and gains on divestments of businesses, costs for executive management dismissals, costs related to the EU cartel fine as well as other costs considered to be non-recurring, such as costs for listing on NASDAQ OMX Stockholm. Items affecting comparability include in January - December 2013 impairment losses and reversals of impairment losses of property, plant and equipment and intangible assets totalling to EUR -0.5 million. The corresponding amount in the fourth quarter of 2013 was EUR +2.0 million.
16 Sanitec Corporation - Financial Statements Release 2013 Page 15 of 22 Interest-bearing liabilities December December EUR million Non-current interest-bearing liabilities Senior secured floating rate notes Related party loans Other interest-bearing liabilities Total Current interest-bearing liabilities Loans from financial institutions Other interest-bearing liabilities Total Total interest-bearing liabilities Senior secured floating rate notes, with nominal value of EUR 250 million and maturity date in May 2018, were issued in May The notes bear an interest margin of 4.75% over 3-month euribor. Their carrying amount in the statement of financial position has been adjusted with the transaction costs related to the issuance of the notes. The costs are amortised over the loan period with effective interest rate method. The floating rate notes are listed in the Luxembourg Stock Exchange and traded on the Euro MTF Market. Related party loans, taken from Sanitec Corporation s parent company Sofia IV S.à r.l. (parent company before listing in December 2013), were prepaid in connection with the refinancing in May The refinancing also led to the prepayment of all of the senior facility loans and cancellation of the EUR 50 million revolving facility agreement of Sofia III S.à r.l., which is the parent company of Sofia IV S.à r.l.. The senior facility agreement and revolving credit facility agreement were contractually tied to the related party loans imposing certain restrictions to Sanitec Group, including but not limited to, financial covenants. Following the prepayment and cancellation of the loans of Sofia III those contractual ties and restrictions no longer exist, and similarly also there is no longer access by Sanitec Group to that revolving credit facility. In connection with the refinancing in May 2013 a new committed super senior revolving credit facility agreement of EUR 50 million, with maturity date in January 2018, was concluded by Sanitec. This facility was undrawn as of 31 December The facility includes a financial covenant on maximum leverage. At the end of 2013, other interest-bearing liabilities consisted of minor local loans. Previously the loans from financial institutions included the loans taken by the Ukrainian subsidiary PJSC Slavuta Plant Budfarfor. These loans were prepaid during the third quarter of These Ukrainian loans were classified as current liabilities at year end 2012 as some financial covenants of those loans were not met and the waiver on the covenant breaches was received only in the second quarter of An overdraft facility of EUR 0.5 million of PJSC Slavuta Plant Budfarfor was terminated during the fourth quarter of 2013.
17 Sanitec Corporation - Financial Statements Release 2013 Page 16 of 22 Fair and nominal values of derivative instruments Sanitec Group commenced in the first quarter of 2012 hedging of major net operating cash flow positions denominated in foreign currencies other than local home currencies. The instruments used in hedging are currency forward contracts and swaps. Sanitec applies hedge accounting for its cash flow and fair value hedges. The fair values of derivatives are determined by using market prices and generally available valuation models. The data and assumptions used in valuation models are based on verifiable market prices. All foreign currency derivatives are categorised on level 2 when using fair value hierarchy. In the Group the applied principle is that transfers between levels of fair value hierarchy are recognised on the date on which the event triggering the transfer has occurred. No transfers between levels occurred during the reporting period December December EUR million Positive Currency forward contracts and currency swaps Fair value Nominal value Negative Currency forward contracts and currency swaps Fair value Nominal value Related party information Related parties of Sanitec Group include the parent, Sanitec Corporation, and all Sanitec group companies, the members of the Board of Directors of Sanitec Corporation, their close members of family as well as their controlled entities, members of the Top Management Team and their close members of family as well as their controlled entities, and shareholders having significant influence over Sanitec through ownership. Sofia IV S.à r.l., which was the parent of the Group before Sanitec s listing to NASDAQ OMX Stockholm, still owns 40% of the shares and votes in Sanitec and is thus considered to be a related party to Sanitec. Sanitec prepaid the related party loans amounting to EUR million to the former parent, Sofia IV S.à r.l., in the second quarter of The loans were paid in full. Interest paid in cash in January - December amounted to EUR 1.9 million (6.2), excluding withholding taxes. On 31 December 2013, the Group had EUR 0.1 million receivables from related parties. Market prices have been used in transactions with related parties. Information regarding members of the Board of Directors and Top Management Team is included in the consolidated financial statements of Sanitec.
18 Sanitec Corporation - Financial Statements Release 2013 Page 17 of 22 Commitments and contingent liabilities The Group had the following commitments and contingent liabilities: December December EUR million Operating lease commitments Within one year Between one and five years After five years Total operating lease commitments Guarantees, mortgages, and pledged assets Mortgages On behalf of own commitments Carrying amount of pledged assets On behalf of own commitments Total Guarantees and other commitments Other commitments On behalf of own commitments Guarantees On behalf of own commitments On behalf of others Total Total guarantees, mortgages, and pledged assets 1) ) This table does not include the value of guarantees, mortgages, liens on chattel and pledged assets that secure loans. The nominal value of all collateral granted by the Group exceeds the combined carrying amount of the loans for which they have been given as a security. In connection with the refinancing which took place in May 2013, the main pledges, mortgages and guarantees of the Group were replaced and renewed. Prior to the refinancing substantially all of the assets of the Group were pledged on behalf of the loans taken by Sanitec s former indirect parent Sofia III S.à r.l.. Following the refinancing similar securities have now been given on own behalf to secure the issued EUR 250 million senior secured floating rate notes and the new EUR 50 million undrawn super senior revolving credit facility. First ranking guarantees and security pledge over the assets of Sanitec Corporation and certain of the Group subsidiaries have been granted as collateral for the senior secured floating rate notes and the super senior revolving credit facility. As of 31 December 2013 the majority of Sanitec Group s property, plant and equipment, major brands, shares in key subsidiaries, receivables, inventory and bank accounts are pledged. The pledge includes also real estate mortgages of Sanitec Kolo Sp.z o.o (Poland), Sanitec Europe Oy (Finland), Ifö Sanitär Aktiebolag (Sweden) and PJSC Slavuta Plant Budfarfor (Ukraine) for their real estates. The nominal value of all collateral granted by the Group exceeds the combined carrying amount of the loans for which they have been given as a security. During the third quarter of 2013, the loans from financial institutions taken by PJSC Slavuta Plant Budfarfor, a Ukrainian subsidiary of Sanitec, were prepaid. In connection with the prepayments the related collaterals were released. The collateral securing the loans prepaid by PJSC Slavuta Plant Budfarfor consisted of certain assets of PJSC Slavuta Plant Budfarfor, including real estate mortgages. In addition, PJSC Slavuta Plant Budfarfor s parent Slavuta Holding LLC had guaranteed the local credit facility and pledged the shares of PJSC Slavuta Plant Budfarfor. Following the refinancing similar securities have been given during the fourth quarter of 2013 on behalf of Sanitec Group to secure the issued EUR 250 million senior secured floating rate notes and the super senior revolving credit facility. An EUR 0.5 million Ukrainian overdraft facility was terminated by Sanitec during the fourth quarter of The related inventory pledge with value of EUR 0.7 million was released in connection with the termination of the facility. Total secured loans of PJSC Slavuta Plant Budfarfor amounted to EUR 24.1 million at the end of As of 31 December 2013, the Group has in addition some other commitments including a contractual commitment in Ukraine totaling to EUR 2.6 million for acquisition of property, plant and equipment relating to leased assets.
Interim Report for Sanitec Corporation January March 2013
 Interim Report for Sanitec Corporation January March Net sales for the first quarter amounted to EUR 176.8 million (202.2). Comparable net sales for prior year amounted to EUR 195.9 million, against which
METSÄ BOARD CORPORATION INTERIM REPORT Q2/2015
 Page 1/29 METSÄ BOARD CORPORATION INTERIM REPORT Q2/2015 Page 2/29 METSÄ BOARD CORPORATION S OPERATING RESULT EXCLUDING NON-RECURRING ITEMS FOR THE FIRST HALF OF 2015 WAS EUR 90.2 MILLION RESULT FOR THE
Continued margin improvements (All figures in brackets refer to the corresponding period in 2009)
") Continued margin improvements (All figures in brackets refer to the corresponding period in 2009) Sales for the third quarter amounted to SEK 3,228 million (3,568). Organic growth was negative 1 per cent.
Continued margin improvements (All figures in brackets refer to the corresponding period in 2009) Sales for the third quarter amounted to SEK 3,228 million (3,568). Organic growth was negative 1 per cent.
1. Consolidated balance sheet Inventories Consolidated income statement Consolidated statement of comprehensive income 50
 1. Consolidated balance sheet 48 12. Inventories 63 2. Consolidated income statement 49 13. Trade receivables 63 3. Consolidated statement of comprehensive income 50 14. Other current assets 64 4. Consolidated
TIKKURILA INSPIRES YOU TO COLOR YOUR LIFE. TM. Tikkurila's Interim Report for January September 2013 Record-high third quarter profitability 1 (30)
") Interim Report Q3 January September 2013 1 Tikkurila Oyj Interim Report November 7, 2013 at 9:00 a.m. (CET+1) Tikkurila's Interim Report for January September 2013 Record-high third quarter profitability
Interim Report Q3 January September 2013 1 Tikkurila Oyj Interim Report November 7, 2013 at 9:00 a.m. (CET+1) Tikkurila's Interim Report for January September 2013 Record-high third quarter profitability
CEVA Holdings LLC Quarter Two 2017
 CEVA Holdings LLC Quarter Two 2017 www.cevalogistics.com CEVA Holdings LLC Quarter Two, 2017 Interim Financial Statements Table of Contents Principal Activities... 2 Key Financial Results... 2 Operating
METSÄ BOARD CORPORATION INTERIM REPORT Q3/2015
 Page 1/29 METSÄ BOARD CORPORATION INTERIM REPORT Q3/2015 Page 2/29 METSÄ BOARD CORPORATION S OPERATING RESULT EXCLUDING NON-RECURRING ITEMS FOR JANUARY SEPTEMBER 2015 WAS EUR 144.8 MILLION RESULT FOR JANUARY
Func Food Group Financial Release / Q1 2018
 Func Food Group Financial Release / Q1 2018 Func Food Group Financial Release / Q1 2018 Func Food Group / Q1 2018 3 FUNC FOOD GROUP IN BRIEF Func Food Group ( FFG ) is a Nordic wellness company, which
Notes to the consolidated financial statements
 Notes to the consolidated financial statements Basic information on the company Elisa Corporation ( Elisa or the Group ) engages in telecommunications activities, providing data communications services
Func Food Group Financial Release / Q2 2018
 Func Food Group Financial Release / Q2 2018 Func Food Group Financial Release / Q2 2018 Func Food Group / Q2 2018 3 FUNC FOOD GROUP IN BRIEF Func Food Group ( FFG ) is a Nordic wellness company, which
Monetary figures in the financial statements are expressed in millions of euros unless otherwise stated.
 Notes to the consolidated financial statements General information Orion Corporation is a Finnish public limited liability company domiciled in Espoo, Finland, and registered at Orionintie 1, FI-02200
- JCDECAUX SA - COMMENTS ON THE TRANSITION TO IFRS AND FIGURES
 - JCDECAUX SA - COMMENTS ON THE TRANSITION TO IFRS AND FIGURES Pursuant to EC Regulation No. 1606/2002 and in accordance with IFRS 1 First-time Adoption of IFRS, the JCDecaux Group consolidated financial
OUTOKUMPU PUBLICATION OF LISTING PARTICULARS
 STOCK EXCHANGE RELEASE December 28, 2012 at 1.30 pm EET 1 (17) OUTOKUMPU PUBLICATION OF LISTING PARTICULARS announced earlier today on December 28, 2012 that it will issue 621 042 572 new shares in Outokumpu
Q1 Q Q3 Q EUR million Jan-Mar 2018 Jan-Mar 2017 Change, % EUR million Jan-Dec 2017
 Stockholm, Sweden, 4 May Eltel Group Interim report January March January March Group net sales decreased 10.5% to EUR 266.6 million (297.8), mainly as a result of divestments and on-going discontinuation
Q METSÄ BOARD CORPORATION INTERIM REPORT. Metsä Board Interim Report 1 January 30 September November 2014 at 12:00 noon Page 1 / 29
 Page 1 / 29 METSÄ BOARD CORPORATION INTERIM REPORT Q3 2014 Metsä Board is Europe s leading producer of folding boxboard, the world s leading manufacturer of coated white-top fresh forest fibre kraftliners
Zone de texte Condensed consolidated interim financial statements as of March 31, 2018
 Zone de texte Condensed consolidated interim financial statements as of March 31, 2018 Société anonyme with share capital of 1,516,715,885 Registered office: 13, boulevard du Fort de Vaux CS 60002 75017
Second Quarter Results 2013
 Second Quarter Results 2013 12 July 2013 ELISA STOCK EXCHANGE RELEASE 12 JULY 2013 AT 8:30am ELISA S INTERIM REPORT JANUARY - JUNE 2013 Second quarter 2013 PPO companies consolidated as of 1 May 2013 Revenue
Interim Report Polygon AB
 Interim Report Polygon AB January - March 2017 FIRST QUARTER 2017 Sales + 21% 132.8 million (109.4) Strong organic growth of 21% as a result of healthy backlog levels also fuelled by an increased share
DELETE GROUP OYJ, STOCK EXCHANGE RELEASE 7 November 2018 at 11:00 EET
 DELETE GROUP OYJ, STOCK EXCHANGE RELEASE 7 November 2018 at 11:00 EET NOT FOR RELEASE, PUBLICATION OR DISTRIBUTION, IN WHOLE OR IN PART, DIRECTLY OR INDIRECTLY, IN OR INTO ANY JURISDICTION IN WHICH THE
Amer Sports Interim Report January-September 2018
 1 (32) Amer Sports Corporation INTERIM REPORT October 25, at 1:00 p.m. Amer Sports Interim Report January-September NET SALES AND EBIT JULY-SEPTEMBER On 5 th September, as part of the strategy update,
Basware grew SaaS revenues by 99% and continued to invest in enablers for the 2018 strategy
 Interim Report 1 (24) BASWARE INTERIM REPORT JANUARY 1 - JUNE 30, 2016 (IFRS) SUMMARY Basware grew SaaS revenues by 99% and continued to invest in enablers for the 2018 strategy January-June 2016: - Net
ANNUAL REPORT HUSCOMPAGNIET A/S HUSCOMPAGNIET
 2017 ANNUAL REPORT HUSCOMPAGNIET A/S HUSCOMPAGNIET Consolidated key figures DKK'm Income statement Revenue Gross profit Operating profit before depreciation and amortisation
Annual Report 2015 dis
 dis Annual Report Index Business review of the full year 2015 3 Report of the Board of Directors 8 p. 2/93 Business Review of the Full Year 2015 Highlights Turnover increased 1% year on year. Turnover
Carve-out Financial Statements of Caverion Group for the years ended December 31, 2012, 2011 and 2010
 Carve-out Financial Statements of Caverion Group for the years ended December 31, 2012, 2011 and 2010 CONTENTS Combined income statement Combined statement of comprehensive income Combined balance sheet
INTERIM REPORT 5 NOVEMBER 2015
 Q3 INTERIM REPORT JANUARY SEPTEMBER 2015 5 NOVEMBER 2015 Contents 3 Summary 5 Third quarter 2015 in brief 6 Change in reporting practices as of 1 January 2016 7 Business areas 7 P&C insurance 10 Associated
CONDENSED CONSOLIDATED HALF-YEAR ACCOUNTS AS OF 31 DECEMBER 2016
 Eutelsat Communications Group Société anonyme with a capital of 232,774,635 euros Registered office: 70, rue Balard 75015 Paris 481 043 040 R.C.S. Paris CONDENSED CONSOLIDATED HALF-YEAR ACCOUNTS AS OF
Half-Year Financial Report
 Financial Year -2012 Half-Year Financial Report A. HALF-YEAR MANAGEMENT REPORT B. CONDENSED CONSOLIDATED FINANCIAL STATEMENTS C. REPORT FROM THE STATUTORY AUDITORS D. CERTIFICATE OF THE PERSON RESPONSIBLE
Interim Report January June 2018
 Interim Report January e APRIL JUNE > Net sales increased by 11 per cent to SEK 415.8 million (376.1). In USD terms, net sales increased by 14 per cent. > Order intake increased by 11 per cent to SEK 409.6
European Directories Group, European Directories Midco S.à r.l and European Directories BondCo S.C.A Interim report January-June August 2015
 European Directories Group, European Directories Midco S.à r.l and European Directories BondCo S.C.A Interim report January-June 31 August Interim report January-June (Comparative numbers in brackets)
Metsä Board Corporation s operating result for the first half of 2012 excluding nonrecurring items was EUR 24 million
 Metsä Board Corporation Interim Report 1 January 30 June 2012 Metsä Board Corporation s operating result for the first half of 2012 excluding nonrecurring items was EUR 24 million Result for the first
CONSOLIDATED FINANCIAL STATEMENTS DECEMBER 31, Direction de la CONSOLIDATION REPORTING GROUPE
 CONSOLIDATED FINANCIAL STATEMENTS DECEMBER 31, 2010 Direction de la CONSOLIDATION REPORTING GROUPE CONSOLIDATED BALANCE SHEET Notes Dec. 31, 2010 Dec. 31, 2009 ASSETS Goodwill (3) 11,030 10,740 Other intangible
Financial Statements
 Elenia Finance Oyj Financial Statements 1 January 2015-31 December 2015 Business ID 2584057-5 Unofficial translation from Finnish to English 1 Table of Content pages Elenia Finance Group, Report of the
Full year report BEWi Group AB (publ), org nr
, org nr") Full year report -12-31, org nr 556972-1128 Fourth quarter, October-December Net sales increased 27 % and amounted to 528,135 KSEK (416,512 KSEK). Adjusted for currency, net sales increased 24%. EBITDA
Full year report -12-31, org nr 556972-1128 Fourth quarter, October-December Net sales increased 27 % and amounted to 528,135 KSEK (416,512 KSEK). Adjusted for currency, net sales increased 24%. EBITDA
Interim report Q3, July September 2017 Stockholm, 25 October 2017
 Interim report Q3, July September Stockholm, 25 October As of the second quarter of, Cloetta Italia S.r.l. is accounted for as discontinued operation. The comparative figures in the consolidated profit
FINANCIAL STATEMENTS 2011
 FINANCIAL STATEMENTS 2011 Financial Statements 4 Group s IFRS Financial Statements 4 Consolidated Comprehensive Income Statement, IFRS 5 Consolidated Balance Sheet, IFRS 6 Statement of Changes in Equity,
Contents. Sampo Group Interim Report January September Contents. Summary 3
 Contents Contents Summary 3 THIRD quarter 2013 in brief 4 Business areas 5 P&C insurance 5 Associated company Nordea Bank Ab 8 Life insurance 10 Holding 12 Other developments 13 Personnel 13 Remuneration
BUSINESS REVIEW Q1/2018 / CRAMO PLC Q1
 BUSINESS REVIEW /2018 / CRAMO PLC 1 BUSINESS REVIEW /2018 / CRAMO PLC STRONG FIRST QUARTER FOR BOTH DIVISIONS - KBS INFRA INCLUDED FROM 1 ST OF MARCH JANUARY MARCH 2018 Sales EUR 175.3 (162.9) million,
CONDENSED CONSOLIDATED HALF-YEAR ACCOUNTS AS OF 31 DECEMBER 2017
 Eutelsat Communications Group Société anonyme with a capital of 232,774,635 euros Registered office: 70, rue Balard 75015 Paris 481 043 040 R.C.S. Paris CONDENSED CONSOLIDATED HALF-YEAR ACCOUNTS AS OF
Tikkurila's Interim Report for January September 2014 Solid profitability, weak economic situation puts pressure on revenue
 INTERIM REPORT Q3 JANUARY SEPTEMBER 2014 1 (28) Tikkurila Oyj Interim Report November 6, 2014 at 9:00 a.m. (CET+1) Tikkurila's Interim Report for January September 2014 Solid profitability, weak economic
Notes to the Consolidated Financial Statements
 Financials > Financial Statements > Notes to the Consolidated Financial Statements > The Group s accounting policies for the Consolidated Financial Statements Notes to the Consolidated Financial Statements
Portfolio acquisitions SEK 3.3 bn. Oct Dec 2013
 Year-end Report 2013 Gross cash collections SEK 1.6 bn Portfolio acquisitions SEK 3.3 bn EBIT margin 26% Capital adequacy ratio 11.62% Fourth quarter 2013 Full year 2013 Gross cash collections of SEK 519
Selecta Group B.V. and its subsidiaries, Amsterdam (The Netherlands)
") Selecta Group B.V. and its subsidiaries, Amsterdam (The Netherlands) Condensed consolidated interim financial statements for the 6 months ended 31 March 2018 (unaudited) Table of Contents Condensed consolidated
Selecta Group B.V. and its subsidiaries, Amsterdam (The Netherlands) Condensed consolidated interim financial statements for the 6 months ended 31 March 2018 (unaudited) Table of Contents Condensed consolidated
Interim Report for First Quarter 2015
 Interim Report for First Quarter First quarter The quarter began with weak order intake, which gradually improved. Order intake was 10 percent lower than in the strong first quarter of Sales volumes were
METSÄ BOARD CORPORATION HALF YEAR FINANCIAL REPORT JANUARY-JUNE 2016
 METSÄ BOARD CORPORATION HALF YEAR FINANCIAL REPORT JANUARY-JUNE 2016 Half year financial report 1 January 30 June 2016 4 August 2016 at 12:00 noon Page 1/30 METSÄ BOARD CORPORATION S OPERATING RESULT EXCLUDING
Basware expects its net sales and operating profit (EBIT) for 2015 to grow compared to 2014.
 for 2015 to grow compared to 2014.") Interim Report 1 (21) BASWARE INTERIM REPORT JANUARY 1 SEPTEMBER 30, 2015 (IFRS) SUMMARY Revenue developed favourably with key markets growing 95 percent January September 2015: - Net sales EUR 104 200
Interim Report 1 (21) BASWARE INTERIM REPORT JANUARY 1 SEPTEMBER 30, 2015 (IFRS) SUMMARY Revenue developed favourably with key markets growing 95 percent January September 2015: - Net sales EUR 104 200
Second Quarter INTERIM UNAUDITED Condensed Consolidated Financial Statements and Notes
 Second Quarter 2017 INTERIM UNAUDITED Condensed Consolidated Financial Statements and Notes August 1, 2017 CONSOLIDATED STATEMENT OF FINANCIAL POSITION Unaudited, (Canadian dollars in millions) 2017 December
1(16) Finnlines Plc, Stock Exchange Release, 27 February INTERIM REPORT JANUARY DECEMBER 2013 (unaudited) SUMMARY
 Finnlines Plc, Stock Exchange Release, 27 February INTERIM REPORT JANUARY DECEMBER 2013 (unaudited) SUMMARY") 1(16) Finnlines Plc, Stock Exchange Release, 27 February 2014 INTERIM REPORT JANUARY DECEMBER 2013 (unaudited) SUMMARY January December 2013 - Revenue EUR 563.6 million (EUR 609.3 million prev. year),
1(16) Finnlines Plc, Stock Exchange Release, 27 February 2014 INTERIM REPORT JANUARY DECEMBER 2013 (unaudited) SUMMARY January December 2013 - Revenue EUR 563.6 million (EUR 609.3 million prev. year),
BUSINESS REVIEW Q3/2018 / CRAMO PLC Q3
 BUSINESS REVIEW /2018 / CRAMO PLC 1 PROFITABLE GROWTH CONTINUED BUSINESS REVIEW /2018 / CRAMO PLC JULY SEPTEMBER 2018 Sales EUR 197.9 (191.9) million, up by 3.1%. In local currencies, sales grew by 7.5%.
Interim Report Jan June, 2017
 Interim Report Jan June, 217 Sundsvall, July 21, 217 JANUARY 1 JUNE 3, 217 (compared with the year-earlier period) During the period, shares in the discontinued operation Essity (the hygiene business)
CONSOLIDATED FINANCIAL STATEMENTS
 30.06.2017 CONSOLIDATED FINANCIAL STATEMENTS (Unaudited figures) 1. CONSOLIDATED FINANCIAL STATEMENTS......1 CONSOLIDATED BALANCE SHEET - ASSETS...1 CONSOLIDATED BALANCE SHEET - LIABILITIES.2 CONSOLIDATED
Zone de texte Condensed consolidated interim financial statements as of September 30, 2018
 Zone de texte Condensed consolidated interim financial statements as of September 30, 2018 Société Anonyme (corporation) with share capital of 1,519,944,495 Registered office: 13, boulevard du Fort de
Atria Plc Interim Report
 Atria Plc Interim Report 1 January 31 March 2017 1/17 INTERIM REPORT OF ATRIA PLC 1 JANUARY 31 MARCH 2017 Atria records growth in net sales in all business areas January March 2017 - Consolidated net sales
Jan-March Jan-March 12-months rolling. Jan-Dec SEK m
 Instalco Interim report January - March Continued healthy growth and good profitability January March Net sales increased by SEK 45.2 million to SEK 689 (474) million. Organic growth was 9.3 percent. Adjusted
Kamux Consolidated Financial Statements as of December 31, 2015, December 31, 2014 and December 31, 2013
 Kamux Consolidated Financial Statements as of December 31, 2015, December 31, 2014 and December 31, 2013 Kamux s (Company ID 2442327-8) business is based on the effective integrated business model in the
Interim Report, January March 2018 BEWi Group AB (publ), org nr
, org nr") Interim Report, January March, org nr 556972-1128 First Quarter, January March Net sales increased by 14% and amounted to KSEK 491,121 (430,981). Adjusted for currency exchange rates, net sales increased
Interim Report, January March, org nr 556972-1128 First Quarter, January March Net sales increased by 14% and amounted to KSEK 491,121 (430,981). Adjusted for currency exchange rates, net sales increased
Third Quarter INTERIM UNAUDITED Condensed Consolidated Financial Statements and Notes
 Third Quarter 2017 INTERIM UNAUDITED Condensed Consolidated Financial Statements and Notes October 25, 2017 CONSOLIDATED STATEMENT OF FINANCIAL POSITION Unaudited, (Canadian dollars in millions) 2017 December
Financial Statements Bulletin January-December 2014
 European Directories Group, European Directories Midco S.à r.l and European Directories Bondco S.C.A Financial Statements Bulletin January-December 27 February 2015 Financial Summary Financial Statements
Consolidated income statement
 Consolidated income statement For the year ended December 31 Net sales 4, 7 23 614 12 499 11 762 Cost of sales 8 (15 158) (6 963) (6 774) Gross profit 8 456 5 536 4 988 Research and development expenses
DEMOLITION SERVICES RECOVERY CONTINUED, INDUSTRIAL CLEANING PROFITABILITY SUPRESSED BY COLD WINTER
 DELETE GROUP OYJ, STOCK EXCHANGE RELEASE 31 May 2018 at 12:00 EET NOT FOR RELEASE, PUBLICATION OR DISTRIBUTION, IN WHOLE OR IN PART, DIRECTLY OR INDIRECTLY, IN OR INTO ANY JURISDICTION IN WHICH THE RELEASE,
Suominen Corporation Interim report 1 Jan 30 Jun July 2013
 Suominen Corporation Interim report 1 Jan 30 Jun 2013 17 July 2013 1 (20) Suominen Corporation Interim Report 17 July 2013 at 9:00am (EEST) SUOMINEN CORPORATION S INTERIM REPORT FOR JANUARY 1 JUNE 30,
JANUARY 1 MARCH 31, 2018
 JANUARY 1 MARCH 31, 2018 (compared with the corresponding period a year ago) Net sales increased 10.9% to SEK 28,020m (25,268) Organic net sales, which exclude exchange rate effects, acquisitions and divestments,
IFRS-compliant accounting principles
 IFRS-compliant accounting principles Since 1 January 2005, Uponor Corporation has prepared its consolidated financial statements in compliance with the following accounting principles: Main functions Uponor
CONSOLIDATED FINANCIAL STATEMENTS SIX MONTHS ENDED JUNE 30, Consolidation and Group Reporting Department
 CONSOLIDATED FINANCIAL STATEMENTS SIX MONTHS ENDED JUNE 30, 2012 Consolidation and Group Reporting Department CONSOLIDATED BALANCE SHEET Notes June 30, 2012 Dec. 31, 2011 ASSETS Goodwill (3) 11,281 11,041
INTERIM REPORT 1 JANUARY 31 MARCH 2015
 INTERIM REPORT 1 JANUARY 31 MARCH 2015 Quarterly period January-March, continuing Reported revenue, earnings, cash flow and financial ratios relate to continuing, and do not include Poolia UK. Revenue
January-September 2016
 January-September Third Quarter Like-for-like ( L/L ) RevPAR for leased and managed hotels was up by 5.3%. The growth is mainly due to an increase in average room rate. Revenue decreased by 3.9% to 251.3
SCANFIL GROUP S INTERIM REPORT 1 JANUARY 30 SEPTEMBER 2015
 SCANFIL GROUP S INTERIM REPORT 1 JANUARY 30 SEPTEMBER 2015 28 OCTOBER 2015 9.50 A.M. July September - Turnover totalled EUR 135.8 million (Q3 2014: 56.7), up to 140.0% - Operating profit EUR 5.2 million
Landmark transaction, strong results and significant loan repayments
 DDM HOLDING AG Corporate Registration Number: CHE-115906312 Interim Report Q3 1 July 30 September Landmark transaction, strong results and significant loan repayments Highlights third quarter Net collections
Interim Report January-June 2018
 Interim Report January-June The second quarter of the year had a strong sales development and Bong has continued to move its position forward on the European envelope market. The sales of light packaging
strong and steady performance continued
 H1 2018 strong and steady performance continued half year financial REPORT JANUARY june 2018 Ramirent Plc s Half year financial Report January-June 2018 Strong and steady performance continued APRIL JUNE
CONSOLIDATED FINANCIAL STATEMENTS. (Unaudited figures)
") 06.30.2014 CONSOLIDATED FINANCIAL STATEMENTS (Unaudited figures) CONTENTS Consolidated financial statements Consolidated balance sheet 1 Consolidated income statement 3 Statement of net income and unrealised
06.30.2014 CONSOLIDATED FINANCIAL STATEMENTS (Unaudited figures) CONTENTS Consolidated financial statements Consolidated balance sheet 1 Consolidated income statement 3 Statement of net income and unrealised
Tikkurila's Interim Report for January June 2014 Good profitability despite weak demand in Russia
 Interim report Q2 January June 2014 1 Tikkurila Oyj Interim Report July 25, 2014 at 9:00 a.m. (CET+1) Tikkurila's Interim Report for January June 2014 Good profitability despite weak demand in Russia April
JANUARY 1 DECEMBER 31, 2017
 JANUARY 1 DECEMBER 31, 2017 (compared with the corresponding period a year ago) Net sales increased 8.0% to SEK 109,265m (101,238) Operating profit before amortization of acquisition-related intangible
Interim Report For the period January March 2015 April 28, 2015
 Interim Report For the period January March 2015 April 28, 2015 January March 2015 Compared to January March Net operating profit improved by EUR 7.1 M to EUR 9.4 M (2.3). Profit for the period attributable
RECTICEL CONDENSED FINANCIAL STATEMENTS PER 30 JUNE 2017
 RECTICEL CONDENSED FINANCIAL STATEMENTS PER 30 JUNE 2017 TABLE OF CONTENTS I. CONSOLIDATED FINANCIAL STATEMENTS I.1. CONSOLIDATED INCOME STATEMENT I.2. EARNINGS PER SHARE I.3. CONSOLIDATED STATEMENT OF
CONSOLIDATED FINANCIAL STATEMENTS
 CONSOLIDATED BALANCE SHEET - ASSETS In thousands of euros Note 31/12/2016 31/12/2015 Goodwill 8 17 672 17 399 Intangible assets 9 19 166 17 088 Property, plant and equipment 10 58 789 56 210 Investment
TABLE OF CONTENTS. Financial Review 71
 TABLE OF CONTENTS Financial Review 71 Consolidated Financial Statements 74 Consolidated Income Statement for the Year Ended 31 December 74 Consolidated Statement of Comprehensive Income for the Year Ended
JOHN WOOD GROUP PLC GROUP FINANCIAL STATEMENTS. FOR THE YEAR TO 31st DECEMBER Company Registration Number SC 36219
 JOHN WOOD GROUP PLC GROUP FINANCIAL STATEMENTS FOR THE YEAR TO 31st DECEMBER 2017 Company Registration Number SC 36219 1 Consolidated income statement Pre- Exceptional Items Exceptional Items (note 4)
interim report January 1 March 31, 2011
 Q1 interim report January 1 March 31, 2011 Helsinki, May 5, 2011 Strong first-quarter performance: net sales and operating profit up First quarter 2011 in brief: - Net sales increased 11% to EUR 189.3
INTERIM REPORT FOURTH QUARTER 2017 PANDORA REPORTS 15% REVENUE GROWTH IN LOCAL CURRENCY FOR 2017 AND 37.3% EBITDA MARGIN
 PANDORA A/S Havneholmen 17-19 DK-1561 Copenhagen V Denmark Tel. +45 3672 0044 www.pandoragroup.com CVR: 28 50 51 16 No. 431 COMPANY ANNOUNCEMENT 6 February 2018 INTERIM REPORT FOURTH QUARTER 2017 PANDORA
financial statements 2017
 financial statements 2017 1. Consolidated balance sheet 60 18. Provisions 84 2. Consolidated income statement 61 19. Trade and other payables 87 3. Consolidated statement of comprehensive income 62 20.
Contents. Auditors report 35. Addresses 36. Definitions 37
 Annual Report 2012 Contents Five-year overview and Key figures 2 Administration report 4 Financial reports Income statement 6 Statement of comprehensive income 6 Balance sheet 7 Statement of changes in
Interim Report January - March 2015
 Interim Report January - March 2015 The period January - March 2015* Net sales increased by 23% in the period to SEK 1,848 (1,508) m. Adjusted EBITA improved by SEK 19 m, and amounted to SEK 100 (81) m.
Half year financial report
 Half year financial report Six-month period ended June 30, 2016 Condensed Consolidated Financial Statements Management Report CEO Attestation Statutory Auditors Review Report Table of contents Condensed
Func Food Group Financial Release / Q2 2017
 Func Food Group Financial Release / Q2 2017 Func Food Group Financial Release / Q2 2017 Func Food Group / Q2 2017 3 FUNC FOOD GROUP IN BRIEF Func Food Group ( FFG ) is a Nordic wellness company, which
PAO TMK Unaudited Interim Condensed Consolidated Financial Statements Three-month period ended March 31, 2018
 Unaudited Interim Condensed Consolidated Financial Statements Unaudited Interim Condensed Consolidated Financial Statements Contents Report on Review of Interim Financial Information...3 Unaudited Interim
Condensed Consolidated Financial Statements September 30, UNITYMEDIA KABELBW GMBH Aachener Strasse Cologne Germany
 Condensed Consolidated Financial Statements September 30, 2013 UNITYMEDIA KABELBW GMBH Aachener Strasse 746-750 50933 Cologne Germany TABLE OF CONTENTS Page Number CONDENSED CONSOLIDATED FINANCIAL STATEMENTS
1 January 31 december Year-End Report - Cabonline Group Holding
 1 January 31 december 2017 Year-End Report - Cabonline Group Holding October-December 2017 January-December 2017 Net sales amounted to SEK 1,560 million (1,531) EBITDA before non-recurring items amounted
Contents. Auditors report 35. Addresses 36
 Annual Report 2013 Contents five-year overview and Key figures 2 Administration report 4 Financial reports Income statement 6 Statement of comprehensive income 6 Balance sheet 7 Statement of changes in
Q1 FIRST QUARTER 2018
 Q1 FIRST QUARTER 2018 Summary In the first quarter 2018 B2Holding continued the positive operational development from 2017, and through the acquisition of NACC the Group expanded into France. The portfolio
CONSOLIDATED FINANCIAL STATEMENTS SIX MONTHS ENDED JUNE 30, 2008 GROUP CONSOLIDATION AND REPORTING
 CONSOLIDATED FINANCIAL STATEMENTS SIX MONTHS ENDED JUNE 30, 2008 GROUP CONSOLIDATION AND REPORTING CONSOLIDATED BALANCE SHEET in millions Notes June 30, 2008 Dec. 31, 2007 ASSETS Goodwill (3) 10,778 9,240
Solutions for a connected world
 Solutions for a connected world Interim Report 2016 WELCOME Temenos: the software specialist for banking and finance Who we are Founded in 1993, Temenos is the marketleading provider of mission critical
INTERIM REPORT Q XXL ASA HIGHLIGHTS. Q2 Growth
 INTERIM REPORT Q2 2014 XXL ASA HIGHLIGHTS Total revenues of NOK 1 246 million (NOK 945 million), up 32 per cent EBITDA increased by 47 per cent to NOK 184 million Successful opening in Finland One new
GEBERIT GROUP FINANCIAL REPORT 2018
 GEBERIT GROUP FINANCIAL REPORT 2018 FINANCIAL REPORT GEBERIT GROUP 2018 CONSOLIDATED BALANCE SHEETS Note 31.12.2018 31.12.2017 Assets Current assets Cash and cash equivalents 282.2 412.7 Trade accounts
PAO TMK Unaudited Interim Condensed Consolidated Financial Statements. Six-month period ended June 30, 2015
 Unaudited Interim Condensed Consolidated Financial Statements Six-month period ended June 30, 2015 Unaudited Interim Condensed Consolidated Financial Statements Six-month period ended June 30, 2015 Contents
Net interest-bearing debt at 30 September 2016 was DKK million (30 September 2015: DKK 476 million).
.") H+H International A/S Interim financial report Company Announcement No. 343, 2016 H+H International A/S Dampfærgevej 3, 3rd Floor 2100 Copenhagen Ø Denmark Tel. +45 35 27 02 00 info@hplush.com www.hplush.com
H+H International A/S Interim financial report Company Announcement No. 343, 2016 H+H International A/S Dampfærgevej 3, 3rd Floor 2100 Copenhagen Ø Denmark Tel. +45 35 27 02 00 info@hplush.com www.hplush.com
MARTINREA INTERNATIONAL INC. INTERIM CONDENSED CONSOLIDATED FINANCIAL STATEMENTS
 MARTINREA INTERNATIONAL INC. INTERIM CONDENSED CONSOLIDATED FINANCIAL STATEMENTS FOR THE THREE AND SIX MONTHS ENDED JUNE 30, 2014 Table of Contents Interim Condensed Consolidated Balance Sheets 1 Interim
Aston Martin Holdings (UK) Limited. Interim financial report. for the period ended 30 June 2018
 Limited. Interim financial report. for the period ended 30 June 2018") Interim financial report for the period ended 30 June 2018 Interim financial report for the period ended 30 June 2018 Pages Business review and outlook 1 Financial review - income statement 2 Financial
Interim financial report for the period ended 30 June 2018 Interim financial report for the period ended 30 June 2018 Pages Business review and outlook 1 Financial review - income statement 2 Financial
Selecta Group B.V. and its subsidiaries, Amsterdam (The Netherlands)
") Selecta Group B.V. and its subsidiaries, Amsterdam (The Netherlands) Condensed consolidated interim financial statements for the 9 months ended 30 June 2016 (unaudited) Table of Contents Operating and
Selecta Group B.V. and its subsidiaries, Amsterdam (The Netherlands) Condensed consolidated interim financial statements for the 9 months ended 30 June 2016 (unaudited) Table of Contents Operating and
Geberit Group Summary Report
 Geberit Group 2016 Summary Report Geberit abstains from printing in a full-length version of the annual report and makes the most of multimedia instead. Detailed information available anytime and anywhere
3Q 2017 Interim report July-September 2017
 Transformation in progress One-time charges hurting profitability Third quarter 2017 Order intake reached EUR 39.1 million (3Q16: 46.5), a decrease of 15.8% compared to previous year. Order book decreased