ODDO FORUM 10 & 11 January 2019
|
|
|
- Leonard Pope
- 5 years ago
- Views:
Transcription

1 ODDO FORUM 10 & 11 January
2 Disclaimer Before reading these presentation slides (the "Presentation"), you acknowledge that you are fully informed of the limitations and qualifications below: This document was prepared by Figeac Aéro (the "Company") exclusively for information purposes. The information and opinions contained in the document could be updated, complemented, revised, reviewed and amended, and this information could be substantially modified. The Company is not subject to any obligation to update the information contained in this document, and any opinions expressed therein can be amended without prior notice. The information contained in this document was not submitted for an independent review. No declaration, guarantee or commitment, express or implied, has been made and cannot be used as the basis of a claim pertaining to the exactitude, exhaustiveness or adequate nature of the information or opinions contained in this document. The Company, its council or its representatives accept no responsibility for the use of this document or its content, or in relation to this document in any way. This document contains information regarding the Company's markets, as well as its competitive positions, notably the size of its markets. The information it contains is drawn from a number of sources or from estimates made by the Company itself. Investors cannot base their investment decisions on this information. attention to the fact that the forward-looking statements do not constitute under any circumstance a guarantee of its future performances and that its actual financial position, results and cash flows, as well as changes in the sector in which the Company operates, might differ significantly from those proposed or suggested in the forward-looking statements contained in this document. Moreover, even if the Company's financial position, results and cash flows or the changes in the sector in which the Company operates were consistent with the forward-looking information contained in this document, said results or said changes might not be reliable indications of the Company's future results or changes. The Company does not commit in any way to updating or meeting the expectations or estimates of analysts, or to making public any correction or any forward-looking information in order to reflect an event or occurrence taking place after the date on which this document was published. This presentation does not represent an offer of sale or subscription, or a request for a purchase or subscription order for securities in France, the United States or any other country. Company shares or any other securities may be offered or sold in the United States only after they are registered under the 1933 US Securities Act, as amended, or under an exemption to this registration requirement. No public offering of financial securities will be made in France or abroad prior to the issuance of a prospectus visa by the French Financial Markets Authority pursuant to the provisions of Directive 2003/71/EC, as amended. The Company does not intend to make any kind of share offering in France or in another country. Some of the information contained in this document includes forward-looking statements. These statements are not guarantees as regards the future performance of the Company. This forwardlooking information relates to the Company's future outlook, to its evolution and to its commercial strategy, and is based on the analysis of forecasts of future results and estimations of amounts which cannot yet be determined. By its nature, forward-looking information entails risks and uncertainties because it relates to events and depends on circumstances which might or might not occur in the future. The Company draws your 2
3 FIGEAC AÉRO in brief A GROWING AND RESILIENT MARKET 37,400 aircraft (100+ seats) to be delivered over 20 years A KEY SUBCONTRACTOR with all the major customers POSITIONED ON THE MAIN PROGRAMES current and future PROVEN INDUSTRIAL EXCELLENCE AND BEST COSTS SITES major investments for maintaining competitive advantage PROFITABLE GROWTH SINCE THE IPO AAGR 1 23% OVER THE PAST 5 YEARS OPPORTUNITIES FOR THE FUTURE forerunner in Saudi Arabia and China 1 Average annual growth rate 3
4 H1 2018/2019 Key points
5 Highlights of H1 2018/2019 H1 2018/2019 revenue at 202 million up by 20% 1 Net income adjusted for unrealised currency impacts +71.4% 12.5 million TARGETS ACHIEVED Increase in corrected EBITDA margin to 19.9% 1 Clear improvement of FCF at million of which 33.1 million cash flow generated from operating activities 1 At constant scope and exchange rates 5
6 FCF positive at March 2019 millions Change in FCF March 13 March 19 0% -5% -10% -15% -20% -25% Much improved FCF at 30/09/18 of million compared with million at 30/09/ mars-13 mars-14 mars-15 mars-16 mars-17 mars-18 sept-18 FCF FCF/revenue Noteworthy effort on this financial indicator between 2017 and % 2019: positive and recurring FCF 6
7 2018/2019 Half-year results Financial statements have been approved by the Board of Directors meeting of 24 December 2018
8 H1 2018/2019: Highlights /$ Highly unfavourable exchange rates 4.7 million impact on revenue million on EBITDA Consolidation of TOFER 2.6 million impact on revenue million on EBITDA Free Cash Flows Industrial efforts Receivables Trade payables WCR improvement of 16.7 million Equal to 18 days of revenue 8
9 H1 2018/2019: growth and profitability Business growth Change in H1 Revenue - In millions H1 2018/2019 revenue up by 18.8% and by 20% at constant scope and exchange rates ,9 146, Negative impact of unfavourable change in the /$ rate: 4.7 million /$ Continuously growing profitability with a corrected EBITDA 1 margin at constant scope and exchange rates of 19.9% reaching 40.2 million and including a negative dollar impact of 2.7 million and a dilutive impact of TOFER of 0.8 million 1 Corrected EBITDA = recurring operating income + depreciation and amortisation + net provisions, before the breakdown of R&D expenses capitalised by the Group by type Change in H 1 corrected EBITDA - millions ,2 H1 2017/2018 H1 2018/2019 H1 2018/2019 at constant scope and exchange rates /$
10 /$ Hedging /$ Hedging /$1.185 /$ /$ /03/ /03/ /03/2021 Net exposure Hedge 2019, hedged at 100% 2020, hedged at 100% 2021, hedged at 52% 10
11 H1 2018/2019: investments for growth 36.4 million in net capex New machining process (aerostructure and engines) 2 new factory of the future machines Implementation of new ERP software Purchase of TOFER buildings Changes in factory workload Breakdown of investments in H1 2018/ % 6.8% 9.6% 34.8% Industrial plant & tooling R&D ERP project Change Business activities Current 3 months 6 months Aerostructures Machining and surface treatment General mechanics On-site assembly 33.4% Real estate Others Actual workload > 80% of capacity Actual workload between 60% and 80% of capacity 11
12 H1 2018/2019 Simplified income statement thousands IFRS 30/09/17 IFRS 15 30/09/18 IFRS 15 30/09/18 LFL 1 Change Revenue 2 169, , , % Corrected EBITDA 3 32,632 36,695 40, % Corrected EBITDA 2 /Revenue 19.2% 18.2% 19.9% +0.7 pt EBITDA 31,612 34,035 Corrected EBITDA /revenue 18.6% 16.8% Current operating income 15,761 16,990 20, % COI/revenue 9.3% 8.4% 10.1% +0.8 pt Other operating income Other operating expenses (322) (936) Operating income 14,955 17,179 Cost of net financial debt (2,347) (4,636) Foreign exchange gains and losses (6,916) (289) Unrealised gains and losses on fin. instr. 7,981 (387) Other financial income and expenses (29) (198) Income tax expense (1,023) (2,673) Net income adjusted for unrealised currency impact 7,301 10,187 12, % Net income 12,621 8,996 Net income (Group share) 12,620 9,168 EBITDA growth, which includes Dilutive effect of TOFER (- 0.8 million) Change in /$ hedging (- 2.7 million) Increase in net income corrected for unrealised impacts at constant scope and exchange rates of 71.4% 2017/2018 net income includes an unrealised gain (non cash) of 8 million compared with an unrealised loss of million over the half-year 1 At constant scope and exchange rates /2019 revenue is calculated at the average monthly /$ exchange rate of over the period, and 2017/2018 revenue is calculated at the average monthly /$ rate of over the period 3 Corrected EBITDA = recurring operating income + depreciation and amortisation + net provisions - Before the breakdown of R&D expenses capitalised by the Group by type 12
13 Financial structure million Gearing Gearing millions Change in net debt millions Net debt 31/03/2016 Change WCR 100 Net interest cash flow Other Net debt 31/03/ Mars Septembre Shareholder's equity Net debt 1 Gearing: net financial debt/shareholders' equity 13
14 H1 2018/2019 Simplified cash flow statement thousands, IFRS H1 2017/2018 H2 2017/2018 H1 2018/2019 Cash flow before borrowing costs and taxes 24,220 30,127 36,188 Change in working capital requirements (19,774) (2,256) (3,090) WCR expressed in days of revenue excl. VAT Net cash flow from operating activities 207 4, , ,098 Net cash flow from investing activities (28,761) (40,496) (36,383) FREE CASH FLOW (24,315) (9,626) (3,285) Capital increases and subsidies received - 6 Change in loans and repayable advances 3,106 91,333 60,067 Net cash flow from financing activities 3,106 91,339 60,067 Change in cash flows (21,207) 81,711 56,782 Net cash position (44,419) 37,165 94,135 Improvement in cash flow (before borrowing costs and taxes): +49.4% vs. 30/09/2017 Sharp drop in WCR of 16.7 million vs. 30/09/2017 in a context of growth Positive net cash flow from operating activities, up sharply to 33.1 million (vs million at 31/03/2018 and 4.4 million at 30/09/2017) FCF very clearly up at million 14
15 Simplified balance sheet thousands - IFRS 31/03/ /09/2018 Fixed assets 290, ,034 Other non-current assets(1) 50,191 39,610 Inventories 174, ,738 Trade receivables 95,565 94,662 Tax receivables 14,180 15,030 Other current assets 26,666 27,358 Cash and cash equivalents 107, ,792 TOTAL ASSETS 759, ,224 Shareholders' equity 200, ,617 Non-current financial liabilities 251, ,717 Non-current liabilities(2) 55,040 55,082 Short term borrowings 70,742 64,656 Current portion of financial liabilities 47,566 43,037 Trade payables and related accounts 81,165 88,548 Current liabilities(3) 53,402 49,567 TOTAL EQUITY AND LIABILITIES 759, ,224 (1) Equity investments + Deferred taxes + Financial instruments + Other financial assets + Other non-current assets + Assets on contract (2) Other provisions + Deferred taxes + Provision for retirement + Financial instruments + Other non-current liabilities + Non-current portion of deferred income + Liabilities on contract (3) Fiscal liabilities + Tax liabilities + Financial instruments + Other current liabilities + Derivative income. 15
16 Outlook and strategy
17 Strategy based on three main pillars millions - revenue at 31 March AAGR : +23% GROWTH PROFITABILITY CASH GENERATION EUROPEAN LEADER e SUSTAINABLE DEVELOPMENT 17

 Free Cash Flow strategy")


18 2023 targets double-digit growth Revenue million Change in growth of revenue 2020 Revenue million 2019 Revenue million 2023 Revenue million Variables that influence future growth 1) Free Cash Flow strategy initiated in Transfer of material purchases to customers - More selective commercial screening for new businesses (criteria: material portage/cycle/total WCR) 2) Variation of program ramp-up Positive and recurring FCF: from March ) External growth An attractive aerospace market with demanding valuations 1 Based on a /$ exchange rate of 1.18 and current capacity of manufacturers 18


19 On the road to the future Cooperation agreement in Saudi Arabia Anambitious collaborating partnership Leading partners: Al Salam Aerospace Ind., TASNEE and NICDP Development opportunities for an industrial production site A dedicated sales force Creation of a factory in China Joint Venture with capital of US$20 million (50% 1 co-ownership) Production of medium and large-sized machined aluminium parts A win-win industrial partnership Pooling of networks to capture shares in the offset and domestic market 19
20 Strong fundamentals H1 2018/2019 revenue at 202 million up by 20% 1 Net income adjusted for unrealised currency impacts +71.4% 12.5 million TARGETS ACHIEVED Increase in corrected EBITDA margin to 19.9% 1 Clear improvement of FCF at million of which 33.1 million cash flow generated from operating activities 1 At constant scope and exchange rates 20

21 Appendix
22 H1 2018/2019: 202 million in revenue Revenue by business line 1% Revenue by program Revenue by customer 5% 4% 6% 10% 34% 25% 21% 12% 4% 5% 5% 13% 21% 90% 10% 18% 16% Aerostructures Machining and surface treatment General engineering and forming activities On-site assembly A350 Other Airbus programs LEAP A320 Boeing programs Other aerostructure programs STELIA AIRBUS Safran group Spirit France LATECOERE Other engine programmes Other Other customers 22
23 IFRS 15 23


24 IFRS 15 INCOME STATEMENT 30/09/

25 IFRS 15 ASSETS 30/09/

26 IFRS 15 LIABILITIES 30/09/

27 IFRS 15 CASH FLOW STATEMENT 30/09/

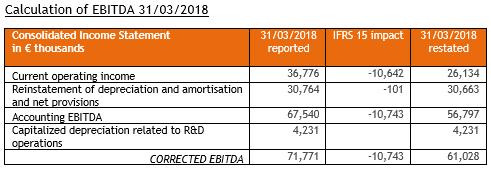
28 IFRS 15 INCOME STATEMENT 31/03/

29 IFRS 15 ASSETS 31/03/

30 IFRS 15 LIABILITIES 31/03/

31 IFRS 15 CASH FLOW STATEMENT 31/03/
32 Share Capital Treasury Shares Premium Consolidated reserves Conversion reserves Income Total attributable to Group s Sharehoders Non controlling interest Total shareholders equity IFRS 15 STATEMENT OF CHANGE IN SHAREHOLDER S EQUITY CONSOLIDATED STATEMENT OF CHANGE IN SHAREHOLDERS EQUITY in thousands Financial year ended March 2017 reported 3, ,455 56, , , ,310 IFRS 15 impact Financial year ended March 2017 restated 3, ,455 6, , , ,967 Share capital transaction Change in translation differences Impact of the application of IFRS Impact of the application of IAS Fair value of financial assets 15,285 15,285 15,285 Others Dividends Appropriate net income Y-1 32,545-32,545 0 Net income 12,621 12, ,622 Financial year ended September , ,455 54,920-1,116 12, , ,625 Financial year ended March 2018 restated 3,821-1, ,455 58,674-1,214 21, , ,247 Impact of the application of IFRS 15-8,522 8, Share capital transaction Change in translation differences Impact of the application of IAS Fair value of financial assets -8,615-8,615-8,615 Others Dividends 0 Appropriate net income Y-1 30,275-30,275 0 Net income 9,168 9, ,996 Financial year ended September ,821-1, ,455 71,735-2,036 9, , ,617 32


33 Positioning at the heart of the value chain ENGINE EQUIPMENT MANUFACTURERS MANUFACTURERS SUB-CONTRACTING SUB-ASSEMBLERS 33
 Source: company, based on 2018 revenue figures (Asco: 330m, Mecachrome: 330m")
34 In an expanding market Strong passenger-air-traffic demand FIGEAC AERO is a pure player in the aerospace industry, ranked No. 1 in Europe Production #1 in Europe 1 Presence in 6 countries 3,300 employees 3 main players in Europe 1 #1 #2 #3 (1) Source: company, based on 2018 revenue figures (Asco: 330m, Mecachrome: 330m Aeronautics) 37,400 aircraft (100+ seats) to be delivered over 20 years 34


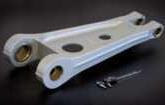
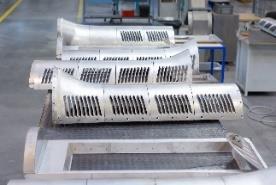
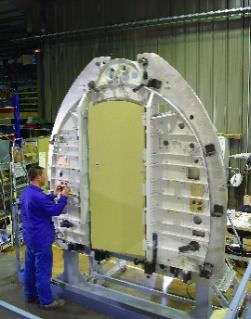

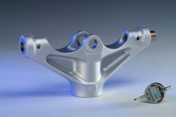
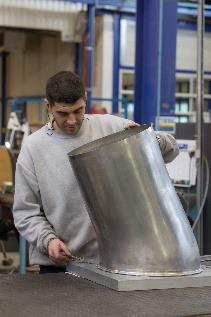
35 No. 1 in France and in Europe Structural parts Aluminium Hard metals Motors Parts Precision 26 mm 26 m Sheet metal parts Assembly 35
36 Zone industrielle de l Aiguille FIGEAC FRANCE Téléphone : +33 (0) Fax : +33 (0)
MIDCAP ZURICH 11 September 2018
 MIDCAP ZURICH 11 September 2018 1 Disclaimer Before reading these presentation slides (the "Presentation"), you acknowledge that you are fully informed of the limitations and qualifications below: This
ODDO FORUM JANUARY 2017
 ODDO FORUM JANUARY 2017 1 Disclaimer Before reading this presentation slides (the "Presentation"), you acknowledge that you are fully informed of the limitations and qualifications below: This document
2017/18 ANNUAL RESULTS APPROVED BY THE BOARD OF DIRECTORS AND CERTIFIED BY THE STATOTURY AUDITORS
 Figeac, August 7 th, 2018 ANNUAL RESULTS APPROVED BY THE BOARD OF DIRECTORS AND CERTIFIED BY THE STATOTURY AUDITORS The FIGEAC AÉRO Group (ticker: FGA), a leading partner of major aerospace industry companies,
2015/2016 ANNUAL RESULTS
 2015/2016 ANNUAL RESULTS 1 Disclaimer Before reading this presentation slides (the "Presentation"), you acknowledge that you are fully informed of the limitations and qualifications below: The Presentation
HALF-YEARLY RESULTS 30th June 2018
 HALF-YEARLY RESULTS 30 th June 2018 The LISI Group records an operating profit of 67.7 million and a positive Free Cash Flow of 34.5 million in the first half of 2018 Activity has declined compared to
Financial results & business update. Quarter and year ended 31 December February 2016
 Financial results & business update Quarter and year ended 31 December 2015 11 February 2016 Disclaimer 3 Any remarks that we may make about future expectations, plans and prospects for the company constitute
2017 Annual Results. Philippe Capron
 2017 Annual Results Philippe Capron Overall 2017 performance better than expected, marked by strong revenue growth Strong revenue growth: +4.9% at constant FX (+3.5% like-for-like): improvement in France
AIRBUS 9m Results 2018
 AIRBUS 9m Results 2018 31 October 2018 Harald Wilhelm Chief Financial Officer SAFE HARBOUR STATEMENT 2 DISCLAIMER This presentation includes forward-looking statements. Words such as anticipates, believes,
SAFRAN BERNARD DELPIT - GROUP CFO
 SAFRAN BERNARD DELPIT - GROUP CFO KEPLER CHEUVREUX AUTUMN CONFERENCE 2016 SEPTEMBER 14, 2016 Agenda Main drivers of Safran financial ambition for the 2016-2020 period H1 2016 highlights A resilient and
AIRBUS 9m Results 2017
 AIRBUS 9m Results 2017 31 October 2017 Harald Wilhelm Chief Financial Officer SAFE HARBOUR STATEMENT 2 DISCLAIMER This presentation includes forward-looking statements. Words such as anticipates, believes,
LISI REPORTS SIGNIFICANT IMPROVEMENT IN RESULTS FOR 2011
 Press release Belfort, February 16, 2012 LISI REPORTS SIGNIFICANT IMPROVEMENT IN RESULTS FOR 2011 Sales revenue increase 19.1% to 925 M Strong organic growth: +13.8% Dynamic performance from the Aerospace
AIRBUS Q1 Results 2017
 AIRBUS Q1 Results 2017 27 April 2017 Harald Wilhelm Chief Financial Officer SAFE HARBOUR STATEMENT 2 DISCLAIMER This presentation includes forward-looking statements. Words such as anticipates, believes,
Comments on the business review and on the consolidated financial statements 3
 2014 Annual results CONTENTS Key figures 1 1 Comments on the business review and on the consolidated financial statements 3 1.1. Business review 4 1.2. Results of operations 9 1.3. Financial structure
AIRBUS H1 Results 2018
 AIRBUS H1 Results 2018 26 July 2018 Tom Enders Chief Executive Officer Harald Wilhelm Chief Financial Officer SAFE HARBOUR STATEMENT 2 DISCLAIMER This presentation includes forward-looking statements.
REXEL. Q3 & 9-month 2009 results. November 12, 2009
 REXEL Q3 & 9-month 2009 results November 12, 2009 Q3 2009 & 9-month results Q3 and 9-month 2009 at a glance Financial review Outlook 3 Q3 & 9-month 2009 at a glance Q3 & 9-month 2009 highlights: Quarter-on-quarter
Financial results & business update
 Financial results & business update Quarter ended 31 March 2019 16 April 2019 Disclaimer Any remarks that we may make about future expectations, plans and prospects for the company constitute forward-looking
Safran: 6.8% revenue growth in third quarter 2014, driven by continued momentum in Propulsion Full-year 2014 outlook confirmed
 Safran: 6.8% growth in third quarter 2014, driven by continued momentum in Propulsion Full-year 2014 outlook confirmed All figures in this press release refer to Adjusted [1]. Comparisons are established
AIRBUS FY Results 2017
 AIRBUS FY Results 2017 15 February 2018 Tom Enders Chief Executive Officer Harald Wilhelm Chief Financial Officer SAFE HARBOUR STATEMENT 2 DISCLAIMER This presentation includes forward-looking statements.
FIRST-HALF 2017 EARNINGS
 FIRST-HALF 2017 EARNINGS Disclaimer > IMPORTANT ADDITIONAL INFORMATION This document is not intended to and does not constitute an offer to sell or the solicitation of an offer to subscribe for or buy
Airbus delivers Full-Year 2016 results in line with guidance
 (For its Full-Year financial reporting, Airbus has implemented the European Securities and Markets Authority s guidelines on Alternative Performance Measures. As a result, certain items will no longer
PRESENTATION OF 2017 ANNUAL RESULTS
 PRESENTATION OF 2017 ANNUAL RESULTS Paris, 19 February 2018 Delivering Transformation. Together. DISCLAIMER This presentation contains forward-looking information subject to certain risks and uncertainties
Sopra Group announces an excellent performance in 2011
 Press release Contacts Investor relations: Kathleen Clark Bracco +33 (0)1 40 67 29 61 kbraccoclark@sopragroup.com Press relations: Virginie Legoupil +33 (0)1 40 67 29 41 vlegoupil@sopragroup.com Image
Temenos announces very strong start to 2018 with Q1 total software licensing growth of 40%
 Temenos announces very strong start to 2018 with Q1 total software licensing growth of 40% GENEVA, Switzerland, 18 April 2018 Temenos Group AG (SIX: TEMN), the banking software company, today reports its
PLATFORMS FOR GROWTH
 PLATFORMS FOR GROWTH A n n u a l M e e t i n g o f S h a r e h o l d e r s Réal Raymond Chairman of the Board Agenda 1. Opening of the Meeting 2. Chairman and Secretary 3. Report of Scrutineers 4. Notice
Airbus Group Reports Half-Year (H1) 2016 Results
 2016 Results") Airbus Group Reports Half-Year () Results Robust and diversified commercial backlog supporting ramp-up financials driven by back-loaded aircraft delivery schedule Revenues 29 billion; EBIT* before one-off
Airbus Group Reports Half-Year () Results Robust and diversified commercial backlog supporting ramp-up financials driven by back-loaded aircraft delivery schedule Revenues 29 billion; EBIT* before one-off
AIRBUS GROUP 2016 CAPITAL MARKETS UPDATE
 AIRBUS GROUP 2016 CAPITAL MARKETS UPDATE LONDON, 24 FEBRUARY 2016 HARALD WILHELM Chief Financial Officer SAFE HARBOUR STATEMENT 2 DISCLAIMER This presentation includes forward-looking statements. Words
2014 ANNUAL RESULTS. DOMINIQUE LOUIS Chairman and Chief Executive Officer PHILIPPE CHEVALLIER Chief Financial Officer
 2014 ANNUAL RESULTS DOMINIQUE LOUIS Chairman and Chief Executive Officer PHILIPPE CHEVALLIER Chief Financial Officer 11 MARCH 2015 OVERVIEW PART 1 2014 Highlights PART 2 Results and Cash Flow PART 3 Strategy
1,633m 2013 Revenues 2013 ANNUAL RESULTS. 13 March ,427 Employees in % of Revenues for International in 2013
 1,633m 2013 Revenues 2013 ANNUAL RESULTS 13 March 2014 55% of Revenues for International in 2013 20,427 Employees in 2013 Disclaimer This presentation contains forward-looking statements (as defined in
Quarterly Financial Report. Q1 2014/15 FACC AG, Fischerstraße 9 A-4910 Ried im Innkreis. Pilot. Passion. Partnership.
 Quarterly Financial Report Q1 2014/15 FACC AG, Fischerstraße 9 A-4910 Ried im Innkreis Pilot. Passion. Partnership. facc With momentum into the future LADIES AND GENTLEMEN, The past few months have seen
AIRBUS Q1 Results 2018
 AIRBUS Q1 Results 2018 27 April 2018 Harald Wilhelm Chief Financial Officer SAFE HARBOUR STATEMENT 2 DISCLAIMER This presentation includes forward-looking statements. Words such as anticipates, believes,
9m Results Harald Wilhelm. Chief Financial Officer
 9m Results Harald Wilhelm Chief Financial Officer Safe Harbour Statement 2 DISCLAIMER This presentation includes forward-looking statements. Words such as anticipates, believes, estimates, expects, intends,
Temenos announces very strong Q3 results, full year guidance raised
 Temenos announces very strong Q3 results, full year guidance raised GENEVA, Switzerland, 17 October 2018 Temenos AG (SIX: TEMN), the banking software company, today reports its third quarter 2018 results.
IFRS INDIVIDUAL FINANCIAL STATEMENTS
 IFRS INDIVIDUAL FINANCIAL STATEMENTS 2017 IFRS individual financial statements at 31 December 2017 IFRS INDIVIDUAL FINANCIAL STATEMENTS AT 31 DECEMBER 2017 2 Income statement 2 Statement of comprehensive
Full-Year 2017 results: Airbus overachieved on all key performance indicators
 Full-Year results: Airbus overachieved on all key performance indicators Strong underlying business performance Revenues 67bn; EBIT Adjusted 4.3bn; EBIT (reported) 3.4bn; EPS (reported) 3.71 Proposed dividend
Airbus reports Nine-Month (9m) 2017 results
 2017 results") Airbus reports Nine-Month () results Revenues 43bn; EBIT Adjusted 1.8bn; EBIT (reported) 2.3bn; EPS (reported) 2.39 Commercial aircraft market healthy, robust backlog supports ramp-up plans Engine delays
Airbus reports Nine-Month () results Revenues 43bn; EBIT Adjusted 1.8bn; EBIT (reported) 2.3bn; EPS (reported) 2.39 Commercial aircraft market healthy, robust backlog supports ramp-up plans Engine delays
Airbus Group Reports Robust First Quarter 2015 Results
 Airbus Group Reports Robust First Quarter Results Solid operational performance supports EPS and cash flow, further enhanced by divestments Revenues 12.1 billion, EBIT* before one-off 651 million Earnings
LISI ANNOUNCES IMPROVED RESULTS FOR FIRST HALF OF 2008
 2008 HALF-YEAR REPORT LISI ANNOUNCES IMPROVED RESULTS FOR FIRST HALF OF 2008 Published sales revenues 449.7M, + 7% Sustained organic growth: + 11% Increase of 10% in EBIT Solid financial situation: gearing
H FINANCIAL RESULTS. August 30,
 August 30, 2017 1 Disclaimer This presentation contains both historical and forward-looking statements. These forward-looking statements are based on Carrefour management's current views and assumptions.
Latécoère 2018 results Strong progress towards Transformation 2020
 Regulated information embargoed until 7am CET on Wednesday 6, March 2019 Latécoère 2018 results Strong progress towards Transformation 2020 +3.1% revenue growth at constant exchange rates to 659.2 million,
Full Year 2008 Earnings
 Full Year 2008 Earnings Olivier Piou, CEO Jacques Tierny, CFO March 19, 2009 www.gemalto.com Disclaimer Forward-Looking Statements This communication contains certain statements that are neither reported
/ Ancenis, 30 July 2018 The board of directors of Manitou BF, meeting on this day, closed the accounts for the
 Manitou: 2018 Half-year results H1'18 net sales of 941m* up +17% vs. H1'17 and +18% on a comparable basis** Q2 machine order intake of 371m vs. 408m in Q2'17 H1 machine order intake of 926m vs. 842m in
2018, another strong year: double digit growth in sales and adj. 1 EBITDA 16.9% of adj. EBITDA margin, in line with guidance
 2018 Full Year Results Press Release Paris, March 21 st, 2019 2018, another strong year: double digit growth in sales and adj. 1 EBITDA 16.9% of adj. EBITDA margin, in line with guidance Double-digit sales
9m 2005 Earnings. Hans Peter Ring. Safe Harbor Statement. Place for. Date of presentation, place. Chief Financial Officer
 9m 2005 Earnings Hans Peter Ring Chief Financial Officer Place for Earnings conference call 9th November 2005 Date of presentation, place 1 Safe Harbor Statement Certain of the statements contained in
Income Statement. for the financial year ended 31 March 2011
 Income Statement for the financial year ended 31 March Continuing operations Revenue 5 1,220,183 1,141,964 Other income 6 3,776 2,350 Share of net loss of associate accounted for using the equity method
2010 Annual Results. February 10, 2011
 2010 Annual Results February 10, 2011 Disclaimer This presentation contains forward-looking statements. The use of the words "aim(s)," "expect(s)," "feel(s)," "will," "may," "believe(s)," "anticipate(s)"
17 February 2015 Amsterdam, the Netherlands. TNT announces 4Q & FY14 results, sets Outlook agenda and guidance for
 PRESS RELEASE 17 February 2015 Amsterdam, the Netherlands TNT announces 4Q & FY14 results, sets Outlook agenda and guidance for 2018-19 4Q14 results Reported revenues 1,787m (+1.6%), reported operating
FY 2016/2017 Results Presentation. ZODIAC AEROSPACE Monday 30 th October 2017
 FY 2016/2017 Results Presentation ZODIAC AEROSPACE Monday 30 th October 2017 Safe Harbour statement Certain statements contained in this document are forward-looking statements. These statements includes,
Airbus reports First Quarter (Q1) 2017 results
 2017 results") Airbus reports First Quarter () results Revenues 13bn; EBIT Adjusted 240m; EBIT (reported) 852m; EPS (reported) 0.79 financials reflect delivery phasing and divestments Strong commercial aircraft backlog
Airbus reports First Quarter () results Revenues 13bn; EBIT Adjusted 240m; EBIT (reported) 852m; EPS (reported) 0.79 financials reflect delivery phasing and divestments Strong commercial aircraft backlog
Quarter ended December 31, High Yield report
 Quarter ended December 31, 2013 High Yield report Key Highlights Quarterly Recurring EBITDA in line with guidance provided to markets and above market on revenue and booking growth showing the advantages
H1 Results Tom Enders. Harald Wilhelm. Chief Executive Officer. Chief Financial Officer
 H1 Results Tom Enders Chief Executive Officer Harald Wilhelm Chief Financial Officer Safe Harbour Statement 2 DISCLAIMER This presentation includes forward-looking statements. Words such as anticipates,
Financial results & business update. Quarter and year ended 31 December February 2017
 Financial results & business update Quarter and year ended 31 December 2016 14 February 2017 Disclaimer 3 Any remarks that we may make about future expectations, plans and prospects for the company constitute
2018 HALF-YEARLY RESULTS
 Toulouse, 5 September 2018 2018 HALF-YEARLY RESULTS 2018, a year of transition towards state-of-the-art manufacturing facilities Good Progress of Transformation 2020, in line with the Group s roadmap Results
2018 Full-year results
 Press release Full-year results Revenue up 6.9% to 4,095.3 million Organic growth of 4.9% over the full year, and 5.5% in the 4th quarter Operating margin on business activity of 7.5%, in line with the
Airbus Group Reports Solid 2015 Results, With Guidance Achieved
 Airbus Group Reports Solid Results, With Guidance Achieved Revenues up six percent to 64 billion; EBIT* before one-off 4.1 billion Earnings per share rise 15 percent to 3.43 Proposed dividend 1.30 per
2017 FULL YEAR RESULTS
 2017 FULL YEAR RESULTS Consolidated net sales: +5.0% Consolidated trading profit: +20.1% Underlying earnings per share: +13.4% In 2017, the Group reached its objective of a trading profit growth of 20%
2016 Financial and Operating Performance March 16, 2017
 2016 Financial and Operating Performance March 16, 2017 2016 Highlights Solid financial and operating results driven by traffic growth Net Revenue up 1.8% YoY to 865m 2016 underlying EBITDA (net of IPO
ROADSHOW POST-Q2 & H RESULTS. September 2016
 ROADSHOW POST-Q2 & H1 2016 RESULTS September 2016 1. COMPANY OVERVIEW Rexel at a glance : Strategic partner for suppliers and customers Energy Providers Suppliers Customers Endusers Economies of scale
2014 ANNUAL RESULTS PRESENTATION
 ANNUAL RESULTS PRESENTATION Paris, 19 March 2015 Delivering Transformation. Together. INTRODUCTION Pierre Pasquier - Chairman 2 AGENDA 1 Introduction 2 Performance in Steria scope Sopra scope Sopra Steria
Q results. July 28, Financial statements at June 30, 2010 were reviewed by the Supervisory Board held on July 27, 2010.
 Q2 2010 results July 28, 2010 Financial statements at June 30, 2010 were reviewed by the Supervisory Board held on July 27, 2010. 1. Q2 2010 at a glance Q2 2010 highlights Organic sales growth in Q2 (+2.3%)
HARALD WILHELM Chief Financial Officer AIRBUS GROUP Q1 RESULTS 2016
 HARALD WILHELM Chief Financial Officer AIRBUS GROUP Q1 RESULTS 2016 SAFE HARBOUR STATEMENT 2 DISCLAIMER This presentation includes forward-looking statements. Words such as anticipates, believes, estimates,
Comments on the business review and on the consolidated financial statements 3
 CONTENTS Key figures 1 1 Comments on the business review and on the consolidated financial statements 3 1.1. Business review 4 1.2. Results of operations 8 1.3. Financial structure and net debt 10 1.4.
First half 18 results. 29th November 2017
 First half 18 results 29th November 2017 Disclaimer This document was prepared by Soitec (the Company ) on November 29, 2017 in connection with the announcement of the first half of FY 18 results. This
* Excluding changes in scope (notably the one-month contribution of Zodiac Aerospace) and currency impacts
 and currency impacts") PRESS RELEASE Paris, April 25, 2018 Safran: Very strong Q1 2018 Adjusted Revenue increase of 12.0%, including the one-month contribution of Zodiac Organic* revenue growth of 10.2%, driven by OE and services
PRESS RELEASE Paris, April 25, 2018 Safran: Very strong Q1 2018 Adjusted Revenue increase of 12.0%, including the one-month contribution of Zodiac Organic* revenue growth of 10.2%, driven by OE and services
FOR IMMEDIATE RELEASE VIA THE CANADIAN CUSTOM DISCLOSURE NETWORK NEWS RELEASE MAGELLAN AEROSPACE CORPORATION ANNOUNCES FINANCIAL RESULTS
 FOR IMMEDIATE RELEASE VIA THE CANADIAN CUSTOM DISCLOSURE NETWORK NEWS RELEASE MAGELLAN AEROSPACE CORPORATION ANNOUNCES FINANCIAL RESULTS Toronto, Ontario August 11, 2016 Magellan Aerospace Corporation
PRESENTATION OF FIRST-HALF 2017 RESULTS
 PRESENTATION OF FIRST-HALF 2017 RESULTS Paris, 28 July 2017 Delivering Transformation. Together. DISCLAIMER This presentation contains forward-looking information subject to certain risks and uncertainties
Full-Year 2009 Results. Outlook
 Paris, 4 March 2010 Full-Year 2009 Results Tangible growth in attributable net profit (8.6%) and EPS (up 12.2%) Moderate 4.5% decline in trading profit (down 2.5% organic) Significant reduction in net
Q results : On-track for Year-End Profitability and Cash targets. Analysts conference call - Hans-Peter Ring, CFO November 14 th, 2002
 Q3 2002 results : On-track for Year-End Profitability and Cash targets Analysts conference call - Hans-Peter Ring, CFO November 14 th, 2002 1 Welcome from new CFO and new Head of IR Hans-Peter Ring EADS
AIRBUS FY Results 2016
 AIRBUS FY Results 2016 22 February 2017 Tom Enders Chief Executive Officer Harald Wilhelm Chief Financial Officer SAFE HARBOUR STATEMENT 2 DISCLAIMER This presentation includes forward-looking statements.
Excellent results for Alstom in the first half 2018/19
 PRESS RELEASE Excellent results for Alstom in the first half 2018/19 Strong commercial momentum with 7 billion orders, leading to a new record-breaking backlog of 38 billion Outstanding operational performance
Interim financial report for the six-month period ended 30 June 2016
 Interim financial report for the six-month period ended 30 June 2016 1 2 3 4 Summary HALF-YEAR 3 Key events in the first half of 2016 4 Business performance in the first half of 2016 5 Results for the
Sopra: 2013 annual results exceed targets
 Press Release Contacts Investor Relations: Kathleen Clark Bracco +33 (0)1 40 67 29 61 investors@sopragroup.com Sopra: 2013 annual results exceed targets Paris, 18 February 2014 At its meeting yesterday
Third Quarter 2017 Results: Europcar delivers strong revenue growth, notably in the leisure segment, and closes the acquisition of Buchbinder
 Note: This press release contains unaudited consolidated financial figures established under IFRS by Europcar Group s Management Board and reviewed by the Supervisory Board. Third Quarter 2017 Results:
RECTICEL FULL YEAR 2012 RESULTS
 RECTICEL FULL YEAR 2012 RESULTS Financial Analysts Meeting Brussels, 01 March 2013 Olivier Chapelle CEO Recticel Jean-Pierre Mellen CFO Recticel Michel De Smedt IRO Recticel 1 Highlights 2 FY2012 Consolidated
Quarter and year ended 31 December Financial results & business update
 Quarter and year ended 31 December 2014 Financial results & business update 10 February 2015 Disclaimer Any remarks that we may make about future expectations, plans and prospects for the company constitute
HALF YEAR 2010 ACTIVITY REPORT 2 RISK FACTORS 16 HALF YEAR 2010 FINANCIAL STATEMENTS 17. Foreword 17
 CONTENTS HALF YEAR 2010 ACTIVITY REPORT 2 1.1. First-half 2010 results 2 1.2. Business commentary 6 1.3. Restated full-year 2009 and half year 2009 income statements 8 1.4. Half year 2010 consolidated
Financial results & business update. Quarter ended 31 March April 2018
 Financial results & business update Quarter ended 31 March 2018 18 April 2018 Disclaimer 3 Any remarks that we may make about future expectations, plans and prospects for the company constitute forward-looking
Airbus reports Half-Year (H1) 2017 results
 2017 results") Airbus reports Half-Year () results Revenues 29bn; EBIT Adjusted 1.1bn; EBIT (reported) 1.8bn; EPS (reported) 1.94 Commercial aircraft environment healthy, robust backlog supports ramp-up plans financials
Airbus reports Half-Year () results Revenues 29bn; EBIT Adjusted 1.1bn; EBIT (reported) 1.8bn; EPS (reported) 1.94 Commercial aircraft environment healthy, robust backlog supports ramp-up plans financials
DESCRIPTION OF THE SHARE BUYBACK PROGRAMME
 Figeac, 16 April 2018 DESCRIPTION OF THE SHARE BUYBACK PROGRAMME FIGEAC AÉRO (ticker code: FGA) (the "Company"), a key partner for leading aerospace industry companies, has today published the description
FORWARD-LOOKING STATEMENTS
 INTRODUCTION TO HÉROUX-DEVTEK February 11, 2015 FORWARD-LOOKING STATEMENTS In the interest of providing shareholders and potential investors with information regarding Héroux-Devtek, including management
Order book at 30 September 1, , %
 Press release of 26 November 2015 FAIVELEY TRANSPORT ANNOUNCES ITS 2015/16 HALF-YEAR RESULTS: SALES GROWTH: 9.5% ADJUSTED GROUP OPERATING PROFIT (a) UP 9.5% SIGNIFICANT INCREASE IN FREE CASH FLOW ANNUAL
Airbus reports First Quarter (Q1) 2018 results, confirms guidance
 2018 results, confirms guidance") Airbus reports First Quarter () results, confirms guidance Backlog and commercial momentum support ramp-up plans financials reflect engine and aircraft delivery phasing Revenues 10 billion; EBIT Adjusted
Airbus reports First Quarter () results, confirms guidance Backlog and commercial momentum support ramp-up plans financials reflect engine and aircraft delivery phasing Revenues 10 billion; EBIT Adjusted
Investor presentation
 Investor presentation Important information Forward-Looking Statements and Risks & Uncertainties This document and the related oral presentation contain, and responses to questions following the presentation
Neopost Interim Results. October 2005
 Neopost 2005 Interim Results October 2005 3 October 2005 Disclaimer Safe Harbour Statement This presentation contains forward-looking statements (made pursuant to the safe harbour provisions of the Private
EADS: Rising to the challenge
 EADS: Rising to the challenge Pierre de Bausset Investor Relations and Financial Communication Jean-Baptiste Pons Corporate Finance & Treasury Barcelona 13th May 05 Page 1 EADS Highlights Global leader
AIRBUS GROUP H1 RESULTS 2016
 AIRBUS GROUP H1 RESULTS 2016 27 JULY 2016 TOM ENDERS Chief Executive Officer HARALD WILHELM Chief Financial Officer SAFE HARBOUR STATEMENT 2 DISCLAIMER This presentation includes forward-looking statements.
Airbus reports Half-Year 2018 (H1) financial results
 financial results") Airbus reports Half-Year () financial results Commercial aircraft environment robust, backlog underpins ramp-up plans financials reflect mainly A350 XWB performance and delivery phasing Revenues 25 billion;
Airbus reports Half-Year () financial results Commercial aircraft environment robust, backlog underpins ramp-up plans financials reflect mainly A350 XWB performance and delivery phasing Revenues 25 billion;
K E N D R I O N N. V. P R E S S R E L E A S E. 1 9 F e b r u a r y
 K E N D R I O N N. V. P R E S S R E L E A S E 1 9 F e b r u a r y 2 0 1 9 KENDRION MAINTAINS PROFITABILITY FOR THE YEAR DESPITE DIFFICULT AUTOMOTIVE MARKET - Full-year revenue declined by 3% to EUR 448.6
Investor roadshows May 2016
 Investor roadshows May 2016 Leading market positions Aerospace Defence Security #1 worldwide Turbofans for single aisle commercial aircraft (1) Helicopter turbines Landing gear, wheels and carbon brakes
2009 First Half-Year Results
 Press release 2009 First Half-Year Results Organic decrease of 16.4% in cable businesses in the first half but activity stabilized in the second quarter compared with the first Operating margin holding
Introduction Stephen Harris
 Introduction Stephen Harris Group Chief Executive 2 Agenda Highlights Business review Financial review Summary Outlook 3 Highlights Results 6.7% revenue growth at constant currency, 5.6% at actual rates
Analysts Meeting Q Bernard Charlès, President and CEO Thibault de Tersant, Senior EVP, CFO
 Analysts Meeting Q3 2015 Bernard Charlès, President and CEO Thibault de Tersant, Senior EVP, CFO 1 Forward Looking Information Statements herein that are not historical facts but express expectations or
KION GROUP AG Q Update Call. Gordon Riske (CEO), Anke Groth (CFO) Frankfurt, 26 July 2018
, Anke Groth (CFO) Frankfurt, 26 July 2018") KION GROUP AG Q2 Update Call Gordon Riske (CEO), Anke Groth (CFO) Frankfurt, 26 July Agenda 1. Highlights 2. Market Update 3. Financial Update 4. Outlook 2 KION GROUP AG Q2 Update Call 26 July Q2 Strategic
KION GROUP AG Q2 Update Call Gordon Riske (CEO), Anke Groth (CFO) Frankfurt, 26 July Agenda 1. Highlights 2. Market Update 3. Financial Update 4. Outlook 2 KION GROUP AG Q2 Update Call 26 July Q2 Strategic
Full Year 2009 Earnings
 Full Year 2009 Earnings Conference Call, 9th March 2010 Louis Gallois CEO Hans Peter Ring CFO Safe Harbour Statement 2 Disclaimer This presentation includes forward-looking statements. Words such as anticipates,
Airbus, Bombardier and Investissement Québec agree C Series Partnership closing effective July 1, 2018
 Airbus, Bombardier and Investissement Québec agree C Series Partnership closing effective July 1, 2018 Airbus to acquire majority stake in the C Series Aircraft Limited Partnership, effective July 1, 2018
ZEBRA TECHNOLOGIES FIRST QUARTER 2016 RESULTS May 10, 2016
 ZEBRA TECHNOLOGIES FIRST QUARTER 2016 RESULTS May 10, 2016 Anders Gustafsson Chief Executive Officer Mike Smiley Chief Financial Officer 2 Safe Harbor Statement Statements made in this presentation which
SAM ENGINEERING & EQUIPMENT (M) BERHAD
 BERHAD") SAM ENGINEERING & EQUIPMENT (M) BERHAD (Incorporated in Malaysia) UNAUDITED INTERIM FINANCIAL REPORT FOR QUARTER ENDED 30 SEPTEMBER 2016 CONTENTS Page CONDENSED CONSOLIDATED STATEMENT OF FINANCIAL POSITION
SAM ENGINEERING & EQUIPMENT (M) BERHAD (Incorporated in Malaysia) UNAUDITED INTERIM FINANCIAL REPORT FOR QUARTER ENDED 30 SEPTEMBER 2016 CONTENTS Page CONDENSED CONSOLIDATED STATEMENT OF FINANCIAL POSITION
RALLYE Annual Results. Increase in Rallye s 2014 activity driven by the organic growth of Casino s net sales
 Paris, February 17, 2015 RALLYE 2014 Annual Results Increase in Rallye s 2014 activity driven by the organic growth of Casino s net sales Decrease in Rallye s 2014 cost of net financial debt by 23m, to
Fourth quarter and full year 2017 results
 Fourth quarter and full year 207 results FINANCIAL AND OPERATIONAL HIGHLIGHTS Financial summary Q4 '7 Revenue of 220 million (Q4 '6: 266 million) Gross margin of 59% (Q4 '6: 58%) EBITDA of 37 million (Q4
AKKA FIRST-HALF 2017 RESULTS
 PRESS RELEASE / COMMUNIQUE DE PRESSE 26/09/2017 AKKA FIRST-HALF 2017 RESULTS Half-year revenue up 21% at 666.5 million Operating profit from ordinary activities up 32% at 41.5 million The German business
Second Quarter 2018 Earnings Conference Call
 Second Quarter 08 Earnings Conference Call July 4, 08 Forward Looking Statements The information contained in this presentation includes statements based on management s current expectations, estimates